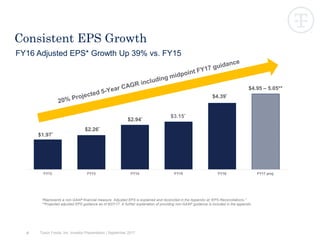
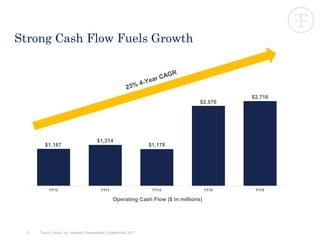
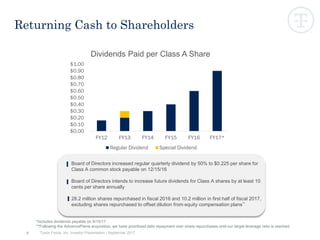
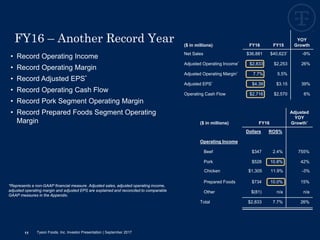
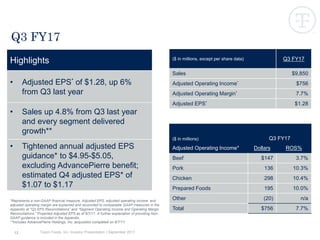
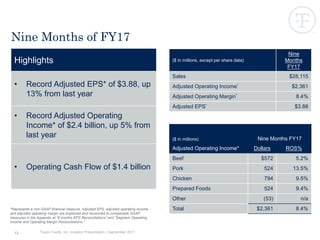
SlideShare a Scribd company logo
Grow. Deliver. Sustain.
Investor Presentation
September 2017
Tyson Foods, Inc. Investor Presentation | September 2017
Certain information contained in this presentation may constitute forward-looking statements, such as statements relating to
expected performance and including, but not limited to, statements appearing in the “Outlook” section and statements relating to
adjusted EPS guidance. These forward-looking statements are subject to a number of factors and uncertainties, which could cause
our actual results and experiences to differ materially from the anticipated results and expectations expressed in such forward-
looking statements. We wish to caution readers not to place undue reliance on any forward-looking statements, which speak only as
of the date made. Among the factors that may cause actual results and experiences to differ from anticipated results and
expectations expressed in such forward-looking statements are the following: (i) the effect of, or changes in, general economic
conditions; (ii) fluctuations in the cost and availability of inputs and raw materials, such as live cattle, live swine, feed grains
(including corn and soybean meal) and energy; (iii) market conditions for finished products, including competition from other global
and domestic food processors, supply and pricing of competing products and alternative proteins and demand for alternative
proteins; (iv) successful rationalization of existing facilities and operating efficiencies of the facilities; (v) risks associated with our
commodity purchasing activities; (vi) access to foreign markets together with foreign economic conditions, including currency
fluctuations, import/export restrictions and foreign politics; (vii) outbreak of a livestock disease (such as avian influenza ((AI)) or
bovine spongiform encephalopathy ((BSE))), which could have an adverse effect on livestock we own, the availability of livestock we
purchase, consumer perception of certain protein products or our ability to access certain domestic and foreign markets; (viii)
changes in availability and relative costs of labor and contract growers and our ability to maintain good relationships with employees,
labor unions, contract growers and independent producers providing us livestock; (ix) issues related to food safety, including costs
resulting from product recalls, regulatory compliance and any related claims or litigation; (x) changes in consumer preference and
diets and our ability to identify and react to consumer trends; (xi) significant marketing plan changes by large customers or loss of
one or more large customers; (xii) adverse results from litigation; (xiii) impacts on our operations caused by factors and forces
beyond our control, such as natural disasters, fire, bioterrorism, pandemics or extreme weather; (xiv) risks associated with leverage,
including cost increases due to rising interest rates or changes in debt ratings or outlook; (xv) compliance with and changes to
regulations and laws (both domestic and foreign), including changes in accounting standards, tax laws, environmental laws,
agricultural laws and occupational, health and safety laws; (xvi) our ability to make effective acquisitions or joint ventures and
successfully integrate newly acquired businesses into existing operations; (xvii) cyber incidents, security breaches or other
disruptions of our information technology systems; (xviii) effectiveness of advertising and marketing programs; and (xix) those factors
listed under Item 1A. “Risk Factors” included in our Annual Report filed on Form 10-K for the period ended October 1, 2016 and
subsequently filed Quarterly Reports on Form 10-Q and Current Reports on Form 8-K.
2
Forward-Looking Statements
3
Why Invest in TSN
• Our three-year (2014-2016) Total Shareholder Return far exceeds our peer set
• We’ve produced consistent earnings growth and returned cash to shareholders
through share repurchases and dividends; however, following the acquisition of
AdvancePierre, we have prioritized debt repayment over share repurchases until
our target leverage ratio is reached
• We occupy a unique position at the intersection of
Opportunity, Capability and Firepower
 Differentiated capabilities position us to capitalize on opportunities created by changing
consumer demand for fresh, protein packed foods
 We lead across channels, categories and eating occasions with a diverse product portfolio
 Our expertise spans from agriculture to dining culture with the ability to drive positive change
at unmatched scale
 Our solid business model and disciplined execution give us the firepower to capitalize on
opportunities
“We will grow, deliver results and sustain that growth over time.”
– President & CEO Tom HayesTyson Foods, Inc. Investor Presentation | September 2017
4
Strong Today, Leading for Tomorrow
Clear
Strategy
Strong
Financials
Future
Focused
Team
Unique
Position
Purpose
Driven
Tyson Foods, Inc. Investor Presentation | September 2017
169%
88%
68% 68% 64%
56%
49% 48% 46% 44% 44% 38%
23%
11%
-10%
-18%
*SOURCE: Bloomberg - This information should not be deemed to be “soliciting material” subject to regulation
14a or 14c or to the liabilities of Section 18 of the Securities Exchange Act of 1934
Driving Unmatched Shareholder Return
Among Peers
Total Shareholder Return* 2014-2016
HRL PPC CAG MKC SAFM MDLZ PEP GIS K CPB SJM ADM HSY
DF BG
Tyson Foods, Inc. Investor Presentation | September 20175
6
Consistent EPS Growth
FY12 FY13 FY14 FY15 FY16 FY17 proj.
$3.15*
$2.26*
$2.94*
$4.39*
$4.95 – 5.05**
$1.97*
*Represents a non-GAAP financial measure. Adjusted EPS is explained and reconciled in the Appendix at “EPS Reconciliations.”
**Projected adjusted EPS guidance as of 8/07/17. A further explanation of providing non-GAAP guidance is included in the appendix.
FY16 Adjusted EPS* Growth Up 39% vs. FY15
Tyson Foods, Inc. Investor Presentation | September 2017
7
Strong Cash Flow Fuels Growth
FY12 FY13 FY14 FY15 FY16
Operating Cash Flow ($ in millions)
$1,187
$1,314
$2,716
$2,570
$1,178
Tyson Foods, Inc. Investor Presentation | September 2017
8
Returning Cash to Shareholders
Board of Directors increased regular quarterly dividend by 50% to $0.225 per share for
Class A common stock payable on 12/15/16
Board of Directors intends to increase future dividends for Class A shares by at least 10
cents per share annually
28.2 million shares repurchased in fiscal 2016 and 10.2 million in first half of fiscal 2017,
excluding shares repurchased to offset dilution from equity compensation plans**
$0.00
$0.10
$0.20
$0.30
$0.40
$0.50
$0.60
$0.70
$0.80
$0.90
$1.00
FY12 FY13 FY14 FY15 FY16 FY17*
Dividends Paid per Class A Share
Regular Dividend Special Dividend
Tyson Foods, Inc. Investor Presentation | September 2017
*Includes dividends payable on 9/15/17
**Following the AdvancePierre acquisition, we have prioritized debt repayment over share repurchases until our target leverage ratio is reached
9
New
Brands
New
Geographies
New
Capabilities
IDEAL
A Simple Framework for M&A
Tyson Foods, Inc. Investor Presentation | September 2017
• Debt repayment
• Growing our businesses organically through operational efficiency and
capital expansion projects, along with investing in innovation and
brand building
• Acquiring businesses that support our strategic objectives
• Returning cash to shareholders through share repurchases and
dividends while maintaining plenty of liquidity and investment-grade
credit ratings and continuing to expand debt capacity
“Capital allocation priorities are governed by a disciplined focus on
driving long-term shareholder value.”
– Dennis Leatherby, CFO
10
Priorities for Cash
Tyson Foods, Inc. Investor Presentation | September 2017
• Record Operating Income
• Record Operating Margin
• Record Adjusted EPS*
• Record Operating Cash Flow
• Record Pork Segment Operating Margin
• Record Prepared Foods Segment Operating
Margin
11
FY16 – Another Record Year
*Represents a non-GAAP financial measure. Adjusted sales, adjusted operating income,
adjusted operating margin and adjusted EPS are explained and reconciled to comparable
GAAP measures in the Appendix.
($ in millions) FY16
Adjusted
YOY
Growth*
Dollars ROS%
Operating Income
Beef $347 2.4% 755%
Pork $528 10.8% 42%
Prepared Foods $734 10.0% 15%
Other $(81) n/a n/a
Total $2,833 7.7% 26%
($ in millions) FY16 FY15
YOY
Growth
Net Sales $36,881 $40,623* -9%
Adjusted Operating Income* $2,833 $2,253 26%
Adjusted Operating Margin* 7.7% 5.5%
Adjusted EPS* $4.39 $3.15 39%
Operating Cash Flow $2,716 $2,570 6%
Tyson Foods, Inc. Investor Presentation | September 2017
Chicken $1,305 11.9% -3%
Tyson Foods, Inc. Investor Presentation | September 201712
Q3 FY17
Highlights
• Adjusted EPS* of $1.28, up 6%
from Q3 last year
• Sales up 4.8% from Q3 last year
and every segment delivered
growth**
• Tightened annual adjusted EPS
guidance* to $4.95-$5.05,
excluding AdvancePierre benefit;
estimated Q4 adjusted EPS* of
$1.07 to $1.17
($ in millions, except per share data) Q3 FY17
Sales $9,850
Adjusted Operating Income* $756
Adjusted Operating Margin* 7.7%
Adjusted EPS* $1.28
($ in millions) Q3 FY17
Adjusted Operating Income* Dollars ROS%
Beef $147 3.7%
Pork 136 10.3%
Chicken 298 10.4%
Prepared Foods 195 10.0%
Other (20) n/a
Total $756 7.7%
*Represents a non-GAAP financial measure. Adjusted EPS, adjusted operating income and
adjusted operating margin are explained and reconciled to comparable GAAP measures in the
Appendix at “Q3 EPS Reconciliations” and “Segment Operating Income and Operating Margin
Reconciliations.” Projected Adjusted EPS as of 8/7/17. A further explanation of providing Non-
GAAP guidance is included in the Appendix.
**Includes AdvancePierre Holdings, Inc. acquisition completed on 6/7/17.
Tyson Foods, Inc. Investor Presentation | September 201713
Nine Months of FY17
($ in millions, except per share data)
Nine
Months
FY17
Sales $28,115
Adjusted Operating Income* $2,361
Adjusted Operating Margin* 8.4%
Adjusted EPS* $3.88
($ in millions) Nine Months FY17
Adjusted Operating Income* Dollars ROS%
Beef $572 5.2%
Pork 524 13.5%
Chicken 794 9.5%
Prepared Foods 524 9.4%
Other (53) n/a
Total $2,361 8.4%*Represents a non-GAAP financial measure. Adjusted EPS, adjusted operating income
and adjusted operating margin are explained and reconciled to comparable GAAP
measures in the Appendix at “9 months EPS Reconciliations” and “Segment Operating
Income and Operating Margin Reconciliations.”
Highlights
• Record Adjusted EPS* of $3.88, up
13% from last year
• Record Adjusted Operating
Income* of $2.4 billion, up 5% from
last year
• Operating Cash Flow of $1.4 billion
Tyson Foods, Inc. Investor Presentation | September 201714
FY17 Outlook
Adjusted EPS of
$4.95-5.05*
• ~13-15% growth over
FY16
• 5 year CAGR of ~20%
Sales of ~$38B
Expect AdvancePierre to
have an incremental impact
of approximately $550 million
CapEx of ~$1B
*Projected Adjusted EPS as of 8/7/17. Excludes impact of AdvancePierre, which is expected to be a few cents accretive in FY17 on an adjusted basis.
Represents a non-GAAP financial measure. A further explanation of providing non-GAAP guidance is included in the Appendix.
Tyson Foods, Inc. Investor Presentation | September 201715
FY17 Segment Outlook
Adjusted ROS%*
9 Months
Ending
FY17 Q4 Projection FY17 Outlook
Beef 5.2% ~4-5% ~5%
Pork 13.5% ~6-8% ~12%
Chicken 9.5% ~10-11% ~10%
Prepared Foods 9.4% ~7-8% ~9%
*Represents a non-GAAP financial measure. Historical operating margin is explained and reconciled to a comparable GAAP
measure in the Appendix at “Q3 EPS Reconciliations.”
Tyson Foods, Inc. Investor Presentation | September 201716
FY18 Outlook*
Sales of ~$41B**
Topline growth of ~6% as we grow volume
and have full year benefit of AdvancePierre
CapEx of ~$1B+
Beef Segment
operating margin
around 5%
Pork Segment
operating margin
above 6-8% normalized
range
Chicken Segment
operating margin
approximately 10% with
nearly 3% volume
growth
Prepared Foods
Segment operating
margin in the upper half
of 10-12% normalized
range with ~10%
volume growth,
excluding impact of
divestitures
*Does not include expected Other operating loss of approximately $70 million in fiscal 2018
**Includes incremental impact of AdvancePierre acquisition, partially offset by the sale of three non-protein businesses
Strategy for Growth
Raise the world’s
expectations for how
much good food can do
Our Purpose
18 Tyson Foods, Inc. Investor Presentation | September 2017
Sustainably feed the
world with the fastest
growing portfolio of
protein packed brands
Strategic
Intent
19 Tyson Foods, Inc. Investor Presentation | September 2017
20
Twin Engines of Growth
Sustainably
feed the
world with
the fastest
growing
portfolio of
protein
packed
brands
Growing our portfolio of
protein packed brands
Delivering sustainable
food at scale
Driving profitable growth with and for our
customers through differentiated capabilities
Creating fuel for reinvestment through a disciplined
financial fitness model
Critical
Enablers
Tyson Foods, Inc. Investor Presentation | September 2017
21
Value Creation Model
Share Repurchases
(after deleveraging)
Dividends
Capabilities to
drive profitable
growth
Financial
Fitness
Protein Packed
Brands
Total
Shareholder Return
Bold
commitment
to sustainable
food at scale
Annual
Value-Added
Volume Growth
+3%
High
Single
Digits
Annual
EPS Growth
Shared
Value
Tyson Foods, Inc. Investor Presentation | September 2017
Top
1/3
Peer Group
REDUCE waste across the
entire company through
Continuous Improvement
ALLOCATE financial and
human capital for growth
TRANSFORM our
business through technology
22
A New Approach to Efficiency Will Fund
Investments for Sustainable Growth
Tyson Foods, Inc. Investor Presentation | September 2017
23
Superior Results Through Defined Portfolio Roles
Branded & Value Added Commodity
Grow above industry
by investing in brand
building, innovation
and customer
development
Grow above industry
and expand margins
through customer
partnership,
differentiation and
competitive costs
RETAIL
FOODSERVICE
ALL-CHANNELS
Leverage throughput
and efficiency to
generate cash
Tyson Foods, Inc. Investor Presentation | September 2017
24
Proven Leadership Team Aligned with
Our Strategy
Team Elevates Focus on
CONSUMERS
CUSTOMERS
SUSTAINABILITY
TECHNOLOGY
Tyson Foods, Inc. Investor Presentation | September 2017
Tom Hayes
President & CEO
Leading the Way in Food
Sustainability
FORTUNE
No. 1 Most
Admired
Company
Food Production Industry
26 Tyson Foods, Inc. Investor Presentation | September 2017
27
Over Time Sustainability Investments
Will Fund Themselves
Sustainability
Investments Resources
Waste
Cost
Innovation
Volume
Profits
Tyson Foods, Inc. Investor Presentation | September 2017
28
Poultry Farm of the Future
Tyson Foods, Inc. Investor Presentation | September 2017
Barn Hatchery
Plant
29
Poultry Farm of the Future
Improves
Food
Safety
Improves
Animal
Welfare
Reduces
Greenhouse
Emissions
Reduces
Land
Use
Improves
Worker
Welfare
Tyson Foods, Inc. Investor Presentation | September 2017
30
Evidence-based Targets, Long-term Commitments
FOOD PEOPLE ANIMALS ENVIRONMENT
Convert chicken
supply chain to no
antibiotics ever
Reduce workplace
injuries by 15%
per year
3rd party audit of
farms to certify
humane treatment of
chickens
Working with partners
to set science-based
targets
Tyson Foods, Inc. Investor Presentation | September 2017
Retail Packaged Brands
32
Brand Portfolio for All Eating Occasions
Tyson Foods, Inc. Investor Presentation | September 2017
“Core 9” Advantaged Brands
in Advantaged Categories
Sources: IRI, Total US Multi-Outlet, data thru 8/6/17
Frozen
Prepared
Chicken
1 Hot Dogs
1 Branded Stacked
Bacon1
Corn Dogs
1 Super Premium
Smoked Sausage1Smoked
Sausage1 Branded
Lunchmeat2
Frozen Protein
Breakfast1 Breakfast
Sausage1
33 Tyson Foods, Inc. Investor Presentation | September 2017
Tyson is well positioned to capitalize on
growth in the fresh retail perimeter
GENERAL FOOD
DAIRY
FROZEN
CHECKOUT
RFG MEAT
BAKERY
PRODUCE
DELI
SEAFOOD
Source: IRI Syndicated databases, 52 wks ending 7/9/17, excluding Tyson Deli, which is based on
year-to-date internal shipment data as of 7/1/17
ALL OTHER RFG
BEVERAGE FRESH MEAT
Total Retail Food: +0.1%
Tyson Retail Food: +8.9%
Retail Department Volume Growth (%) vs. YA
indicates departments where Tyson has a significant presence
+9.2%
-1.2%Category +10.9%
+1.2%Category
+5.0%
+1.2%Category
+4.4%Category
-0.7%Category
-4.3%Category
+2.2%Category +7.8%+2.0%Category -0.9%Category
-0.6%Category +0.2%Category
Tyson Foods, Inc. Investor Presentation | September 201734
5.1% 4.7% 4.7%
-0.2% -0.3%
-2.9% -3.1% -3.2%
-4.6% -4.6%
-7.3%
-9.6%
Tyson Foods, Inc. Investor Presentation | September 2017
Source: IRI Total U.S. Multi-Outlet (x Costco) Volume Sales 52 weeks ending 8/06/2017
Product = Total Edible + Pet Food
35
Core 9 Total
Total
F&B
Core 9 and Total Tyson Leading
in CPG Volume Performance
Volume sales % change among top 10 branded food companies >$5B
3.6% 3.2%
2.1% 1.7%
0.5%
-0.6% -0.6%
-1.5%
-2.9%
-3.5%
-5.6%
-6.3%
Source: IRI Total U.S. Multi-Outlet (x Costco) Dollar Sales 52 weeks ending 8/06/2017
Product = Total Edible + Pet Food
36
Core 9 Total
Total
F&B
Tyson Foods, Inc. Investor Presentation | September 2017
Core 9 and Total Tyson Leading
in CPG Dollar Performance
Dollar sales % change among top 10 branded food companies >$5B
#2 in Frozen Food
Tyson Foods leads in the growing
categories of frozen poultry and
protein breakfast
Source: IRI U.S. Multi-Outlet frozen category sales, 52 weeks ending 8/6/17
$7.1
$3.5
$2.9
$2.3
$2.1
$1.9
$1.3 $1.2 $1.1
Sales in Billions
37 Tyson Foods, Inc. Investor Presentation | September 2017
#7 in Total U.S. CPG Retail Food Sales
Among branded food companies >$5B
Source: IRI Total U.S. Multi-Outlet Sales, 52 weeks ending 8/6/17
$25.8
$21.2
$16.5
$11.7
$8.5 $7.8 $7.7 $7.5
$6.4 $6.3 $5.8 $5.8 $5.3 $5.0
Sales in Billions
In addition to retail, Tyson Foods
is a leading supplier to the
foodservice industry
38 Tyson Foods, Inc. Investor Presentation | September 2017
39
Opportunity in Current Spaces
Tyson Foods, Inc. Investor Presentation | September 2017
SOURCE: IRI a) National Consumer Panel for 52 weeks ending 8/6/17 b)Total US Multi-Outlet for 52 weeks ending 8/6/17
*Within branded stacked bacon
**Within super-premium smoked sausage
97%
87%
79% 75%
62% 63% 63%
52%
38%
21%
78%
30%
7%
30% 26% 28%
6%
33%
24%
10%
Total Core 9 Lunchmeat Bacon Hot Dogs
Breakfast
Sausage
Smoked
Sausage
Smoked
Sausage
Frozen Prepared
Chicken
Frozen Protein
Breakfast
Frozen Corn
Dogs
Category HH Penetration Brand HH Penetration
Branded $
Share
Position
#2 #1* #1 #1 #1 #1** #1 #1#1
Innovation
41
Innovation Performance
insights
innovation
research &
development
Retail Packaged Brands
innovation vitality growing
FY16
14%
FY15
12.5%
% of sales dollars from Retail Packaged Brands
products created in the previous three years
Tyson Foods, Inc. Investor Presentation | September 2017
Tyson Foods, Inc. Investor Presentation | September 201742
Innovation Platforms
Fresh
Meal Kits
& Starters
Fresh
Take on
Breakfast
Keeping
Core 9
Fresh
Tyson Foods, Inc. Investor Presentation | September 2017
Innovation – Recent Product Launches
43
AdvancePierre
Acquisition
45
Logical Next Step in Strategy
Expands prepared
foods offering; joins
complementary
market-leading
portfolios
• Expands Tyson’s prepared foods offerings with AdvancePierre’s portfolio of ready-to-eat lunch
and dinner sandwiches, sandwich components, entrees, and snacks
• Broadens Tyson’s competitive position across poultry, beef and pork
• Improves competitiveness and sustainable long-term growth through increased scale and
refined portfolio of prepared foods and protein-packed brands
• Also planning to divest existing Tyson non-protein branded assets to sharpen strategic focus
Valuable addition to
current distribution
and sales footprint
• Represents natural extension of our supply chain – Tyson’s beef and pork businesses are able
to provide many of AdvancePierre’s raw material components
• Increases Tyson’s exposure to the convenience distribution channel
• Accelerates growth of AdvancePierre’s brands by leveraging Tyson’s existing infrastructure
and distribution channel
Enhances Tyson’s
financial profile
• Immediately accretive to Tyson’s EPS on both a GAAP and cash basis
• Net debt to adjusted EBITDA ratio of 2.7x* on a proforma basis including AdvancePierre’s
results for a full 12 months
• Significant and achievable annual net synergies in excess of $200 million within three years
AdvancePierre’s
recent growth has
outpaced category
growth
• Significant growth across all operating segments
− Foodservice: well-positioned in growing and resilient industry
− Retail: leading provider of customer brands with significant growth opportunity
− Convenience: fastest growing segment, with consistent growth since 2012
Strong cultural fit
• Shared goals; sustainable, holistic solutions to food manufacturing and long-term growth
• Provides stability and opportunities for employees, customers, and shareholders
*Represents a non-GAAP financial measure. Pro forma net debt to adjusted EBITDA ratio is explained and reconciled to comparable GAAP measure in the Appendix.
Tyson Foods, Inc. Investor Presentation | September 2017
46
Complementary Portfolios of Strong Brands
Tyson Foods, Inc. Investor Presentation | September 2017
47
Strong Today and Leading for Tomorrow
Natural extension of our
supply chain
Consolidated
manufacturing footprint
Enhanced distribution
channels
Reaching a broader cross-
section of consumers
Leading supplier to national and
regional convenience stores and
vending providers
Leading foodservice brands with
high operator/distributor loyalty
NEW BRANDS, NEW CAPABILITIES, NEW GEOGRAPHIES
Tyson Foods, Inc. Investor Presentation | September 2017
CREATES SIGNIFICANT SYNERGIES
• Expected to result in net cost synergies in excess of $200 million to be fully realized
within three years
• Cost synergies created by consolidated manufacturing footprint, lower input pricing,
and addressing redundant foodservice and retail distribution channels, redundant
sales and marketing functions and duplicative corporate overhead
• Revenue synergies expected over time by utilizing Tyson’s sales and distribution
platform to drive growth across AdvancePierre’s leading sandwich/snack brands
ENHANCES BALANCE SHEET
• Expected to be immediately accretive to Tyson’s EPS on both a GAAP and a cash
basis, excluding one-time costs
• Net debt to adjusted EBITDA ratio of 2.7x* on a proforma basis; will be reduced
steadily by strong cash flow and support investment grade profile
48
Driving Financial Results
*Represents a non-GAAP financial measure. Pro forma net debt to adjusted EBITDA ratio is explained and reconciled to comparable GAAP measure in the Appendix.
Tyson Foods, Inc. Investor Presentation | September 2017
49
Tyson and AdvancePierre Combine
to Create Long-Term Value
Next step in growth strategy and opportunity to refine the shape of our
portfolio
Financially compelling; expected to be immediately accretive to Tyson EPS
based on net cost synergies exceeding $200 million.
Significant ongoing benefits to Tyson shareholders and both companies’
customers and employees
Complementary, market-leading products and brands
Natural extension of supply chain and sales footprint, including fast-growing
convenience distribution channel
Contributing to our mission to sustainably feed the world with the fastest
growing portfolio of protein-packed brands
Tyson Foods, Inc. Investor Presentation | September 2017
Additional Information
51 Tyson Foods, Inc. Investor Presentation | September 2017
As of 2016 fiscal year end.
52
Leading U.S. Protein Producers
U.S. Chicken Producers
Source: Watt Poultry USA, March 2016;
based on ready-to-cook pounds
U.S. Fed Beef Packers
Source: Cattle Buyers Weekly, 2016;
based on maximum U.S. slaughter
capacity (head per day)
U.S. Pork Packers
Source: EMI Analytics and National Hog
Farmer, June 2016, as reported in
National Pork Board Quick Facts; based
on estimated U.S. slaughter capacity
(head per day)
Other
29%
Tyson Foods
21%
Pilgrim’s Pride
17%
Sanderson
Farms 8%Perdue
Farms 7%
Other
47%
Tyson Foods
24%
JBS USA
22%
Cargill
19%
National Beef
10%
Other 25%
Tyson Foods
18%
Smithfield
25%
JBS USA
20%
Hormel
8%
Tyson Foods, Inc. Investor Presentation | September 2017
53
FY16 Sales − $37 Billion
Sales by
Segment
Sales by
Distribution Channel
Prepared
Foods
20%
Chicken
30%
Other
1%
Consumer
Products
53%Food
Service
32%
International
11%
Other
4%
Beef 38%
Pork
11%
Tyson Foods, Inc. Investor Presentation | September 2017
54
FY16 International Sales
$4.1 Billion*
*Includes exports and in-country production
Japan
17%
Mexico
15%
China &
Hong Kong
21%
South
Korea
7%
Canada
6%
Other
30%
Taiwan
4%
Tyson Foods, Inc. Investor Presentation | September 2017
55
FY16 International Sales
Chicken
$1.2 Billion*
Beef
$2.0 Billion
Brazil
6%
Mexico 11%
Japan
18%
Mexico
12%
South
Korea
12%
Canada
4%
Canada
3%
Other
48%
China & Hong
Kong
23%
Other
17%
India
6%
Guatemala
3%
China &
Hong Kong
24%
Taiwan 7%
Italy 6%
Tyson Foods, Inc. Investor Presentation | September 2017
*Includes exports and in-country production
56
FY16 International Sales
Pork
$848 million
Prepared Foods
$87 million
Japan
37%
Mexico
24%
South
Korea
4%
Canada
30%
Mexico
22%
S. Korea
11%
Japan
5%
Canada
12%
Other
12%
China &
H.K. 11%
Other
32%
Tyson Foods, Inc. Investor Presentation | September 2017
Optimize cost structure Change pricing structure Upgrade value-added
products
Buy vs. Grow strategy Deliver high quality
products and customer
service
57
Chicken Segment
The Road to Higher,
More Stable Margins
Tyson Foods, Inc. Investor Presentation | September 2017
• FY15 – $322 million realized
• FY16 – $580 million realized
• FY17 – expecting approximately $675 million
• Expect to achieve at least $700 million in total synergies.
Due to the timing of certain projects, some synergies will fall
into fiscal 2018.
• Synergy Categories
 Prepared Foods Improvements
 Procurement
 Manufacturing & Logistics
 Organizational & Fiduciary
58
HSH Synergies
Tyson Foods, Inc. Investor Presentation | September 2017
Proforma Debt Maturity Profile
As of 7/1/17
Fiscal Year Maturities ($MM)
0
250
500
750
1,000
1,250
1,500
1,750
2,000
2,250
'17 '18 '19 '20 '21 '22 '23 '24 '27 '33 '34 '44 '47
TFI Bonds Hillshire Bonds Term Loans Commercial Paper
Pre-Payable
Pre-Payable
• Term loans are pre-payable at par
• Excludes $18MM Tangible Equity Units amortizing note, $18MM TFI senior note due 2028, and $26MM other
miscellaneous debt (e.g. capital leases, foreign debt, discount on senior notes and unamortized debt issuance costs)
• $1.5 billion Revolver credit facility matures FY22; outstanding balance as of 7/1/17 was $0.
• Proforma adjustments include:
• 8/18/17 maturity extension of $500M tranche B term loan from April 2019 to August 2020; and
• 8/23/17 issuance of $900M TFI bonds used for repayment of amounts outstanding under the term loan tranche
due June 2020
Tyson Foods, Inc. Investor Presentation | September 201759
Appendix
61
Q3 and Nine Months EPS Reconciliations
In millions, except per share data
(Unaudited)
Tyson Foods, Inc. Investor Presentation | September 2017
Third Quarter Nine Months Ended
Pretax Impact EPS Impact Pretax Impact EPS Impact
2017 2016 2017 2016 2017 2016 2017 2016
Reported net income per share attributable to Tyson $ 1.21 $ 1.25 $ 3.72 $ 3.50
Add: AdvancePierre purchase accounting and acquisition related costs (a) $ 77 $ - 0.14 - $ 77 $ - 0.14 -
Add: San Diego Prepared Foods operation impairment $ - $ - - - $ 52 $ - 0.09 -
Less: Tax benefit related to expected sale of a non-protein business $ - $ - (0.07) - $ - $ - (0.07) -
Less: Recognition of previously unrecognized tax benefit $ - $ - - (0.04) $ - $ - - (0.07)
Adjusted net income per share attributable to Tyson $ 1.28 $ 1.21 $ 3.88 $ 3.43
(a) AdvancePierre purchase accounting and acquisition related costs impacting operating income includes a $24 million purchase accounting adjustment for the fair
value step-up of inventory and $35 million of acquisition related costs and $18 million of acquisition bridge financing fees.
Adjusted net income per share attributable to Tyson (adjusted EPS) is presented as a supplementary measure of our financial performance that is not required by, or
presented in accordance with, GAAP. We use adjusted EPS as an internal performance measurement and as one criterion for evaluating our performance relative to that
of our peers. We believe adjusted EPS is meaningful to our investors to enhance their understanding of our financial performance and is frequently used by securities
analysts, investors and other interested parties to compare our performance with the performance of other companies that report adjusted EPS. Further, we believe that
adjusted EPS is a useful measure because it improves comparability of results of operations from period to period. Adjusted EPS should not be considered as a
substitute for net income per share attributable to Tyson or any other measure of financial performance reported in accordance with GAAP. Investors should rely primarily
on our GAAP results and use non-GAAP financial measures only supplementally in making investment decisions. Our calculation of adjusted EPS may not be
comparable to similarly titled measures reported by other companies.
Adjusted net income per share attributable to Tyson guidance is provided in this presentation on a non-GAAP basis. The Company is not able to reconcile its full-year
fiscal 2017 Adjusted EPS guidance to its full-year fiscal 2017 projected GAAP guidance because certain information necessary to calculate such measure on a GAAP
basis is unavailable or dependent on the timing of future events outside of our control. Therefore, because of the uncertainty and variability of the nature of the amount of
future adjustments, which could be significant, the Company is unable to provide a reconciliation of this measure without unreasonable effort.
62
Segment Operating Income and
Operating Margin Reconciliations
In millions
(Unaudited)
Tyson Foods, Inc. Investor Presentation | September 2017
Adjusted Segment Operating Income (Loss)
(for three months ended July 1, 2017)
Beef Pork Chicken Prepared Foods Other Intersegment Sales Total
Sales $ 4,000 $ 1,322 $ 2,870 $ 1,944 $ 85 $ (371) $ 9,850
Reported operating income (loss) 147 136 294 174 (54) - 697
Add: AdvancePierre purchase accounting and acquisition related costs
(a) - - 4 21 34 - 59
Adjusted operating income (loss) $ 147 $ 136 $ 298 $ 195 $ (20) $ - $ 756
Reported operating margin % 3.7% 10.3% 10.2% 9.0% n/a n/a 7.1%
Adjusted operating margin % 3.7% 10.3% 10.4% 10.0% n/a n/a 7.7%
Adjusted Segment Operating Income (Loss)
(for nine months ended July 1, 2017)
Beef Pork Chicken Prepared Foods Other Intersegment Sales Total
Sales $ 11,015 $ 3,876 $ 8,374 $ 5,590 $ 257 $ (997) $ 28,115
Reported operating income (loss) 572 524 790 451 (87) - 2,250
Add: AdvancePierre purchase accounting and acquisition related costs
(a) - - 4 21 34 - 59
Add: San Diego Prepared Foods operation impairment - - - 52 - - 52
Adjusted operating income (loss) $ 572 $ 524 $ 794 $ 524 $ (53) $ - $ 2,361
Reported operating margin % 5.2% 13.5% 9.4% 8.1% n/a n/a 8.0%
Adjusted operating margin % 5.2% 13.5% 9.5% 9.4% n/a n/a 8.4%
(a) AdvancePierre purchase accounting and acquisition related costs impacting operating income includes a $24 million purchase accounting adjustment for the fair value step-up of
inventory and $35 million of acquisition related costs.
Adjusted segment operating income and adjusted segment operating margin are presented as supplementary measures of our operating performance that are not required by, or
presented in accordance with, GAAP. We use adjusted segment operating income and adjusted segment operating margin as internal performance measurements and as two criteria for
evaluating our performance relative to that of our peers. We believe adjusted segment operating income and adjusted segment operating margin are meaningful to our investors to
enhance their understanding of our operating performance and are frequently used by securities analysts, investors and other interested parties to compare our performance with the
performance of other companies that report adjusted segment operating income and adjusted segment operating margin. Further, we believe that adjusted segment operating income and
adjusted segment operating margin are useful measures because they improve comparability of results of operations from period to period. Adjusted segment operating income and
Adjusted segment operating margin should not be considered as a substitute for segment operating income, segment operating margin or any other measure of operating performance
reported in accordance with GAAP. Investors should rely primarily on our GAAP results and use non-GAAP financial measures only supplementally in making investment decisions. Our
calculation of adjusted segment operating income and adjusted segment operating margin may not be comparable to similarly titled measures reported by other companies.
63
EPS Reconciliations
$ In millions, except per share data
(Unaudited)
Tyson Foods, Inc. Investor Presentation | September 2017
(a) Impact of additional week was calculated by using the fourth quarter of fiscal 2015 adjusted operating income (prior to the additional week impact) and divided by 14 weeks.
Adjusted operating income and adjusted net income from continuing operations per share attributable to Tyson (adjusted EPS) are presented as supplementary measures of our financial
performance that is not required by, or presented in accordance with, GAAP. We use adjusted operating income and adjusted EPS as internal performance measurements and as two criteria for
evaluating our performance relative to that of our peers. We believe adjusted operating income and adjusted EPS are meaningful to our investors to enhance their understanding of our financial
performance and is frequently used by securities analysts, investors and other interested parties to compare our performance with the performance of other companies that report adjusted
operating income and adjusted EPS. Further, we believe that adjusted operating income and adjusted EPS are useful measures because they improve comparability of results of operations from
period to period. Adjusted operating income and adjusted EPS should not be considered as a substitute for operating income or net income per share attributable to Tyson or any other measure of
financial performance reported in accordance with GAAP. Investors should rely primarily on our GAAP results and use non-GAAP financial measures only supplementally in making investment
decisions. Our calculation of adjusted operating income and adjusted EPS may not be comparable to similarly titled measures reported by other companies.
Operating
Income EPS
Operating
Income EPS
Operating
Income EPS
Operating
Income EPS
Operating
Income EPS
Reported from Continuing Operations 2,833$ 4.53$ 2,169$ 2.95$ 1,430$ 2.37$ 1,375$ 2.31$ 1,286$ 1.68$
Less:
Recognition of previously unrecognized tax benefit - (0.14) - (0.06) - (0.15) - - - -
Insurance proceeds (net of costs) related to a legacy Hillshire Brands
plant fire
- - (8) (0.02) - - - - - -
Gain on sale of equity securities - - - (0.03) - - - - - -
Gain on sale of Mexico operations - - (161) (0.24) - - - - - -
Impact of additional week (a) - - (44) (0.06) - - - - - -
Gain from currency translation adjustment - - - - - - - (0.05) - -
Gain on sale of interest in an equity method investment - - - - - - - - - -
Reversal of reserves for foreign uncertain tax positions - - - - - - - - - -
Add:
China Impairment - - 169 0.41 - - - - - -
Merger and integration costs - - 57 0.09 - - - - - -
Prepared Foods network optimization charges - - 59 0.09 - - - - - -
Denison plant closure - - 12 0.02 - - - - - -
Loss related to early extinguishment of debt - - - - - - - - - 0.29
Brazil impairment/Mexico undistributed earnings tax - - - - 42 0.16 - - - -
Hillshire Brands acquisition, integration and costs associated with
our Prepared Foods improvement plan
- - - - 137 0.37 - - - -
Hillshire Brands post-closing results, purchase price accounting and
costs related to a legacy Hillshire Brands plant fire
- - - - 40 0.07 - - - -
Hillshire Brands acquisition financing incremental interest costs and
share dilution
- - - - - 0.12 - - - -
Adjusting from Continuing Operations 2,833$ 4.39$ 2,253$ 3.15$ 1,649$ 2.94$ 1,375$ 2.26$ 1,286$ 1.97$
12 Months Ended
October 1, 2016 October 3, 2015 September 27, 2014 September 28, 2013 September 29, 2012
64
Sales, Operating Income and
Operating Margin Reconciliations
Tyson Foods, Inc. Investor Presentation | September 2017
$ In millions
(Unaudited) 2016 2015
Reported Sales 36,881$ 41,373$
Less: Impact of additional week (a) - (750)
Adjusted sales 36,881$ 40,623$
Reported operating income 2,833$ 2,169$
Add: China impairment - 169
Add: Merger and integration costs - 57
Add: Prepared Foods network optimization impairment charges - 59
Add: Denison plant closure - 12
Less: Insurance proceeds (net of costs) related to a legacy Hillshire Brands plant fire - (8)
Less: Gain on sale of the Mexico operation - (161)
Less: Estimated impact of additional week (b) - (44)
Adjusted operating income 2,833$ 2,253$
Adjusted operating margin % 7.7% 5.5%
Fiscal Year
(a) The estimated impact of the additional week in the 12 months of fiscal 2015 was calculated by dividing unadjusted sales for the fourth quarter of fiscal 2015 by 14 weeks.
(b) Impact of additional week was calculated by using the fourth quarter of fiscal 2015 adjusted operating income (prior to the additional week impact) and divided by 14 weeks.
Adjusted sales, adjusted operating income and adjusted operating margin are presented as supplementary measures of our operating performance that are not required by, or
presented in accordance with, GAAP. We use adjusted sales, adjusted operating income and adjusted operating margin as internal performance measurements and as three
criteria for evaluating our performance relative to that of our peers. We believe adjusted sales, adjusted operating income and adjusted operating margin are meaningful to our
investors to enhance their understanding of our operating performance and are frequently used by securities analysts, investors and other interested parties to compare our
performance with the performance of other companies that report adjusted sales, adjusted operating income and adjusted operating margin. Further, we believe that adjusted
sales, adjusted operating income and adjusted operating margin are useful measures because they improve comparability of results of operations from period to period.
Adjusted sales, adjusted operating income and adjusted operating margin should not be considered as a substitute for sales, operating income or operating margin or any other
measure of operating performance reported in accordance with GAAP. Investors should rely primarily on our GAAP results and use non-GAAP financial measures only
supplementally in making investment decisions. Our calculation of adjusted sales, adjusted operating income and adjusted operating margin may not be comparable to similarly
titled measures reported by other companies.
65
Segment Operating Income Reconciliations
$ In millions
(Unaudited)
Tyson Foods, Inc. Investor Presentation | September 2017
(a) Impact of additional week was calculated by using the fourth quarter of fiscal 2015 adjusted operating income (prior to the additional week impact) and divided by 14
weeks.
Adjusted segment operating income is presented as a supplementary measure of our operating performance that is not required by, or presented in accordance with,
GAAP. We use adjusted segment operating income as an internal performance measurement and as one criteria for evaluating our performance relative to that of our
peers. We believe adjusted segment operating income is meaningful to our investors to enhance their understanding of our operating performance and is frequently used
by securities analysts, investors and other interested parties to compare our performance with the performance of other companies that report adjusted segment
operating income. Further, we believe that adjusted segment operating income is a useful measure because it improves comparability of results of operations from period
to period. Adjusted segment operating income should not be considered as a substitute for segment operating income or any other measure of operating performance
reported in accordance with GAAP. Investors should rely primarily on our GAAP results and use non-GAAP financial measures only supplementally in making investment
decisions. Our calculation of adjusted segment operating income may not be comparable to similarly titled measures reported by other companies.
Beef Pork Chicken
Prepared
Foods Other Total
Reported operating income (loss) (66)$ 380$ 1,366$ 588$ (99)$ 2,169$
Add: China impairment - - - - 169 169
Add: Merger and integration costs - - - 10 47 57
Add: Prepared Foods network optimization charges - - - 59 - 59
Add: Denison plant closure 12 - - - - 12
Less: Insurance proceeds (net of costs) related to a legacy Hillshire
Brands plant fire - - - (8) - (8)
Less: Gain on sale of the Mexico operation - - - - (161) (161)
Adjusted operating income prior to adjustment for additional week (54) 380 1,366 649 (44) 2,297
Less: Estimated impact of additional week (a) 1 (7) (26) (13) 1 (44)
Adjusted operating income (loss) (53)$ 373$ 1,340$ 636$ (43)$ 2,253$
Adjusted Segment Operating Income (Loss)
(for 12 months ended October 3, 2015)
66
Net Debt to Proforma Adjusted EBITDA
$ in millions
(Unaudited)
Tyson Foods, Inc. Investor Presentation | September 2017
12 Months Ended
July 1, 2017
Net income 1,775$
Less: Interest income (6)
Add: Interest expense 243
Add: Income tax expense (benefit) 804
Add: Depreciation 631
Add: Amortization (a) 83
EBITDA 3,530$
Adjustments to EBITDA:
Add: AdvancePierre purchase accounting and acquisition related costs (b) 77
Add: San Diego Prepared Foods operation impairment 52
Total Adjusted EBITDA 3,659$
Pro forma Adjustments to EBITDA:
Add: AdvancePierre adjusted EBITDA (prior to acquisition) (c) 258
Total pro forma Adjusted EBITDA 3,917$
Total gross debt 10,824$
Less: Cash and cash equivalents (231)
Less: Short-term investments (4)
Total net debt 10,589$
Ratio Calculations:
Gross debt/EBITDA 3.1
Net debt/EBITDA 3.0
Gross debt/Adjusted EBITDA 3.0
Net debt/Adjusted EBITDA 2.9
Gross debt/Pro forma Adjusted EBITDA 2.8
Net debt/Pro forma Adjusted EBITDA 2.7
(a) Excludes the amortization of debt discount expense of $8 million for the twelve months
ended July 1, 2017, as it is included in interest expense.
(b) AdvancePierre acquisition and integration costs includes $24 million of purchase
accounting adjustments, $35 million acquisition related costs and $18 million of acquisition
bridge financing fees.
(c) Represents AdvancePierre's pre-acquisition adjusted EBITDA, for the approximate eleven
months ended prior to the June 7, 2017, closing of the acquisition. These amounts are added
to our Adjusted EBITDA for the twelve months ended July 1, 2017, in order for Net debt to
Adjusted EBITDA to include a full twelve months of AdvancePierre results on a pro forma basis
for the twelve months ended July 1, 2017. The pro forma adjusted EBITDA was derived from
AdvancePierre’s EBITDA from its historical unaudited financial statements for the three months
ended October 1, 2016, December 31, 2016 and April 1, 2017 as filed with the Securities and
Exchange Commission, as well as AdvancePierre management unaudited financial information
for the period from April 2, 2017 through the June 7, 2017, closing of the acquisition. These
amounts were adjusted to remove the impact of its merger acquisition and public filing
expenses and related expenses including consultant fees, accelerated stock-based
compensation and other deal costs. We believe this pro forma presentation is useful and helps
management, investors, and rating agencies enhance their understanding of our financial
performance and to better highlight future financial trends on a comparable basis with
AdvancePierre results included for the twelve months ended July 1, 2017 given the significance
of the acquisition to our overall results.
EBITDA is defined as net income before interest, income taxes, depreciation and
amortization. Net debt to EBITDA (Adjusted EBITDA and Pro forma Adjusted EBITDA)
We believe the presentation of these financial measures helps management and investors to
assess our operating performance from period to period, including our ability to generate
earnings sufficient to service our debt, and enhances understanding of our financial performance
and highlights operational trends. These measures are widely used by investors and rating
agencies in the valuation, comparison, rating and investment recommendations of companies;
however, the measurements of EBITDA (and Adjusted EBITDA and Pro forma Adjusted
EBITDA) and net debt to EBITDA (and to Adjusted EBITDA and Pro forma Adjusted EBITDA)
may not be comparable to those of other companies, which limits their usefulness as
comparative measures. EBITDA (and Adjusted EBITDA and Pro forma Adjusted EBITDA) and
net debt to EBITDA (and to Adjusted EBITDA and Pro forma Adjusted EBITDA) are not
measures required by or calculated in accordance with generally accepted accounting principles
(GAAP) and should not be considered as substitutes for net income or any other measure of
financial performance reported in accordance with GAAP or as a measure of operating cash
flow or liquidity. EBITDA (and Adjusted EBITDA and Pro forma Adjusted EBITDA) is a useful
tool for assessing, but is not a reliable indicator of, our ability to generate cash to service our
debt obligations because certain of the items added to net income to determine EBITDA (and
Adjusted EBITDA and Pro forma Adjusted EBITDA) involve outlays of cash. As a result, actual
cash available to service our debt obligations will be different from EBITDA (and Adjusted
EBITDA and Pro forma Adjusted EBITDA). Investors should rely primarily on our GAAP results
and use non-GAAP financial measures only supplementally in making investment decisions.

More Related Content

What's hot

2017 barclay final web
2017 barclay final web2017 barclay final web
2017 barclay final web
pinnaclefood
 
Tsn investor presentation may 2016
Tsn investor presentation may 2016Tsn investor presentation may 2016
Tsn investor presentation may 2016
investortyson
 
01 29-16 earnings slides - 2 q16 final
01 29-16 earnings slides - 2 q16 final01 29-16 earnings slides - 2 q16 final
01 29-16 earnings slides - 2 q16 final
Sysco_Investors
 
Sysco Q1 2017 Earnings Presenation
Sysco Q1 2017 Earnings PresenationSysco Q1 2017 Earnings Presenation
Sysco Q1 2017 Earnings Presenation
Sysco_Investors
 
Investor presentation april 2016
Investor presentation april 2016Investor presentation april 2016
Investor presentation april 2016
StoneMor
 
20160216 cagny presentation vfinal
20160216 cagny presentation vfinal20160216 cagny presentation vfinal
20160216 cagny presentation vfinal
Sysco_Investors
 
Tsn q217 earnings call slides v 4 0 final
Tsn q217 earnings call slides v 4 0 finalTsn q217 earnings call slides v 4 0 final
Tsn q217 earnings call slides v 4 0 final
investortyson
 
Tyson foods presentation 05 29 14
Tyson foods presentation 05 29 14Tyson foods presentation 05 29 14
Tyson foods presentation 05 29 14investortyson
 
Molson coors boston 2017 slides final
Molson coors boston 2017 slides finalMolson coors boston 2017 slides final
Molson coors boston 2017 slides final
molsoncoorsir
 
March 2015 Investor Presentation
March 2015 Investor PresentationMarch 2015 Investor Presentation
March 2015 Investor Presentation
investortyson
 
Tsn investor presentation may 2017
Tsn investor presentation may 2017Tsn investor presentation may 2017
Tsn investor presentation may 2017
investortyson
 
Tsn q317 earnings call slides final
Tsn q317 earnings call slides finalTsn q317 earnings call slides final
Tsn q317 earnings call slides final
investortyson
 
Micron Investor Presentation
Micron Investor PresentationMicron Investor Presentation
Micron Investor Presentationmolsoncoorsir
 
Q4 fy17 earnings presentation v f
Q4 fy17 earnings presentation v fQ4 fy17 earnings presentation v f
Q4 fy17 earnings presentation v f
ir_westrock
 
2017 cagny presentation
2017 cagny presentation2017 cagny presentation
2017 cagny presentation
Sysco_Investors
 
Q3 fy17 earnings-slides-final
Q3 fy17 earnings-slides-finalQ3 fy17 earnings-slides-final
Q3 fy17 earnings-slides-final
irusfoods
 
Sysco Q2 2017 Earnings Presentation
Sysco Q2 2017 Earnings Presentation Sysco Q2 2017 Earnings Presentation
Sysco Q2 2017 Earnings Presentation
Sysco_Investors
 
Q3 fy16 earnings slides final
Q3 fy16 earnings slides finalQ3 fy16 earnings slides final
Q3 fy16 earnings slides final
irusfoods
 
Raymond James 37th Annual Institutional Investors Conference Presentation
Raymond James 37th Annual Institutional Investors Conference PresentationRaymond James 37th Annual Institutional Investors Conference Presentation
Raymond James 37th Annual Institutional Investors Conference Presentation
StoneMor
 
2016 12-15 investor meeting final final web
2016 12-15 investor meeting final final web2016 12-15 investor meeting final final web
2016 12-15 investor meeting final final web
pinnaclefood
 

What's hot (20)

2017 barclay final web
2017 barclay final web2017 barclay final web
2017 barclay final web
 
Tsn investor presentation may 2016
Tsn investor presentation may 2016Tsn investor presentation may 2016
Tsn investor presentation may 2016
 
01 29-16 earnings slides - 2 q16 final
01 29-16 earnings slides - 2 q16 final01 29-16 earnings slides - 2 q16 final
01 29-16 earnings slides - 2 q16 final
 
Sysco Q1 2017 Earnings Presenation
Sysco Q1 2017 Earnings PresenationSysco Q1 2017 Earnings Presenation
Sysco Q1 2017 Earnings Presenation
 
Investor presentation april 2016
Investor presentation april 2016Investor presentation april 2016
Investor presentation april 2016
 
20160216 cagny presentation vfinal
20160216 cagny presentation vfinal20160216 cagny presentation vfinal
20160216 cagny presentation vfinal
 
Tsn q217 earnings call slides v 4 0 final
Tsn q217 earnings call slides v 4 0 finalTsn q217 earnings call slides v 4 0 final
Tsn q217 earnings call slides v 4 0 final
 
Tyson foods presentation 05 29 14
Tyson foods presentation 05 29 14Tyson foods presentation 05 29 14
Tyson foods presentation 05 29 14
 
Molson coors boston 2017 slides final
Molson coors boston 2017 slides finalMolson coors boston 2017 slides final
Molson coors boston 2017 slides final
 
March 2015 Investor Presentation
March 2015 Investor PresentationMarch 2015 Investor Presentation
March 2015 Investor Presentation
 
Tsn investor presentation may 2017
Tsn investor presentation may 2017Tsn investor presentation may 2017
Tsn investor presentation may 2017
 
Tsn q317 earnings call slides final
Tsn q317 earnings call slides finalTsn q317 earnings call slides final
Tsn q317 earnings call slides final
 
Micron Investor Presentation
Micron Investor PresentationMicron Investor Presentation
Micron Investor Presentation
 
Q4 fy17 earnings presentation v f
Q4 fy17 earnings presentation v fQ4 fy17 earnings presentation v f
Q4 fy17 earnings presentation v f
 
2017 cagny presentation
2017 cagny presentation2017 cagny presentation
2017 cagny presentation
 
Q3 fy17 earnings-slides-final
Q3 fy17 earnings-slides-finalQ3 fy17 earnings-slides-final
Q3 fy17 earnings-slides-final
 
Sysco Q2 2017 Earnings Presentation
Sysco Q2 2017 Earnings Presentation Sysco Q2 2017 Earnings Presentation
Sysco Q2 2017 Earnings Presentation
 
Q3 fy16 earnings slides final
Q3 fy16 earnings slides finalQ3 fy16 earnings slides final
Q3 fy16 earnings slides final
 
Raymond James 37th Annual Institutional Investors Conference Presentation
Raymond James 37th Annual Institutional Investors Conference PresentationRaymond James 37th Annual Institutional Investors Conference Presentation
Raymond James 37th Annual Institutional Investors Conference Presentation
 
2016 12-15 investor meeting final final web
2016 12-15 investor meeting final final web2016 12-15 investor meeting final final web
2016 12-15 investor meeting final final web
 

Similar to Tsn investor presentation september 2017

Tsn investor presentation march 2017
Tsn investor presentation march 2017Tsn investor presentation march 2017
Tsn investor presentation march 2017
investortyson
 
Tsn q218 slides v f
Tsn q218 slides v fTsn q218 slides v f
Tsn q218 slides v f
investortyson
 
Tsn q118 slides final
Tsn q118 slides finalTsn q118 slides final
Tsn q118 slides final
investortyson
 
Tyson cagny webcast_022018
Tyson cagny webcast_022018Tyson cagny webcast_022018
Tyson cagny webcast_022018
investortyson
 
Tsn investor presentation december 2016
Tsn investor presentation december 2016Tsn investor presentation december 2016
Tsn investor presentation december 2016
UGI_Corporation
 
Tsn investor presentation september 2015
Tsn investor presentation september 2015Tsn investor presentation september 2015
Tsn investor presentation september 2015
investortyson
 
Tsn investor presentation december 2015
Tsn investor presentation december 2015Tsn investor presentation december 2015
Tsn investor presentation december 2015
investortyson
 
Tsn investor presentation march 2016
Tsn investor presentation march 2016Tsn investor presentation march 2016
Tsn investor presentation march 2016
investortyson
 
TSN investor presentation august 2016
TSN investor presentation august 2016TSN investor presentation august 2016
TSN investor presentation august 2016
investortyson
 
Tsn investor presentation feb 2014
Tsn investor presentation feb 2014Tsn investor presentation feb 2014
Tsn investor presentation feb 2014investortyson
 
February 2015 Investor Presentation
February 2015 Investor PresentationFebruary 2015 Investor Presentation
February 2015 Investor Presentation
investortyson
 
20160113 icr presentation vfinal
20160113 icr presentation vfinal20160113 icr presentation vfinal
20160113 icr presentation vfinal
Sysco_Investors
 
Tsn investor presentation dec 2013
Tsn investor presentation dec 2013Tsn investor presentation dec 2013
Tsn investor presentation dec 2013investortyson
 
Tsn investor presentation june 2015
Tsn investor presentation june 2015Tsn investor presentation june 2015
Tsn investor presentation june 2015
investortyson
 
Investor presentation september 2013
Investor presentation september 2013Investor presentation september 2013
Investor presentation september 2013investortyson
 
Tsn investor presentation august 2015
Tsn investor presentation august 2015Tsn investor presentation august 2015
Tsn investor presentation august 2015
investortyson
 
Ty foodsinvestorpresentationjune13
Ty foodsinvestorpresentationjune13Ty foodsinvestorpresentationjune13
Ty foodsinvestorpresentationjune13Company Spotlight
 
tyson foods 2008 Annual Report
tyson foods  2008 Annual Report tyson foods  2008 Annual Report
tyson foods 2008 Annual Report finance9
 
Tyson 2008 Annual Report
Tyson 2008 Annual ReportTyson 2008 Annual Report
Tyson 2008 Annual Report
earningsreport
 
3q23-syy-earnings-slides-v19.pdf
3q23-syy-earnings-slides-v19.pdf3q23-syy-earnings-slides-v19.pdf
3q23-syy-earnings-slides-v19.pdf
Sysco_Investors
 

Similar to Tsn investor presentation september 2017 (20)

Tsn investor presentation march 2017
Tsn investor presentation march 2017Tsn investor presentation march 2017
Tsn investor presentation march 2017
 
Tsn q218 slides v f
Tsn q218 slides v fTsn q218 slides v f
Tsn q218 slides v f
 
Tsn q118 slides final
Tsn q118 slides finalTsn q118 slides final
Tsn q118 slides final
 
Tyson cagny webcast_022018
Tyson cagny webcast_022018Tyson cagny webcast_022018
Tyson cagny webcast_022018
 
Tsn investor presentation december 2016
Tsn investor presentation december 2016Tsn investor presentation december 2016
Tsn investor presentation december 2016
 
Tsn investor presentation september 2015
Tsn investor presentation september 2015Tsn investor presentation september 2015
Tsn investor presentation september 2015
 
Tsn investor presentation december 2015
Tsn investor presentation december 2015Tsn investor presentation december 2015
Tsn investor presentation december 2015
 
Tsn investor presentation march 2016
Tsn investor presentation march 2016Tsn investor presentation march 2016
Tsn investor presentation march 2016
 
TSN investor presentation august 2016
TSN investor presentation august 2016TSN investor presentation august 2016
TSN investor presentation august 2016
 
Tsn investor presentation feb 2014
Tsn investor presentation feb 2014Tsn investor presentation feb 2014
Tsn investor presentation feb 2014
 
February 2015 Investor Presentation
February 2015 Investor PresentationFebruary 2015 Investor Presentation
February 2015 Investor Presentation
 
20160113 icr presentation vfinal
20160113 icr presentation vfinal20160113 icr presentation vfinal
20160113 icr presentation vfinal
 
Tsn investor presentation dec 2013
Tsn investor presentation dec 2013Tsn investor presentation dec 2013
Tsn investor presentation dec 2013
 
Tsn investor presentation june 2015
Tsn investor presentation june 2015Tsn investor presentation june 2015
Tsn investor presentation june 2015
 
Investor presentation september 2013
Investor presentation september 2013Investor presentation september 2013
Investor presentation september 2013
 
Tsn investor presentation august 2015
Tsn investor presentation august 2015Tsn investor presentation august 2015
Tsn investor presentation august 2015
 
Ty foodsinvestorpresentationjune13
Ty foodsinvestorpresentationjune13Ty foodsinvestorpresentationjune13
Ty foodsinvestorpresentationjune13
 
tyson foods 2008 Annual Report
tyson foods  2008 Annual Report tyson foods  2008 Annual Report
tyson foods 2008 Annual Report
 
Tyson 2008 Annual Report
Tyson 2008 Annual ReportTyson 2008 Annual Report
Tyson 2008 Annual Report
 
3q23-syy-earnings-slides-v19.pdf
3q23-syy-earnings-slides-v19.pdf3q23-syy-earnings-slides-v19.pdf
3q23-syy-earnings-slides-v19.pdf
 

More from investortyson

TSN investor presentation may 2015
TSN investor presentation may 2015TSN investor presentation may 2015
TSN investor presentation may 2015
investortyson
 
Tsn investor presentation march 2015
Tsn investor presentation march 2015Tsn investor presentation march 2015
Tsn investor presentation march 2015
investortyson
 
Tyson Foods Investor Day
Tyson Foods Investor DayTyson Foods Investor Day
Tyson Foods Investor Day
investortyson
 
November 2014 Investor Presentation
November 2014 Investor PresentationNovember 2014 Investor Presentation
November 2014 Investor Presentation
investortyson
 
Tsn investor presentation september 2014
Tsn investor presentation september 2014Tsn investor presentation september 2014
Tsn investor presentation september 2014
investortyson
 
Tsn hsh 06 09-14 revised
Tsn hsh 06 09-14 revisedTsn hsh 06 09-14 revised
Tsn hsh 06 09-14 revisedinvestortyson
 
Tsn investor presentation may 2014 v001 v0n7dr
Tsn investor presentation may 2014 v001 v0n7drTsn investor presentation may 2014 v001 v0n7dr
Tsn investor presentation may 2014 v001 v0n7drinvestortyson
 

More from investortyson (7)

TSN investor presentation may 2015
TSN investor presentation may 2015TSN investor presentation may 2015
TSN investor presentation may 2015
 
Tsn investor presentation march 2015
Tsn investor presentation march 2015Tsn investor presentation march 2015
Tsn investor presentation march 2015
 
Tyson Foods Investor Day
Tyson Foods Investor DayTyson Foods Investor Day
Tyson Foods Investor Day
 
November 2014 Investor Presentation
November 2014 Investor PresentationNovember 2014 Investor Presentation
November 2014 Investor Presentation
 
Tsn investor presentation september 2014
Tsn investor presentation september 2014Tsn investor presentation september 2014
Tsn investor presentation september 2014
 
Tsn hsh 06 09-14 revised
Tsn hsh 06 09-14 revisedTsn hsh 06 09-14 revised
Tsn hsh 06 09-14 revised
 
Tsn investor presentation may 2014 v001 v0n7dr
Tsn investor presentation may 2014 v001 v0n7drTsn investor presentation may 2014 v001 v0n7dr
Tsn investor presentation may 2014 v001 v0n7dr
 

Recently uploaded

Corporate Presentation Probe June 2024.pdf
Corporate Presentation Probe June 2024.pdfCorporate Presentation Probe June 2024.pdf
Corporate Presentation Probe June 2024.pdf
Probe Gold
 
Osisko Development - Investor Presentation - June 24
Osisko Development - Investor Presentation - June 24Osisko Development - Investor Presentation - June 24
Osisko Development - Investor Presentation - June 24
Philip Rabenok
 
Snam 2023-27 Industrial Plan - Financial Presentation
Snam 2023-27 Industrial Plan - Financial PresentationSnam 2023-27 Industrial Plan - Financial Presentation
Snam 2023-27 Industrial Plan - Financial Presentation
Valentina Ottini
 
一比一原版(UW毕业证)华盛顿大学毕业证成绩单专业办理
一比一原版(UW毕业证)华盛顿大学毕业证成绩单专业办理一比一原版(UW毕业证)华盛顿大学毕业证成绩单专业办理
一比一原版(UW毕业证)华盛顿大学毕业证成绩单专业办理
ybout
 
Investor Day 2024 Presentation Sysco 2024
Investor Day 2024 Presentation Sysco 2024Investor Day 2024 Presentation Sysco 2024
Investor Day 2024 Presentation Sysco 2024
Sysco_Investors
 
2024-deutsche-bank-global-consumer-conference.pdf
2024-deutsche-bank-global-consumer-conference.pdf2024-deutsche-bank-global-consumer-conference.pdf
2024-deutsche-bank-global-consumer-conference.pdf
Sysco_Investors
 
Collective Mining | Corporate Presentation - May 2024
Collective Mining | Corporate Presentation - May 2024Collective Mining | Corporate Presentation - May 2024
Collective Mining | Corporate Presentation - May 2024
CollectiveMining1
 
cyberagent_For New Investors_EN_240424.pdf
cyberagent_For New Investors_EN_240424.pdfcyberagent_For New Investors_EN_240424.pdf
cyberagent_For New Investors_EN_240424.pdf
CyberAgent, Inc.
 

Recently uploaded (8)

Corporate Presentation Probe June 2024.pdf
Corporate Presentation Probe June 2024.pdfCorporate Presentation Probe June 2024.pdf
Corporate Presentation Probe June 2024.pdf
 
Osisko Development - Investor Presentation - June 24
Osisko Development - Investor Presentation - June 24Osisko Development - Investor Presentation - June 24
Osisko Development - Investor Presentation - June 24
 
Snam 2023-27 Industrial Plan - Financial Presentation
Snam 2023-27 Industrial Plan - Financial PresentationSnam 2023-27 Industrial Plan - Financial Presentation
Snam 2023-27 Industrial Plan - Financial Presentation
 
一比一原版(UW毕业证)华盛顿大学毕业证成绩单专业办理
一比一原版(UW毕业证)华盛顿大学毕业证成绩单专业办理一比一原版(UW毕业证)华盛顿大学毕业证成绩单专业办理
一比一原版(UW毕业证)华盛顿大学毕业证成绩单专业办理
 
Investor Day 2024 Presentation Sysco 2024
Investor Day 2024 Presentation Sysco 2024Investor Day 2024 Presentation Sysco 2024
Investor Day 2024 Presentation Sysco 2024
 
2024-deutsche-bank-global-consumer-conference.pdf
2024-deutsche-bank-global-consumer-conference.pdf2024-deutsche-bank-global-consumer-conference.pdf
2024-deutsche-bank-global-consumer-conference.pdf
 
Collective Mining | Corporate Presentation - May 2024
Collective Mining | Corporate Presentation - May 2024Collective Mining | Corporate Presentation - May 2024
Collective Mining | Corporate Presentation - May 2024
 
cyberagent_For New Investors_EN_240424.pdf
cyberagent_For New Investors_EN_240424.pdfcyberagent_For New Investors_EN_240424.pdf
cyberagent_For New Investors_EN_240424.pdf
 

Tsn investor presentation september 2017

  • 1. Grow. Deliver. Sustain. Investor Presentation September 2017
  • 2. Tyson Foods, Inc. Investor Presentation | September 2017 Certain information contained in this presentation may constitute forward-looking statements, such as statements relating to expected performance and including, but not limited to, statements appearing in the “Outlook” section and statements relating to adjusted EPS guidance. These forward-looking statements are subject to a number of factors and uncertainties, which could cause our actual results and experiences to differ materially from the anticipated results and expectations expressed in such forward- looking statements. We wish to caution readers not to place undue reliance on any forward-looking statements, which speak only as of the date made. Among the factors that may cause actual results and experiences to differ from anticipated results and expectations expressed in such forward-looking statements are the following: (i) the effect of, or changes in, general economic conditions; (ii) fluctuations in the cost and availability of inputs and raw materials, such as live cattle, live swine, feed grains (including corn and soybean meal) and energy; (iii) market conditions for finished products, including competition from other global and domestic food processors, supply and pricing of competing products and alternative proteins and demand for alternative proteins; (iv) successful rationalization of existing facilities and operating efficiencies of the facilities; (v) risks associated with our commodity purchasing activities; (vi) access to foreign markets together with foreign economic conditions, including currency fluctuations, import/export restrictions and foreign politics; (vii) outbreak of a livestock disease (such as avian influenza ((AI)) or bovine spongiform encephalopathy ((BSE))), which could have an adverse effect on livestock we own, the availability of livestock we purchase, consumer perception of certain protein products or our ability to access certain domestic and foreign markets; (viii) changes in availability and relative costs of labor and contract growers and our ability to maintain good relationships with employees, labor unions, contract growers and independent producers providing us livestock; (ix) issues related to food safety, including costs resulting from product recalls, regulatory compliance and any related claims or litigation; (x) changes in consumer preference and diets and our ability to identify and react to consumer trends; (xi) significant marketing plan changes by large customers or loss of one or more large customers; (xii) adverse results from litigation; (xiii) impacts on our operations caused by factors and forces beyond our control, such as natural disasters, fire, bioterrorism, pandemics or extreme weather; (xiv) risks associated with leverage, including cost increases due to rising interest rates or changes in debt ratings or outlook; (xv) compliance with and changes to regulations and laws (both domestic and foreign), including changes in accounting standards, tax laws, environmental laws, agricultural laws and occupational, health and safety laws; (xvi) our ability to make effective acquisitions or joint ventures and successfully integrate newly acquired businesses into existing operations; (xvii) cyber incidents, security breaches or other disruptions of our information technology systems; (xviii) effectiveness of advertising and marketing programs; and (xix) those factors listed under Item 1A. “Risk Factors” included in our Annual Report filed on Form 10-K for the period ended October 1, 2016 and subsequently filed Quarterly Reports on Form 10-Q and Current Reports on Form 8-K. 2 Forward-Looking Statements
  • 3. 3 Why Invest in TSN • Our three-year (2014-2016) Total Shareholder Return far exceeds our peer set • We’ve produced consistent earnings growth and returned cash to shareholders through share repurchases and dividends; however, following the acquisition of AdvancePierre, we have prioritized debt repayment over share repurchases until our target leverage ratio is reached • We occupy a unique position at the intersection of Opportunity, Capability and Firepower  Differentiated capabilities position us to capitalize on opportunities created by changing consumer demand for fresh, protein packed foods  We lead across channels, categories and eating occasions with a diverse product portfolio  Our expertise spans from agriculture to dining culture with the ability to drive positive change at unmatched scale  Our solid business model and disciplined execution give us the firepower to capitalize on opportunities “We will grow, deliver results and sustain that growth over time.” – President & CEO Tom HayesTyson Foods, Inc. Investor Presentation | September 2017
  • 4. 4 Strong Today, Leading for Tomorrow Clear Strategy Strong Financials Future Focused Team Unique Position Purpose Driven Tyson Foods, Inc. Investor Presentation | September 2017
  • 5. 169% 88% 68% 68% 64% 56% 49% 48% 46% 44% 44% 38% 23% 11% -10% -18% *SOURCE: Bloomberg - This information should not be deemed to be “soliciting material” subject to regulation 14a or 14c or to the liabilities of Section 18 of the Securities Exchange Act of 1934 Driving Unmatched Shareholder Return Among Peers Total Shareholder Return* 2014-2016 HRL PPC CAG MKC SAFM MDLZ PEP GIS K CPB SJM ADM HSY DF BG Tyson Foods, Inc. Investor Presentation | September 20175
  • 6. 6 Consistent EPS Growth FY12 FY13 FY14 FY15 FY16 FY17 proj. $3.15* $2.26* $2.94* $4.39* $4.95 – 5.05** $1.97* *Represents a non-GAAP financial measure. Adjusted EPS is explained and reconciled in the Appendix at “EPS Reconciliations.” **Projected adjusted EPS guidance as of 8/07/17. A further explanation of providing non-GAAP guidance is included in the appendix. FY16 Adjusted EPS* Growth Up 39% vs. FY15 Tyson Foods, Inc. Investor Presentation | September 2017
  • 7. 7 Strong Cash Flow Fuels Growth FY12 FY13 FY14 FY15 FY16 Operating Cash Flow ($ in millions) $1,187 $1,314 $2,716 $2,570 $1,178 Tyson Foods, Inc. Investor Presentation | September 2017
  • 8. 8 Returning Cash to Shareholders Board of Directors increased regular quarterly dividend by 50% to $0.225 per share for Class A common stock payable on 12/15/16 Board of Directors intends to increase future dividends for Class A shares by at least 10 cents per share annually 28.2 million shares repurchased in fiscal 2016 and 10.2 million in first half of fiscal 2017, excluding shares repurchased to offset dilution from equity compensation plans** $0.00 $0.10 $0.20 $0.30 $0.40 $0.50 $0.60 $0.70 $0.80 $0.90 $1.00 FY12 FY13 FY14 FY15 FY16 FY17* Dividends Paid per Class A Share Regular Dividend Special Dividend Tyson Foods, Inc. Investor Presentation | September 2017 *Includes dividends payable on 9/15/17 **Following the AdvancePierre acquisition, we have prioritized debt repayment over share repurchases until our target leverage ratio is reached
  • 9. 9 New Brands New Geographies New Capabilities IDEAL A Simple Framework for M&A Tyson Foods, Inc. Investor Presentation | September 2017
  • 10. • Debt repayment • Growing our businesses organically through operational efficiency and capital expansion projects, along with investing in innovation and brand building • Acquiring businesses that support our strategic objectives • Returning cash to shareholders through share repurchases and dividends while maintaining plenty of liquidity and investment-grade credit ratings and continuing to expand debt capacity “Capital allocation priorities are governed by a disciplined focus on driving long-term shareholder value.” – Dennis Leatherby, CFO 10 Priorities for Cash Tyson Foods, Inc. Investor Presentation | September 2017
  • 11. • Record Operating Income • Record Operating Margin • Record Adjusted EPS* • Record Operating Cash Flow • Record Pork Segment Operating Margin • Record Prepared Foods Segment Operating Margin 11 FY16 – Another Record Year *Represents a non-GAAP financial measure. Adjusted sales, adjusted operating income, adjusted operating margin and adjusted EPS are explained and reconciled to comparable GAAP measures in the Appendix. ($ in millions) FY16 Adjusted YOY Growth* Dollars ROS% Operating Income Beef $347 2.4% 755% Pork $528 10.8% 42% Prepared Foods $734 10.0% 15% Other $(81) n/a n/a Total $2,833 7.7% 26% ($ in millions) FY16 FY15 YOY Growth Net Sales $36,881 $40,623* -9% Adjusted Operating Income* $2,833 $2,253 26% Adjusted Operating Margin* 7.7% 5.5% Adjusted EPS* $4.39 $3.15 39% Operating Cash Flow $2,716 $2,570 6% Tyson Foods, Inc. Investor Presentation | September 2017 Chicken $1,305 11.9% -3%
  • 12. Tyson Foods, Inc. Investor Presentation | September 201712 Q3 FY17 Highlights • Adjusted EPS* of $1.28, up 6% from Q3 last year • Sales up 4.8% from Q3 last year and every segment delivered growth** • Tightened annual adjusted EPS guidance* to $4.95-$5.05, excluding AdvancePierre benefit; estimated Q4 adjusted EPS* of $1.07 to $1.17 ($ in millions, except per share data) Q3 FY17 Sales $9,850 Adjusted Operating Income* $756 Adjusted Operating Margin* 7.7% Adjusted EPS* $1.28 ($ in millions) Q3 FY17 Adjusted Operating Income* Dollars ROS% Beef $147 3.7% Pork 136 10.3% Chicken 298 10.4% Prepared Foods 195 10.0% Other (20) n/a Total $756 7.7% *Represents a non-GAAP financial measure. Adjusted EPS, adjusted operating income and adjusted operating margin are explained and reconciled to comparable GAAP measures in the Appendix at “Q3 EPS Reconciliations” and “Segment Operating Income and Operating Margin Reconciliations.” Projected Adjusted EPS as of 8/7/17. A further explanation of providing Non- GAAP guidance is included in the Appendix. **Includes AdvancePierre Holdings, Inc. acquisition completed on 6/7/17.
  • 13. Tyson Foods, Inc. Investor Presentation | September 201713 Nine Months of FY17 ($ in millions, except per share data) Nine Months FY17 Sales $28,115 Adjusted Operating Income* $2,361 Adjusted Operating Margin* 8.4% Adjusted EPS* $3.88 ($ in millions) Nine Months FY17 Adjusted Operating Income* Dollars ROS% Beef $572 5.2% Pork 524 13.5% Chicken 794 9.5% Prepared Foods 524 9.4% Other (53) n/a Total $2,361 8.4%*Represents a non-GAAP financial measure. Adjusted EPS, adjusted operating income and adjusted operating margin are explained and reconciled to comparable GAAP measures in the Appendix at “9 months EPS Reconciliations” and “Segment Operating Income and Operating Margin Reconciliations.” Highlights • Record Adjusted EPS* of $3.88, up 13% from last year • Record Adjusted Operating Income* of $2.4 billion, up 5% from last year • Operating Cash Flow of $1.4 billion
  • 14. Tyson Foods, Inc. Investor Presentation | September 201714 FY17 Outlook Adjusted EPS of $4.95-5.05* • ~13-15% growth over FY16 • 5 year CAGR of ~20% Sales of ~$38B Expect AdvancePierre to have an incremental impact of approximately $550 million CapEx of ~$1B *Projected Adjusted EPS as of 8/7/17. Excludes impact of AdvancePierre, which is expected to be a few cents accretive in FY17 on an adjusted basis. Represents a non-GAAP financial measure. A further explanation of providing non-GAAP guidance is included in the Appendix.
  • 15. Tyson Foods, Inc. Investor Presentation | September 201715 FY17 Segment Outlook Adjusted ROS%* 9 Months Ending FY17 Q4 Projection FY17 Outlook Beef 5.2% ~4-5% ~5% Pork 13.5% ~6-8% ~12% Chicken 9.5% ~10-11% ~10% Prepared Foods 9.4% ~7-8% ~9% *Represents a non-GAAP financial measure. Historical operating margin is explained and reconciled to a comparable GAAP measure in the Appendix at “Q3 EPS Reconciliations.”
  • 16. Tyson Foods, Inc. Investor Presentation | September 201716 FY18 Outlook* Sales of ~$41B** Topline growth of ~6% as we grow volume and have full year benefit of AdvancePierre CapEx of ~$1B+ Beef Segment operating margin around 5% Pork Segment operating margin above 6-8% normalized range Chicken Segment operating margin approximately 10% with nearly 3% volume growth Prepared Foods Segment operating margin in the upper half of 10-12% normalized range with ~10% volume growth, excluding impact of divestitures *Does not include expected Other operating loss of approximately $70 million in fiscal 2018 **Includes incremental impact of AdvancePierre acquisition, partially offset by the sale of three non-protein businesses
  • 18. Raise the world’s expectations for how much good food can do Our Purpose 18 Tyson Foods, Inc. Investor Presentation | September 2017
  • 19. Sustainably feed the world with the fastest growing portfolio of protein packed brands Strategic Intent 19 Tyson Foods, Inc. Investor Presentation | September 2017
  • 20. 20 Twin Engines of Growth Sustainably feed the world with the fastest growing portfolio of protein packed brands Growing our portfolio of protein packed brands Delivering sustainable food at scale Driving profitable growth with and for our customers through differentiated capabilities Creating fuel for reinvestment through a disciplined financial fitness model Critical Enablers Tyson Foods, Inc. Investor Presentation | September 2017
  • 21. 21 Value Creation Model Share Repurchases (after deleveraging) Dividends Capabilities to drive profitable growth Financial Fitness Protein Packed Brands Total Shareholder Return Bold commitment to sustainable food at scale Annual Value-Added Volume Growth +3% High Single Digits Annual EPS Growth Shared Value Tyson Foods, Inc. Investor Presentation | September 2017 Top 1/3 Peer Group
  • 22. REDUCE waste across the entire company through Continuous Improvement ALLOCATE financial and human capital for growth TRANSFORM our business through technology 22 A New Approach to Efficiency Will Fund Investments for Sustainable Growth Tyson Foods, Inc. Investor Presentation | September 2017
  • 23. 23 Superior Results Through Defined Portfolio Roles Branded & Value Added Commodity Grow above industry by investing in brand building, innovation and customer development Grow above industry and expand margins through customer partnership, differentiation and competitive costs RETAIL FOODSERVICE ALL-CHANNELS Leverage throughput and efficiency to generate cash Tyson Foods, Inc. Investor Presentation | September 2017
  • 24. 24 Proven Leadership Team Aligned with Our Strategy Team Elevates Focus on CONSUMERS CUSTOMERS SUSTAINABILITY TECHNOLOGY Tyson Foods, Inc. Investor Presentation | September 2017 Tom Hayes President & CEO
  • 25. Leading the Way in Food Sustainability
  • 26. FORTUNE No. 1 Most Admired Company Food Production Industry 26 Tyson Foods, Inc. Investor Presentation | September 2017
  • 27. 27 Over Time Sustainability Investments Will Fund Themselves Sustainability Investments Resources Waste Cost Innovation Volume Profits Tyson Foods, Inc. Investor Presentation | September 2017
  • 28. 28 Poultry Farm of the Future Tyson Foods, Inc. Investor Presentation | September 2017 Barn Hatchery Plant
  • 29. 29 Poultry Farm of the Future Improves Food Safety Improves Animal Welfare Reduces Greenhouse Emissions Reduces Land Use Improves Worker Welfare Tyson Foods, Inc. Investor Presentation | September 2017
  • 30. 30 Evidence-based Targets, Long-term Commitments FOOD PEOPLE ANIMALS ENVIRONMENT Convert chicken supply chain to no antibiotics ever Reduce workplace injuries by 15% per year 3rd party audit of farms to certify humane treatment of chickens Working with partners to set science-based targets Tyson Foods, Inc. Investor Presentation | September 2017
  • 32. 32 Brand Portfolio for All Eating Occasions Tyson Foods, Inc. Investor Presentation | September 2017
  • 33. “Core 9” Advantaged Brands in Advantaged Categories Sources: IRI, Total US Multi-Outlet, data thru 8/6/17 Frozen Prepared Chicken 1 Hot Dogs 1 Branded Stacked Bacon1 Corn Dogs 1 Super Premium Smoked Sausage1Smoked Sausage1 Branded Lunchmeat2 Frozen Protein Breakfast1 Breakfast Sausage1 33 Tyson Foods, Inc. Investor Presentation | September 2017
  • 34. Tyson is well positioned to capitalize on growth in the fresh retail perimeter GENERAL FOOD DAIRY FROZEN CHECKOUT RFG MEAT BAKERY PRODUCE DELI SEAFOOD Source: IRI Syndicated databases, 52 wks ending 7/9/17, excluding Tyson Deli, which is based on year-to-date internal shipment data as of 7/1/17 ALL OTHER RFG BEVERAGE FRESH MEAT Total Retail Food: +0.1% Tyson Retail Food: +8.9% Retail Department Volume Growth (%) vs. YA indicates departments where Tyson has a significant presence +9.2% -1.2%Category +10.9% +1.2%Category +5.0% +1.2%Category +4.4%Category -0.7%Category -4.3%Category +2.2%Category +7.8%+2.0%Category -0.9%Category -0.6%Category +0.2%Category Tyson Foods, Inc. Investor Presentation | September 201734
  • 35. 5.1% 4.7% 4.7% -0.2% -0.3% -2.9% -3.1% -3.2% -4.6% -4.6% -7.3% -9.6% Tyson Foods, Inc. Investor Presentation | September 2017 Source: IRI Total U.S. Multi-Outlet (x Costco) Volume Sales 52 weeks ending 8/06/2017 Product = Total Edible + Pet Food 35 Core 9 Total Total F&B Core 9 and Total Tyson Leading in CPG Volume Performance Volume sales % change among top 10 branded food companies >$5B
  • 36. 3.6% 3.2% 2.1% 1.7% 0.5% -0.6% -0.6% -1.5% -2.9% -3.5% -5.6% -6.3% Source: IRI Total U.S. Multi-Outlet (x Costco) Dollar Sales 52 weeks ending 8/06/2017 Product = Total Edible + Pet Food 36 Core 9 Total Total F&B Tyson Foods, Inc. Investor Presentation | September 2017 Core 9 and Total Tyson Leading in CPG Dollar Performance Dollar sales % change among top 10 branded food companies >$5B
  • 37. #2 in Frozen Food Tyson Foods leads in the growing categories of frozen poultry and protein breakfast Source: IRI U.S. Multi-Outlet frozen category sales, 52 weeks ending 8/6/17 $7.1 $3.5 $2.9 $2.3 $2.1 $1.9 $1.3 $1.2 $1.1 Sales in Billions 37 Tyson Foods, Inc. Investor Presentation | September 2017
  • 38. #7 in Total U.S. CPG Retail Food Sales Among branded food companies >$5B Source: IRI Total U.S. Multi-Outlet Sales, 52 weeks ending 8/6/17 $25.8 $21.2 $16.5 $11.7 $8.5 $7.8 $7.7 $7.5 $6.4 $6.3 $5.8 $5.8 $5.3 $5.0 Sales in Billions In addition to retail, Tyson Foods is a leading supplier to the foodservice industry 38 Tyson Foods, Inc. Investor Presentation | September 2017
  • 39. 39 Opportunity in Current Spaces Tyson Foods, Inc. Investor Presentation | September 2017 SOURCE: IRI a) National Consumer Panel for 52 weeks ending 8/6/17 b)Total US Multi-Outlet for 52 weeks ending 8/6/17 *Within branded stacked bacon **Within super-premium smoked sausage 97% 87% 79% 75% 62% 63% 63% 52% 38% 21% 78% 30% 7% 30% 26% 28% 6% 33% 24% 10% Total Core 9 Lunchmeat Bacon Hot Dogs Breakfast Sausage Smoked Sausage Smoked Sausage Frozen Prepared Chicken Frozen Protein Breakfast Frozen Corn Dogs Category HH Penetration Brand HH Penetration Branded $ Share Position #2 #1* #1 #1 #1 #1** #1 #1#1
  • 41. 41 Innovation Performance insights innovation research & development Retail Packaged Brands innovation vitality growing FY16 14% FY15 12.5% % of sales dollars from Retail Packaged Brands products created in the previous three years Tyson Foods, Inc. Investor Presentation | September 2017
  • 42. Tyson Foods, Inc. Investor Presentation | September 201742 Innovation Platforms Fresh Meal Kits & Starters Fresh Take on Breakfast Keeping Core 9 Fresh
  • 43. Tyson Foods, Inc. Investor Presentation | September 2017 Innovation – Recent Product Launches 43
  • 45. 45 Logical Next Step in Strategy Expands prepared foods offering; joins complementary market-leading portfolios • Expands Tyson’s prepared foods offerings with AdvancePierre’s portfolio of ready-to-eat lunch and dinner sandwiches, sandwich components, entrees, and snacks • Broadens Tyson’s competitive position across poultry, beef and pork • Improves competitiveness and sustainable long-term growth through increased scale and refined portfolio of prepared foods and protein-packed brands • Also planning to divest existing Tyson non-protein branded assets to sharpen strategic focus Valuable addition to current distribution and sales footprint • Represents natural extension of our supply chain – Tyson’s beef and pork businesses are able to provide many of AdvancePierre’s raw material components • Increases Tyson’s exposure to the convenience distribution channel • Accelerates growth of AdvancePierre’s brands by leveraging Tyson’s existing infrastructure and distribution channel Enhances Tyson’s financial profile • Immediately accretive to Tyson’s EPS on both a GAAP and cash basis • Net debt to adjusted EBITDA ratio of 2.7x* on a proforma basis including AdvancePierre’s results for a full 12 months • Significant and achievable annual net synergies in excess of $200 million within three years AdvancePierre’s recent growth has outpaced category growth • Significant growth across all operating segments − Foodservice: well-positioned in growing and resilient industry − Retail: leading provider of customer brands with significant growth opportunity − Convenience: fastest growing segment, with consistent growth since 2012 Strong cultural fit • Shared goals; sustainable, holistic solutions to food manufacturing and long-term growth • Provides stability and opportunities for employees, customers, and shareholders *Represents a non-GAAP financial measure. Pro forma net debt to adjusted EBITDA ratio is explained and reconciled to comparable GAAP measure in the Appendix. Tyson Foods, Inc. Investor Presentation | September 2017
  • 46. 46 Complementary Portfolios of Strong Brands Tyson Foods, Inc. Investor Presentation | September 2017
  • 47. 47 Strong Today and Leading for Tomorrow Natural extension of our supply chain Consolidated manufacturing footprint Enhanced distribution channels Reaching a broader cross- section of consumers Leading supplier to national and regional convenience stores and vending providers Leading foodservice brands with high operator/distributor loyalty NEW BRANDS, NEW CAPABILITIES, NEW GEOGRAPHIES Tyson Foods, Inc. Investor Presentation | September 2017
  • 48. CREATES SIGNIFICANT SYNERGIES • Expected to result in net cost synergies in excess of $200 million to be fully realized within three years • Cost synergies created by consolidated manufacturing footprint, lower input pricing, and addressing redundant foodservice and retail distribution channels, redundant sales and marketing functions and duplicative corporate overhead • Revenue synergies expected over time by utilizing Tyson’s sales and distribution platform to drive growth across AdvancePierre’s leading sandwich/snack brands ENHANCES BALANCE SHEET • Expected to be immediately accretive to Tyson’s EPS on both a GAAP and a cash basis, excluding one-time costs • Net debt to adjusted EBITDA ratio of 2.7x* on a proforma basis; will be reduced steadily by strong cash flow and support investment grade profile 48 Driving Financial Results *Represents a non-GAAP financial measure. Pro forma net debt to adjusted EBITDA ratio is explained and reconciled to comparable GAAP measure in the Appendix. Tyson Foods, Inc. Investor Presentation | September 2017
  • 49. 49 Tyson and AdvancePierre Combine to Create Long-Term Value Next step in growth strategy and opportunity to refine the shape of our portfolio Financially compelling; expected to be immediately accretive to Tyson EPS based on net cost synergies exceeding $200 million. Significant ongoing benefits to Tyson shareholders and both companies’ customers and employees Complementary, market-leading products and brands Natural extension of supply chain and sales footprint, including fast-growing convenience distribution channel Contributing to our mission to sustainably feed the world with the fastest growing portfolio of protein-packed brands Tyson Foods, Inc. Investor Presentation | September 2017
  • 51. 51 Tyson Foods, Inc. Investor Presentation | September 2017 As of 2016 fiscal year end.
  • 52. 52 Leading U.S. Protein Producers U.S. Chicken Producers Source: Watt Poultry USA, March 2016; based on ready-to-cook pounds U.S. Fed Beef Packers Source: Cattle Buyers Weekly, 2016; based on maximum U.S. slaughter capacity (head per day) U.S. Pork Packers Source: EMI Analytics and National Hog Farmer, June 2016, as reported in National Pork Board Quick Facts; based on estimated U.S. slaughter capacity (head per day) Other 29% Tyson Foods 21% Pilgrim’s Pride 17% Sanderson Farms 8%Perdue Farms 7% Other 47% Tyson Foods 24% JBS USA 22% Cargill 19% National Beef 10% Other 25% Tyson Foods 18% Smithfield 25% JBS USA 20% Hormel 8% Tyson Foods, Inc. Investor Presentation | September 2017
  • 53. 53 FY16 Sales − $37 Billion Sales by Segment Sales by Distribution Channel Prepared Foods 20% Chicken 30% Other 1% Consumer Products 53%Food Service 32% International 11% Other 4% Beef 38% Pork 11% Tyson Foods, Inc. Investor Presentation | September 2017
  • 54. 54 FY16 International Sales FY16 International Sales $4.1 Billion* *Includes exports and in-country production Japan 17% Mexico 15% China & Hong Kong 21% South Korea 7% Canada 6% Other 30% Taiwan 4% Tyson Foods, Inc. Investor Presentation | September 2017
  • 55. 55 FY16 International Sales Chicken $1.2 Billion* Beef $2.0 Billion Brazil 6% Mexico 11% Japan 18% Mexico 12% South Korea 12% Canada 4% Canada 3% Other 48% China & Hong Kong 23% Other 17% India 6% Guatemala 3% China & Hong Kong 24% Taiwan 7% Italy 6% Tyson Foods, Inc. Investor Presentation | September 2017 *Includes exports and in-country production
  • 56. 56 FY16 International Sales Pork $848 million Prepared Foods $87 million Japan 37% Mexico 24% South Korea 4% Canada 30% Mexico 22% S. Korea 11% Japan 5% Canada 12% Other 12% China & H.K. 11% Other 32% Tyson Foods, Inc. Investor Presentation | September 2017
  • 57. Optimize cost structure Change pricing structure Upgrade value-added products Buy vs. Grow strategy Deliver high quality products and customer service 57 Chicken Segment The Road to Higher, More Stable Margins Tyson Foods, Inc. Investor Presentation | September 2017
  • 58. • FY15 – $322 million realized • FY16 – $580 million realized • FY17 – expecting approximately $675 million • Expect to achieve at least $700 million in total synergies. Due to the timing of certain projects, some synergies will fall into fiscal 2018. • Synergy Categories  Prepared Foods Improvements  Procurement  Manufacturing & Logistics  Organizational & Fiduciary 58 HSH Synergies Tyson Foods, Inc. Investor Presentation | September 2017
  • 59. Proforma Debt Maturity Profile As of 7/1/17 Fiscal Year Maturities ($MM) 0 250 500 750 1,000 1,250 1,500 1,750 2,000 2,250 '17 '18 '19 '20 '21 '22 '23 '24 '27 '33 '34 '44 '47 TFI Bonds Hillshire Bonds Term Loans Commercial Paper Pre-Payable Pre-Payable • Term loans are pre-payable at par • Excludes $18MM Tangible Equity Units amortizing note, $18MM TFI senior note due 2028, and $26MM other miscellaneous debt (e.g. capital leases, foreign debt, discount on senior notes and unamortized debt issuance costs) • $1.5 billion Revolver credit facility matures FY22; outstanding balance as of 7/1/17 was $0. • Proforma adjustments include: • 8/18/17 maturity extension of $500M tranche B term loan from April 2019 to August 2020; and • 8/23/17 issuance of $900M TFI bonds used for repayment of amounts outstanding under the term loan tranche due June 2020 Tyson Foods, Inc. Investor Presentation | September 201759
  • 61. 61 Q3 and Nine Months EPS Reconciliations In millions, except per share data (Unaudited) Tyson Foods, Inc. Investor Presentation | September 2017 Third Quarter Nine Months Ended Pretax Impact EPS Impact Pretax Impact EPS Impact 2017 2016 2017 2016 2017 2016 2017 2016 Reported net income per share attributable to Tyson $ 1.21 $ 1.25 $ 3.72 $ 3.50 Add: AdvancePierre purchase accounting and acquisition related costs (a) $ 77 $ - 0.14 - $ 77 $ - 0.14 - Add: San Diego Prepared Foods operation impairment $ - $ - - - $ 52 $ - 0.09 - Less: Tax benefit related to expected sale of a non-protein business $ - $ - (0.07) - $ - $ - (0.07) - Less: Recognition of previously unrecognized tax benefit $ - $ - - (0.04) $ - $ - - (0.07) Adjusted net income per share attributable to Tyson $ 1.28 $ 1.21 $ 3.88 $ 3.43 (a) AdvancePierre purchase accounting and acquisition related costs impacting operating income includes a $24 million purchase accounting adjustment for the fair value step-up of inventory and $35 million of acquisition related costs and $18 million of acquisition bridge financing fees. Adjusted net income per share attributable to Tyson (adjusted EPS) is presented as a supplementary measure of our financial performance that is not required by, or presented in accordance with, GAAP. We use adjusted EPS as an internal performance measurement and as one criterion for evaluating our performance relative to that of our peers. We believe adjusted EPS is meaningful to our investors to enhance their understanding of our financial performance and is frequently used by securities analysts, investors and other interested parties to compare our performance with the performance of other companies that report adjusted EPS. Further, we believe that adjusted EPS is a useful measure because it improves comparability of results of operations from period to period. Adjusted EPS should not be considered as a substitute for net income per share attributable to Tyson or any other measure of financial performance reported in accordance with GAAP. Investors should rely primarily on our GAAP results and use non-GAAP financial measures only supplementally in making investment decisions. Our calculation of adjusted EPS may not be comparable to similarly titled measures reported by other companies. Adjusted net income per share attributable to Tyson guidance is provided in this presentation on a non-GAAP basis. The Company is not able to reconcile its full-year fiscal 2017 Adjusted EPS guidance to its full-year fiscal 2017 projected GAAP guidance because certain information necessary to calculate such measure on a GAAP basis is unavailable or dependent on the timing of future events outside of our control. Therefore, because of the uncertainty and variability of the nature of the amount of future adjustments, which could be significant, the Company is unable to provide a reconciliation of this measure without unreasonable effort.
  • 62. 62 Segment Operating Income and Operating Margin Reconciliations In millions (Unaudited) Tyson Foods, Inc. Investor Presentation | September 2017 Adjusted Segment Operating Income (Loss) (for three months ended July 1, 2017) Beef Pork Chicken Prepared Foods Other Intersegment Sales Total Sales $ 4,000 $ 1,322 $ 2,870 $ 1,944 $ 85 $ (371) $ 9,850 Reported operating income (loss) 147 136 294 174 (54) - 697 Add: AdvancePierre purchase accounting and acquisition related costs (a) - - 4 21 34 - 59 Adjusted operating income (loss) $ 147 $ 136 $ 298 $ 195 $ (20) $ - $ 756 Reported operating margin % 3.7% 10.3% 10.2% 9.0% n/a n/a 7.1% Adjusted operating margin % 3.7% 10.3% 10.4% 10.0% n/a n/a 7.7% Adjusted Segment Operating Income (Loss) (for nine months ended July 1, 2017) Beef Pork Chicken Prepared Foods Other Intersegment Sales Total Sales $ 11,015 $ 3,876 $ 8,374 $ 5,590 $ 257 $ (997) $ 28,115 Reported operating income (loss) 572 524 790 451 (87) - 2,250 Add: AdvancePierre purchase accounting and acquisition related costs (a) - - 4 21 34 - 59 Add: San Diego Prepared Foods operation impairment - - - 52 - - 52 Adjusted operating income (loss) $ 572 $ 524 $ 794 $ 524 $ (53) $ - $ 2,361 Reported operating margin % 5.2% 13.5% 9.4% 8.1% n/a n/a 8.0% Adjusted operating margin % 5.2% 13.5% 9.5% 9.4% n/a n/a 8.4% (a) AdvancePierre purchase accounting and acquisition related costs impacting operating income includes a $24 million purchase accounting adjustment for the fair value step-up of inventory and $35 million of acquisition related costs. Adjusted segment operating income and adjusted segment operating margin are presented as supplementary measures of our operating performance that are not required by, or presented in accordance with, GAAP. We use adjusted segment operating income and adjusted segment operating margin as internal performance measurements and as two criteria for evaluating our performance relative to that of our peers. We believe adjusted segment operating income and adjusted segment operating margin are meaningful to our investors to enhance their understanding of our operating performance and are frequently used by securities analysts, investors and other interested parties to compare our performance with the performance of other companies that report adjusted segment operating income and adjusted segment operating margin. Further, we believe that adjusted segment operating income and adjusted segment operating margin are useful measures because they improve comparability of results of operations from period to period. Adjusted segment operating income and Adjusted segment operating margin should not be considered as a substitute for segment operating income, segment operating margin or any other measure of operating performance reported in accordance with GAAP. Investors should rely primarily on our GAAP results and use non-GAAP financial measures only supplementally in making investment decisions. Our calculation of adjusted segment operating income and adjusted segment operating margin may not be comparable to similarly titled measures reported by other companies.
  • 63. 63 EPS Reconciliations $ In millions, except per share data (Unaudited) Tyson Foods, Inc. Investor Presentation | September 2017 (a) Impact of additional week was calculated by using the fourth quarter of fiscal 2015 adjusted operating income (prior to the additional week impact) and divided by 14 weeks. Adjusted operating income and adjusted net income from continuing operations per share attributable to Tyson (adjusted EPS) are presented as supplementary measures of our financial performance that is not required by, or presented in accordance with, GAAP. We use adjusted operating income and adjusted EPS as internal performance measurements and as two criteria for evaluating our performance relative to that of our peers. We believe adjusted operating income and adjusted EPS are meaningful to our investors to enhance their understanding of our financial performance and is frequently used by securities analysts, investors and other interested parties to compare our performance with the performance of other companies that report adjusted operating income and adjusted EPS. Further, we believe that adjusted operating income and adjusted EPS are useful measures because they improve comparability of results of operations from period to period. Adjusted operating income and adjusted EPS should not be considered as a substitute for operating income or net income per share attributable to Tyson or any other measure of financial performance reported in accordance with GAAP. Investors should rely primarily on our GAAP results and use non-GAAP financial measures only supplementally in making investment decisions. Our calculation of adjusted operating income and adjusted EPS may not be comparable to similarly titled measures reported by other companies. Operating Income EPS Operating Income EPS Operating Income EPS Operating Income EPS Operating Income EPS Reported from Continuing Operations 2,833$ 4.53$ 2,169$ 2.95$ 1,430$ 2.37$ 1,375$ 2.31$ 1,286$ 1.68$ Less: Recognition of previously unrecognized tax benefit - (0.14) - (0.06) - (0.15) - - - - Insurance proceeds (net of costs) related to a legacy Hillshire Brands plant fire - - (8) (0.02) - - - - - - Gain on sale of equity securities - - - (0.03) - - - - - - Gain on sale of Mexico operations - - (161) (0.24) - - - - - - Impact of additional week (a) - - (44) (0.06) - - - - - - Gain from currency translation adjustment - - - - - - - (0.05) - - Gain on sale of interest in an equity method investment - - - - - - - - - - Reversal of reserves for foreign uncertain tax positions - - - - - - - - - - Add: China Impairment - - 169 0.41 - - - - - - Merger and integration costs - - 57 0.09 - - - - - - Prepared Foods network optimization charges - - 59 0.09 - - - - - - Denison plant closure - - 12 0.02 - - - - - - Loss related to early extinguishment of debt - - - - - - - - - 0.29 Brazil impairment/Mexico undistributed earnings tax - - - - 42 0.16 - - - - Hillshire Brands acquisition, integration and costs associated with our Prepared Foods improvement plan - - - - 137 0.37 - - - - Hillshire Brands post-closing results, purchase price accounting and costs related to a legacy Hillshire Brands plant fire - - - - 40 0.07 - - - - Hillshire Brands acquisition financing incremental interest costs and share dilution - - - - - 0.12 - - - - Adjusting from Continuing Operations 2,833$ 4.39$ 2,253$ 3.15$ 1,649$ 2.94$ 1,375$ 2.26$ 1,286$ 1.97$ 12 Months Ended October 1, 2016 October 3, 2015 September 27, 2014 September 28, 2013 September 29, 2012
  • 64. 64 Sales, Operating Income and Operating Margin Reconciliations Tyson Foods, Inc. Investor Presentation | September 2017 $ In millions (Unaudited) 2016 2015 Reported Sales 36,881$ 41,373$ Less: Impact of additional week (a) - (750) Adjusted sales 36,881$ 40,623$ Reported operating income 2,833$ 2,169$ Add: China impairment - 169 Add: Merger and integration costs - 57 Add: Prepared Foods network optimization impairment charges - 59 Add: Denison plant closure - 12 Less: Insurance proceeds (net of costs) related to a legacy Hillshire Brands plant fire - (8) Less: Gain on sale of the Mexico operation - (161) Less: Estimated impact of additional week (b) - (44) Adjusted operating income 2,833$ 2,253$ Adjusted operating margin % 7.7% 5.5% Fiscal Year (a) The estimated impact of the additional week in the 12 months of fiscal 2015 was calculated by dividing unadjusted sales for the fourth quarter of fiscal 2015 by 14 weeks. (b) Impact of additional week was calculated by using the fourth quarter of fiscal 2015 adjusted operating income (prior to the additional week impact) and divided by 14 weeks. Adjusted sales, adjusted operating income and adjusted operating margin are presented as supplementary measures of our operating performance that are not required by, or presented in accordance with, GAAP. We use adjusted sales, adjusted operating income and adjusted operating margin as internal performance measurements and as three criteria for evaluating our performance relative to that of our peers. We believe adjusted sales, adjusted operating income and adjusted operating margin are meaningful to our investors to enhance their understanding of our operating performance and are frequently used by securities analysts, investors and other interested parties to compare our performance with the performance of other companies that report adjusted sales, adjusted operating income and adjusted operating margin. Further, we believe that adjusted sales, adjusted operating income and adjusted operating margin are useful measures because they improve comparability of results of operations from period to period. Adjusted sales, adjusted operating income and adjusted operating margin should not be considered as a substitute for sales, operating income or operating margin or any other measure of operating performance reported in accordance with GAAP. Investors should rely primarily on our GAAP results and use non-GAAP financial measures only supplementally in making investment decisions. Our calculation of adjusted sales, adjusted operating income and adjusted operating margin may not be comparable to similarly titled measures reported by other companies.
  • 65. 65 Segment Operating Income Reconciliations $ In millions (Unaudited) Tyson Foods, Inc. Investor Presentation | September 2017 (a) Impact of additional week was calculated by using the fourth quarter of fiscal 2015 adjusted operating income (prior to the additional week impact) and divided by 14 weeks. Adjusted segment operating income is presented as a supplementary measure of our operating performance that is not required by, or presented in accordance with, GAAP. We use adjusted segment operating income as an internal performance measurement and as one criteria for evaluating our performance relative to that of our peers. We believe adjusted segment operating income is meaningful to our investors to enhance their understanding of our operating performance and is frequently used by securities analysts, investors and other interested parties to compare our performance with the performance of other companies that report adjusted segment operating income. Further, we believe that adjusted segment operating income is a useful measure because it improves comparability of results of operations from period to period. Adjusted segment operating income should not be considered as a substitute for segment operating income or any other measure of operating performance reported in accordance with GAAP. Investors should rely primarily on our GAAP results and use non-GAAP financial measures only supplementally in making investment decisions. Our calculation of adjusted segment operating income may not be comparable to similarly titled measures reported by other companies. Beef Pork Chicken Prepared Foods Other Total Reported operating income (loss) (66)$ 380$ 1,366$ 588$ (99)$ 2,169$ Add: China impairment - - - - 169 169 Add: Merger and integration costs - - - 10 47 57 Add: Prepared Foods network optimization charges - - - 59 - 59 Add: Denison plant closure 12 - - - - 12 Less: Insurance proceeds (net of costs) related to a legacy Hillshire Brands plant fire - - - (8) - (8) Less: Gain on sale of the Mexico operation - - - - (161) (161) Adjusted operating income prior to adjustment for additional week (54) 380 1,366 649 (44) 2,297 Less: Estimated impact of additional week (a) 1 (7) (26) (13) 1 (44) Adjusted operating income (loss) (53)$ 373$ 1,340$ 636$ (43)$ 2,253$ Adjusted Segment Operating Income (Loss) (for 12 months ended October 3, 2015)
  • 66. 66 Net Debt to Proforma Adjusted EBITDA $ in millions (Unaudited) Tyson Foods, Inc. Investor Presentation | September 2017 12 Months Ended July 1, 2017 Net income 1,775$ Less: Interest income (6) Add: Interest expense 243 Add: Income tax expense (benefit) 804 Add: Depreciation 631 Add: Amortization (a) 83 EBITDA 3,530$ Adjustments to EBITDA: Add: AdvancePierre purchase accounting and acquisition related costs (b) 77 Add: San Diego Prepared Foods operation impairment 52 Total Adjusted EBITDA 3,659$ Pro forma Adjustments to EBITDA: Add: AdvancePierre adjusted EBITDA (prior to acquisition) (c) 258 Total pro forma Adjusted EBITDA 3,917$ Total gross debt 10,824$ Less: Cash and cash equivalents (231) Less: Short-term investments (4) Total net debt 10,589$ Ratio Calculations: Gross debt/EBITDA 3.1 Net debt/EBITDA 3.0 Gross debt/Adjusted EBITDA 3.0 Net debt/Adjusted EBITDA 2.9 Gross debt/Pro forma Adjusted EBITDA 2.8 Net debt/Pro forma Adjusted EBITDA 2.7 (a) Excludes the amortization of debt discount expense of $8 million for the twelve months ended July 1, 2017, as it is included in interest expense. (b) AdvancePierre acquisition and integration costs includes $24 million of purchase accounting adjustments, $35 million acquisition related costs and $18 million of acquisition bridge financing fees. (c) Represents AdvancePierre's pre-acquisition adjusted EBITDA, for the approximate eleven months ended prior to the June 7, 2017, closing of the acquisition. These amounts are added to our Adjusted EBITDA for the twelve months ended July 1, 2017, in order for Net debt to Adjusted EBITDA to include a full twelve months of AdvancePierre results on a pro forma basis for the twelve months ended July 1, 2017. The pro forma adjusted EBITDA was derived from AdvancePierre’s EBITDA from its historical unaudited financial statements for the three months ended October 1, 2016, December 31, 2016 and April 1, 2017 as filed with the Securities and Exchange Commission, as well as AdvancePierre management unaudited financial information for the period from April 2, 2017 through the June 7, 2017, closing of the acquisition. These amounts were adjusted to remove the impact of its merger acquisition and public filing expenses and related expenses including consultant fees, accelerated stock-based compensation and other deal costs. We believe this pro forma presentation is useful and helps management, investors, and rating agencies enhance their understanding of our financial performance and to better highlight future financial trends on a comparable basis with AdvancePierre results included for the twelve months ended July 1, 2017 given the significance of the acquisition to our overall results. EBITDA is defined as net income before interest, income taxes, depreciation and amortization. Net debt to EBITDA (Adjusted EBITDA and Pro forma Adjusted EBITDA) We believe the presentation of these financial measures helps management and investors to assess our operating performance from period to period, including our ability to generate earnings sufficient to service our debt, and enhances understanding of our financial performance and highlights operational trends. These measures are widely used by investors and rating agencies in the valuation, comparison, rating and investment recommendations of companies; however, the measurements of EBITDA (and Adjusted EBITDA and Pro forma Adjusted EBITDA) and net debt to EBITDA (and to Adjusted EBITDA and Pro forma Adjusted EBITDA) may not be comparable to those of other companies, which limits their usefulness as comparative measures. EBITDA (and Adjusted EBITDA and Pro forma Adjusted EBITDA) and net debt to EBITDA (and to Adjusted EBITDA and Pro forma Adjusted EBITDA) are not measures required by or calculated in accordance with generally accepted accounting principles (GAAP) and should not be considered as substitutes for net income or any other measure of financial performance reported in accordance with GAAP or as a measure of operating cash flow or liquidity. EBITDA (and Adjusted EBITDA and Pro forma Adjusted EBITDA) is a useful tool for assessing, but is not a reliable indicator of, our ability to generate cash to service our debt obligations because certain of the items added to net income to determine EBITDA (and Adjusted EBITDA and Pro forma Adjusted EBITDA) involve outlays of cash. As a result, actual cash available to service our debt obligations will be different from EBITDA (and Adjusted EBITDA and Pro forma Adjusted EBITDA). Investors should rely primarily on our GAAP results and use non-GAAP financial measures only supplementally in making investment decisions.