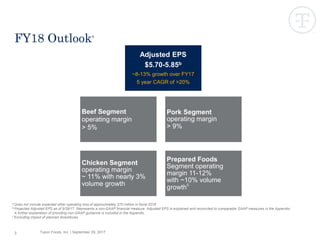
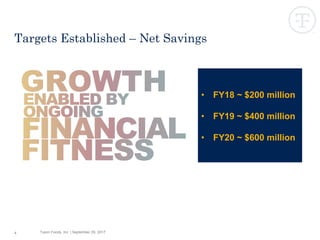
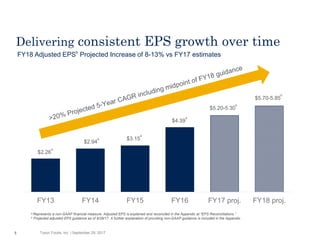
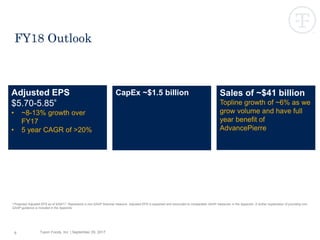
Grow. Deliver. Sustain.
September 29, 2017
Tyson Foods, Inc. | September 29, 2017
Certain information contained in this presentation may constitute forward-looking statements, including but not limited to statements relating
to expected performance and statements relating to adjusted EPS guidance and synergies estimates. These forward-looking statements are
subject to a number of factors and uncertainties which could cause our actual results and experiences to differ materially from the
anticipated results and expectations expressed in such forward-looking statements. We wish to caution readers not to place undue reliance
on any forward-looking statements, which speak only as of the date made. Among the factors that may cause actual results and experiences
to differ from anticipated results and expectations expressed in such forward-looking statements are the following: (i) the effect of, or
changes in, general economic conditions; (ii) fluctuations in the cost and availability of inputs and raw materials, such as live cattle, live
swine, feed grains (including corn and soybean meal) and energy; (iii) market conditions for finished products, including competition from
other global and domestic food processors, supply and pricing of competing products and alternative proteins and demand for alternative
proteins; (iv) successful rationalization of existing facilities and operating efficiencies of the facilities; (v) risks associated with our commodity
purchasing activities; (vi) access to foreign markets together with foreign economic conditions, including currency fluctuations, import/export
restrictions and foreign politics; (vii) outbreak of a livestock disease (such as avian influenza (AI) or bovine spongiform encephalopathy
(BSE)), which could have an adverse effect on livestock we own, the availability of livestock we purchase, consumer perception of certain
protein products or our ability to access certain domestic and foreign markets; (viii) changes in availability and relative costs of labor and
contract growers and our ability to maintain good relationships with employees, labor unions, contract growers and independent producers
providing us livestock; (ix) issues related to food safety, including costs resulting from product recalls, regulatory compliance and any related
claims or litigation; (x) changes in consumer preference and diets and our ability to identify and react to consumer trends; (xi) significant
marketing plan changes by large customers or loss of one or more large customers; (xii) adverse results from litigation; (xiii) impacts on our
operations caused by factors and forces beyond our control, such as natural disasters, fire, bioterrorism, pandemics or extreme weather;
(xiv) risks associated with leverage, including cost increases due to rising interest rates or changes in debt ratings or outlook; (xv)
compliance with and changes to regulations and laws (both domestic and foreign), including changes in accounting standards, tax laws,
environmental laws, agricultural laws and occupational, health and safety laws; (xvi) our ability to make effective acquisitions or joint
ventures and successfully integrate newly acquired businesses into existing operations; (xvii) cyber incidents, security breaches or other
disruptions of our information technology systems; (xviii) effectiveness of advertising and marketing programs;(xix) our ability to fully realize
expected cost savings or operating efficiencies associated with our strategic initiatives or restructuring programs; and(xx) those factors listed
under Item 1A. “Risk Factors” included in our Annual Report filed on Form 10-K for the period ended October 1, 2016 and subsequently filed
Quarterly Reports on Form 10-Q and Current Reports on Form 8-K.
2
Forward-Looking Statements
Tyson Foods, Inc. | September 29, 20173
FY18 Outlooka
Beef Segment
operating margin
> 5%
Pork Segment
operating margin
> 9%
Chicken Segment
operating margin
~ 11% with nearly 3%
volume growth
Prepared Foods
Segment operating
margin 11-12%
with ~10% volume
growth
c
Adjusted EPS
$5.70-5.85b
~8-13% growth over FY17
5 year CAGR of >20%
a Does not include expected other operating loss of approximately $70 million in fiscal 2018
b Projected Adjusted EPS as of 9/29/17. Represents a non-GAAP financial measure. Adjusted EPS is explained and reconciled to comparable GAAP measures in the Appendix.
A further explanation of providing non-GAAP guidance is included in the Appendix.
c Excluding impact of planned divestitures
Tyson Foods, Inc. | September 29, 20174
• FY18 ~ $200 million
• FY19 ~ $400 million
• FY20 ~ $600 million
Targets Established – Net Savings
Tyson Foods, Inc. | September 29, 2017
Delivering consistent EPS growth over time
a Represents a non-GAAP financial measure. Adjusted EPS is explained and reconciled in the Appendix at “EPS Reconciliations.”
b Projected adjusted EPS guidance as of 9/29/17. A further explanation of providing non-GAAP guidance is included in the Appendix.
FY18 Adjusted EPSb
Projected Increase of 8-13% vs FY17 estimates
FY13 FY14 FY15 FY16 FY17 proj. FY18 proj.
$3.15
a
$2.26
a
$2.94
a
$4.39
a
$5.20-5.30
b
$5.70-5.85
b
5
Tyson Foods, Inc. | September 29, 20176
FY18 Outlook
Adjusted EPS
$5.70-5.85
a
• ~8-13% growth over
FY17
• 5 year CAGR of >20%
Sales of ~$41 billion
Topline growth of ~6% as we
grow volume and have full
year benefit of
AdvancePierre
CapEx ~$1.5 billion
a Projected Adjusted EPS as of 9/29/17. Represents a non-GAAP financial measure. Adjusted EPS is explained and reconciled to comparable GAAP measures in the Appendix. A further explanation of providing non-
GAAP guidance is included in the Appendix.
Grow.
—
Our businesses
through
differentiated
capabilities
Deliver.
—
Ongoing financial
fitness through
continuous
improvement
Sustain.
—
Our company
and our
world for future
generations
Appendix
Tyson Foods, Inc. | September 29, 20179
EPS Reconciliations
$ in millions, except per share data
(Unaudited)
(a) Impact of additional week was calculated by using the fourth quarter of fiscal 2015 adjusted operating income (prior to the additional week impact) and divided by 14 weeks.
Adjusted operating income and adjusted net income from continuing operations per share attributable to Tyson (adjusted EPS) are presented as supplementary measures of our financial performance
that is not required by, or presented in accordance with, GAAP. We use adjusted operating income and adjusted EPS as internal performance measurements and as two criteria for evaluating our
performance relative to that of our peers. We believe adjusted operating income and adjusted EPS are meaningful to our investors to enhance their understanding of our financial performance and is
frequently used by securities analysts, investors and other interested parties to compare our performance with the performance of other companies that report adjusted operating income and adjusted
EPS. Further, we believe that adjusted operating income and adjusted EPS are useful measures because they improve comparability of results of operations from period to period. Adjusted operating
income and adjusted EPS should not be considered as a substitute for operating income or net income per share attributable to Tyson or any other measure of financial performance reported in
accordance with GAAP. Investors should rely primarily on our GAAP results and use non-GAAP financial measures only supplementally in making investment decisions. Our calculation of adjusted
operating income and adjusted EPS may not be comparable to similarly titled measures reported by other companies.
The company plans to provide GAAP results in its fourth quarter earnings report scheduled for Nov. 13; however, the company is unable to reconcile its full-year fiscal 2017 and 2018 adjusted EPS
guidance to its full-year fiscal 2017 and 2018 projected GAAP guidance because certain information necessary to calculate such measures on a GAAP basis is unavailable or dependent on the timing of
future events outside of our control. These potential items include, but are not limited to, gains or losses associated the previously announced dispositions of three non-protein businesses, potential
impairments of long-lived assets and intangible assets, and additional expense or modifications to its restructuring plan and other charges. Therefore, because of the uncertainty and variability of the
nature of the amount of future adjustments, which could be significant, the company is unable to provide a reconciliation of this measure without unreasonable efforts.
Operating
Income EPS
Operating
Income EPS
Operating
Income EPS
Operating
Income EPS
Reported from Continuing Operations 2,833$ 4.53$ 2,169$ 2.95$ 1,430$ 2.37$ 1,375$ 2.31$
Less:
Recognition of previously unrecognized tax benefit - (0.14) - (0.06) - (0.15) - -
Insurance proceeds (net of costs) related to a legacy Hillshire Brands
plant fire
- - (8) (0.02) - - - -
Gain on sale of equity securities - - - (0.03) - - - -
Gain on sale of Mexico operations - - (161) (0.24) - - - -
Impact of additional week (a) - - (44) (0.06) - - - -
Gain from currency translation adjustment - - - - - - - (0.05)
Gain on sale of interest in an equity method investment - - - - - - - -
Reversal of reserves for foreign uncertain tax positions - - - - - - - -
Add:
China Impairment - - 169 0.41 - - - -
Merger and integration costs - - 57 0.09 - - - -
Prepared Foods network optimization charges - - 59 0.09 - - - -
Denison plant closure - - 12 0.02 - - - -
Loss related to early extinguishment of debt - - - - - - - -
Brazil impairment/Mexico undistributed earnings tax - - - - 42 0.16 - -
Hillshire Brands acquisition, integration and costs associated with
our Prepared Foods improvement plan
- - - - 137 0.37 - -
Hillshire Brands post-closing results, purchase price accounting and
costs related to a legacy Hillshire Brands plant fire
- - - - 40 0.07 - -
Hillshire Brands acquisition financing incremental interest costs and
share dilution
- - - - - 0.12 - -
Adjusted from Continuing Operations 2,833$ 4.39$ 2,253$ 3.15$ 1,649$ 2.94$ 1,375$ 2.26$
12 Months Ended
October 1, 2016 October 3, 2015 September 27, 2014 September 28, 2013

Geo ff call slides final 092917

  • 1.
  • 2.
    Tyson Foods, Inc.| September 29, 2017 Certain information contained in this presentation may constitute forward-looking statements, including but not limited to statements relating to expected performance and statements relating to adjusted EPS guidance and synergies estimates. These forward-looking statements are subject to a number of factors and uncertainties which could cause our actual results and experiences to differ materially from the anticipated results and expectations expressed in such forward-looking statements. We wish to caution readers not to place undue reliance on any forward-looking statements, which speak only as of the date made. Among the factors that may cause actual results and experiences to differ from anticipated results and expectations expressed in such forward-looking statements are the following: (i) the effect of, or changes in, general economic conditions; (ii) fluctuations in the cost and availability of inputs and raw materials, such as live cattle, live swine, feed grains (including corn and soybean meal) and energy; (iii) market conditions for finished products, including competition from other global and domestic food processors, supply and pricing of competing products and alternative proteins and demand for alternative proteins; (iv) successful rationalization of existing facilities and operating efficiencies of the facilities; (v) risks associated with our commodity purchasing activities; (vi) access to foreign markets together with foreign economic conditions, including currency fluctuations, import/export restrictions and foreign politics; (vii) outbreak of a livestock disease (such as avian influenza (AI) or bovine spongiform encephalopathy (BSE)), which could have an adverse effect on livestock we own, the availability of livestock we purchase, consumer perception of certain protein products or our ability to access certain domestic and foreign markets; (viii) changes in availability and relative costs of labor and contract growers and our ability to maintain good relationships with employees, labor unions, contract growers and independent producers providing us livestock; (ix) issues related to food safety, including costs resulting from product recalls, regulatory compliance and any related claims or litigation; (x) changes in consumer preference and diets and our ability to identify and react to consumer trends; (xi) significant marketing plan changes by large customers or loss of one or more large customers; (xii) adverse results from litigation; (xiii) impacts on our operations caused by factors and forces beyond our control, such as natural disasters, fire, bioterrorism, pandemics or extreme weather; (xiv) risks associated with leverage, including cost increases due to rising interest rates or changes in debt ratings or outlook; (xv) compliance with and changes to regulations and laws (both domestic and foreign), including changes in accounting standards, tax laws, environmental laws, agricultural laws and occupational, health and safety laws; (xvi) our ability to make effective acquisitions or joint ventures and successfully integrate newly acquired businesses into existing operations; (xvii) cyber incidents, security breaches or other disruptions of our information technology systems; (xviii) effectiveness of advertising and marketing programs;(xix) our ability to fully realize expected cost savings or operating efficiencies associated with our strategic initiatives or restructuring programs; and(xx) those factors listed under Item 1A. “Risk Factors” included in our Annual Report filed on Form 10-K for the period ended October 1, 2016 and subsequently filed Quarterly Reports on Form 10-Q and Current Reports on Form 8-K. 2 Forward-Looking Statements
  • 3.
    Tyson Foods, Inc.| September 29, 20173 FY18 Outlooka Beef Segment operating margin > 5% Pork Segment operating margin > 9% Chicken Segment operating margin ~ 11% with nearly 3% volume growth Prepared Foods Segment operating margin 11-12% with ~10% volume growth c Adjusted EPS $5.70-5.85b ~8-13% growth over FY17 5 year CAGR of >20% a Does not include expected other operating loss of approximately $70 million in fiscal 2018 b Projected Adjusted EPS as of 9/29/17. Represents a non-GAAP financial measure. Adjusted EPS is explained and reconciled to comparable GAAP measures in the Appendix. A further explanation of providing non-GAAP guidance is included in the Appendix. c Excluding impact of planned divestitures
  • 4.
    Tyson Foods, Inc.| September 29, 20174 • FY18 ~ $200 million • FY19 ~ $400 million • FY20 ~ $600 million Targets Established – Net Savings
  • 5.
    Tyson Foods, Inc.| September 29, 2017 Delivering consistent EPS growth over time a Represents a non-GAAP financial measure. Adjusted EPS is explained and reconciled in the Appendix at “EPS Reconciliations.” b Projected adjusted EPS guidance as of 9/29/17. A further explanation of providing non-GAAP guidance is included in the Appendix. FY18 Adjusted EPSb Projected Increase of 8-13% vs FY17 estimates FY13 FY14 FY15 FY16 FY17 proj. FY18 proj. $3.15 a $2.26 a $2.94 a $4.39 a $5.20-5.30 b $5.70-5.85 b 5
  • 6.
    Tyson Foods, Inc.| September 29, 20176 FY18 Outlook Adjusted EPS $5.70-5.85 a • ~8-13% growth over FY17 • 5 year CAGR of >20% Sales of ~$41 billion Topline growth of ~6% as we grow volume and have full year benefit of AdvancePierre CapEx ~$1.5 billion a Projected Adjusted EPS as of 9/29/17. Represents a non-GAAP financial measure. Adjusted EPS is explained and reconciled to comparable GAAP measures in the Appendix. A further explanation of providing non- GAAP guidance is included in the Appendix.
  • 7.
    Grow. — Our businesses through differentiated capabilities Deliver. — Ongoing financial fitnessthrough continuous improvement Sustain. — Our company and our world for future generations
  • 8.
  • 9.
    Tyson Foods, Inc.| September 29, 20179 EPS Reconciliations $ in millions, except per share data (Unaudited) (a) Impact of additional week was calculated by using the fourth quarter of fiscal 2015 adjusted operating income (prior to the additional week impact) and divided by 14 weeks. Adjusted operating income and adjusted net income from continuing operations per share attributable to Tyson (adjusted EPS) are presented as supplementary measures of our financial performance that is not required by, or presented in accordance with, GAAP. We use adjusted operating income and adjusted EPS as internal performance measurements and as two criteria for evaluating our performance relative to that of our peers. We believe adjusted operating income and adjusted EPS are meaningful to our investors to enhance their understanding of our financial performance and is frequently used by securities analysts, investors and other interested parties to compare our performance with the performance of other companies that report adjusted operating income and adjusted EPS. Further, we believe that adjusted operating income and adjusted EPS are useful measures because they improve comparability of results of operations from period to period. Adjusted operating income and adjusted EPS should not be considered as a substitute for operating income or net income per share attributable to Tyson or any other measure of financial performance reported in accordance with GAAP. Investors should rely primarily on our GAAP results and use non-GAAP financial measures only supplementally in making investment decisions. Our calculation of adjusted operating income and adjusted EPS may not be comparable to similarly titled measures reported by other companies. The company plans to provide GAAP results in its fourth quarter earnings report scheduled for Nov. 13; however, the company is unable to reconcile its full-year fiscal 2017 and 2018 adjusted EPS guidance to its full-year fiscal 2017 and 2018 projected GAAP guidance because certain information necessary to calculate such measures on a GAAP basis is unavailable or dependent on the timing of future events outside of our control. These potential items include, but are not limited to, gains or losses associated the previously announced dispositions of three non-protein businesses, potential impairments of long-lived assets and intangible assets, and additional expense or modifications to its restructuring plan and other charges. Therefore, because of the uncertainty and variability of the nature of the amount of future adjustments, which could be significant, the company is unable to provide a reconciliation of this measure without unreasonable efforts. Operating Income EPS Operating Income EPS Operating Income EPS Operating Income EPS Reported from Continuing Operations 2,833$ 4.53$ 2,169$ 2.95$ 1,430$ 2.37$ 1,375$ 2.31$ Less: Recognition of previously unrecognized tax benefit - (0.14) - (0.06) - (0.15) - - Insurance proceeds (net of costs) related to a legacy Hillshire Brands plant fire - - (8) (0.02) - - - - Gain on sale of equity securities - - - (0.03) - - - - Gain on sale of Mexico operations - - (161) (0.24) - - - - Impact of additional week (a) - - (44) (0.06) - - - - Gain from currency translation adjustment - - - - - - - (0.05) Gain on sale of interest in an equity method investment - - - - - - - - Reversal of reserves for foreign uncertain tax positions - - - - - - - - Add: China Impairment - - 169 0.41 - - - - Merger and integration costs - - 57 0.09 - - - - Prepared Foods network optimization charges - - 59 0.09 - - - - Denison plant closure - - 12 0.02 - - - - Loss related to early extinguishment of debt - - - - - - - - Brazil impairment/Mexico undistributed earnings tax - - - - 42 0.16 - - Hillshire Brands acquisition, integration and costs associated with our Prepared Foods improvement plan - - - - 137 0.37 - - Hillshire Brands post-closing results, purchase price accounting and costs related to a legacy Hillshire Brands plant fire - - - - 40 0.07 - - Hillshire Brands acquisition financing incremental interest costs and share dilution - - - - - 0.12 - - Adjusted from Continuing Operations 2,833$ 4.39$ 2,253$ 3.15$ 1,649$ 2.94$ 1,375$ 2.26$ 12 Months Ended October 1, 2016 October 3, 2015 September 27, 2014 September 28, 2013