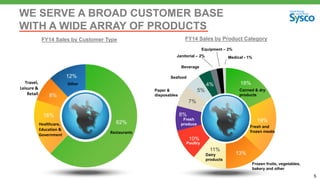
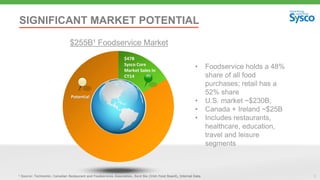
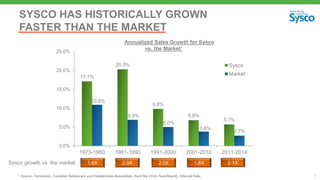
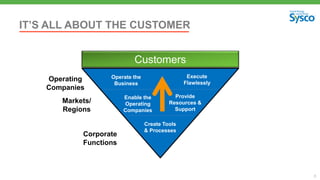
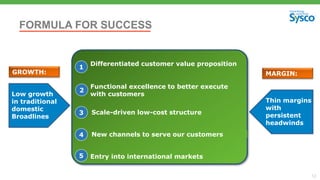
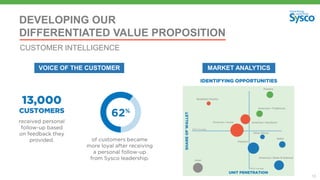
SlideShare a Scribd company logo
1 of 45
Download to read offline
2015
CAGNY Conference
February 19, 2015
1
PRESIDENT AND CEO
BILL DELANEY
2
3
FORWARD LOOKING STATEMENT
Statements made in this presentation that look forward in time or that express management’s beliefs, expectations or hopes are forward-looking statements within the meaning of the Private Securities Litigation Reform Act
of 1995. Such forward-looking statements reflect the views of management at the time such statements are made and are subject to a number of risks, uncertainties, estimates, and assumptions that may cause actual results
to differ materially from current expectations. These statements include our plans and expectations related to and the benefits and expected timing of our business transformation initiatives, expectations and efforts
regarding management of operating expenses, our plans and expectations related to and the benefits of the proposed merger with US Foods, and our plans and expectations related to acquisitions. These statements also
include expectations regarding our sales growth, operating expense growth and operating performance results, trends in our locally-managed business and overall sales mix, market conditions and trends, growth
opportunities, inflation, fuel expense, interest expense, our expense management and cost per case performance, share repurchases, business transformation costs and expenses, investments in technology resources, free
cash flow and capital expenditures. The success of our business transformation initiatives and expectations regarding our operating performance are subject to the general risks associated with our business, including the
risks of interruption of supplies due to lack of long-term contracts, severe weather, crop conditions, work stoppages, intense competition, technology disruptions, dependence on large regional and national customers,
inflation risks, the impact of fuel prices, adverse publicity, and labor issues. Risks and uncertainties also include risks impacting the economy generally, including the risks that the current general economic conditions will
deteriorate, or consumer confidence in the economy may not increase and decreases in consumer spending, particularly on food-away-from-home, may not reverse. Market conditions may not improve as anticipated. If sales
from our locally managed customers do not grow at the same rate as sales from regional and national customers, our gross margins may continue to decline. Our ability to meet our long-term strategic objectives to grow the
profitability of our business depends largely on the success of our Business Transformation Project. There are various risks related to the project, including the risk that the project and its various components may not provide
the expected benefits in our anticipated time frame, if at all, and may prove costlier than expected; the risk that the actual costs of the ERP system may be greater or less than currently expected because we have
encountered, and may continue to encounter, the need for changes in design or revisions of the project calendar and budget, including the incurrence of expenses at an earlier or later time than currently anticipated; the risk
that our business and results of operations may be adversely affected if we experience delays in deployment, operating problems, cost overages or limitations on the extent of the business transformation during the ERP
implementation process; and the risk of adverse effects to our business, results of operations and liquidity if the ERP system, and the associated process changes, do not prove to be cost effective or do not result in the cost
savings and other benefits at the levels that we anticipate. Planned deployments in the coming quarters are dependent upon the success of the ERP system and the updates at the current locations. We may experience
delays, cost overages or operating problems when we deploy the system to additional locations. Our plans related to and the timing of the implementation of the ERP system, as well as the cost transformation and category
management initiatives, are subject to change at any time based on management’s subjective evaluation of our overall business needs. We may fail to realize anticipated benefits, particularly expected cost savings, from our
cost transformation initiative. If we are unable to realize the anticipated benefits from our cost cutting efforts, we could become cost disadvantaged in the marketplace, and our competitiveness and our profitability could
decrease. We may also fail to realize the full anticipated benefits of our category management initiative, and may be unable to successfully execute the initiative in our anticipated timeline. Capital expenditures may vary
from those projected based on changes in business plans and other factors, including risks related to the implementation of our business transformation initiatives and our regional distribution centers, the timing and
successful completions of acquisitions, construction schedules and the possibility that other cash requirements could result in delays or cancellations of capital spending. Periods of high inflation, either overall or in certain
product categories, can have a negative impact on us and our customers, as high food costs can reduce consumer spending in the food-away-from-home market, and may negatively impact our sales, gross profit, operating
income and earnings. Expanding into international markets presents unique challenges and risks, including compliance with local laws, regulations and customs and the impact of local political and economic conditions, and
such expansion efforts may not be successful. Any business that we acquire may not perform as expected, and we may not realize the anticipated benefits of our acquisitions. The consummation of the merger with US Foods
is subject to regulatory approval and the satisfaction of certain conditions, and we cannot predict whether the necessary conditions will be satisfied or waived and the requisite regulatory approvals received. We also may be
subject to potential antitrust or similar lawsuits at the federal or state level. Sysco and US Foods have entered into an agreement to sell 11 US Foods’ facilities to Performance Food Group contingent on closing the merger;
however, certain further actions may be required to obtain regulatory approval for the merger, which could negatively impact the projected benefits of the merger. Termination of the merger agreement with US Foods could
require Sysco to make a termination payment of $300 million, which could adversely impact Sysco’s stock price, liquidity and financial condition. As a result of uncertainties surrounding the proposed merger, prospective
suppliers and customers may delay or decline to enter into agreements with us, and we may also lose current suppliers and customers, and fail to retain key employees. The pending merger and our current pre-merger
integration planning efforts may divert our management’s attention from day-to-day business operations and the execution of our business transformation initiatives, which could result in performance shortfalls. Integration
of the businesses of Sysco and US Foods may be more difficult, costly or time consuming than expected, and the merger may not result in any or all of the anticipated benefits, including cost synergies. We may fail to retain
some of US Foods’ vendors and customers after the proposed merger. In relation to the merger, we have issued additional debt and our level of indebtedness and the terms of our indebtedness could adversely affect our
business and liquidity position. For a discussion of additional factors impacting Sysco’s business, see the Company’s Annual Report on Form 10-K for the year ended June 28, 2014, as filed with the Securities and Exchange
Commission, and the Company’s subsequent filings with the SEC. Sysco does not undertake to update its forward-looking statements except as required by applicable law.
4
THE GLOBAL LEADER
IN FOODSERVICE DISTRIBUTION
• Approaching $50 billion in annualized sales
• 425,000 customers
• 50,000 associates
• 400,000 products -- 40,000 Sysco Branded
• Expanding presence beyond the United States
62%
18%
8%
12%
5
WE SERVE A BROAD CUSTOMER BASE
WITH A WIDE ARRAY OF PRODUCTS
FY14 Sales by Customer Type
18%
19%
13%
11%
10%
8%
7%
5%
4%
Canned & dry
products
Fresh and
frozen meats
Frozen fruits, vegetables,
bakery and other
Dairy
products
Poultry
Fresh
produce
Paper &
disposables
Seafood
Beverage
Janitorial – 2% Medical - 1%
Equipment – 2%
Other
Healthcare,
Education &
Government
Travel,
Leisure &
Retail
Restaurants
FY14 Sales by Product Category
SIGNIFICANT MARKET POTENTIAL
• Foodservice holds a 48%
share of all food
purchases; retail has a
52% share
• U.S. market ~$230B;
• Canada + Ireland ~$25B
• Includes restaurants,
healthcare, education,
travel and leisure
segments
6
Potential
$47B
Sysco Core
Market Sales in
CY14
$255B¹ Foodservice Market
1 Source: Technomic, Canadian Restaurant and Foodservices Association, Bord Bia (Irish Food Board), Internal Data
7
SYSCO HAS HISTORICALLY GROWN
FASTER THAN THE MARKET
2.9X 2.0X 1.8X1.6X
17.1%
20.3%
9.8%
6.8%
5.7%
10.9%
6.9%
5.0%
3.8%
2.7%
0.0%
5.0%
10.0%
15.0%
20.0%
25.0%
1973-1980 1981-1990 1991-2000 2001-2010 2011-2014
Sysco
Market
2.1XSysco growth vs. the market
Annualized Sales Growth for Sysco
vs. the Market¹
1 Source: Technomic, Canadian Restaurant and Foodservices Association, Bord Bia (Irish Food Board), Internal Data
8
IT’S ALL ABOUT THE CUSTOMER
Operating
Companies
Markets/
Regions
Corporate
Functions
Operate the
Business
Execute
Flawlessly
Enable the
Operating
Companies
Provide
Resources &
Support
Create Tools
& Processes
Customers
9
OUR STRATEGY
Implement an
enterprise-wide
talent
management
process
Partnership Productivity Products Expansion People
Profoundly
enrich the
experience of
doing business
with Sysco
Continuously
improve
productivity in
all areas of our
business
Expand our
offerings through
a customer-
centric innovation
program
Explore, assess
and pursue new
businesses and
markets
10
PROPOSED SYSCO-US FOODS MERGER
Lower costs,
differentiated
products and
services, better
business solutions
Strong strategic rationale
Synergies are
substantial – even
after reflecting
divestiture impact
Strong adjusted
EPS accretion and
substantial cash
flow
Substantial Customer
Benefits
Operating & Supply
Chain Efficiencies
Enhanced
Shareholder Value
11
RECENT MERGER DEVELOPMENT
• FTC Commissioners have voted to block the Sysco-US Foods transaction
– The narrow 3-2 vote demonstrates a lack of consensus within the
Commission
• We believe the FTC’s decision is based on an erroneous view of the competitive
dynamics of the foodservice distribution industry
– Customers of all types have access to food distribution services from a wide
variety of companies and multiple channels
– Sysco delivered a substantial divestiture package
• The merger will allow Sysco to lower costs for customers, deliver better service
and improve selection across all product segments
– This will increase competition across the entire foodservice distribution
industry to the benefit of customers
We are confident this merger is highly procompetitive and look
forward to our day in court
12
FORMULA FOR SUCCESS
2
Functional excellence to better execute
with customers
Scale-driven low-cost structure
1
3
Differentiated customer value proposition
4 New channels to serve our customers
Entry into international markets5
MARGIN:
Low growth
in traditional
domestic
Broadlines
Thin margins
with
persistent
headwinds
GROWTH:
EVP AND PRESIDENT, FOODSERVICE OPERATIONS
13
TOM BENÉ
14
BRINGING THE
FORMULA FOR SUCCESS TO MARKET
DEVELOPING
MARKETING AND SELLING
DELIVERING
OUR DIFFERENTIATED VALUE PROPOSITION
15
VOICE OF THE CUSTOMER
DEVELOPING OUR
DIFFERENTIATED VALUE PROPOSITION
16
DEVELOPING OUR
DIFFERENTIATED VALUE PROPOSITION
CUSTOMER INTELLIGENCE
VOICE OF THE CUSTOMER MARKET ANALYTICS
APPROACH TO INNOVATION
17
DEVELOPING OUR
DIFFERENTIATED VALUE PROPOSITION
INNOVATIVE AND DIFFERENTIATED PRODUCTS
LEARN
Market Insights
Improve the business
GROWTH
DEFINE
Category Strategy
OPTIMIZE
Optimal Assortment
Implementation &
Tailoring Selling
ACTIVATE
Strategic Sourcing
DECIDE
CATEGORY MANAGEMENT PROCESS
18
MARKETING AND SELLING OUR
DIFFERENTIATED VALUE PROPOSITION
BUSINESS SOLUTIONS TO HELP OUR CUSTOMERS
MENU ANALYSIS & DESIGN EMPLOYEE TRAINING CUSTOMER MARKETING TOOLS
19
MARKETING AND SELLING OUR
DIFFERENTIATED VALUE PROPOSITION
CUSTOMER ENGAGEMENT MODEL
79%
of customers who’ve
ordered once, order again
20%
In the last 30 days over
previous period
Orders are up
Customer
Experience
Email
Leads Gen
Chat
Text
Multi-lingual
Social media
MAMOBILE
ISR-served accounts
up with improved
customer experience
10%
INSIDE
SALES
20
MARKETING AND SELLING OUR
DIFFERENTIATED VALUE PROPOSITION
BUILDING CAPABILITY & MANAGING PERFORMANCE
SELLING MODEL REVENUE MANAGEMENT
21
MARKETING AND SELLING OUR
DIFFERENTIATED VALUE PROPOSITION
HISPANIC SEGMENT APPROACH
HISPANIC PILOT SALES GROWTH ($)
22
MARKETING AND SELLING OUR
DIFFERENTIATED VALUE PROPOSITION
JOINT BUSINESS PLANNING PROCESS
23
DELIVERING OUR
DIFFERENTIATED VALUE PROPOSITION
EASE OF DOING BUSINESS
MY SYSCO TRUCK
24
DELIVERING OUR
DIFFERENTIATED VALUE PROPOSITION
IMPROVING OUR OPERATIONS
WAREHOUSE AUTOMATIONBUILDING CAPABILITIES
25
DELIVERING OUR
DIFFERENTIATED VALUE PROPOSITION
CONTINUOUS IMPROVEMENT PROCESS
CHRIS KREIDLER
Executive Vice President and CFO
26
27
BUSINESS TRANSFORMATION
We began a three year journey in 2012
Reduce cost structure
by $300-350 million
annually
Lower product costs by
$250-300 million
annually
Successfully implement
technology platform
Benefits: $550-650 million annually
Anticipated ramp up
of benefits
FY13
FY14
FY15
~ 25%
~ 50-70%
100%
28
BUSINESS TRANSFORMATION ACHIEVEMENTS
After two and half years, we have exceeded our target
Original Target: $550-650MM
 Completed strategic sales
initiatives; retirement plan &
IT function restructuring
 Launched new warehouse
scorecard to drive
performance
 Introduced application of
best practices and new
tools to manage labor and
operating expenses more
effectively
 Made significant progress
implementing routing and
fleets optimization initiative
 Developed teams and
processes for category
management
 Enhanced CatMan
capabilities, including new
sales tools, enhanced
customer service and
increased field
communications/coord.
 All CatMan categories,
representing $15B of
spend, to be launched by
end of FY15
 FY2016 and beyond
CatMan continues as part
of our ongoing processes
Reduce Cost Structure Lower Product Costs
FY14
FY13
High-end
of 3-year
target
Over
$700MM
achieved
through
1H FY15
FY15
29
GROSS PROFIT PERFORMANCE IMPROVING
1.8%
0.7%
2.7%
4.0%
6.0% 6.1%
-100
-75
-50
-25
0
25
50
75
100
0.0%
1.0%
2.0%
3.0%
4.0%
5.0%
6.0%
7.0%
1Q14 2Q14 3Q14 4Q14 1Q15 2Q15
YOY % Change in Gross Profit $ and Gross Margin (Bps)
Gross Profit Growth ($) Gross Margin Change (Bps)
Change in GM bpsChange in GP %
30
SOLID OPERATIONAL PERFORMANCE IN 1H FY15
 Business environment remains extremely competitive
 Encouraged by solid performance in 1H15
 We have many opportunities to enhance customer experience, strengthen
operating performance and increase profitability
Demonstrates business transformation is working
1 See Non-GAAP reconciliations at the end of this presentation.
Adjusted1 Reported
$MM, except per share data 1H FY15
YOY %
Change
1H FY15
YOY %
Change
Sales $24,532 6.9% $24,532 6.9%
Gross Profit 4,274 6.0% 4,274 6.0%
Operating Expenses 3,369 6.4% 3,493 9.1%
Operating Income 905 4.7% 781 (5.9%)
Net Earnings 554 6.8% 437 (12.0%)
Diluted EPS $0.93 5.7% $0.73 (13.1%)
31
CASH FLOW
Core business continues to generate significant cash flow
($MM) 1H FY15 1H FY14 % Chg FY14 FY13 % Chg
Cash Flow from Ops $452 $458 (1%) $1,493 $1,512 (1%)
CapEx, net (296) 247) 20% (497) (496) 0%
Free Cash Flow 157 211 (26)% 995 1,015 (2%)
Adj. Free Cash Flow
1
$324 $217 50% $1,080 $1,050 3%
1) See non-GAAP reconciliations
Adjusted free cash flow excludes integration planning costs and a
timing mismatch in our pension contributions
$0.3
$0.0
$0.5 $0.5
$1.0
2015 2016 2017 2018 2019 2020+
Debt Maturities
$0.9
$1.1
$1.4
$1.5 $1.5
FY10 FY11 FY12 FY13 FY14
Cash Flow from Operations
32
CAPITAL ALLOCATION
Reinvest in the Business
• Fleet and Facilities
• International and small
acquisitions
• Other strategic initiatives
• Merger integration
Return Value to
Shareholders
• Dividend target: 40-50%
payout of adjusted EPS
• Share repurchase: keep
diluted shares outstanding
relatively constant
Minimal Near-Term Debt
Maturities
($Billions)
Substantial Cash Flows
($Billions)
$5.2
33
A STRONG HISTORY OF DIVIDEND GROWTH
Dividends paid per calendar year
$0.00
$0.20
$0.40
$0.60
$0.80
$1.00
$1.20
Sysco has paid a dividend every
quarter since its founding in 1970
FY13 FY14 FY15 EST.
Net Capex ($MM)
Facilities Fleet IT-Other IT-Merger
34
STRATEGIC INVESTMENTS IN CAPITAL EXPENDITURES
FY14 FY15
Gross Capex - 1H FY15 ($MM)
$270
$298 $500-550
Increase in 1H15 capex driven by
timing of fleet purchases and IT-
related merger integration spend
Long-term objective: net capex at 1.0-
1.2% of sales
$497$496$270
$298
35
PROPOSED SYSCO-US FOODS MERGER
Lower costs,
differentiated
products and
services, better
business solutions
Strong strategic rationale
Synergies are
substantial – even
after reflecting
divestiture impact
Strong adjusted
EPS accretion and
substantial cash
flow
Substantial Customer
Benefits
Operating & Supply
Chain Efficiencies
Enhanced
Shareholder Value
Gross
Synergies • $1,000MM
Impact from:
divestitures,
potential customer
disruption
• ($400MM)
Net
Operations
Synergies
• $600MM
36
MERGER SYNERGIES REMAIN ATTRACTIVE,
EVEN AFTER DIVESTITURES
Interest expense $115
NOLs, to be used in
first year
$150
Transaction-related
amortization ($110)
Operational Synergies (After Four Years) Financial Synergies
$600 million of annual net operational synergies to be realized over four years
$MM
37
SUBSTANTIAL SYNERGIES TO BE ACHIEVED
Merchandising
30-40%
Supply Chain &
Distribution
25-35%
Sales & Marketing
5-15%
Corporate/G&A
15-25%
• Capture scale advantages of combined company by implementing
robust category management process
• Apply best capabilities of both companies
• Apply best-of-both practices to enhance operational efficiencies
• Selectively streamline footprint where over-capacity exists
• Optimize investment over larger physical footprint
• Capitalize on procurement savings opportunities for fleet and
indirect spend
• Leverage infrastructure to reduce redundant marketing expense
• Streamline sales and marketing organization through normal attrition
• Drive organizational efficiency and eliminate redundancy
• Leverage new scale and size to achieve lower total cost for third-
party services
$600 million
of annual net
operational
synergies to
be realized
over four
years
38
MATERIAL SYNERGIES BEGIN TO
ACCUMULATE IN FY17
Percentage of Annual Run Rates Synergies Achieved by Year
FY16 FY17 FY18 FY19
0-10%
40-50%
70-80%
100%
Note- Assumes FYE 2015 merger close, for illustrative purposes
$600 million
of annual net
operational
synergies to
be realized
over four
years
65% of net operational synergies impact operating expense, while 35% impact COGS
FY16 FY17 FY18 FY19
39
POST-CLOSE MERGER INTEGRATION
EXPENSE AND CAPITAL
FY16 FY17 FY18 FY19
Expense: $700-800 million
45-55%
20-30%
10-20%
0-10%
50-60%
25-35%
5-15%
0-10%
Note- Assumes FYE 2015 merger close, for illustrative purposes
Incremental Merger Expense:
$700-800MM
Incremental Merger Capital:
$300-400MM
While gross merger costs will be higher, the charts above show the amounts
that will be incremental to our G&A and capital run rates
40
CONCLUSION
• Pleased with our top-line and gross profit performance
– Investment in business transformation initiatives contributed to this
achievement
• Our focus:
– Improving the consistency of our operational execution
– Successfully rolling out our business transformation initiatives
– Focused on developing new initiatives to enhance customer experience
– Further developing our plans to integrate Sysco and US Foods
• These strategic actions are the right priorities to both achieve our Vision and
enhance profitability over the long-term
41
42
Non-GAAP Reconciliations
Sysco Corporation and its Consolidated Subsidiaries
Non-GAAP Reconciliation (Unaudited)
Impact of Certain Items
(In Thousands, Except for Share and Per Share Data)
Sysco’s results of operations are impacted by certain items which include multiemployer withdrawal charges (MEPP), severance charges, US Foods merger and integration
planning costs, charges from facility closures, US Foods related financing costs and a change in estimate of self-insurance specific to fiscal 2014, (collectively referred to as
"Certain Items"). Management believes that adjusting its operating expenses, operating income, interest expense, net earnings and diluted earnings per share to remove
these Certain Items provides an important perspective with respect to our results and provides meaningful supplemental information to both management and investors that
removes these items which are difficult to predict and are often unanticipated, and which, as a result are difficult to include in analyst's financial models and our investors'
expectations with any degree of specificity. Sysco believes the adjusted totals facilitate comparison on a year-over-year basis.
The company uses these non-GAAP measures when evaluating its financial results as well as for internal planning and forecasting purposes. These financial measures
should not be used as a substitute for GAAP measures in assessing the company’s results of operations for the periods presented. An analysis of any non-GAAP financial
measure should be used in conjunction with results presented in accordance with GAAP. As a result, in the tables that follow, each period presented is adjusted to remove
the Certain Items noted above.
26-Week
Period Ended
Dec. 27, 2014
26-Week
Period Ended
Dec. 28, 2013
26-Week
Period Change
in Dollars
26-Week
Period
% Change
Operating expenses (GAAP) $ 3,492,795 $ 3,200,463 $ 292,332 9.1%
Impact of MEPP charge - (1,451) 1,451 -100.0
Impact of severance charges (3,542) (3,596) 54 -1.5
Impact of US Foods merger and integration planning costs (118,499) (4,352) (114,147) 2,622.9
Impact of change in estimate of self insurance - (23,841) 23,841 -100.0
Impact of facility closure charges (2,203) (1,475) (728) 49.4
Operating expenses adjusted for certain items (Non-GAAP) $ 3,368,551 $ 3,165,748 $ 202,803 6.4%
Operating Income (GAAP) $ 781,059 $ 829,975 $ (48,916) -5.9%
Impact of MEPP charge - 1,451 (1,451) -100.0
Impact of severance charge 3,542 3,596 (54) -1.5
Impact of US Foods merger and integration planning costs 118,499 4,352 114,147 2,622.9
Impact of change in estimate of self insurance - 23,841 (23,841) -100.0
Impact of facility closure charges 2,203 1,475 728 49.4
Operating income adjusted for certain items (Non-GAAP) $ 905,303 $ 864,690 $ 40,613 4.7%
Interest Expense (GAAP) $ 107,976 $ 60,312 $ 47,664 79.0%
Impact of US Foods financing costs (55,761) - (55,761) NM
Adjusted Interest Expense (Non-GAAP) $ 52,215 $ 60,312 $ (8,097) -13.4%
Net earnings (GAAP) (1) $ 436,792 $ 496,425 $ (59,633) -12.0%
Impact of MEPP charge - 924 (924) -100.0
Impact of severance charge 2,299 2,292 7 0.3
Impact of US Foods merger and integration planning costs 76,901 2,775 74,126 2,671.2
Impact of change in estimate of self insurance - 15,203 (15,203) -100.0
Impact of facility closure charges 1,430 941 489 52.0
Impact of US Foods financing costs 36,187 - 36,187 NM
Net earnings adjusted for certain items (Non-GAAP) (1) $ 553,609 $ 518,560 $ 35,049 6.8%
Diluted earnings per share (GAAP) (1) $ 0.73 $ 0.84 $ (0.11) -13.1%
Impact of MEPP charge - - - NM
Impact of severance charge - - - NM
Impact of US Foods merger and integration planning costs 0.13 - 0.13 NM
Impact of change in estimate of self insurance - 0.03 (0.03) NM
Impact of facility closure charges - - - NM
Impact of US Foods financing costs 0.06 - 0.06 NM
Diluted EPS adjusted for certain items (Non-GAAP) (1) (2) $ 0.93 $ 0.88 $ 0.05 5.7%
Diluted shares outstanding 594,610,315 589,516,342
(1) The net earnings and diluted earnings per share impacts are shown net of tax. Tax impact of adjustments for Certain Items was $63,189 and $12,576 for the 26-week periods ended December 27, 2014 and December 28, 2013, respectively.
Amounts are calculated by multiplying the operating income impact of each item by each quarter's effective tax rate.
(2) Individual components of diluted earnings per share may not add to the total presented due to rounding. Total diluted earnings per share is calculated using adjusted net earnings for certain items and adjusted net earnings - underlying business,
both divided by diluted shares outstanding.
NM represents that the percentage change is not meaningful 43
Non-GAAP Reconciliations (Unaudited)
Impact of Certain Items
(In Thousands, Except for Share and Per Share Data)
Free cash flow represents net cash provided from operating activities less purchases of plant and equipment and includes proceeds from sales of plant and equipment.
Adjusted free cash flow adjusts out the cash impact of our Certain Items representing primarily payments for US Foods merger and integration planning costs and a payment for
contingency accrual that arose in fiscal 2014. It also adjusts for a contribution to our retirement plan which creates a year over year variance from timing. We made a $50
million contribution to our qualified pension plan in the first 26 weeks of fiscal 2015, while there was no contribution to this plan in the first 26 weeks of fiscal 2014 due to its
funding in the fourth quarter of fiscal 2013. Sysco considers free cash flow and adjusted free cash flow to be liquidity measures that provide useful information to management
and investors about the amount of cash generated by the business after the purchases and sales of buildings, fleet, equipment and technology, which may potentially be used
to pay for, among other things, strategic uses of cash including dividend payments, share repurchases and acquisitions. Adjusted free cash flow further provides the amount of
cash generated excluding larger payments sometimes incurred with our Certain Items and timing of pension contributions. We do not mean to imply that free cash flow and
adjusted free cash flow are necessarily available for discretionary expenditures, however, as it may be necessary that we use it to make mandatory debt service or other
payments. Free cash flow and adjusted free cash flow should not be used as a substitute in assessing the company’s liquidity for the periods presented. An analysis of any
non-GAAP financial measure should be used in conjunction with results presented in accordance with GAAP. In the table that follows, free cash flow and adjusted free cash
flow for each period presented are reconciled to net cash provided by operating activities.
26-Week
Period Ended
Dec. 27, 2014
26-Week
Period Ended
Dec. 28, 2013
26-Week
Period Change
in Dollars
26-Week
Period
% Change
Net cash provided by operating activities (GAAP) $ 452,438 $ 458,164 $ (5,726) -1.2%
Additions to plant and equipment (298,068) (270,432) (27,636) -10.2%
Proceeds from sales of plant and equipment 2,130 23,480 (21,350) -90.9%
Free Cash Flow (Non-GAAP) $ 156,500 $ 211,212 $ (54,712) -25.9%
Cash impact of Certain Items 117,668 5,505 112,163 NM
Timing impact of pension contribution 50,000 - 50,000 NM
Adjusted Free Cash Flow (Non-GAAP) $ 324,168 $ 216,717 $ 107,451 49.6%
Adjustments represent the cash impact of Certain Items with the exception of US Foods financing costs which does not impact either Non-GAAP measure since these costs did
not require cash payment in either period. Adjustments for the first 26 weeks of fiscal 2015 include $81.2 million related to US Foods merger and integration planning costs,
$17.2 million related to the payment of a contingency accrual that arose in the last 26 weeks of fiscal 2014 that was considered a Certain Item in fiscal 2014 and $3.3 million for
all remaining applicable Certain Items. None of the adjustments for the first 26 weeks of fiscal 2014 were individually significant. These amounts will differ from the earnings
impact of Certain Items as the timing of payments for these items may occur in a different period from the period the Certain Item charges were taken in the Statement of
Consolidated Results of Operations.
Non-GAAP Reconciliation (Unaudited)
Free Cash Flow and Adjusted Free Cash Flow
(In Thousands)
44
Non-GAAP Reconciliation (Unaudited)
Free Cash Flow and Adjusted Free Cash Flow
(In Thousands)
45
Free cash flow represents net cash provided from operating activities less purchases of plant and equipment and includes proceeds from sales of plant and
equipment. Adjusted free cash flow adjusts out the cash impact of our Certain Items representing primarily payments for US Foods merger and integration planning
costs and payments for multiemployer pension plan withdrawals. Sysco considers free cash flow and adjusted free cash flow to be liquidity measures that provide
useful information to management and investors about the amount of cash generated by the business after the purchases and sales of buildings, fleet, equipment and
technology, which may potentially be used to pay for, among other things, strategic uses of cash including dividend payments, share repurchases and acquisitions.
Adjusted free cash flow further provides the amount of cash generated excluding larger payments sometimes incurred with our Certain Items. We do not mean to
imply that free cash flow and adjusted free cash flow are necessarily available for discretionary expenditures, however, as it may be necessary that we use it to make
mandatory debt service or other payments. Free cash flow and adjusted free cash flow should not be used as a substitute in assessing the company’s liquidity for the
periods presented. An analysis of any non-GAAP financial measure should be used in conjunction with results presented in accordance with GAAP. In the table that
follows, free cash flow and adjusted free cash flow for each period presented are reconciled to net cash provided by operating activities.
52-Week
Period Ended
June 28, 2014
52-Week
Period Ended June
29, 2013
52-Week
Period Change
in Dollars
52-Week
Period
% Change
Net cash provided by operating activities (GAAP) $ 1,492,815 $ 1,511,594 $ (18,779) -1.2%
Additions to plant and equipment (523,206) (511,862) (11,344) -2.2
Proceeds from sales of plant and equipment 25,790 15,527 10,263 66.1
Free Cash Flow (Non-GAAP) $ 995,399 $ 1,015,259 $ (19,860) -2.0%
Adjustments 84,210 34,445 49,765 144.5
Adjusted Free Cash Flow (Non-GAAP) $ 1,079,609 $ 1,049,704 $ 29,905 2.8%
Adjustments represent the cash impact of Certain Items with the exception of amortization of US Foods financing costs which does not impact either Non-GAAP
measure. Adjustments for fiscal 2014 include $48.0 million related to US Foods merger and integration planning costs, $25.8 million related to the multiemployer
pension withdrawals and $10.4 million for all remaining applicable Certain Items. Adjustments for fiscal 2013 include $20.4 million related to multiemployer pension,
$6.3 million related to severance and $7.7 million for all remaining applicable Certain Items. These amounts will differ from the earnings impact of Certain Items as the
timing of payments for these items may occur in a different period from the period the Certain Item charges were taken in the Statement of Consolidated Results of
Operations.

More Related Content

What's hot

Jefferies 2016 Consumer Conference
Jefferies 2016 Consumer ConferenceJefferies 2016 Consumer Conference
Jefferies 2016 Consumer ConferenceSysco_Investors
 
Morgan Stanley Conference Deck November 2016
Morgan Stanley Conference Deck November 2016Morgan Stanley Conference Deck November 2016
Morgan Stanley Conference Deck November 2016irusfoods
 
20160216 cagny presentation vfinal
20160216 cagny presentation vfinal20160216 cagny presentation vfinal
20160216 cagny presentation vfinalSysco_Investors
 
Q2 fy16 earnings slides final
Q2 fy16 earnings slides finalQ2 fy16 earnings slides final
Q2 fy16 earnings slides finalirusfoods
 
01 29-16 earnings slides - 2 q16 final
01 29-16 earnings slides - 2 q16 final01 29-16 earnings slides - 2 q16 final
01 29-16 earnings slides - 2 q16 finalSysco_Investors
 
Sysco at 2016 Barclays Global Consumer Staples Conference
Sysco at 2016 Barclays Global Consumer Staples Conference Sysco at 2016 Barclays Global Consumer Staples Conference
Sysco at 2016 Barclays Global Consumer Staples Conference Sysco_Investors
 
Micron Investor Presentation
Micron Investor PresentationMicron Investor Presentation
Micron Investor Presentationmolsoncoorsir
 
Q3 fy16 earnings slides final
Q3 fy16 earnings slides finalQ3 fy16 earnings slides final
Q3 fy16 earnings slides finalirusfoods
 
Tsn cagny 2017 presentation slides
Tsn cagny 2017 presentation slidesTsn cagny 2017 presentation slides
Tsn cagny 2017 presentation slidesinvestortyson
 
2019 syy bernstein slides v final
2019 syy  bernstein slides v final2019 syy  bernstein slides v final
2019 syy bernstein slides v finalSYYIR
 
Geo ff call slides final 092917
Geo ff call slides final 092917Geo ff call slides final 092917
Geo ff call slides final 092917investortyson
 
2q22 earnings-call-presentation
2q22 earnings-call-presentation2q22 earnings-call-presentation
2q22 earnings-call-presentationSysco_Investors
 
Jefferies Consumer Summit
Jefferies Consumer SummitJefferies Consumer Summit
Jefferies Consumer SummitSysco_Investors
 
Jefferies 2019 Consumer Conference
Jefferies 2019 Consumer ConferenceJefferies 2019 Consumer Conference
Jefferies 2019 Consumer ConferenceSysco_Investors
 
2019 cagny presentation v final2
2019 cagny presentation v final22019 cagny presentation v final2
2019 cagny presentation v final2SYYIR
 
Vmc Investor Day Management Presentation 2015
Vmc Investor Day Management Presentation 2015Vmc Investor Day Management Presentation 2015
Vmc Investor Day Management Presentation 2015VulcanMaterials
 

What's hot (20)

Jefferies 2016 Consumer Conference
Jefferies 2016 Consumer ConferenceJefferies 2016 Consumer Conference
Jefferies 2016 Consumer Conference
 
Morgan Stanley Conference Deck November 2016
Morgan Stanley Conference Deck November 2016Morgan Stanley Conference Deck November 2016
Morgan Stanley Conference Deck November 2016
 
20160216 cagny presentation vfinal
20160216 cagny presentation vfinal20160216 cagny presentation vfinal
20160216 cagny presentation vfinal
 
Q2 fy16 earnings slides final
Q2 fy16 earnings slides finalQ2 fy16 earnings slides final
Q2 fy16 earnings slides final
 
01 29-16 earnings slides - 2 q16 final
01 29-16 earnings slides - 2 q16 final01 29-16 earnings slides - 2 q16 final
01 29-16 earnings slides - 2 q16 final
 
Sysco at 2016 Barclays Global Consumer Staples Conference
Sysco at 2016 Barclays Global Consumer Staples Conference Sysco at 2016 Barclays Global Consumer Staples Conference
Sysco at 2016 Barclays Global Consumer Staples Conference
 
2018 cagny presentation
2018 cagny presentation2018 cagny presentation
2018 cagny presentation
 
Micron Investor Presentation
Micron Investor PresentationMicron Investor Presentation
Micron Investor Presentation
 
Q3 fy16 earnings slides final
Q3 fy16 earnings slides finalQ3 fy16 earnings slides final
Q3 fy16 earnings slides final
 
Tsn cagny 2017 presentation slides
Tsn cagny 2017 presentation slidesTsn cagny 2017 presentation slides
Tsn cagny 2017 presentation slides
 
SYY Investor Day, NYC
SYY Investor Day, NYC SYY Investor Day, NYC
SYY Investor Day, NYC
 
Q4 2021 Presentation
Q4 2021 PresentationQ4 2021 Presentation
Q4 2021 Presentation
 
2019 syy bernstein slides v final
2019 syy  bernstein slides v final2019 syy  bernstein slides v final
2019 syy bernstein slides v final
 
Slides 3 q15_final
Slides 3 q15_finalSlides 3 q15_final
Slides 3 q15_final
 
Geo ff call slides final 092917
Geo ff call slides final 092917Geo ff call slides final 092917
Geo ff call slides final 092917
 
2q22 earnings-call-presentation
2q22 earnings-call-presentation2q22 earnings-call-presentation
2q22 earnings-call-presentation
 
Jefferies Consumer Summit
Jefferies Consumer SummitJefferies Consumer Summit
Jefferies Consumer Summit
 
Jefferies 2019 Consumer Conference
Jefferies 2019 Consumer ConferenceJefferies 2019 Consumer Conference
Jefferies 2019 Consumer Conference
 
2019 cagny presentation v final2
2019 cagny presentation v final22019 cagny presentation v final2
2019 cagny presentation v final2
 
Vmc Investor Day Management Presentation 2015
Vmc Investor Day Management Presentation 2015Vmc Investor Day Management Presentation 2015
Vmc Investor Day Management Presentation 2015
 

Viewers also liked

FTC Complaint Sysco US Foods Acquisition
FTC Complaint Sysco US Foods AcquisitionFTC Complaint Sysco US Foods Acquisition
FTC Complaint Sysco US Foods AcquisitionMark Moreno
 
Supply chain management of McDonalds
Supply chain management of McDonaldsSupply chain management of McDonalds
Supply chain management of McDonaldsSaravanan rulez
 
Coca cola presentation
Coca cola presentationCoca cola presentation
Coca cola presentationemelsoos
 
Sysco Warehouse Jobs
Sysco Warehouse JobsSysco Warehouse Jobs
Sysco Warehouse Jobsanna19871
 
Sysco's Merger with US Foods
Sysco's Merger with US FoodsSysco's Merger with US Foods
Sysco's Merger with US FoodsSysco_Investors
 
Embrace the Hybrid Distribution Model
Embrace the Hybrid Distribution ModelEmbrace the Hybrid Distribution Model
Embrace the Hybrid Distribution Modeljeff_heath
 
2017 cage presentation v final (print)
2017 cage presentation v final (print)2017 cage presentation v final (print)
2017 cage presentation v final (print)Sysco_Investors
 
Pepsi Refresh Project
Pepsi Refresh ProjectPepsi Refresh Project
Pepsi Refresh ProjectAyman Sarhan
 
Pepsi Refresh Project Presentation
Pepsi Refresh Project PresentationPepsi Refresh Project Presentation
Pepsi Refresh Project PresentationBrigid Slattery
 
Digital Transformation: Thinking Beyond CRM
Digital Transformation: Thinking Beyond CRMDigital Transformation: Thinking Beyond CRM
Digital Transformation: Thinking Beyond CRMSAP Customer Experience
 
Digital Transformation for Manufacturing Industries
Digital Transformation for Manufacturing IndustriesDigital Transformation for Manufacturing Industries
Digital Transformation for Manufacturing IndustriesSAP Customer Experience
 
Soft Drink Industry Ppt
Soft Drink Industry PptSoft Drink Industry Ppt
Soft Drink Industry Pptguestbb69f0
 
Distribution strategy of APPLE products
Distribution strategy of APPLE productsDistribution strategy of APPLE products
Distribution strategy of APPLE productsJinu P Varghese
 

Viewers also liked (20)

FTC Complaint Sysco US Foods Acquisition
FTC Complaint Sysco US Foods AcquisitionFTC Complaint Sysco US Foods Acquisition
FTC Complaint Sysco US Foods Acquisition
 
Supply chain management of McDonalds
Supply chain management of McDonaldsSupply chain management of McDonalds
Supply chain management of McDonalds
 
Coca cola presentation
Coca cola presentationCoca cola presentation
Coca cola presentation
 
Sysco Warehouse Jobs
Sysco Warehouse JobsSysco Warehouse Jobs
Sysco Warehouse Jobs
 
Sysco's Merger with US Foods
Sysco's Merger with US FoodsSysco's Merger with US Foods
Sysco's Merger with US Foods
 
Embrace the Hybrid Distribution Model
Embrace the Hybrid Distribution ModelEmbrace the Hybrid Distribution Model
Embrace the Hybrid Distribution Model
 
GFS
GFSGFS
GFS
 
2017 cage presentation v final (print)
2017 cage presentation v final (print)2017 cage presentation v final (print)
2017 cage presentation v final (print)
 
Unit 8 L4 N.I.3
Unit 8 L4 N.I.3Unit 8 L4 N.I.3
Unit 8 L4 N.I.3
 
Pepsi Refresh Project
Pepsi Refresh ProjectPepsi Refresh Project
Pepsi Refresh Project
 
Bi sysco
Bi syscoBi sysco
Bi sysco
 
Prefer
PreferPrefer
Prefer
 
Pepsi Refresh Project Presentation
Pepsi Refresh Project PresentationPepsi Refresh Project Presentation
Pepsi Refresh Project Presentation
 
Digital Transformation: Thinking Beyond CRM
Digital Transformation: Thinking Beyond CRMDigital Transformation: Thinking Beyond CRM
Digital Transformation: Thinking Beyond CRM
 
Mineral water
Mineral waterMineral water
Mineral water
 
Digital Transformation for Manufacturing Industries
Digital Transformation for Manufacturing IndustriesDigital Transformation for Manufacturing Industries
Digital Transformation for Manufacturing Industries
 
Soft Drink Industry Ppt
Soft Drink Industry PptSoft Drink Industry Ppt
Soft Drink Industry Ppt
 
Tata Steel-ppt
Tata Steel-pptTata Steel-ppt
Tata Steel-ppt
 
Distribution strategy of APPLE products
Distribution strategy of APPLE productsDistribution strategy of APPLE products
Distribution strategy of APPLE products
 
Transformational Leadership
Transformational LeadershipTransformational Leadership
Transformational Leadership
 

Similar to Sysco Investor Presentation CAGNY 2015

Sysco 2Q15 Earnings Results
Sysco 2Q15 Earnings ResultsSysco 2Q15 Earnings Results
Sysco 2Q15 Earnings ResultsSysco_Investors
 
Cagny presentation 2014 vfinal
Cagny presentation 2014 vfinalCagny presentation 2014 vfinal
Cagny presentation 2014 vfinalSysco_Investors
 
2 q14 earnings 020314_final_final
2 q14 earnings 020314_final_final2 q14 earnings 020314_final_final
2 q14 earnings 020314_final_finalSysco_Investors
 
2 q14 earnings 020314_final
2 q14 earnings 020314_final2 q14 earnings 020314_final
2 q14 earnings 020314_finalSysco_Investors
 
Sysco Earnings Results 2Q20
Sysco Earnings Results 2Q20Sysco Earnings Results 2Q20
Sysco Earnings Results 2Q20Sysco_Investors
 
4 q13 earnings final_final_8.12.13
4 q13 earnings final_final_8.12.134 q13 earnings final_final_8.12.13
4 q13 earnings final_final_8.12.13Sysco_Investors
 
Barclays Eat Sleep Play Conference 2020
Barclays Eat Sleep Play Conference 2020Barclays Eat Sleep Play Conference 2020
Barclays Eat Sleep Play Conference 2020SYYIR
 
Sysco 3Q FY21 Earnings Results
Sysco 3Q FY21 Earnings ResultsSysco 3Q FY21 Earnings Results
Sysco 3Q FY21 Earnings ResultsSYYIR
 
Sysco Investor Day 2021
Sysco Investor Day 2021Sysco Investor Day 2021
Sysco Investor Day 2021SYYIR
 
Sysco Earnings Results 4Q19
Sysco Earnings Results 4Q19Sysco Earnings Results 4Q19
Sysco Earnings Results 4Q19Sysco_Investors
 
Sysco Earnings Results 1Q20
Sysco Earnings Results 1Q20Sysco Earnings Results 1Q20
Sysco Earnings Results 1Q20Sysco_Investors
 
Sysco 4Q and FY20 Earnings Results
Sysco 4Q and FY20 Earnings ResultsSysco 4Q and FY20 Earnings Results
Sysco 4Q and FY20 Earnings ResultsSYYIR
 
4Q20_Earnings_Call_Presentation
4Q20_Earnings_Call_Presentation4Q20_Earnings_Call_Presentation
4Q20_Earnings_Call_PresentationSysco_Investors
 

Similar to Sysco Investor Presentation CAGNY 2015 (20)

3 q14 earnings vfinal2
3 q14 earnings vfinal23 q14 earnings vfinal2
3 q14 earnings vfinal2
 
Sysco 2Q15 Earnings Results
Sysco 2Q15 Earnings ResultsSysco 2Q15 Earnings Results
Sysco 2Q15 Earnings Results
 
Q1 2015 Slides
Q1 2015 SlidesQ1 2015 Slides
Q1 2015 Slides
 
Cagny presentation 2014 vfinal
Cagny presentation 2014 vfinalCagny presentation 2014 vfinal
Cagny presentation 2014 vfinal
 
2 q14 earnings 020314_final_final
2 q14 earnings 020314_final_final2 q14 earnings 020314_final_final
2 q14 earnings 020314_final_final
 
2 q14 earnings 020314_final
2 q14 earnings 020314_final2 q14 earnings 020314_final
2 q14 earnings 020314_final
 
Slides 8.14.14 final
Slides 8.14.14 finalSlides 8.14.14 final
Slides 8.14.14 final
 
Sysco Earnings Results 2Q20
Sysco Earnings Results 2Q20Sysco Earnings Results 2Q20
Sysco Earnings Results 2Q20
 
Cagny 2020
Cagny 2020Cagny 2020
Cagny 2020
 
Q1 2021 Earning
Q1 2021 EarningQ1 2021 Earning
Q1 2021 Earning
 
Earnings slides-4q18
Earnings slides-4q18Earnings slides-4q18
Earnings slides-4q18
 
4 q13 earnings final_final_8.12.13
4 q13 earnings final_final_8.12.134 q13 earnings final_final_8.12.13
4 q13 earnings final_final_8.12.13
 
Barclays Eat Sleep Play Conference 2020
Barclays Eat Sleep Play Conference 2020Barclays Eat Sleep Play Conference 2020
Barclays Eat Sleep Play Conference 2020
 
Q3 2021 Presentation
Q3 2021 PresentationQ3 2021 Presentation
Q3 2021 Presentation
 
Sysco 3Q FY21 Earnings Results
Sysco 3Q FY21 Earnings ResultsSysco 3Q FY21 Earnings Results
Sysco 3Q FY21 Earnings Results
 
Sysco Investor Day 2021
Sysco Investor Day 2021Sysco Investor Day 2021
Sysco Investor Day 2021
 
Sysco Earnings Results 4Q19
Sysco Earnings Results 4Q19Sysco Earnings Results 4Q19
Sysco Earnings Results 4Q19
 
Sysco Earnings Results 1Q20
Sysco Earnings Results 1Q20Sysco Earnings Results 1Q20
Sysco Earnings Results 1Q20
 
Sysco 4Q and FY20 Earnings Results
Sysco 4Q and FY20 Earnings ResultsSysco 4Q and FY20 Earnings Results
Sysco 4Q and FY20 Earnings Results
 
4Q20_Earnings_Call_Presentation
4Q20_Earnings_Call_Presentation4Q20_Earnings_Call_Presentation
4Q20_Earnings_Call_Presentation
 

More from Sysco_Investors

Q3 FY24 Earnings Conference Call Presentation
Q3 FY24 Earnings Conference Call PresentationQ3 FY24 Earnings Conference Call Presentation
Q3 FY24 Earnings Conference Call PresentationSysco_Investors
 
4q23-syy-earnings-slides-v1.pdf
4q23-syy-earnings-slides-v1.pdf4q23-syy-earnings-slides-v1.pdf
4q23-syy-earnings-slides-v1.pdfSysco_Investors
 
4Q23 Earnings Call Presentation
4Q23 Earnings Call Presentation4Q23 Earnings Call Presentation
4Q23 Earnings Call PresentationSysco_Investors
 
3q23-syy-earnings-slides-v19.pdf
3q23-syy-earnings-slides-v19.pdf3q23-syy-earnings-slides-v19.pdf
3q23-syy-earnings-slides-v19.pdfSysco_Investors
 
Consumer Analyst Group of New York (CAGNY) Conference 2023
Consumer Analyst Group of New York (CAGNY) Conference 2023Consumer Analyst Group of New York (CAGNY) Conference 2023
Consumer Analyst Group of New York (CAGNY) Conference 2023Sysco_Investors
 
2q23-syy-earnings-slides.pdf
2q23-syy-earnings-slides.pdf2q23-syy-earnings-slides.pdf
2q23-syy-earnings-slides.pdfSysco_Investors
 
1q23-syy-earnings-slides.pdf
1q23-syy-earnings-slides.pdf1q23-syy-earnings-slides.pdf
1q23-syy-earnings-slides.pdfSysco_Investors
 
4q22-syy-earnings-slides.pdf
4q22-syy-earnings-slides.pdf4q22-syy-earnings-slides.pdf
4q22-syy-earnings-slides.pdfSysco_Investors
 
3q22-syy-earnings-slides.pdf
3q22-syy-earnings-slides.pdf3q22-syy-earnings-slides.pdf
3q22-syy-earnings-slides.pdfSysco_Investors
 
1q22 syy-earnings-slides
1q22 syy-earnings-slides1q22 syy-earnings-slides
1q22 syy-earnings-slidesSysco_Investors
 
3 q20 syy earnings slides vfinal
3 q20 syy earnings slides vfinal3 q20 syy earnings slides vfinal
3 q20 syy earnings slides vfinalSysco_Investors
 
Sysco Earnings Results 3Q19
Sysco Earnings Results 3Q19Sysco Earnings Results 3Q19
Sysco Earnings Results 3Q19Sysco_Investors
 
2019 cagny-presentation-vfinal
2019 cagny-presentation-vfinal2019 cagny-presentation-vfinal
2019 cagny-presentation-vfinalSysco_Investors
 
Consumer Analyst Group of New York (CAGNY) Conference 2019
Consumer Analyst Group of New York (CAGNY) Conference 2019 Consumer Analyst Group of New York (CAGNY) Conference 2019
Consumer Analyst Group of New York (CAGNY) Conference 2019 Sysco_Investors
 

More from Sysco_Investors (17)

Q3 FY24 Earnings Conference Call Presentation
Q3 FY24 Earnings Conference Call PresentationQ3 FY24 Earnings Conference Call Presentation
Q3 FY24 Earnings Conference Call Presentation
 
4q23-syy-earnings-slides-v1.pdf
4q23-syy-earnings-slides-v1.pdf4q23-syy-earnings-slides-v1.pdf
4q23-syy-earnings-slides-v1.pdf
 
4Q23 Earnings Call Presentation
4Q23 Earnings Call Presentation4Q23 Earnings Call Presentation
4Q23 Earnings Call Presentation
 
3q23-syy-earnings-slides-v19.pdf
3q23-syy-earnings-slides-v19.pdf3q23-syy-earnings-slides-v19.pdf
3q23-syy-earnings-slides-v19.pdf
 
Consumer Analyst Group of New York (CAGNY) Conference 2023
Consumer Analyst Group of New York (CAGNY) Conference 2023Consumer Analyst Group of New York (CAGNY) Conference 2023
Consumer Analyst Group of New York (CAGNY) Conference 2023
 
2q23-syy-earnings-slides.pdf
2q23-syy-earnings-slides.pdf2q23-syy-earnings-slides.pdf
2q23-syy-earnings-slides.pdf
 
1q23-syy-earnings-slides.pdf
1q23-syy-earnings-slides.pdf1q23-syy-earnings-slides.pdf
1q23-syy-earnings-slides.pdf
 
4q22-syy-earnings-slides.pdf
4q22-syy-earnings-slides.pdf4q22-syy-earnings-slides.pdf
4q22-syy-earnings-slides.pdf
 
3q22-syy-earnings-slides.pdf
3q22-syy-earnings-slides.pdf3q22-syy-earnings-slides.pdf
3q22-syy-earnings-slides.pdf
 
1q22 syy-earnings-slides
1q22 syy-earnings-slides1q22 syy-earnings-slides
1q22 syy-earnings-slides
 
Q2 2021-presentation
Q2 2021-presentationQ2 2021-presentation
Q2 2021-presentation
 
3 q20 syy earnings slides vfinal
3 q20 syy earnings slides vfinal3 q20 syy earnings slides vfinal
3 q20 syy earnings slides vfinal
 
3q 2020-earnings-slides
3q 2020-earnings-slides3q 2020-earnings-slides
3q 2020-earnings-slides
 
Sysco Earnings Results 3Q19
Sysco Earnings Results 3Q19Sysco Earnings Results 3Q19
Sysco Earnings Results 3Q19
 
2019 cagny-presentation-vfinal
2019 cagny-presentation-vfinal2019 cagny-presentation-vfinal
2019 cagny-presentation-vfinal
 
Consumer Analyst Group of New York (CAGNY) Conference 2019
Consumer Analyst Group of New York (CAGNY) Conference 2019 Consumer Analyst Group of New York (CAGNY) Conference 2019
Consumer Analyst Group of New York (CAGNY) Conference 2019
 
Sysco 2q 2018
Sysco 2q 2018Sysco 2q 2018
Sysco 2q 2018
 

Sysco Investor Presentation CAGNY 2015

  • 3. 3 FORWARD LOOKING STATEMENT Statements made in this presentation that look forward in time or that express management’s beliefs, expectations or hopes are forward-looking statements within the meaning of the Private Securities Litigation Reform Act of 1995. Such forward-looking statements reflect the views of management at the time such statements are made and are subject to a number of risks, uncertainties, estimates, and assumptions that may cause actual results to differ materially from current expectations. These statements include our plans and expectations related to and the benefits and expected timing of our business transformation initiatives, expectations and efforts regarding management of operating expenses, our plans and expectations related to and the benefits of the proposed merger with US Foods, and our plans and expectations related to acquisitions. These statements also include expectations regarding our sales growth, operating expense growth and operating performance results, trends in our locally-managed business and overall sales mix, market conditions and trends, growth opportunities, inflation, fuel expense, interest expense, our expense management and cost per case performance, share repurchases, business transformation costs and expenses, investments in technology resources, free cash flow and capital expenditures. The success of our business transformation initiatives and expectations regarding our operating performance are subject to the general risks associated with our business, including the risks of interruption of supplies due to lack of long-term contracts, severe weather, crop conditions, work stoppages, intense competition, technology disruptions, dependence on large regional and national customers, inflation risks, the impact of fuel prices, adverse publicity, and labor issues. Risks and uncertainties also include risks impacting the economy generally, including the risks that the current general economic conditions will deteriorate, or consumer confidence in the economy may not increase and decreases in consumer spending, particularly on food-away-from-home, may not reverse. Market conditions may not improve as anticipated. If sales from our locally managed customers do not grow at the same rate as sales from regional and national customers, our gross margins may continue to decline. Our ability to meet our long-term strategic objectives to grow the profitability of our business depends largely on the success of our Business Transformation Project. There are various risks related to the project, including the risk that the project and its various components may not provide the expected benefits in our anticipated time frame, if at all, and may prove costlier than expected; the risk that the actual costs of the ERP system may be greater or less than currently expected because we have encountered, and may continue to encounter, the need for changes in design or revisions of the project calendar and budget, including the incurrence of expenses at an earlier or later time than currently anticipated; the risk that our business and results of operations may be adversely affected if we experience delays in deployment, operating problems, cost overages or limitations on the extent of the business transformation during the ERP implementation process; and the risk of adverse effects to our business, results of operations and liquidity if the ERP system, and the associated process changes, do not prove to be cost effective or do not result in the cost savings and other benefits at the levels that we anticipate. Planned deployments in the coming quarters are dependent upon the success of the ERP system and the updates at the current locations. We may experience delays, cost overages or operating problems when we deploy the system to additional locations. Our plans related to and the timing of the implementation of the ERP system, as well as the cost transformation and category management initiatives, are subject to change at any time based on management’s subjective evaluation of our overall business needs. We may fail to realize anticipated benefits, particularly expected cost savings, from our cost transformation initiative. If we are unable to realize the anticipated benefits from our cost cutting efforts, we could become cost disadvantaged in the marketplace, and our competitiveness and our profitability could decrease. We may also fail to realize the full anticipated benefits of our category management initiative, and may be unable to successfully execute the initiative in our anticipated timeline. Capital expenditures may vary from those projected based on changes in business plans and other factors, including risks related to the implementation of our business transformation initiatives and our regional distribution centers, the timing and successful completions of acquisitions, construction schedules and the possibility that other cash requirements could result in delays or cancellations of capital spending. Periods of high inflation, either overall or in certain product categories, can have a negative impact on us and our customers, as high food costs can reduce consumer spending in the food-away-from-home market, and may negatively impact our sales, gross profit, operating income and earnings. Expanding into international markets presents unique challenges and risks, including compliance with local laws, regulations and customs and the impact of local political and economic conditions, and such expansion efforts may not be successful. Any business that we acquire may not perform as expected, and we may not realize the anticipated benefits of our acquisitions. The consummation of the merger with US Foods is subject to regulatory approval and the satisfaction of certain conditions, and we cannot predict whether the necessary conditions will be satisfied or waived and the requisite regulatory approvals received. We also may be subject to potential antitrust or similar lawsuits at the federal or state level. Sysco and US Foods have entered into an agreement to sell 11 US Foods’ facilities to Performance Food Group contingent on closing the merger; however, certain further actions may be required to obtain regulatory approval for the merger, which could negatively impact the projected benefits of the merger. Termination of the merger agreement with US Foods could require Sysco to make a termination payment of $300 million, which could adversely impact Sysco’s stock price, liquidity and financial condition. As a result of uncertainties surrounding the proposed merger, prospective suppliers and customers may delay or decline to enter into agreements with us, and we may also lose current suppliers and customers, and fail to retain key employees. The pending merger and our current pre-merger integration planning efforts may divert our management’s attention from day-to-day business operations and the execution of our business transformation initiatives, which could result in performance shortfalls. Integration of the businesses of Sysco and US Foods may be more difficult, costly or time consuming than expected, and the merger may not result in any or all of the anticipated benefits, including cost synergies. We may fail to retain some of US Foods’ vendors and customers after the proposed merger. In relation to the merger, we have issued additional debt and our level of indebtedness and the terms of our indebtedness could adversely affect our business and liquidity position. For a discussion of additional factors impacting Sysco’s business, see the Company’s Annual Report on Form 10-K for the year ended June 28, 2014, as filed with the Securities and Exchange Commission, and the Company’s subsequent filings with the SEC. Sysco does not undertake to update its forward-looking statements except as required by applicable law.
  • 4. 4 THE GLOBAL LEADER IN FOODSERVICE DISTRIBUTION • Approaching $50 billion in annualized sales • 425,000 customers • 50,000 associates • 400,000 products -- 40,000 Sysco Branded • Expanding presence beyond the United States
  • 5. 62% 18% 8% 12% 5 WE SERVE A BROAD CUSTOMER BASE WITH A WIDE ARRAY OF PRODUCTS FY14 Sales by Customer Type 18% 19% 13% 11% 10% 8% 7% 5% 4% Canned & dry products Fresh and frozen meats Frozen fruits, vegetables, bakery and other Dairy products Poultry Fresh produce Paper & disposables Seafood Beverage Janitorial – 2% Medical - 1% Equipment – 2% Other Healthcare, Education & Government Travel, Leisure & Retail Restaurants FY14 Sales by Product Category
  • 6. SIGNIFICANT MARKET POTENTIAL • Foodservice holds a 48% share of all food purchases; retail has a 52% share • U.S. market ~$230B; • Canada + Ireland ~$25B • Includes restaurants, healthcare, education, travel and leisure segments 6 Potential $47B Sysco Core Market Sales in CY14 $255B¹ Foodservice Market 1 Source: Technomic, Canadian Restaurant and Foodservices Association, Bord Bia (Irish Food Board), Internal Data
  • 7. 7 SYSCO HAS HISTORICALLY GROWN FASTER THAN THE MARKET 2.9X 2.0X 1.8X1.6X 17.1% 20.3% 9.8% 6.8% 5.7% 10.9% 6.9% 5.0% 3.8% 2.7% 0.0% 5.0% 10.0% 15.0% 20.0% 25.0% 1973-1980 1981-1990 1991-2000 2001-2010 2011-2014 Sysco Market 2.1XSysco growth vs. the market Annualized Sales Growth for Sysco vs. the Market¹ 1 Source: Technomic, Canadian Restaurant and Foodservices Association, Bord Bia (Irish Food Board), Internal Data
  • 8. 8 IT’S ALL ABOUT THE CUSTOMER Operating Companies Markets/ Regions Corporate Functions Operate the Business Execute Flawlessly Enable the Operating Companies Provide Resources & Support Create Tools & Processes Customers
  • 9. 9 OUR STRATEGY Implement an enterprise-wide talent management process Partnership Productivity Products Expansion People Profoundly enrich the experience of doing business with Sysco Continuously improve productivity in all areas of our business Expand our offerings through a customer- centric innovation program Explore, assess and pursue new businesses and markets
  • 10. 10 PROPOSED SYSCO-US FOODS MERGER Lower costs, differentiated products and services, better business solutions Strong strategic rationale Synergies are substantial – even after reflecting divestiture impact Strong adjusted EPS accretion and substantial cash flow Substantial Customer Benefits Operating & Supply Chain Efficiencies Enhanced Shareholder Value
  • 11. 11 RECENT MERGER DEVELOPMENT • FTC Commissioners have voted to block the Sysco-US Foods transaction – The narrow 3-2 vote demonstrates a lack of consensus within the Commission • We believe the FTC’s decision is based on an erroneous view of the competitive dynamics of the foodservice distribution industry – Customers of all types have access to food distribution services from a wide variety of companies and multiple channels – Sysco delivered a substantial divestiture package • The merger will allow Sysco to lower costs for customers, deliver better service and improve selection across all product segments – This will increase competition across the entire foodservice distribution industry to the benefit of customers We are confident this merger is highly procompetitive and look forward to our day in court
  • 12. 12 FORMULA FOR SUCCESS 2 Functional excellence to better execute with customers Scale-driven low-cost structure 1 3 Differentiated customer value proposition 4 New channels to serve our customers Entry into international markets5 MARGIN: Low growth in traditional domestic Broadlines Thin margins with persistent headwinds GROWTH:
  • 13. EVP AND PRESIDENT, FOODSERVICE OPERATIONS 13 TOM BENÉ
  • 14. 14 BRINGING THE FORMULA FOR SUCCESS TO MARKET DEVELOPING MARKETING AND SELLING DELIVERING OUR DIFFERENTIATED VALUE PROPOSITION
  • 15. 15 VOICE OF THE CUSTOMER DEVELOPING OUR DIFFERENTIATED VALUE PROPOSITION
  • 16. 16 DEVELOPING OUR DIFFERENTIATED VALUE PROPOSITION CUSTOMER INTELLIGENCE VOICE OF THE CUSTOMER MARKET ANALYTICS
  • 17. APPROACH TO INNOVATION 17 DEVELOPING OUR DIFFERENTIATED VALUE PROPOSITION INNOVATIVE AND DIFFERENTIATED PRODUCTS LEARN Market Insights Improve the business GROWTH DEFINE Category Strategy OPTIMIZE Optimal Assortment Implementation & Tailoring Selling ACTIVATE Strategic Sourcing DECIDE CATEGORY MANAGEMENT PROCESS
  • 18. 18 MARKETING AND SELLING OUR DIFFERENTIATED VALUE PROPOSITION BUSINESS SOLUTIONS TO HELP OUR CUSTOMERS MENU ANALYSIS & DESIGN EMPLOYEE TRAINING CUSTOMER MARKETING TOOLS
  • 19. 19 MARKETING AND SELLING OUR DIFFERENTIATED VALUE PROPOSITION CUSTOMER ENGAGEMENT MODEL 79% of customers who’ve ordered once, order again 20% In the last 30 days over previous period Orders are up Customer Experience Email Leads Gen Chat Text Multi-lingual Social media MAMOBILE ISR-served accounts up with improved customer experience 10% INSIDE SALES
  • 20. 20 MARKETING AND SELLING OUR DIFFERENTIATED VALUE PROPOSITION BUILDING CAPABILITY & MANAGING PERFORMANCE SELLING MODEL REVENUE MANAGEMENT
  • 21. 21 MARKETING AND SELLING OUR DIFFERENTIATED VALUE PROPOSITION HISPANIC SEGMENT APPROACH HISPANIC PILOT SALES GROWTH ($)
  • 22. 22 MARKETING AND SELLING OUR DIFFERENTIATED VALUE PROPOSITION JOINT BUSINESS PLANNING PROCESS
  • 23. 23 DELIVERING OUR DIFFERENTIATED VALUE PROPOSITION EASE OF DOING BUSINESS MY SYSCO TRUCK
  • 24. 24 DELIVERING OUR DIFFERENTIATED VALUE PROPOSITION IMPROVING OUR OPERATIONS WAREHOUSE AUTOMATIONBUILDING CAPABILITIES
  • 25. 25 DELIVERING OUR DIFFERENTIATED VALUE PROPOSITION CONTINUOUS IMPROVEMENT PROCESS
  • 26. CHRIS KREIDLER Executive Vice President and CFO 26
  • 27. 27 BUSINESS TRANSFORMATION We began a three year journey in 2012 Reduce cost structure by $300-350 million annually Lower product costs by $250-300 million annually Successfully implement technology platform Benefits: $550-650 million annually Anticipated ramp up of benefits FY13 FY14 FY15 ~ 25% ~ 50-70% 100%
  • 28. 28 BUSINESS TRANSFORMATION ACHIEVEMENTS After two and half years, we have exceeded our target Original Target: $550-650MM  Completed strategic sales initiatives; retirement plan & IT function restructuring  Launched new warehouse scorecard to drive performance  Introduced application of best practices and new tools to manage labor and operating expenses more effectively  Made significant progress implementing routing and fleets optimization initiative  Developed teams and processes for category management  Enhanced CatMan capabilities, including new sales tools, enhanced customer service and increased field communications/coord.  All CatMan categories, representing $15B of spend, to be launched by end of FY15  FY2016 and beyond CatMan continues as part of our ongoing processes Reduce Cost Structure Lower Product Costs FY14 FY13 High-end of 3-year target Over $700MM achieved through 1H FY15 FY15
  • 29. 29 GROSS PROFIT PERFORMANCE IMPROVING 1.8% 0.7% 2.7% 4.0% 6.0% 6.1% -100 -75 -50 -25 0 25 50 75 100 0.0% 1.0% 2.0% 3.0% 4.0% 5.0% 6.0% 7.0% 1Q14 2Q14 3Q14 4Q14 1Q15 2Q15 YOY % Change in Gross Profit $ and Gross Margin (Bps) Gross Profit Growth ($) Gross Margin Change (Bps) Change in GM bpsChange in GP %
  • 30. 30 SOLID OPERATIONAL PERFORMANCE IN 1H FY15  Business environment remains extremely competitive  Encouraged by solid performance in 1H15  We have many opportunities to enhance customer experience, strengthen operating performance and increase profitability Demonstrates business transformation is working 1 See Non-GAAP reconciliations at the end of this presentation. Adjusted1 Reported $MM, except per share data 1H FY15 YOY % Change 1H FY15 YOY % Change Sales $24,532 6.9% $24,532 6.9% Gross Profit 4,274 6.0% 4,274 6.0% Operating Expenses 3,369 6.4% 3,493 9.1% Operating Income 905 4.7% 781 (5.9%) Net Earnings 554 6.8% 437 (12.0%) Diluted EPS $0.93 5.7% $0.73 (13.1%)
  • 31. 31 CASH FLOW Core business continues to generate significant cash flow ($MM) 1H FY15 1H FY14 % Chg FY14 FY13 % Chg Cash Flow from Ops $452 $458 (1%) $1,493 $1,512 (1%) CapEx, net (296) 247) 20% (497) (496) 0% Free Cash Flow 157 211 (26)% 995 1,015 (2%) Adj. Free Cash Flow 1 $324 $217 50% $1,080 $1,050 3% 1) See non-GAAP reconciliations Adjusted free cash flow excludes integration planning costs and a timing mismatch in our pension contributions
  • 32. $0.3 $0.0 $0.5 $0.5 $1.0 2015 2016 2017 2018 2019 2020+ Debt Maturities $0.9 $1.1 $1.4 $1.5 $1.5 FY10 FY11 FY12 FY13 FY14 Cash Flow from Operations 32 CAPITAL ALLOCATION Reinvest in the Business • Fleet and Facilities • International and small acquisitions • Other strategic initiatives • Merger integration Return Value to Shareholders • Dividend target: 40-50% payout of adjusted EPS • Share repurchase: keep diluted shares outstanding relatively constant Minimal Near-Term Debt Maturities ($Billions) Substantial Cash Flows ($Billions) $5.2
  • 33. 33 A STRONG HISTORY OF DIVIDEND GROWTH Dividends paid per calendar year $0.00 $0.20 $0.40 $0.60 $0.80 $1.00 $1.20 Sysco has paid a dividend every quarter since its founding in 1970
  • 34. FY13 FY14 FY15 EST. Net Capex ($MM) Facilities Fleet IT-Other IT-Merger 34 STRATEGIC INVESTMENTS IN CAPITAL EXPENDITURES FY14 FY15 Gross Capex - 1H FY15 ($MM) $270 $298 $500-550 Increase in 1H15 capex driven by timing of fleet purchases and IT- related merger integration spend Long-term objective: net capex at 1.0- 1.2% of sales $497$496$270 $298
  • 35. 35 PROPOSED SYSCO-US FOODS MERGER Lower costs, differentiated products and services, better business solutions Strong strategic rationale Synergies are substantial – even after reflecting divestiture impact Strong adjusted EPS accretion and substantial cash flow Substantial Customer Benefits Operating & Supply Chain Efficiencies Enhanced Shareholder Value
  • 36. Gross Synergies • $1,000MM Impact from: divestitures, potential customer disruption • ($400MM) Net Operations Synergies • $600MM 36 MERGER SYNERGIES REMAIN ATTRACTIVE, EVEN AFTER DIVESTITURES Interest expense $115 NOLs, to be used in first year $150 Transaction-related amortization ($110) Operational Synergies (After Four Years) Financial Synergies $600 million of annual net operational synergies to be realized over four years $MM
  • 37. 37 SUBSTANTIAL SYNERGIES TO BE ACHIEVED Merchandising 30-40% Supply Chain & Distribution 25-35% Sales & Marketing 5-15% Corporate/G&A 15-25% • Capture scale advantages of combined company by implementing robust category management process • Apply best capabilities of both companies • Apply best-of-both practices to enhance operational efficiencies • Selectively streamline footprint where over-capacity exists • Optimize investment over larger physical footprint • Capitalize on procurement savings opportunities for fleet and indirect spend • Leverage infrastructure to reduce redundant marketing expense • Streamline sales and marketing organization through normal attrition • Drive organizational efficiency and eliminate redundancy • Leverage new scale and size to achieve lower total cost for third- party services $600 million of annual net operational synergies to be realized over four years
  • 38. 38 MATERIAL SYNERGIES BEGIN TO ACCUMULATE IN FY17 Percentage of Annual Run Rates Synergies Achieved by Year FY16 FY17 FY18 FY19 0-10% 40-50% 70-80% 100% Note- Assumes FYE 2015 merger close, for illustrative purposes $600 million of annual net operational synergies to be realized over four years 65% of net operational synergies impact operating expense, while 35% impact COGS
  • 39. FY16 FY17 FY18 FY19 39 POST-CLOSE MERGER INTEGRATION EXPENSE AND CAPITAL FY16 FY17 FY18 FY19 Expense: $700-800 million 45-55% 20-30% 10-20% 0-10% 50-60% 25-35% 5-15% 0-10% Note- Assumes FYE 2015 merger close, for illustrative purposes Incremental Merger Expense: $700-800MM Incremental Merger Capital: $300-400MM While gross merger costs will be higher, the charts above show the amounts that will be incremental to our G&A and capital run rates
  • 40. 40 CONCLUSION • Pleased with our top-line and gross profit performance – Investment in business transformation initiatives contributed to this achievement • Our focus: – Improving the consistency of our operational execution – Successfully rolling out our business transformation initiatives – Focused on developing new initiatives to enhance customer experience – Further developing our plans to integrate Sysco and US Foods • These strategic actions are the right priorities to both achieve our Vision and enhance profitability over the long-term
  • 41. 41
  • 42. 42 Non-GAAP Reconciliations Sysco Corporation and its Consolidated Subsidiaries Non-GAAP Reconciliation (Unaudited) Impact of Certain Items (In Thousands, Except for Share and Per Share Data) Sysco’s results of operations are impacted by certain items which include multiemployer withdrawal charges (MEPP), severance charges, US Foods merger and integration planning costs, charges from facility closures, US Foods related financing costs and a change in estimate of self-insurance specific to fiscal 2014, (collectively referred to as "Certain Items"). Management believes that adjusting its operating expenses, operating income, interest expense, net earnings and diluted earnings per share to remove these Certain Items provides an important perspective with respect to our results and provides meaningful supplemental information to both management and investors that removes these items which are difficult to predict and are often unanticipated, and which, as a result are difficult to include in analyst's financial models and our investors' expectations with any degree of specificity. Sysco believes the adjusted totals facilitate comparison on a year-over-year basis. The company uses these non-GAAP measures when evaluating its financial results as well as for internal planning and forecasting purposes. These financial measures should not be used as a substitute for GAAP measures in assessing the company’s results of operations for the periods presented. An analysis of any non-GAAP financial measure should be used in conjunction with results presented in accordance with GAAP. As a result, in the tables that follow, each period presented is adjusted to remove the Certain Items noted above.
  • 43. 26-Week Period Ended Dec. 27, 2014 26-Week Period Ended Dec. 28, 2013 26-Week Period Change in Dollars 26-Week Period % Change Operating expenses (GAAP) $ 3,492,795 $ 3,200,463 $ 292,332 9.1% Impact of MEPP charge - (1,451) 1,451 -100.0 Impact of severance charges (3,542) (3,596) 54 -1.5 Impact of US Foods merger and integration planning costs (118,499) (4,352) (114,147) 2,622.9 Impact of change in estimate of self insurance - (23,841) 23,841 -100.0 Impact of facility closure charges (2,203) (1,475) (728) 49.4 Operating expenses adjusted for certain items (Non-GAAP) $ 3,368,551 $ 3,165,748 $ 202,803 6.4% Operating Income (GAAP) $ 781,059 $ 829,975 $ (48,916) -5.9% Impact of MEPP charge - 1,451 (1,451) -100.0 Impact of severance charge 3,542 3,596 (54) -1.5 Impact of US Foods merger and integration planning costs 118,499 4,352 114,147 2,622.9 Impact of change in estimate of self insurance - 23,841 (23,841) -100.0 Impact of facility closure charges 2,203 1,475 728 49.4 Operating income adjusted for certain items (Non-GAAP) $ 905,303 $ 864,690 $ 40,613 4.7% Interest Expense (GAAP) $ 107,976 $ 60,312 $ 47,664 79.0% Impact of US Foods financing costs (55,761) - (55,761) NM Adjusted Interest Expense (Non-GAAP) $ 52,215 $ 60,312 $ (8,097) -13.4% Net earnings (GAAP) (1) $ 436,792 $ 496,425 $ (59,633) -12.0% Impact of MEPP charge - 924 (924) -100.0 Impact of severance charge 2,299 2,292 7 0.3 Impact of US Foods merger and integration planning costs 76,901 2,775 74,126 2,671.2 Impact of change in estimate of self insurance - 15,203 (15,203) -100.0 Impact of facility closure charges 1,430 941 489 52.0 Impact of US Foods financing costs 36,187 - 36,187 NM Net earnings adjusted for certain items (Non-GAAP) (1) $ 553,609 $ 518,560 $ 35,049 6.8% Diluted earnings per share (GAAP) (1) $ 0.73 $ 0.84 $ (0.11) -13.1% Impact of MEPP charge - - - NM Impact of severance charge - - - NM Impact of US Foods merger and integration planning costs 0.13 - 0.13 NM Impact of change in estimate of self insurance - 0.03 (0.03) NM Impact of facility closure charges - - - NM Impact of US Foods financing costs 0.06 - 0.06 NM Diluted EPS adjusted for certain items (Non-GAAP) (1) (2) $ 0.93 $ 0.88 $ 0.05 5.7% Diluted shares outstanding 594,610,315 589,516,342 (1) The net earnings and diluted earnings per share impacts are shown net of tax. Tax impact of adjustments for Certain Items was $63,189 and $12,576 for the 26-week periods ended December 27, 2014 and December 28, 2013, respectively. Amounts are calculated by multiplying the operating income impact of each item by each quarter's effective tax rate. (2) Individual components of diluted earnings per share may not add to the total presented due to rounding. Total diluted earnings per share is calculated using adjusted net earnings for certain items and adjusted net earnings - underlying business, both divided by diluted shares outstanding. NM represents that the percentage change is not meaningful 43 Non-GAAP Reconciliations (Unaudited) Impact of Certain Items (In Thousands, Except for Share and Per Share Data)
  • 44. Free cash flow represents net cash provided from operating activities less purchases of plant and equipment and includes proceeds from sales of plant and equipment. Adjusted free cash flow adjusts out the cash impact of our Certain Items representing primarily payments for US Foods merger and integration planning costs and a payment for contingency accrual that arose in fiscal 2014. It also adjusts for a contribution to our retirement plan which creates a year over year variance from timing. We made a $50 million contribution to our qualified pension plan in the first 26 weeks of fiscal 2015, while there was no contribution to this plan in the first 26 weeks of fiscal 2014 due to its funding in the fourth quarter of fiscal 2013. Sysco considers free cash flow and adjusted free cash flow to be liquidity measures that provide useful information to management and investors about the amount of cash generated by the business after the purchases and sales of buildings, fleet, equipment and technology, which may potentially be used to pay for, among other things, strategic uses of cash including dividend payments, share repurchases and acquisitions. Adjusted free cash flow further provides the amount of cash generated excluding larger payments sometimes incurred with our Certain Items and timing of pension contributions. We do not mean to imply that free cash flow and adjusted free cash flow are necessarily available for discretionary expenditures, however, as it may be necessary that we use it to make mandatory debt service or other payments. Free cash flow and adjusted free cash flow should not be used as a substitute in assessing the company’s liquidity for the periods presented. An analysis of any non-GAAP financial measure should be used in conjunction with results presented in accordance with GAAP. In the table that follows, free cash flow and adjusted free cash flow for each period presented are reconciled to net cash provided by operating activities. 26-Week Period Ended Dec. 27, 2014 26-Week Period Ended Dec. 28, 2013 26-Week Period Change in Dollars 26-Week Period % Change Net cash provided by operating activities (GAAP) $ 452,438 $ 458,164 $ (5,726) -1.2% Additions to plant and equipment (298,068) (270,432) (27,636) -10.2% Proceeds from sales of plant and equipment 2,130 23,480 (21,350) -90.9% Free Cash Flow (Non-GAAP) $ 156,500 $ 211,212 $ (54,712) -25.9% Cash impact of Certain Items 117,668 5,505 112,163 NM Timing impact of pension contribution 50,000 - 50,000 NM Adjusted Free Cash Flow (Non-GAAP) $ 324,168 $ 216,717 $ 107,451 49.6% Adjustments represent the cash impact of Certain Items with the exception of US Foods financing costs which does not impact either Non-GAAP measure since these costs did not require cash payment in either period. Adjustments for the first 26 weeks of fiscal 2015 include $81.2 million related to US Foods merger and integration planning costs, $17.2 million related to the payment of a contingency accrual that arose in the last 26 weeks of fiscal 2014 that was considered a Certain Item in fiscal 2014 and $3.3 million for all remaining applicable Certain Items. None of the adjustments for the first 26 weeks of fiscal 2014 were individually significant. These amounts will differ from the earnings impact of Certain Items as the timing of payments for these items may occur in a different period from the period the Certain Item charges were taken in the Statement of Consolidated Results of Operations. Non-GAAP Reconciliation (Unaudited) Free Cash Flow and Adjusted Free Cash Flow (In Thousands) 44
  • 45. Non-GAAP Reconciliation (Unaudited) Free Cash Flow and Adjusted Free Cash Flow (In Thousands) 45 Free cash flow represents net cash provided from operating activities less purchases of plant and equipment and includes proceeds from sales of plant and equipment. Adjusted free cash flow adjusts out the cash impact of our Certain Items representing primarily payments for US Foods merger and integration planning costs and payments for multiemployer pension plan withdrawals. Sysco considers free cash flow and adjusted free cash flow to be liquidity measures that provide useful information to management and investors about the amount of cash generated by the business after the purchases and sales of buildings, fleet, equipment and technology, which may potentially be used to pay for, among other things, strategic uses of cash including dividend payments, share repurchases and acquisitions. Adjusted free cash flow further provides the amount of cash generated excluding larger payments sometimes incurred with our Certain Items. We do not mean to imply that free cash flow and adjusted free cash flow are necessarily available for discretionary expenditures, however, as it may be necessary that we use it to make mandatory debt service or other payments. Free cash flow and adjusted free cash flow should not be used as a substitute in assessing the company’s liquidity for the periods presented. An analysis of any non-GAAP financial measure should be used in conjunction with results presented in accordance with GAAP. In the table that follows, free cash flow and adjusted free cash flow for each period presented are reconciled to net cash provided by operating activities. 52-Week Period Ended June 28, 2014 52-Week Period Ended June 29, 2013 52-Week Period Change in Dollars 52-Week Period % Change Net cash provided by operating activities (GAAP) $ 1,492,815 $ 1,511,594 $ (18,779) -1.2% Additions to plant and equipment (523,206) (511,862) (11,344) -2.2 Proceeds from sales of plant and equipment 25,790 15,527 10,263 66.1 Free Cash Flow (Non-GAAP) $ 995,399 $ 1,015,259 $ (19,860) -2.0% Adjustments 84,210 34,445 49,765 144.5 Adjusted Free Cash Flow (Non-GAAP) $ 1,079,609 $ 1,049,704 $ 29,905 2.8% Adjustments represent the cash impact of Certain Items with the exception of amortization of US Foods financing costs which does not impact either Non-GAAP measure. Adjustments for fiscal 2014 include $48.0 million related to US Foods merger and integration planning costs, $25.8 million related to the multiemployer pension withdrawals and $10.4 million for all remaining applicable Certain Items. Adjustments for fiscal 2013 include $20.4 million related to multiemployer pension, $6.3 million related to severance and $7.7 million for all remaining applicable Certain Items. These amounts will differ from the earnings impact of Certain Items as the timing of payments for these items may occur in a different period from the period the Certain Item charges were taken in the Statement of Consolidated Results of Operations.