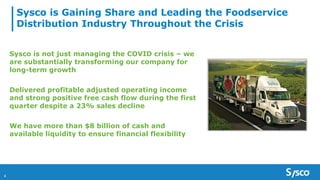
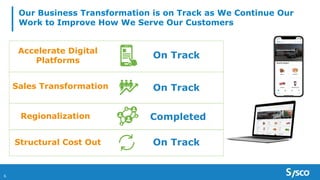
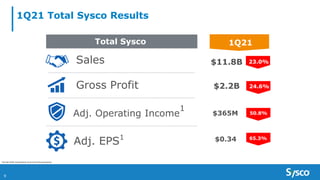
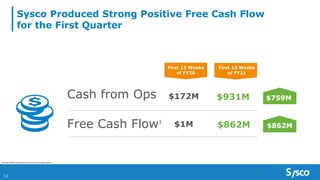
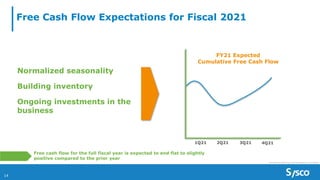
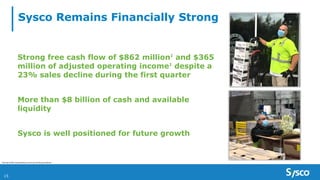
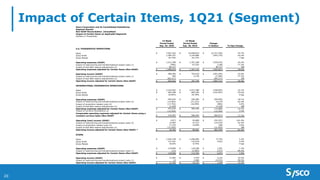
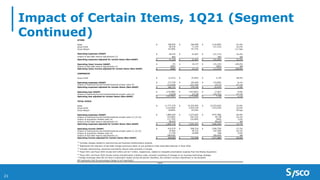
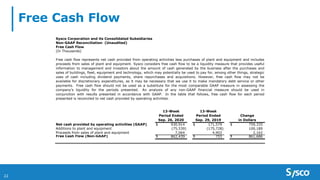
Sysco 1Q FY21 Earnings Results
November 3
Forward Looking Statements
Statements made in this presentation or in our earnings call for the first quarter of fiscal 2021 that look forward in time or that express management’s beliefs, expectations or hopes are forward-looking statements within the meaning of the
Private Securities Litigation Reform Act of 1995. Such forward-looking statements reflect the views of management at the time such statements are made and are subject to a number of risks, uncertainties, estimates, and assumptions that may
cause actual results to differ materially from current expectations. These statements include: the effect, impact, potential duration or other implications of the recent outbreak of a novel strain of coronavirus (“COVID-19”) and any expectations we
may have with respect thereto; our expectations regarding our ability to manage the current downturn and capitalize on our position as the industry leader as the global economy recovers; our expectations regarding future market share gains;
our expectations regarding the effects of our business transformation initiatives; our belief that our transformation initiatives will improve how we serve customers; our expectations regarding our efforts to regionalize our operations and the
benefits to our company from regionalization; our expectations that our efforts across our customer-facing tools and technology will improve service to our customers; our plans regarding the timing of the commencement of piloting our new
pricing software; our plans regarding our sales transformation initiative and our expectations regarding the effects of our new sales process; our expectations regarding our company, and our ability to attract and serve new customers, following
the COVID-19 crisis; our plans to remove structural expense from our company’s operations and the amount of structural savings we expect to deliver; our expectations regarding savings starting in fiscal 2022 from additional cost improvement
opportunities; the effects of our planned investments in digital technology; our expectations regarding the timing of improvements in the economy following the COVID-19 crisis; the impact on our results of government-imposed restrictions on
restaurant operations; our expectations that our work to accelerate growth will return to pre-COVID levels as demand resurges; our expectations that our investments in technology and our business will allow for future growth and exceptional
customer service; our belief that the steps undertaken as part of our management of the COVID-19 crisis to date will help us retain and win additional business from our independent restaurant customers beyond the pandemic; our expectations
regarding the impact of our strategy on our future operations, including on the service we provide our customers and on our ability to differentiate Sysco from other companies in our industry; our plans to reinvest a portion of our cost savings
into our growth agenda; our ability to deliver against our strategic priorities; statements regarding economic trends in the United States and abroad; our expectations regarding the amount of our capital expenditures in fiscal 2021; our
expectations regarding the deployment of capital proceeds that Sysco currently holds; our expectations regarding the effects of our divestiture of our CAKE business; our expectations regarding our free cash flow during fiscal 2021; and our
expectations regarding our cash performance in the second quarter of fiscal 2021.
The success of our plans and expectations regarding our operating performance are subject to the general risks associated with our business, including the risks of interruption of supplies due to lack of long-term contracts, severe weather, crop
conditions, work stoppages, intense competition, technology disruptions, dependence on large, long-term regional and national customers, inflation risks, the impact of fuel prices, adverse publicity, labor issues, political or financial instability,
trade restrictions, tariffs, currency exchange rates, transport capacity and costs and other factors relating to foreign trade, any or all of which could delay our receipt of product or increase our input costs. Risks and uncertainties also include the
impact and effects of public health crises, pandemics and epidemics, such as the COVID-19 pandemic, and the adverse impact thereof on our business, financial condition and results of operations, including, but not limited to, our growth, product
costs, supply chain, labor availability, logistical capabilities, customer demand for our products and industry demand generally, consumer spending, our liquidity, the price of our securities and trading markets with respect thereto, our credit
ratings, our ability to maintain compliance with the covenants in our credit agreement, our ability to access capital markets, and the global economy and financial markets generally. Risks and uncertainties also include risks impacting the
economy generally, including the risks that the current general economic conditions will deteriorate, or consumer confidence in the economy or consumer spending, particularly on food-away-from-home, may decline. Market conditions may not
improve. Competition and the impact of GPOs may reduce our margins and make it difficult for us to maintain our market share, growth rate and profitability. We may not be able to fully compensate for increases in fuel costs, and fuel hedging
arrangements intended to contain fuel costs could result in above market fuel costs. Our ability to meet our long-term strategic objectives depends on our ability to grow gross profit, leverage our supply chain costs and reduce administrative
costs. This will depend largely on the success of our various business initiatives, including efforts related to revenue management, expense management, our digital e-commerce strategy and any efforts related to restructuring or the reduction of
administrative costs. There are various risks related to these efforts, including the risk that if sales from our locally managed customers do not grow at the same rate as sales from regional and national customers, or if we are unable to continue
to accelerate local case growth, our gross margins may decline; the risk that we are unlikely to be able to predict inflation over the long term, and lower inflation is likely to produce lower gross profit; the risk that our efforts to mitigate increases
in warehouse costs may be unsuccessful; the risk that we may not be able to accelerate and/or identify additional administrative cost savings in order to compensate for any gross profit or supply chain cost leverage challenges; the risk that these
efforts may not provide the expected benefits in our anticipated time frame, if at all, and may prove costlier than expected; the risk that the actual costs of any initiatives may be greater or less than currently expected; and the risk of adverse
effects to our business, results of operations and liquidity if past and future undertakings, and the associated changes to our business, do not prove to be cost effective or do not result in the cost savings and other benefits at the levels that we
anticipate. Our plans related to and the timing of any initiatives are subject to change at any time based on management’s subjective evaluation of our overall business needs. If we are unable to realize the anticipated benefits from our efforts,
we could become cost disadvantaged in the marketplace, and our competitiveness and our profitability could decrease. Adverse publicity about us or lack of confidence in our products could negatively impact our reputation and reduce earnings.
Capital expenditures may vary based on changes in business plans and other factors, including risks related to the implementation of various initiatives, the timing and successful completion of acquisitions, construction schedules and the
possibility that other cash requirements could result in delays or cancellations of capital spending. Periods of significant or prolonged inflation or deflation, either overall or in certain product categories, can have a negative impact on us and our
customers, as high food costs can reduce consumer spending in the food-away-from-home market, and may negatively impact our sales, gross profit, operating income and earnings, and periods of deflation can be difficult to manage effectively.
Fluctuations in inflation and deflation, as well as fluctuations in the value of foreign currencies, are beyond our control and subject to broader market forces. Expanding into international markets presents unique challenges and risks, including
compliance with local laws, regulations and customs and the impact of local political and economic conditions, including the impact of Brexit and the “yellow vest” protests in France against a fuel tax increase, pension reform and the French
government, and such expansion efforts may not be successful. Any business that we acquire may not perform as expected, and we may not realize the anticipated benefits of our acquisitions. Expectations regarding the financial statement
impact of any acquisitions may change based on management’s subjective evaluation. A divestiture of one or more of our businesses may not provide the anticipated effects on our operations. Meeting our dividend target objectives depends on
our level of earnings, available cash and the success of our various strategic initiatives. Changes in applicable tax laws or regulations and the resolution of tax disputes could negatively affect our financial results. We rely on technology in our
business and any cybersecurity incident, other technology disruption or delay in implementing new technology could negatively affect our business and our relationships with customers. For a discussion of additional factors impacting Sysco’s
business, see our Annual Report on Form 10-K for the year ended June 27, 2020, as filed with the SEC, and our subsequent filings with the SEC. We do not undertake to update our forward-looking statements, except as required by applicable
law.
2
KEVIN HOURICAN
President & CEO
Sysco is Gaining Share and Leading the Foodservice
Distribution Industry Throughout the Crisis
Sysco is not just managing the COVID crisis – we
are substantially transforming our company for
long-term growth
Delivered profitable adjusted operating income
and strong positive free cash flow during the first
quarter despite a 23% sales decline
We have more than $8 billion of cash and
available liquidity to ensure financial flexibility
4
We are Doing More To Ensure the Success of the
Restaurants and Customers We Serve
5
Innovative Outdoor
Dining Solutions
Holiday Toolkit with Unique
Offerings for Restaurateurs
Accelerate Digital
Platforms
Sales Transformation
Structural Cost Out
Regionalization
Our Business Transformation is on Track as We Continue Our
Work to Improve How We Serve Our Customers
6
On Track
On Track
On Track
Completed
Sysco is Well Positioned for Future Success and Will
Lead the Industry with Innovation that Fuels Growth
We are doing more to support our
customers as evidenced by a
lower rate of closures vs. industry
Sales trends will be impacted by
changing restrictions
Sysco is leveraging the crisis to
transform our company for
favorable long-term improvement
7
JOEL GRADE
EVP & CFO
1Q21 Total Sysco Results
23.0%
Adj. Operating Income
1
Sales
Adj. EPS1
$11.8B
Total Sysco 1Q21
Gross Profit $2.2B
$365M
$0.34
24.6%
50.8%
65.3%
1 See Non-GAAP reconciliations at the end of the presentation.
9
1Q21 U.S. Foodservice Results
25.7%
Adj. Operating Income1
Sales $7.9B
U.S. Foodservice 1Q21
Gross Profit $1.6B
$1.1B
$503M
25.4%
18.6%
36.9%
1 See Non-GAAP reconciliations at the end of the presentation.
Adj. Operating Expenses1
10
1Q21 International Results
25.7%
Adj. Operating Income1
Sales $2.2B
International 1Q21
Gross Profit $450M
$432M
$19M
25.6%
14.7%
81.0%
1 See Non-GAAP reconciliations at the end of the presentation.
Adj. Operating Expenses1
11
1Q21 SYGMA Results
5.3%
Adj. Operating Income1
Sales $1.5B
SYGMA 1Q21
Gross Profit $132M
$120M
$12M
4.5%
3.5%
15.3%
1 See Non-GAAP reconciliations at the end of the presentation.
Adj. Operating Expenses1
12
Sysco Produced Strong Positive Free Cash Flow
for the First Quarter
Cash from Ops
Free Cash Flow1
$172M
$1M $862M
$931M $759M
1 See Non-GAAP reconciliations at the end of the presentation.
$862M
13
First 13 Weeks
of FY20
First 13 Weeks
of FY21
14
Free Cash Flow Expectations for Fiscal 2021
Normalized seasonality
Building inventory
Ongoing investments in the
business
1Q21 2Q21 3Q21 4Q21
FY21 Expected
Cumulative Free Cash Flow
Free cash flow for the full fiscal year is expected to end flat to slightly
positive compared to the prior year
Expected cumulative free cash flow graph line is illustrative
Sysco Remains Financially Strong
Strong free cash flow of $862 million1
and $365
million of adjusted operating income1
despite a
23% sales decline during the first quarter
More than $8 billion of cash and available
liquidity
Sysco is well positioned for future growth
15
1 See Non-GAAP reconciliations at the end of the presentation.
NON-GAAP
RECONCILIATIONS
Impact of Certain Items
Sysco’s results of operations for fiscal 2021 and fiscal 2020 were impacted by restructuring and transformational project costs consisting of: (1) restructuring charges;
(2) expenses associated with our various transformation initiatives; and (3) facility closure and severance charges. All acquisition-related costs in fiscal 2021 and fiscal 2020 that
have been designated as Certain Items relate to the fiscal 2017 acquisition of Cucina Lux Investments Limited (the Brakes Acquisition). These include acquisition-related intangible
amortization expense.
Fiscal 2021 results of operations were also positively impacted by the reduction of bad debt expense previously recognized in fiscal 2020 due to the unexpected
impact of the COVID-19 pandemic on the collectability of our pre-pandemic trade receivable balances. Many of Sysco’s customers, including those in the restaurant, hospitality and
education segments, are operating at a substantially reduced volume due to governmental requirements for closures or other social-distancing measures and a portion of Sysco’s
customers are closed. Some of these customers ceased paying their outstanding receivables, creating uncertainty as to their collectability. We experienced an increase in past due
receivables and recognized additional bad debt charges in the third and fourth quarters of fiscal 2020; however, collections have improved in fiscal 2021. We have estimated
uncollectible amounts based on the current collection experience and by applying write-off percentages based on historical loss experience, including loss experience during times of
local and regional disasters. The COVID-19 pandemic is more widespread and longer in duration than historical disasters impacting our business, and it is possible that actual
uncollectible amounts will differ and additional charges may be required; however, if collections continue to improve, it is also possible that additional reductions in our bad debt
reserve could occur. While Sysco traditionally incurs bad debt expense, the magnitude of such expenses and benefits, that we have experienced is not indicative of our normal
operations. Our adjusted results have not been normalized in a manner that would exclude the full impact of the COVID-19 pandemic on our business. As such, Sysco has not
adjusted its results for lost sales, inventory write-offs or other costs associated with the COVID-19 pandemic not previously stated.
The results of our foreign operations can be impacted due to changes in exchange rates applicable in converting local currencies to U.S. dollars. We measure our
International Foodservice Operations results on a constant currency basis. Constant currency operating results are calculated by translating current-period local currency operating
results with the currency exchange rates used to translate the financial statements in the comparable prior-year period to determine what the current-period U.S. dollar operating
results would have been if the currency exchange rate had not changed from the comparable prior-year period. The constant currency impact on our adjusted International
Foodservice Operations results are disclosed when the impact exceeds a defined threshold of greater than 1% on the growth metric. If the amount does not exceed this threshold, a
disclosure will be made that the impact of the currency change was not significant.
Management believes that adjusting its operating expenses, operating income, net earnings and diluted earnings per share to remove these Certain Items and
presenting its International Foodservice Operations results on a constant currency basis, provides an important perspective with respect to our underlying business trends and results
and provides meaningful supplemental information to both management and investors that (1) is indicative of the performance of the company’s underlying operations, facilitating
comparisons on a year-over-year basis and (2) removes those items that are difficult to predict and are often unanticipated and that, as a result, are difficult to include in analysts’
financial models and our investors’ expectations with any degree of specificity.
Although Sysco has a history of growth through acquisitions, the Brakes Group was significantly larger than the companies historically acquired by Sysco, with a
proportionately greater impact on Sysco’s consolidated financial statements. Accordingly, Sysco is excluding from its non-GAAP financial measures for the relevant period solely those
acquisition costs specific to the Brakes Acquisition. We believe this approach significantly enhances the comparability of Sysco’s results for fiscal 2021 and fiscal 2020.
Set forth below is a reconciliation of sales, operating expenses, operating income, interest expense, net earnings and diluted earnings per share to adjusted results for
these measures for the periods presented. Individual components of diluted earnings per share may not add up to the total presented due to rounding. Adjusted diluted earnings per
share is calculated using adjusted net earnings divided by diluted shares outstanding.
18
Impact of Certain Items, 1Q21
19
Sysco Corporation and its Consolidated Subsidiaries
Non-GAAP Reconciliation (Unaudited)
Impact of Certain Items
(Dollars in Thousands, Except for Share and Per Share Data)
13-Week
Period Ended
Sep. 26, 2020
13-Week
Period Ended
Sep. 28, 2019
Change
in Dollars % Change
Operating expenses (GAAP) $ 1,800,266 $ 2,275,052 $ (474,786) -20.9%
Impact of restructuring and transformational project costs (1) (25,964) (56,722) 30,758 -54.2%
Impact of acquisition-related costs (2) (17,755) (16,909) (846) 5.0%
Impact of bad debt reserve adjustments (3) 98,629 - 98,629 NM
Operating expenses adjusted for Certain Items (Non-GAAP) $ 1,855,176 $ 2,201,421 $ (346,245) -15.7%
Operating income (GAAP) $ 419,579 $ 668,318 $ (248,739) -37.2%
Impact of restructuring and transformational project costs (1) 25,964 56,722 (30,758) -54.2%
Impact of acquisition-related costs (2) 17,755 16,909 846 5.0%
Impact of bad debt reserve adjustments (3) (98,629) - (98,629) NM
Operating income adjusted for Certain Items (Non-GAAP) $ 364,669 $ 741,949 $ (377,280) -50.8%
Other expense (income) (GAAP) $ 14,124 $ 3,112 $ 11,012 NM
Impact of loss on sale of a business (12,043) - (12,043) NM
Other expense (income) (Non-GAAP) $ 2,081 $ 3,112 $ (1,031) -33.1%
Net earnings (GAAP) $ 216,900 $ 453,781 $ (236,881) -52.2%
Impact of restructuring and transformational project costs (1) 25,964 56,722 (30,758) -54.2%
Impact of acquisition-related costs (2) 17,755 16,909 846 5.0%
Impact of bad debt reserve adjustments (3) (98,629) - (98,629) NM
Impact of loss on sale of a business 12,043 - 12,043 NM
Tax impact of restructuring and transformational project costs (4) (5,920) (13,921) 8,001 -57.5%
Tax impact of acquisition-related costs (4) (4,048) (4,149) 101 -2.4%
Tax Impact of bad debt reserve adjustments (4) 22,488 - 22,488 NM
Tax impact of loss on sale of a business (7,553) - (7,553) NM
Tax impact of foreign tax rate change (5,548) 924 (6,472) NM
Net earnings adjusted for Certain Items (Non-GAAP) $ 173,452 $ 510,266 $ (336,814) -66.0%
Diluted earnings per share (GAAP) $ 0.42 $ 0.87 $ (0.45) -51.7%
Impact of restructuring and transformational project costs (1) 0.05 0.11 (0.06) -54.5%
Impact of acquisition-related costs (2) 0.03 0.03 - NM
Impact of bad debt reserve adjustments (3) (0.19) - (0.19) NM
Impact of loss on sale of a business 0.02 - 0.02 NM
Tax impact of restructuring and transformational project costs (4) (0.01) (0.03) 0.02 -66.7%
Tax impact of acquisition-related costs (4) (0.01) (0.01) - NM
Tax Impact of bad debt reserve adjustments (4) 0.04 - 0.04 NM
Tax impact of loss on sale of a business (0.01) - (0.01) NM
Tax impact of foreign tax rate change (0.01) - (0.01) NM
Diluted earnings per share adjusted for Certain Items (Non-GAAP)
(5) $ 0.34 $ 0.98 $ (0.64) -65.3%
Diluted shares outstanding 510,738,760 518,761,456
NM represents that the percentage change is not meaningful.
- more -
(4)
The tax impact of adjustments for Certain Items are calculated by multiplying the pretax impact of each Certain Item by the statutory rates in effect for each
jurisdiction where the Certain Item was incurred.
(5)
Individual components of diluted earnings per share may not add up to the total presented due to rounding. Total diluted earnings per share is calculated using
adjusted net earnings divided by diluted shares outstanding.
(2)
Fiscal 2021 and fiscal 2020 include $18 million and $17 million, respectively, related to intangible amortization expense from the Brakes Acquisition, which is included
in the results of International Foodservice.
(1)
Fiscal 2021 includes $13 million related to various transformation initiative costs, primarily consisting of changes to our business technology strategy, and $13 million
primarily consisting of restructuring charges. Fiscal 2020 includes $30 million related to restructuring, facility closure and severance charges and $27 million related to
various transformation initiative costs, primarily consisting of changes to our business technology strategy.
(3)
Represents the reduction of bad debt charges previously taken on pre-pandemic trade receivable balances in fiscal 2020.
Impact of Certain Items, 1Q21 (Segment)
20
Sysco Corporation and its Consolidated Subsidiaries
Segment Results
Non-GAAP Reconciliation (Unaudited)
Impact of Certain Items on Applicable Segments
(Dollars in Thousands)
13-Week
Period Ended
Sep. 26, 2020
13-Week
Period Ended
Sep. 28, 2019
Change
in Dollars %/bps Change
U.S. FOODSERVICE OPERATIONS
Sales $ 7,921,533 $ 10,658,633 $ (2,737,100) -25.7%
Gross Profit 1,599,707 2,144,886 (545,179) -25.4%
Gross Margin 20.19% 20.12% 7 bps
Operating expenses (GAAP) $ 1,011,298 $ 1,351,268 $ (339,970) -25.2%
Impact of restructuring and transformational project costs (1) (940) (4,126) 3,186 -77.2%
Impact of bad debt reserve adjustments (2) 86,317 - 86,317 NM
Operating expenses adjusted for Certain Items (Non-GAAP) $ 1,096,675 $ 1,347,142 $ (250,467) -18.6%
Operating income (GAAP) $ 588,409 $ 793,618 $ (205,209) -25.9%
Impact of restructuring and transformational project costs (1) 940 4,126 (3,186) -77.2%
Impact of bad debt reserve adjustments (2) (86,317) - (86,317) NM
Operating income adjusted for Certain Items (Non-GAAP) $ 503,032 $ 797,744 $ (294,712) -36.9%
INTERNATIONAL FOODSERVICE OPERATIONS
Sales $ 2,163,693 $ 2,912,388 $ (748,695) -25.7%
Gross Profit $ 450,398 $ 605,185 $ (154,787) -25.6%
Gross Margin 20.82% 20.78% 4 bps
Operating expenses (GAAP) $ 450,935 $ 550,385 $ (99,450) -18.1%
Impact of restructuring and transformational project costs (3) (12,993) (27,272) 14,279 -52.4%
Impact of acquisition-related costs (4) (17,755) (16,909) (846) 5.0%
Impact of bad debt reserve adjustments (2) 11,429 - 11,429 NM
Operating expenses adjusted for Certain Items (Non-GAAP) $ 431,616 $ 506,204 $ (74,588) -14.7%
Impact of currency fluctuations (3) (12,329) - (12,329) 2.4%
Comparable operating expenses adjusted for Certain Items using a
constant currency basis (Non-GAAP) $ 419,287 $ 506,204 $ (86,917) -17.2%
Operating (loss) income (GAAP) $ (537) $ 54,800 $ (55,337) -101.0%
Impact of restructuring and transformational project costs (3) 12,993 27,272 (14,279) -52.4%
Impact of acquisition-related costs (4) 17,755 16,909 846 5.0%
Impact of bad debt reserve adjustments (2) (11,429) - (11,429) NM
Operating income adjusted for Certain Items (Non-GAAP) * $ 18,782 $ 98,981 $ (80,199) -81.0%
SYGMA
Sales $ 1,524,148 $ 1,446,994 $ 77,154 5.3%
Gross Profit 131,541 125,918 5,623 4.5%
Gross Margin 8.63% 8.70% -7 bps
Operating expenses (GAAP) $ 119,849 $ 118,348 $ 1,501 1.3%
Impact of restructuring and transformational project costs (1) (13) (2,585) 2,572 -99.5%
Operating expenses adjusted for Certain Items (Non-GAAP) $ 119,836 $ 115,763 $ 4,073 3.5%
Operating income (GAAP) $ 11,692 $ 7,570 $ 4,122 54.5%
Impact of restructuring and transformational project costs (1) 13 2,585 (2,572) -99.5%
Operating income adjusted for Certain Items (Non-GAAP) $ 11,705 $ 10,155 $ 1,550 15.3%
Impact of Certain Items, 1Q21 (Segment
Continued)
21
OTHER
Sales $ 168,005 $ 284,990 $ (116,985) -41.0%
Gross Profit 40,430 71,744 (31,314) -43.6%
Gross Margin 24.06% 25.17% -111 bps
Operating expenses (GAAP) $ 40,435 $ 61,607 $ (21,172) -34.4%
Impact of bad debt reserve adjustments (2) 883 - 883 NM
Operating expenses adjusted for certain items (Non-GAAP) $ 41,318 $ 61,607 $ (20,289) -32.9%
Operating (loss) income (GAAP) $ (5) $ 10,137 $ (10,142) -100.0%
Impact of bad debt reserve adjustments (2) (883) - (883) NM
Operating (loss) income adjusted for certain items (Non-GAAP) $ (888) $ 10,137 $ (11,025) -108.8%
CORPORATE
Gross Profit $ (2,231) $ (4,363) $ 2,132 -48.9%
Operating expenses (GAAP) $ 177,749 $ 193,444 $ (15,695) -8.1%
Impact of restructuring and transformational project costs (5) (12,018) (22,739) 10,721 -47.1%
Operating expenses adjusted for Certain Items (Non-GAAP) $ 165,731 $ 170,705 $ (4,974) -2.9%
Operating loss (GAAP) $ (179,980) $ (197,807) $ 17,827 -9.0%
Impact of restructuring and transformational project costs (5) 12,018 22,739 (10,721) -47.1%
Operating loss adjusted for Certain Items (Non-GAAP) $ (167,962) $ (175,068) $ 7,106 -4.1%
TOTAL SYSCO
Sales $ 11,777,379 $ 15,303,005 $ (3,525,626) -23.0%
Gross Profit 2,219,845 2,943,370 (723,525) -24.6%
Gross Margin 18.85% 19.23% -39 bps
Operating expenses (GAAP) $ 1,800,266 $ 2,275,052 $ (474,786) -20.9%
Impact of restructuring and transformational project costs (1) (3) (5) (25,964) (56,722) 30,758 -54.2%
Impact of acquisition-related costs (4) (17,755) (16,909) (846) 5.0%
Impact of bad debt reserve adjustments (2) 98,629 - 98,629 NM
Operating expenses adjusted for Certain Items (Non-GAAP) $ 1,855,176 $ 2,201,421 $ (346,245) -15.7%
Operating income (GAAP) $ 419,579 $ 668,318 $ (248,739) -37.2%
Impact of restructuring and transformational project costs (1) (3) (5) 25,964 56,722 (30,758) -54.2%
Impact of acquisition-related costs (4) 17,755 16,909 846 5.0%
Impact of bad debt reserve adjustments (2) (98,629) - (98,629) NM
Operating income adjusted for Certain Items (Non-GAAP) $ 364,669 $ 741,949 $ (377,280) -50.8%
(1)
Includes charges related to restructuring and business transformation projects.
- more -
(3)
Includes restructuring, severance and facility closure costs primarily in Europe.
(4)
Fiscal 2021 and fiscal 2020 include $18 million and $17 million, respectively, related to intangible amortization expense from the Brakes Acquisition.
NM represents that the percentage change is not meaningful.
(5)
Fiscal 2021 and fiscal 2020 include various transformation initiative costs, primarily consisting of changes to our business technology strategy.
(2)
Represents the reduction of bad debt charges previously taken on pre-pandemic trade receivable balances in fiscal 2020.
* Foreign exchange rates did not have a meaningful impact during the period; therefore, the constant currency adjustment is not disclosed.
Free Cash Flow
22
Sysco Corporation and its Consolidated Subsidiaries
Free Cash Flow
Net cash provided by operating activities (GAAP) $ 930,914 $ 171,579 $ 759,335
Additions to plant and equipment (75,539) (175,728) 100,189
Proceeds from sales of plant and equipment 7,064 4,902 2,162
Free Cash Flow (Non-GAAP) $ 862,439 $ 753 $ 861,686
Non-GAAP Reconciliation (Unaudited)
(In Thousands)
Free cash flow represents net cash provided from operating activities less purchases of plant and equipment and includes
proceeds from sales of plant and equipment. Sysco considers free cash flow to be a liquidity measure that provides useful
information to management and investors about the amount of cash generated by the business after the purchases and
sales of buildings, fleet, equipment and technology, which may potentially be used to pay for, among other things, strategic
uses of cash including dividend payments, share repurchases and acquisitions. However, free cash flow may not be
available for discretionary expenditures, as it may be necessary that we use it to make mandatory debt service or other
payments. Free cash flow should not be used as a substitute for the most comparable GAAP measure in assessing the
company’s liquidity for the periods presented. An analysis of any non-GAAP financial measure should be used in
conjunction with results presented in accordance with GAAP. In the table that follows, free cash flow for each period
presented is reconciled to net cash provided by operating activities.
13-Week
Period Ended
Sep. 26, 2020
13-Week
Period Ended
Sep. 29, 2019
Change
in Dollars

Q1 2021 Earning

  • 1.
    Sysco 1Q FY21Earnings Results November 3
  • 2.
    Forward Looking Statements Statementsmade in this presentation or in our earnings call for the first quarter of fiscal 2021 that look forward in time or that express management’s beliefs, expectations or hopes are forward-looking statements within the meaning of the Private Securities Litigation Reform Act of 1995. Such forward-looking statements reflect the views of management at the time such statements are made and are subject to a number of risks, uncertainties, estimates, and assumptions that may cause actual results to differ materially from current expectations. These statements include: the effect, impact, potential duration or other implications of the recent outbreak of a novel strain of coronavirus (“COVID-19”) and any expectations we may have with respect thereto; our expectations regarding our ability to manage the current downturn and capitalize on our position as the industry leader as the global economy recovers; our expectations regarding future market share gains; our expectations regarding the effects of our business transformation initiatives; our belief that our transformation initiatives will improve how we serve customers; our expectations regarding our efforts to regionalize our operations and the benefits to our company from regionalization; our expectations that our efforts across our customer-facing tools and technology will improve service to our customers; our plans regarding the timing of the commencement of piloting our new pricing software; our plans regarding our sales transformation initiative and our expectations regarding the effects of our new sales process; our expectations regarding our company, and our ability to attract and serve new customers, following the COVID-19 crisis; our plans to remove structural expense from our company’s operations and the amount of structural savings we expect to deliver; our expectations regarding savings starting in fiscal 2022 from additional cost improvement opportunities; the effects of our planned investments in digital technology; our expectations regarding the timing of improvements in the economy following the COVID-19 crisis; the impact on our results of government-imposed restrictions on restaurant operations; our expectations that our work to accelerate growth will return to pre-COVID levels as demand resurges; our expectations that our investments in technology and our business will allow for future growth and exceptional customer service; our belief that the steps undertaken as part of our management of the COVID-19 crisis to date will help us retain and win additional business from our independent restaurant customers beyond the pandemic; our expectations regarding the impact of our strategy on our future operations, including on the service we provide our customers and on our ability to differentiate Sysco from other companies in our industry; our plans to reinvest a portion of our cost savings into our growth agenda; our ability to deliver against our strategic priorities; statements regarding economic trends in the United States and abroad; our expectations regarding the amount of our capital expenditures in fiscal 2021; our expectations regarding the deployment of capital proceeds that Sysco currently holds; our expectations regarding the effects of our divestiture of our CAKE business; our expectations regarding our free cash flow during fiscal 2021; and our expectations regarding our cash performance in the second quarter of fiscal 2021. The success of our plans and expectations regarding our operating performance are subject to the general risks associated with our business, including the risks of interruption of supplies due to lack of long-term contracts, severe weather, crop conditions, work stoppages, intense competition, technology disruptions, dependence on large, long-term regional and national customers, inflation risks, the impact of fuel prices, adverse publicity, labor issues, political or financial instability, trade restrictions, tariffs, currency exchange rates, transport capacity and costs and other factors relating to foreign trade, any or all of which could delay our receipt of product or increase our input costs. Risks and uncertainties also include the impact and effects of public health crises, pandemics and epidemics, such as the COVID-19 pandemic, and the adverse impact thereof on our business, financial condition and results of operations, including, but not limited to, our growth, product costs, supply chain, labor availability, logistical capabilities, customer demand for our products and industry demand generally, consumer spending, our liquidity, the price of our securities and trading markets with respect thereto, our credit ratings, our ability to maintain compliance with the covenants in our credit agreement, our ability to access capital markets, and the global economy and financial markets generally. Risks and uncertainties also include risks impacting the economy generally, including the risks that the current general economic conditions will deteriorate, or consumer confidence in the economy or consumer spending, particularly on food-away-from-home, may decline. Market conditions may not improve. Competition and the impact of GPOs may reduce our margins and make it difficult for us to maintain our market share, growth rate and profitability. We may not be able to fully compensate for increases in fuel costs, and fuel hedging arrangements intended to contain fuel costs could result in above market fuel costs. Our ability to meet our long-term strategic objectives depends on our ability to grow gross profit, leverage our supply chain costs and reduce administrative costs. This will depend largely on the success of our various business initiatives, including efforts related to revenue management, expense management, our digital e-commerce strategy and any efforts related to restructuring or the reduction of administrative costs. There are various risks related to these efforts, including the risk that if sales from our locally managed customers do not grow at the same rate as sales from regional and national customers, or if we are unable to continue to accelerate local case growth, our gross margins may decline; the risk that we are unlikely to be able to predict inflation over the long term, and lower inflation is likely to produce lower gross profit; the risk that our efforts to mitigate increases in warehouse costs may be unsuccessful; the risk that we may not be able to accelerate and/or identify additional administrative cost savings in order to compensate for any gross profit or supply chain cost leverage challenges; the risk that these efforts may not provide the expected benefits in our anticipated time frame, if at all, and may prove costlier than expected; the risk that the actual costs of any initiatives may be greater or less than currently expected; and the risk of adverse effects to our business, results of operations and liquidity if past and future undertakings, and the associated changes to our business, do not prove to be cost effective or do not result in the cost savings and other benefits at the levels that we anticipate. Our plans related to and the timing of any initiatives are subject to change at any time based on management’s subjective evaluation of our overall business needs. If we are unable to realize the anticipated benefits from our efforts, we could become cost disadvantaged in the marketplace, and our competitiveness and our profitability could decrease. Adverse publicity about us or lack of confidence in our products could negatively impact our reputation and reduce earnings. Capital expenditures may vary based on changes in business plans and other factors, including risks related to the implementation of various initiatives, the timing and successful completion of acquisitions, construction schedules and the possibility that other cash requirements could result in delays or cancellations of capital spending. Periods of significant or prolonged inflation or deflation, either overall or in certain product categories, can have a negative impact on us and our customers, as high food costs can reduce consumer spending in the food-away-from-home market, and may negatively impact our sales, gross profit, operating income and earnings, and periods of deflation can be difficult to manage effectively. Fluctuations in inflation and deflation, as well as fluctuations in the value of foreign currencies, are beyond our control and subject to broader market forces. Expanding into international markets presents unique challenges and risks, including compliance with local laws, regulations and customs and the impact of local political and economic conditions, including the impact of Brexit and the “yellow vest” protests in France against a fuel tax increase, pension reform and the French government, and such expansion efforts may not be successful. Any business that we acquire may not perform as expected, and we may not realize the anticipated benefits of our acquisitions. Expectations regarding the financial statement impact of any acquisitions may change based on management’s subjective evaluation. A divestiture of one or more of our businesses may not provide the anticipated effects on our operations. Meeting our dividend target objectives depends on our level of earnings, available cash and the success of our various strategic initiatives. Changes in applicable tax laws or regulations and the resolution of tax disputes could negatively affect our financial results. We rely on technology in our business and any cybersecurity incident, other technology disruption or delay in implementing new technology could negatively affect our business and our relationships with customers. For a discussion of additional factors impacting Sysco’s business, see our Annual Report on Form 10-K for the year ended June 27, 2020, as filed with the SEC, and our subsequent filings with the SEC. We do not undertake to update our forward-looking statements, except as required by applicable law. 2
  • 3.
  • 4.
    Sysco is GainingShare and Leading the Foodservice Distribution Industry Throughout the Crisis Sysco is not just managing the COVID crisis – we are substantially transforming our company for long-term growth Delivered profitable adjusted operating income and strong positive free cash flow during the first quarter despite a 23% sales decline We have more than $8 billion of cash and available liquidity to ensure financial flexibility 4
  • 5.
    We are DoingMore To Ensure the Success of the Restaurants and Customers We Serve 5 Innovative Outdoor Dining Solutions Holiday Toolkit with Unique Offerings for Restaurateurs
  • 6.
    Accelerate Digital Platforms Sales Transformation StructuralCost Out Regionalization Our Business Transformation is on Track as We Continue Our Work to Improve How We Serve Our Customers 6 On Track On Track On Track Completed
  • 7.
    Sysco is WellPositioned for Future Success and Will Lead the Industry with Innovation that Fuels Growth We are doing more to support our customers as evidenced by a lower rate of closures vs. industry Sales trends will be impacted by changing restrictions Sysco is leveraging the crisis to transform our company for favorable long-term improvement 7
  • 8.
  • 9.
    1Q21 Total SyscoResults 23.0% Adj. Operating Income 1 Sales Adj. EPS1 $11.8B Total Sysco 1Q21 Gross Profit $2.2B $365M $0.34 24.6% 50.8% 65.3% 1 See Non-GAAP reconciliations at the end of the presentation. 9
  • 10.
    1Q21 U.S. FoodserviceResults 25.7% Adj. Operating Income1 Sales $7.9B U.S. Foodservice 1Q21 Gross Profit $1.6B $1.1B $503M 25.4% 18.6% 36.9% 1 See Non-GAAP reconciliations at the end of the presentation. Adj. Operating Expenses1 10
  • 11.
    1Q21 International Results 25.7% Adj.Operating Income1 Sales $2.2B International 1Q21 Gross Profit $450M $432M $19M 25.6% 14.7% 81.0% 1 See Non-GAAP reconciliations at the end of the presentation. Adj. Operating Expenses1 11
  • 12.
    1Q21 SYGMA Results 5.3% Adj.Operating Income1 Sales $1.5B SYGMA 1Q21 Gross Profit $132M $120M $12M 4.5% 3.5% 15.3% 1 See Non-GAAP reconciliations at the end of the presentation. Adj. Operating Expenses1 12
  • 13.
    Sysco Produced StrongPositive Free Cash Flow for the First Quarter Cash from Ops Free Cash Flow1 $172M $1M $862M $931M $759M 1 See Non-GAAP reconciliations at the end of the presentation. $862M 13 First 13 Weeks of FY20 First 13 Weeks of FY21
  • 14.
    14 Free Cash FlowExpectations for Fiscal 2021 Normalized seasonality Building inventory Ongoing investments in the business 1Q21 2Q21 3Q21 4Q21 FY21 Expected Cumulative Free Cash Flow Free cash flow for the full fiscal year is expected to end flat to slightly positive compared to the prior year Expected cumulative free cash flow graph line is illustrative
  • 15.
    Sysco Remains FinanciallyStrong Strong free cash flow of $862 million1 and $365 million of adjusted operating income1 despite a 23% sales decline during the first quarter More than $8 billion of cash and available liquidity Sysco is well positioned for future growth 15 1 See Non-GAAP reconciliations at the end of the presentation.
  • 17.
  • 18.
    Impact of CertainItems Sysco’s results of operations for fiscal 2021 and fiscal 2020 were impacted by restructuring and transformational project costs consisting of: (1) restructuring charges; (2) expenses associated with our various transformation initiatives; and (3) facility closure and severance charges. All acquisition-related costs in fiscal 2021 and fiscal 2020 that have been designated as Certain Items relate to the fiscal 2017 acquisition of Cucina Lux Investments Limited (the Brakes Acquisition). These include acquisition-related intangible amortization expense. Fiscal 2021 results of operations were also positively impacted by the reduction of bad debt expense previously recognized in fiscal 2020 due to the unexpected impact of the COVID-19 pandemic on the collectability of our pre-pandemic trade receivable balances. Many of Sysco’s customers, including those in the restaurant, hospitality and education segments, are operating at a substantially reduced volume due to governmental requirements for closures or other social-distancing measures and a portion of Sysco’s customers are closed. Some of these customers ceased paying their outstanding receivables, creating uncertainty as to their collectability. We experienced an increase in past due receivables and recognized additional bad debt charges in the third and fourth quarters of fiscal 2020; however, collections have improved in fiscal 2021. We have estimated uncollectible amounts based on the current collection experience and by applying write-off percentages based on historical loss experience, including loss experience during times of local and regional disasters. The COVID-19 pandemic is more widespread and longer in duration than historical disasters impacting our business, and it is possible that actual uncollectible amounts will differ and additional charges may be required; however, if collections continue to improve, it is also possible that additional reductions in our bad debt reserve could occur. While Sysco traditionally incurs bad debt expense, the magnitude of such expenses and benefits, that we have experienced is not indicative of our normal operations. Our adjusted results have not been normalized in a manner that would exclude the full impact of the COVID-19 pandemic on our business. As such, Sysco has not adjusted its results for lost sales, inventory write-offs or other costs associated with the COVID-19 pandemic not previously stated. The results of our foreign operations can be impacted due to changes in exchange rates applicable in converting local currencies to U.S. dollars. We measure our International Foodservice Operations results on a constant currency basis. Constant currency operating results are calculated by translating current-period local currency operating results with the currency exchange rates used to translate the financial statements in the comparable prior-year period to determine what the current-period U.S. dollar operating results would have been if the currency exchange rate had not changed from the comparable prior-year period. The constant currency impact on our adjusted International Foodservice Operations results are disclosed when the impact exceeds a defined threshold of greater than 1% on the growth metric. If the amount does not exceed this threshold, a disclosure will be made that the impact of the currency change was not significant. Management believes that adjusting its operating expenses, operating income, net earnings and diluted earnings per share to remove these Certain Items and presenting its International Foodservice Operations results on a constant currency basis, provides an important perspective with respect to our underlying business trends and results and provides meaningful supplemental information to both management and investors that (1) is indicative of the performance of the company’s underlying operations, facilitating comparisons on a year-over-year basis and (2) removes those items that are difficult to predict and are often unanticipated and that, as a result, are difficult to include in analysts’ financial models and our investors’ expectations with any degree of specificity. Although Sysco has a history of growth through acquisitions, the Brakes Group was significantly larger than the companies historically acquired by Sysco, with a proportionately greater impact on Sysco’s consolidated financial statements. Accordingly, Sysco is excluding from its non-GAAP financial measures for the relevant period solely those acquisition costs specific to the Brakes Acquisition. We believe this approach significantly enhances the comparability of Sysco’s results for fiscal 2021 and fiscal 2020. Set forth below is a reconciliation of sales, operating expenses, operating income, interest expense, net earnings and diluted earnings per share to adjusted results for these measures for the periods presented. Individual components of diluted earnings per share may not add up to the total presented due to rounding. Adjusted diluted earnings per share is calculated using adjusted net earnings divided by diluted shares outstanding. 18
  • 19.
    Impact of CertainItems, 1Q21 19 Sysco Corporation and its Consolidated Subsidiaries Non-GAAP Reconciliation (Unaudited) Impact of Certain Items (Dollars in Thousands, Except for Share and Per Share Data) 13-Week Period Ended Sep. 26, 2020 13-Week Period Ended Sep. 28, 2019 Change in Dollars % Change Operating expenses (GAAP) $ 1,800,266 $ 2,275,052 $ (474,786) -20.9% Impact of restructuring and transformational project costs (1) (25,964) (56,722) 30,758 -54.2% Impact of acquisition-related costs (2) (17,755) (16,909) (846) 5.0% Impact of bad debt reserve adjustments (3) 98,629 - 98,629 NM Operating expenses adjusted for Certain Items (Non-GAAP) $ 1,855,176 $ 2,201,421 $ (346,245) -15.7% Operating income (GAAP) $ 419,579 $ 668,318 $ (248,739) -37.2% Impact of restructuring and transformational project costs (1) 25,964 56,722 (30,758) -54.2% Impact of acquisition-related costs (2) 17,755 16,909 846 5.0% Impact of bad debt reserve adjustments (3) (98,629) - (98,629) NM Operating income adjusted for Certain Items (Non-GAAP) $ 364,669 $ 741,949 $ (377,280) -50.8% Other expense (income) (GAAP) $ 14,124 $ 3,112 $ 11,012 NM Impact of loss on sale of a business (12,043) - (12,043) NM Other expense (income) (Non-GAAP) $ 2,081 $ 3,112 $ (1,031) -33.1% Net earnings (GAAP) $ 216,900 $ 453,781 $ (236,881) -52.2% Impact of restructuring and transformational project costs (1) 25,964 56,722 (30,758) -54.2% Impact of acquisition-related costs (2) 17,755 16,909 846 5.0% Impact of bad debt reserve adjustments (3) (98,629) - (98,629) NM Impact of loss on sale of a business 12,043 - 12,043 NM Tax impact of restructuring and transformational project costs (4) (5,920) (13,921) 8,001 -57.5% Tax impact of acquisition-related costs (4) (4,048) (4,149) 101 -2.4% Tax Impact of bad debt reserve adjustments (4) 22,488 - 22,488 NM Tax impact of loss on sale of a business (7,553) - (7,553) NM Tax impact of foreign tax rate change (5,548) 924 (6,472) NM Net earnings adjusted for Certain Items (Non-GAAP) $ 173,452 $ 510,266 $ (336,814) -66.0% Diluted earnings per share (GAAP) $ 0.42 $ 0.87 $ (0.45) -51.7% Impact of restructuring and transformational project costs (1) 0.05 0.11 (0.06) -54.5% Impact of acquisition-related costs (2) 0.03 0.03 - NM Impact of bad debt reserve adjustments (3) (0.19) - (0.19) NM Impact of loss on sale of a business 0.02 - 0.02 NM Tax impact of restructuring and transformational project costs (4) (0.01) (0.03) 0.02 -66.7% Tax impact of acquisition-related costs (4) (0.01) (0.01) - NM Tax Impact of bad debt reserve adjustments (4) 0.04 - 0.04 NM Tax impact of loss on sale of a business (0.01) - (0.01) NM Tax impact of foreign tax rate change (0.01) - (0.01) NM Diluted earnings per share adjusted for Certain Items (Non-GAAP) (5) $ 0.34 $ 0.98 $ (0.64) -65.3% Diluted shares outstanding 510,738,760 518,761,456 NM represents that the percentage change is not meaningful. - more - (4) The tax impact of adjustments for Certain Items are calculated by multiplying the pretax impact of each Certain Item by the statutory rates in effect for each jurisdiction where the Certain Item was incurred. (5) Individual components of diluted earnings per share may not add up to the total presented due to rounding. Total diluted earnings per share is calculated using adjusted net earnings divided by diluted shares outstanding. (2) Fiscal 2021 and fiscal 2020 include $18 million and $17 million, respectively, related to intangible amortization expense from the Brakes Acquisition, which is included in the results of International Foodservice. (1) Fiscal 2021 includes $13 million related to various transformation initiative costs, primarily consisting of changes to our business technology strategy, and $13 million primarily consisting of restructuring charges. Fiscal 2020 includes $30 million related to restructuring, facility closure and severance charges and $27 million related to various transformation initiative costs, primarily consisting of changes to our business technology strategy. (3) Represents the reduction of bad debt charges previously taken on pre-pandemic trade receivable balances in fiscal 2020.
  • 20.
    Impact of CertainItems, 1Q21 (Segment) 20 Sysco Corporation and its Consolidated Subsidiaries Segment Results Non-GAAP Reconciliation (Unaudited) Impact of Certain Items on Applicable Segments (Dollars in Thousands) 13-Week Period Ended Sep. 26, 2020 13-Week Period Ended Sep. 28, 2019 Change in Dollars %/bps Change U.S. FOODSERVICE OPERATIONS Sales $ 7,921,533 $ 10,658,633 $ (2,737,100) -25.7% Gross Profit 1,599,707 2,144,886 (545,179) -25.4% Gross Margin 20.19% 20.12% 7 bps Operating expenses (GAAP) $ 1,011,298 $ 1,351,268 $ (339,970) -25.2% Impact of restructuring and transformational project costs (1) (940) (4,126) 3,186 -77.2% Impact of bad debt reserve adjustments (2) 86,317 - 86,317 NM Operating expenses adjusted for Certain Items (Non-GAAP) $ 1,096,675 $ 1,347,142 $ (250,467) -18.6% Operating income (GAAP) $ 588,409 $ 793,618 $ (205,209) -25.9% Impact of restructuring and transformational project costs (1) 940 4,126 (3,186) -77.2% Impact of bad debt reserve adjustments (2) (86,317) - (86,317) NM Operating income adjusted for Certain Items (Non-GAAP) $ 503,032 $ 797,744 $ (294,712) -36.9% INTERNATIONAL FOODSERVICE OPERATIONS Sales $ 2,163,693 $ 2,912,388 $ (748,695) -25.7% Gross Profit $ 450,398 $ 605,185 $ (154,787) -25.6% Gross Margin 20.82% 20.78% 4 bps Operating expenses (GAAP) $ 450,935 $ 550,385 $ (99,450) -18.1% Impact of restructuring and transformational project costs (3) (12,993) (27,272) 14,279 -52.4% Impact of acquisition-related costs (4) (17,755) (16,909) (846) 5.0% Impact of bad debt reserve adjustments (2) 11,429 - 11,429 NM Operating expenses adjusted for Certain Items (Non-GAAP) $ 431,616 $ 506,204 $ (74,588) -14.7% Impact of currency fluctuations (3) (12,329) - (12,329) 2.4% Comparable operating expenses adjusted for Certain Items using a constant currency basis (Non-GAAP) $ 419,287 $ 506,204 $ (86,917) -17.2% Operating (loss) income (GAAP) $ (537) $ 54,800 $ (55,337) -101.0% Impact of restructuring and transformational project costs (3) 12,993 27,272 (14,279) -52.4% Impact of acquisition-related costs (4) 17,755 16,909 846 5.0% Impact of bad debt reserve adjustments (2) (11,429) - (11,429) NM Operating income adjusted for Certain Items (Non-GAAP) * $ 18,782 $ 98,981 $ (80,199) -81.0% SYGMA Sales $ 1,524,148 $ 1,446,994 $ 77,154 5.3% Gross Profit 131,541 125,918 5,623 4.5% Gross Margin 8.63% 8.70% -7 bps Operating expenses (GAAP) $ 119,849 $ 118,348 $ 1,501 1.3% Impact of restructuring and transformational project costs (1) (13) (2,585) 2,572 -99.5% Operating expenses adjusted for Certain Items (Non-GAAP) $ 119,836 $ 115,763 $ 4,073 3.5% Operating income (GAAP) $ 11,692 $ 7,570 $ 4,122 54.5% Impact of restructuring and transformational project costs (1) 13 2,585 (2,572) -99.5% Operating income adjusted for Certain Items (Non-GAAP) $ 11,705 $ 10,155 $ 1,550 15.3%
  • 21.
    Impact of CertainItems, 1Q21 (Segment Continued) 21 OTHER Sales $ 168,005 $ 284,990 $ (116,985) -41.0% Gross Profit 40,430 71,744 (31,314) -43.6% Gross Margin 24.06% 25.17% -111 bps Operating expenses (GAAP) $ 40,435 $ 61,607 $ (21,172) -34.4% Impact of bad debt reserve adjustments (2) 883 - 883 NM Operating expenses adjusted for certain items (Non-GAAP) $ 41,318 $ 61,607 $ (20,289) -32.9% Operating (loss) income (GAAP) $ (5) $ 10,137 $ (10,142) -100.0% Impact of bad debt reserve adjustments (2) (883) - (883) NM Operating (loss) income adjusted for certain items (Non-GAAP) $ (888) $ 10,137 $ (11,025) -108.8% CORPORATE Gross Profit $ (2,231) $ (4,363) $ 2,132 -48.9% Operating expenses (GAAP) $ 177,749 $ 193,444 $ (15,695) -8.1% Impact of restructuring and transformational project costs (5) (12,018) (22,739) 10,721 -47.1% Operating expenses adjusted for Certain Items (Non-GAAP) $ 165,731 $ 170,705 $ (4,974) -2.9% Operating loss (GAAP) $ (179,980) $ (197,807) $ 17,827 -9.0% Impact of restructuring and transformational project costs (5) 12,018 22,739 (10,721) -47.1% Operating loss adjusted for Certain Items (Non-GAAP) $ (167,962) $ (175,068) $ 7,106 -4.1% TOTAL SYSCO Sales $ 11,777,379 $ 15,303,005 $ (3,525,626) -23.0% Gross Profit 2,219,845 2,943,370 (723,525) -24.6% Gross Margin 18.85% 19.23% -39 bps Operating expenses (GAAP) $ 1,800,266 $ 2,275,052 $ (474,786) -20.9% Impact of restructuring and transformational project costs (1) (3) (5) (25,964) (56,722) 30,758 -54.2% Impact of acquisition-related costs (4) (17,755) (16,909) (846) 5.0% Impact of bad debt reserve adjustments (2) 98,629 - 98,629 NM Operating expenses adjusted for Certain Items (Non-GAAP) $ 1,855,176 $ 2,201,421 $ (346,245) -15.7% Operating income (GAAP) $ 419,579 $ 668,318 $ (248,739) -37.2% Impact of restructuring and transformational project costs (1) (3) (5) 25,964 56,722 (30,758) -54.2% Impact of acquisition-related costs (4) 17,755 16,909 846 5.0% Impact of bad debt reserve adjustments (2) (98,629) - (98,629) NM Operating income adjusted for Certain Items (Non-GAAP) $ 364,669 $ 741,949 $ (377,280) -50.8% (1) Includes charges related to restructuring and business transformation projects. - more - (3) Includes restructuring, severance and facility closure costs primarily in Europe. (4) Fiscal 2021 and fiscal 2020 include $18 million and $17 million, respectively, related to intangible amortization expense from the Brakes Acquisition. NM represents that the percentage change is not meaningful. (5) Fiscal 2021 and fiscal 2020 include various transformation initiative costs, primarily consisting of changes to our business technology strategy. (2) Represents the reduction of bad debt charges previously taken on pre-pandemic trade receivable balances in fiscal 2020. * Foreign exchange rates did not have a meaningful impact during the period; therefore, the constant currency adjustment is not disclosed.
  • 22.
    Free Cash Flow 22 SyscoCorporation and its Consolidated Subsidiaries Free Cash Flow Net cash provided by operating activities (GAAP) $ 930,914 $ 171,579 $ 759,335 Additions to plant and equipment (75,539) (175,728) 100,189 Proceeds from sales of plant and equipment 7,064 4,902 2,162 Free Cash Flow (Non-GAAP) $ 862,439 $ 753 $ 861,686 Non-GAAP Reconciliation (Unaudited) (In Thousands) Free cash flow represents net cash provided from operating activities less purchases of plant and equipment and includes proceeds from sales of plant and equipment. Sysco considers free cash flow to be a liquidity measure that provides useful information to management and investors about the amount of cash generated by the business after the purchases and sales of buildings, fleet, equipment and technology, which may potentially be used to pay for, among other things, strategic uses of cash including dividend payments, share repurchases and acquisitions. However, free cash flow may not be available for discretionary expenditures, as it may be necessary that we use it to make mandatory debt service or other payments. Free cash flow should not be used as a substitute for the most comparable GAAP measure in assessing the company’s liquidity for the periods presented. An analysis of any non-GAAP financial measure should be used in conjunction with results presented in accordance with GAAP. In the table that follows, free cash flow for each period presented is reconciled to net cash provided by operating activities. 13-Week Period Ended Sep. 26, 2020 13-Week Period Ended Sep. 29, 2019 Change in Dollars