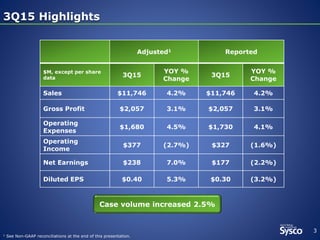
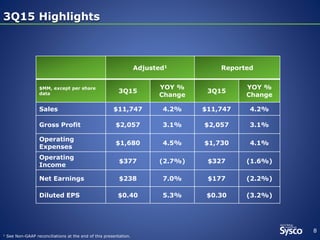
Sysco reported third quarter fiscal year 2015 earnings results. Key highlights included:
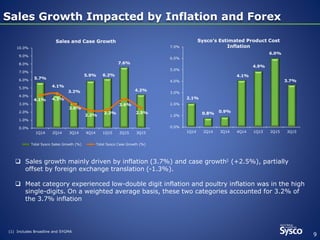
- Sales increased 4.2% to $11.7 billion due to case volume growth of 2.5% and inflation of 3.7% partially offset by foreign exchange impacts.
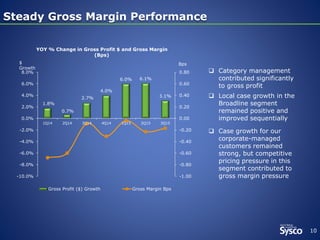
- Gross profit increased 3.1% to $2.1 billion and gross margin was steady.
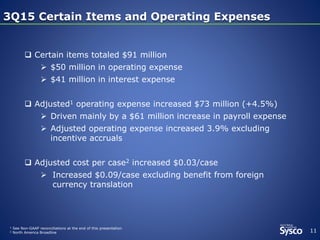
- Operating expenses grew 4.5% primarily due to increased payroll costs.
- Net earnings increased 7% to $238 million and EPS grew 5.3% to $0.40.