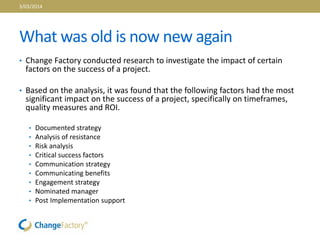
Change Project
Success Indicators
Survey Results
3/03/2014
Executive Summary
• Change Factory is investigating the factors that lead to change
management project success or failure. By participating in the
survey, respondents help validate theories about what works
and what doesn’t. Leadership, user engagement, training and
communication were some of the influencing factors
investigated.
• The key factors found to influence the success of a project
include:
• Documented strategy
• Communication
• Analysis of resistance and risk
• Engagement tactics
3/03/2014
About Change Factory
• Change Factory transforms businesses by changing people’s behaviour.
• Change Factory is a Melbourne-based consulting company that
specialises in change management and business transformation. We
work across Australia, Pacific Islands and South East Asian countries.
• Our services include:
• Building change capability
• Developing people
• Driving performance
• Creating strategy
3/03/2014
Purpose of Change Factory’s Survey
• Change Factory is investigating the factors that lead to the success or
failure of a project. This presentation is the first round of analysis from
around 76 organisations around the world.
• Currently, there exists many myths, self-help books and numerous
models to explain how to manage a successful change project, however,
change managers are still uncertain as to how specific factors lead to
the success of their specific project.
• This presentation demonstrates the correlation between a success of a
project and specific factors, such as communication, training and
documented strategy.
• This presentation is filled with numerous hyperlinks to provide the
reader with more research and best practice articles. To access these
links, please have this in full presentation mode.
3/03/2014
Some published results
1993 Hamer and
Champy
published their
estimate of 30%
success rate
2008 Kotter observation of
100 companies: 30%
success rate
2009 McKinsey
study: 68% success
rate
2013 Economist:
56% success rate
• The most well known statistic for
failed change projects is ‘70%’
• However, that figure had been
based on ‘observations and
estimates’ that do not produce
valid and reliable data.
• It was only in 2009 that McKinsey
produced more valid data,
showing that more than half of the
projects succeeded. These
statistics are very similar to those
found in Change Factory’s current
research
• The irrational side of change
management | McKinsey &
Company
3/03/2014
SURVEY CRITERIA
3/03/2014
Factors Investigated During the Survey
1. Organisation demographics
2. Strategy
3. Tactics and Planning
4. Integration to business as usual
5. Implementation
6. Measurement and Outcomes
3/03/2014
Types of Respondents
Questions Data
Number of organisations respondents >100 organisations filled in the survey.
Projects were based around the world,
including Australia, USA and South Sudan.
Completed projects 72%
Near completion 9%
Incomplete 12%
Year completed Most projects were completed in 2013
(48.7%)
Demographics
Length of Project Number of people affected
0.0%
5.0%
10.0%
15.0%
20.0%
25.0%
30.0%
35.0%
40.0%
45.0%
50.0%
0.0%
5.0%
10.0%
15.0%
20.0%
25.0%
30.0%
1-49
50-99
100-199
200-499
500-999
1000-1999
2000-4999
5000+
3/03/2014
Position During Project
0.0%
5.0%
10.0%
15.0%
20.0%
25.0%
30.0%
35.0%
40.0%
45.0%
Project manager Part of the project team Project sponsor Department head affected by
the project
Other
Position during Project
3/03/2014
THE RESULTS
3/03/2014
What is a successful project
• Change Factory is measuring three aspects required for the
success of a project:
1. Delivered in the allocated timeframe
2. Delivered in the agreed quality measures
3. Demonstrated a return on investment
• Although there are other factors that lead to the success of
the project, these factors have been investigated in the
question looking at internal success criteria. These criteria
are based on previous result conducted by Change Factory
3/03/2014
Was your Project a Success?
84%
68%
71%
66%
0%
10%
20%
30%
40%
50%
60%
70%
80%
90%
Successful Time frame Quality ROI
Success rate
• When asked ‘Was your project
considered a success?’, 84% of
respondents responded yes.
• However, when asked more detailed
questions around meeting
timeframes, quality measures and
ROI (what Change Factory believes
are the minimum success criteria of
a project), a significantly lower
number of respondents answered
positively.
• In this survey, Change Factory uses 3
factors as the key criteria of a project
succeeding – Timeframe, quality and
ROI
3/03/2014
Internal Criteria of Success
• A large number of respondents
measured their projects success
by an increase in revenue and
productivity.
• Engagement was considered to
be the third most important
internal criteria of success.
• Later in the presentation, it is
demonstrated the importance
of engagement in meeting the
three criteria of success
0.00%
5.00%
10.00%
15.00%
20.00%
25.00%
30.00%
35.00%
Increase of
revenue
Increase of
productivity
Engagement of
employees
Use of product Increase
organisational
engagement
Internal Criteria of Success
3/03/2014
Explanation of the Data Graphics
• The following bar charts in this presentation depict Change Factory’s 3 main
factors of a success of a project:
1. Timeframe
2. Quality measures
3. ROI
• The green bar depicts the success rate that had the title element (for example,
documented strategy)
• The red bar depicts the success rate of projects that did not have the title
element.
• Results, where a significant impact was found by including or not including a
title element within a project, are part of the survey results. For example, where
a documented strategy was included or not included. Based on Change Factory’s
experience, research and observation, comments have been included on
probable causes
3/03/2014
Explanation of the Data Graphics
66%
77% 76%
46%
70%
46%
0%
10%
20%
30%
40%
50%
60%
70%
80%
90%
Yes No Yes No Yes No
Time frame Quality measures ROI
Documented Strategy
The green bar depicts
overall successful
projects that had the
title element (for
example, documented
strategy). In this case,
those projects that
were deemed a success
and had a documented
strategy were more
likely to be successful
than those who did not
have a documented
strategy.
The red bar depicts
the success of
projects that did
not have the
documented
strategy. This
clearly shows that
if there was no
documented
strategy, the
success rate for
reaching the
quality measures
dropped
significantly.
3/03/2014
RESULTS: STRATEGY
3/03/2014
Documented Strategy
66%
77% 76%
46%
70%
46%
0%
10%
20%
30%
40%
50%
60%
70%
80%
90%
Yes No Yes No Yes No
Time frame Quality measures ROI
Documented Strategy • If a project had a documented
strategy, it was more likely to not
meet the project timeframe. In
Change Factory’s experience this
could be due to a documented
strategy taking longer to develop
and the leadership team
implementing longer decision
making processes
• By having a documented strategy,
there is a significant positive
impact in projects reaching their
quality measures and achieving
ROI
• Implementing Strategy -
Change Factory
3/03/2014
Analysis of resistance
65%
72%
75%
56%
72%
44%
0%
10%
20%
30%
40%
50%
60%
70%
80%
Yes No Yes No Yes No
Time frame Quality measures ROI
Analysis of resistance
• Conducting an analysis of
resistance does not have a
positive impact on timeframe,
it did have a significantly
positive impact on the quality
measures and ROI being
reached.
• From our observations,
measuring resistance of the
employees undergoing change
allows the leaders to ensure
there are solutions in place to
get employees engaged in the
change process.
• Investigating Resistance -
Change Factory
3/03/2014
Risk Analysis
69% 68%
84%
44%
73%
52%
0%
10%
20%
30%
40%
50%
60%
70%
80%
90%
Yes No Yes No Yes No
Time frame Quality measures ROI
Risk analysis
• Conducting a risk analysis at the
beginning of a project allowed for
more projects to reach their
quality measures and ROI.
• In our experience, conducting risk
analysis allows project managers
to prepare for the possible risks
that could derail a project.
• Managing Risk – Change Factory
3/03/2014
Critical Success Factors
71%
52%
74%
57%
71%
43%
0%
10%
20%
30%
40%
50%
60%
70%
80%
Yes No Yes No Yes No
Time frame Quality measures ROI
Critical success factors
• A project team that measures
critical success factors are
more likely to achieve the
three main success factors
than those projects that do not
measure critical success
factors.
• By consistently measuring the
success factors, the project can
be assessed as to whether it is
meeting the factors required to
label it a success.
3/03/2014
RESULTS: TACTICS AND
PLANNING
3/03/2014
Communication Strategy
66%
74%
77%
57%
74%
48%
0%
10%
20%
30%
40%
50%
60%
70%
80%
90%
Yes No Yes No Yes No
Time frame Quality measures ROI
Formal communications strategy
• Implementing a communication
strategy in a project may push the
project time frame out, however,
by having formal communication
documentation, there is a
significant positive impact on the
meeting quality measures and ROI
• Implementing an effective
communication strategy
encourages engagement during
the change process
• Communication choices during
Evolutionary Change –
Change Factory
3/03/2014
Communicating the Benefits
79%
46%
83%
46%
79%
38%
0%
10%
20%
30%
40%
50%
60%
70%
80%
90%
Yes No Yes No Yes No
Time frame Quality measures ROI
Calculated benefits • Clearly communicating the
benefits of the change to
employees positively impacts on
the success of the project in all
three factor.
• In our experience and from our
previous research, this clearly
follows the principle of ‘what’s
in it for me?’ and its benefit of
communicating. By clearly
communicating the benefits,
employees are more engaged
and more likely to work towards
the success of the project
• Driving EDRMS Adoption |
Change Factory
3/03/2014
RESULTS: INTEGRATION TO
BUSINESS AS USUAL
3/03/2014
Change Factory’s Engagement Model
Level Description
1 Understanding the change and the details of the program (the WHAT)
2 Believing in the change (the WHY) and believing it will benefit them
3 Prioritising and caring about the change (the WHEN)
4 Planning to make the change (the HOW, WHO and WHERE)
5 Implementing the change (the DO)
Click here for more information from our website
Employee Engagement – Change Factory
3/03/2014
Engagement: Understand the purpose of
the change
69%
60%
73%
40%
68%
40%
0%
10%
20%
30%
40%
50%
60%
70%
80%
Yes No Yes No Yes No
Time frame Quality measures ROI
Understand the purpose of the
change • When employees are clear about
the purpose of the change, the
success of a project increases
significantly
• What the purpose of the change is
will vary in levels of importance to
employees. Most employees
respond more to one of the
following when the purpose is
reflected in:
• The individual
• Colleagues
• Organisation
• Society
• Environment
3/03/2014
Engagement: Care about Change
69% 68%
80%
46%
64%
55%
0%
10%
20%
30%
40%
50%
60%
70%
80%
90%
Yes No Yes No Yes No
Time frame Quality measures ROI
Managers care about the change
• Surprisingly, managers caring
about the change do not have a
significant impact on keeping
within a timeframe or going
above it
• However, it does not have a large
impact on whether quality
measures were met within a
project and slightly less of an
impact of whether the ROI was
met.
• In our experience, managers
caring about a project are more
likely to make them prioritise
meeting the quality measures.
3/03/2014
Engagement: Prioritise changes
70%
65%
83%
35%
73%
40%
0%
10%
20%
30%
40%
50%
60%
70%
80%
90%
Yes No Yes No Yes No
Time frame Quality measures ROI
Prioritise the change in day-to-day
jobs
• Another surprising result was
that for those who prioritised the
change versus those who didn’t
prioritise, didn’t have a
significant improvement in
reaching the timeframe
• Possible reasons could be that
prioritising changes concentrated
more on meeting the quality
measures, thus having an impact
on the ROI
3/03/2014
Engagement: Plan the change
68%
65%
84%
32%
74%
42%
0%
10%
20%
30%
40%
50%
60%
70%
80%
90%
Yes No Yes No Yes No
Time frame Quality measures ROI
Plan the change
• The most significant difference in
meeting the quality outcomes,
was impacted by whether
employees plan the change in
their everyday work
• Employees who plan the change
in their everyday work were
more likely to achieve the
success factors of the project
from our observation. This high
level of engagement in the
change project significantly
impacted the projects success
3/03/2014
Nominated manager for business unit
70%
55%
80%
45%
77%
35%
0%
10%
20%
30%
40%
50%
60%
70%
80%
90%
Yes No Yes No Yes No
Time frame Quality measures ROI
Nominated manager for each
business unit
• Engaging a nominated manager
to look after implementing the
change in separate business
units significantly leads to the
success of a project
• From our observations, by
having a nominated manager in
business units affected by
change, they were more likely
to have a type of ‘change
champion’ to advocate the
change.
3/03/2014
IMPLEMENTATION
3/03/2014
Post implementation support
68% 69%
78%
44%
70%
50%
0%
10%
20%
30%
40%
50%
60%
70%
80%
90%
Yes No Yes No Yes No
Time frame Quality measures ROI
Post change implementation
support
• Unsurprisingly, providing post
implementation support had a
positive impact on the quality
measures and ROI of the project.
However, a number of
organisations did not provide
post implementation support.
• Post implementation support
could include the continuation
of change champions, post-
implementation training and
opportunities to speak to
‘change experts’
3/03/2014
FINAL NOTES
3/03/2014
What was old is now new again
• Change Factory conducted research to investigate the impact of certain
factors on the success of a project.
• Based on the analysis, it was found that the following factors had the most
significant impact on the success of a project, specifically on timeframes,
quality measures and ROI.
• Documented strategy
• Analysis of resistance
• Risk analysis
• Critical success factors
• Communication strategy
• Communicating benefits
• Engagement strategy
• Nominated manager
• Post Implementation support
3/03/2014
Questions
• Please contact Change
Factory’s research team, if
you have any questions
about:
1. How we analysed the research
2. Any findings specific to your
future projects
3. Change Factory’s change
management services
4. Booking your 30 minute
consultation
5. Ideas for future research
Rohita Atri
rohita.atri@changefactory.com.au
+613 9614 8177
www.changefactory.com.au
3/03/2014

Wave 1 Results - Change Management Survey

  • 1.
  • 2.
    Executive Summary • ChangeFactory is investigating the factors that lead to change management project success or failure. By participating in the survey, respondents help validate theories about what works and what doesn’t. Leadership, user engagement, training and communication were some of the influencing factors investigated. • The key factors found to influence the success of a project include: • Documented strategy • Communication • Analysis of resistance and risk • Engagement tactics 3/03/2014
  • 3.
    About Change Factory •Change Factory transforms businesses by changing people’s behaviour. • Change Factory is a Melbourne-based consulting company that specialises in change management and business transformation. We work across Australia, Pacific Islands and South East Asian countries. • Our services include: • Building change capability • Developing people • Driving performance • Creating strategy 3/03/2014
  • 4.
    Purpose of ChangeFactory’s Survey • Change Factory is investigating the factors that lead to the success or failure of a project. This presentation is the first round of analysis from around 76 organisations around the world. • Currently, there exists many myths, self-help books and numerous models to explain how to manage a successful change project, however, change managers are still uncertain as to how specific factors lead to the success of their specific project. • This presentation demonstrates the correlation between a success of a project and specific factors, such as communication, training and documented strategy. • This presentation is filled with numerous hyperlinks to provide the reader with more research and best practice articles. To access these links, please have this in full presentation mode. 3/03/2014
  • 5.
    Some published results 1993Hamer and Champy published their estimate of 30% success rate 2008 Kotter observation of 100 companies: 30% success rate 2009 McKinsey study: 68% success rate 2013 Economist: 56% success rate • The most well known statistic for failed change projects is ‘70%’ • However, that figure had been based on ‘observations and estimates’ that do not produce valid and reliable data. • It was only in 2009 that McKinsey produced more valid data, showing that more than half of the projects succeeded. These statistics are very similar to those found in Change Factory’s current research • The irrational side of change management | McKinsey & Company 3/03/2014
  • 6.
  • 7.
    Factors Investigated Duringthe Survey 1. Organisation demographics 2. Strategy 3. Tactics and Planning 4. Integration to business as usual 5. Implementation 6. Measurement and Outcomes 3/03/2014
  • 8.
    Types of Respondents QuestionsData Number of organisations respondents >100 organisations filled in the survey. Projects were based around the world, including Australia, USA and South Sudan. Completed projects 72% Near completion 9% Incomplete 12% Year completed Most projects were completed in 2013 (48.7%)
  • 9.
    Demographics Length of ProjectNumber of people affected 0.0% 5.0% 10.0% 15.0% 20.0% 25.0% 30.0% 35.0% 40.0% 45.0% 50.0% 0.0% 5.0% 10.0% 15.0% 20.0% 25.0% 30.0% 1-49 50-99 100-199 200-499 500-999 1000-1999 2000-4999 5000+ 3/03/2014
  • 10.
    Position During Project 0.0% 5.0% 10.0% 15.0% 20.0% 25.0% 30.0% 35.0% 40.0% 45.0% Projectmanager Part of the project team Project sponsor Department head affected by the project Other Position during Project 3/03/2014
  • 11.
  • 12.
    What is asuccessful project • Change Factory is measuring three aspects required for the success of a project: 1. Delivered in the allocated timeframe 2. Delivered in the agreed quality measures 3. Demonstrated a return on investment • Although there are other factors that lead to the success of the project, these factors have been investigated in the question looking at internal success criteria. These criteria are based on previous result conducted by Change Factory 3/03/2014
  • 13.
    Was your Projecta Success? 84% 68% 71% 66% 0% 10% 20% 30% 40% 50% 60% 70% 80% 90% Successful Time frame Quality ROI Success rate • When asked ‘Was your project considered a success?’, 84% of respondents responded yes. • However, when asked more detailed questions around meeting timeframes, quality measures and ROI (what Change Factory believes are the minimum success criteria of a project), a significantly lower number of respondents answered positively. • In this survey, Change Factory uses 3 factors as the key criteria of a project succeeding – Timeframe, quality and ROI 3/03/2014
  • 14.
    Internal Criteria ofSuccess • A large number of respondents measured their projects success by an increase in revenue and productivity. • Engagement was considered to be the third most important internal criteria of success. • Later in the presentation, it is demonstrated the importance of engagement in meeting the three criteria of success 0.00% 5.00% 10.00% 15.00% 20.00% 25.00% 30.00% 35.00% Increase of revenue Increase of productivity Engagement of employees Use of product Increase organisational engagement Internal Criteria of Success 3/03/2014
  • 15.
    Explanation of theData Graphics • The following bar charts in this presentation depict Change Factory’s 3 main factors of a success of a project: 1. Timeframe 2. Quality measures 3. ROI • The green bar depicts the success rate that had the title element (for example, documented strategy) • The red bar depicts the success rate of projects that did not have the title element. • Results, where a significant impact was found by including or not including a title element within a project, are part of the survey results. For example, where a documented strategy was included or not included. Based on Change Factory’s experience, research and observation, comments have been included on probable causes 3/03/2014
  • 16.
    Explanation of theData Graphics 66% 77% 76% 46% 70% 46% 0% 10% 20% 30% 40% 50% 60% 70% 80% 90% Yes No Yes No Yes No Time frame Quality measures ROI Documented Strategy The green bar depicts overall successful projects that had the title element (for example, documented strategy). In this case, those projects that were deemed a success and had a documented strategy were more likely to be successful than those who did not have a documented strategy. The red bar depicts the success of projects that did not have the documented strategy. This clearly shows that if there was no documented strategy, the success rate for reaching the quality measures dropped significantly. 3/03/2014
  • 17.
  • 18.
    Documented Strategy 66% 77% 76% 46% 70% 46% 0% 10% 20% 30% 40% 50% 60% 70% 80% 90% YesNo Yes No Yes No Time frame Quality measures ROI Documented Strategy • If a project had a documented strategy, it was more likely to not meet the project timeframe. In Change Factory’s experience this could be due to a documented strategy taking longer to develop and the leadership team implementing longer decision making processes • By having a documented strategy, there is a significant positive impact in projects reaching their quality measures and achieving ROI • Implementing Strategy - Change Factory 3/03/2014
  • 19.
    Analysis of resistance 65% 72% 75% 56% 72% 44% 0% 10% 20% 30% 40% 50% 60% 70% 80% YesNo Yes No Yes No Time frame Quality measures ROI Analysis of resistance • Conducting an analysis of resistance does not have a positive impact on timeframe, it did have a significantly positive impact on the quality measures and ROI being reached. • From our observations, measuring resistance of the employees undergoing change allows the leaders to ensure there are solutions in place to get employees engaged in the change process. • Investigating Resistance - Change Factory 3/03/2014
  • 20.
    Risk Analysis 69% 68% 84% 44% 73% 52% 0% 10% 20% 30% 40% 50% 60% 70% 80% 90% YesNo Yes No Yes No Time frame Quality measures ROI Risk analysis • Conducting a risk analysis at the beginning of a project allowed for more projects to reach their quality measures and ROI. • In our experience, conducting risk analysis allows project managers to prepare for the possible risks that could derail a project. • Managing Risk – Change Factory 3/03/2014
  • 21.
    Critical Success Factors 71% 52% 74% 57% 71% 43% 0% 10% 20% 30% 40% 50% 60% 70% 80% YesNo Yes No Yes No Time frame Quality measures ROI Critical success factors • A project team that measures critical success factors are more likely to achieve the three main success factors than those projects that do not measure critical success factors. • By consistently measuring the success factors, the project can be assessed as to whether it is meeting the factors required to label it a success. 3/03/2014
  • 22.
  • 23.
    Communication Strategy 66% 74% 77% 57% 74% 48% 0% 10% 20% 30% 40% 50% 60% 70% 80% 90% Yes NoYes No Yes No Time frame Quality measures ROI Formal communications strategy • Implementing a communication strategy in a project may push the project time frame out, however, by having formal communication documentation, there is a significant positive impact on the meeting quality measures and ROI • Implementing an effective communication strategy encourages engagement during the change process • Communication choices during Evolutionary Change – Change Factory 3/03/2014
  • 24.
    Communicating the Benefits 79% 46% 83% 46% 79% 38% 0% 10% 20% 30% 40% 50% 60% 70% 80% 90% YesNo Yes No Yes No Time frame Quality measures ROI Calculated benefits • Clearly communicating the benefits of the change to employees positively impacts on the success of the project in all three factor. • In our experience and from our previous research, this clearly follows the principle of ‘what’s in it for me?’ and its benefit of communicating. By clearly communicating the benefits, employees are more engaged and more likely to work towards the success of the project • Driving EDRMS Adoption | Change Factory 3/03/2014
  • 25.
  • 26.
    Change Factory’s EngagementModel Level Description 1 Understanding the change and the details of the program (the WHAT) 2 Believing in the change (the WHY) and believing it will benefit them 3 Prioritising and caring about the change (the WHEN) 4 Planning to make the change (the HOW, WHO and WHERE) 5 Implementing the change (the DO) Click here for more information from our website Employee Engagement – Change Factory 3/03/2014
  • 27.
    Engagement: Understand thepurpose of the change 69% 60% 73% 40% 68% 40% 0% 10% 20% 30% 40% 50% 60% 70% 80% Yes No Yes No Yes No Time frame Quality measures ROI Understand the purpose of the change • When employees are clear about the purpose of the change, the success of a project increases significantly • What the purpose of the change is will vary in levels of importance to employees. Most employees respond more to one of the following when the purpose is reflected in: • The individual • Colleagues • Organisation • Society • Environment 3/03/2014
  • 28.
    Engagement: Care aboutChange 69% 68% 80% 46% 64% 55% 0% 10% 20% 30% 40% 50% 60% 70% 80% 90% Yes No Yes No Yes No Time frame Quality measures ROI Managers care about the change • Surprisingly, managers caring about the change do not have a significant impact on keeping within a timeframe or going above it • However, it does not have a large impact on whether quality measures were met within a project and slightly less of an impact of whether the ROI was met. • In our experience, managers caring about a project are more likely to make them prioritise meeting the quality measures. 3/03/2014
  • 29.
    Engagement: Prioritise changes 70% 65% 83% 35% 73% 40% 0% 10% 20% 30% 40% 50% 60% 70% 80% 90% YesNo Yes No Yes No Time frame Quality measures ROI Prioritise the change in day-to-day jobs • Another surprising result was that for those who prioritised the change versus those who didn’t prioritise, didn’t have a significant improvement in reaching the timeframe • Possible reasons could be that prioritising changes concentrated more on meeting the quality measures, thus having an impact on the ROI 3/03/2014
  • 30.
    Engagement: Plan thechange 68% 65% 84% 32% 74% 42% 0% 10% 20% 30% 40% 50% 60% 70% 80% 90% Yes No Yes No Yes No Time frame Quality measures ROI Plan the change • The most significant difference in meeting the quality outcomes, was impacted by whether employees plan the change in their everyday work • Employees who plan the change in their everyday work were more likely to achieve the success factors of the project from our observation. This high level of engagement in the change project significantly impacted the projects success 3/03/2014
  • 31.
    Nominated manager forbusiness unit 70% 55% 80% 45% 77% 35% 0% 10% 20% 30% 40% 50% 60% 70% 80% 90% Yes No Yes No Yes No Time frame Quality measures ROI Nominated manager for each business unit • Engaging a nominated manager to look after implementing the change in separate business units significantly leads to the success of a project • From our observations, by having a nominated manager in business units affected by change, they were more likely to have a type of ‘change champion’ to advocate the change. 3/03/2014
  • 32.
  • 33.
    Post implementation support 68%69% 78% 44% 70% 50% 0% 10% 20% 30% 40% 50% 60% 70% 80% 90% Yes No Yes No Yes No Time frame Quality measures ROI Post change implementation support • Unsurprisingly, providing post implementation support had a positive impact on the quality measures and ROI of the project. However, a number of organisations did not provide post implementation support. • Post implementation support could include the continuation of change champions, post- implementation training and opportunities to speak to ‘change experts’ 3/03/2014
  • 34.
  • 35.
    What was oldis now new again • Change Factory conducted research to investigate the impact of certain factors on the success of a project. • Based on the analysis, it was found that the following factors had the most significant impact on the success of a project, specifically on timeframes, quality measures and ROI. • Documented strategy • Analysis of resistance • Risk analysis • Critical success factors • Communication strategy • Communicating benefits • Engagement strategy • Nominated manager • Post Implementation support 3/03/2014
  • 36.
    Questions • Please contactChange Factory’s research team, if you have any questions about: 1. How we analysed the research 2. Any findings specific to your future projects 3. Change Factory’s change management services 4. Booking your 30 minute consultation 5. Ideas for future research Rohita Atri rohita.atri@changefactory.com.au +613 9614 8177 www.changefactory.com.au 3/03/2014