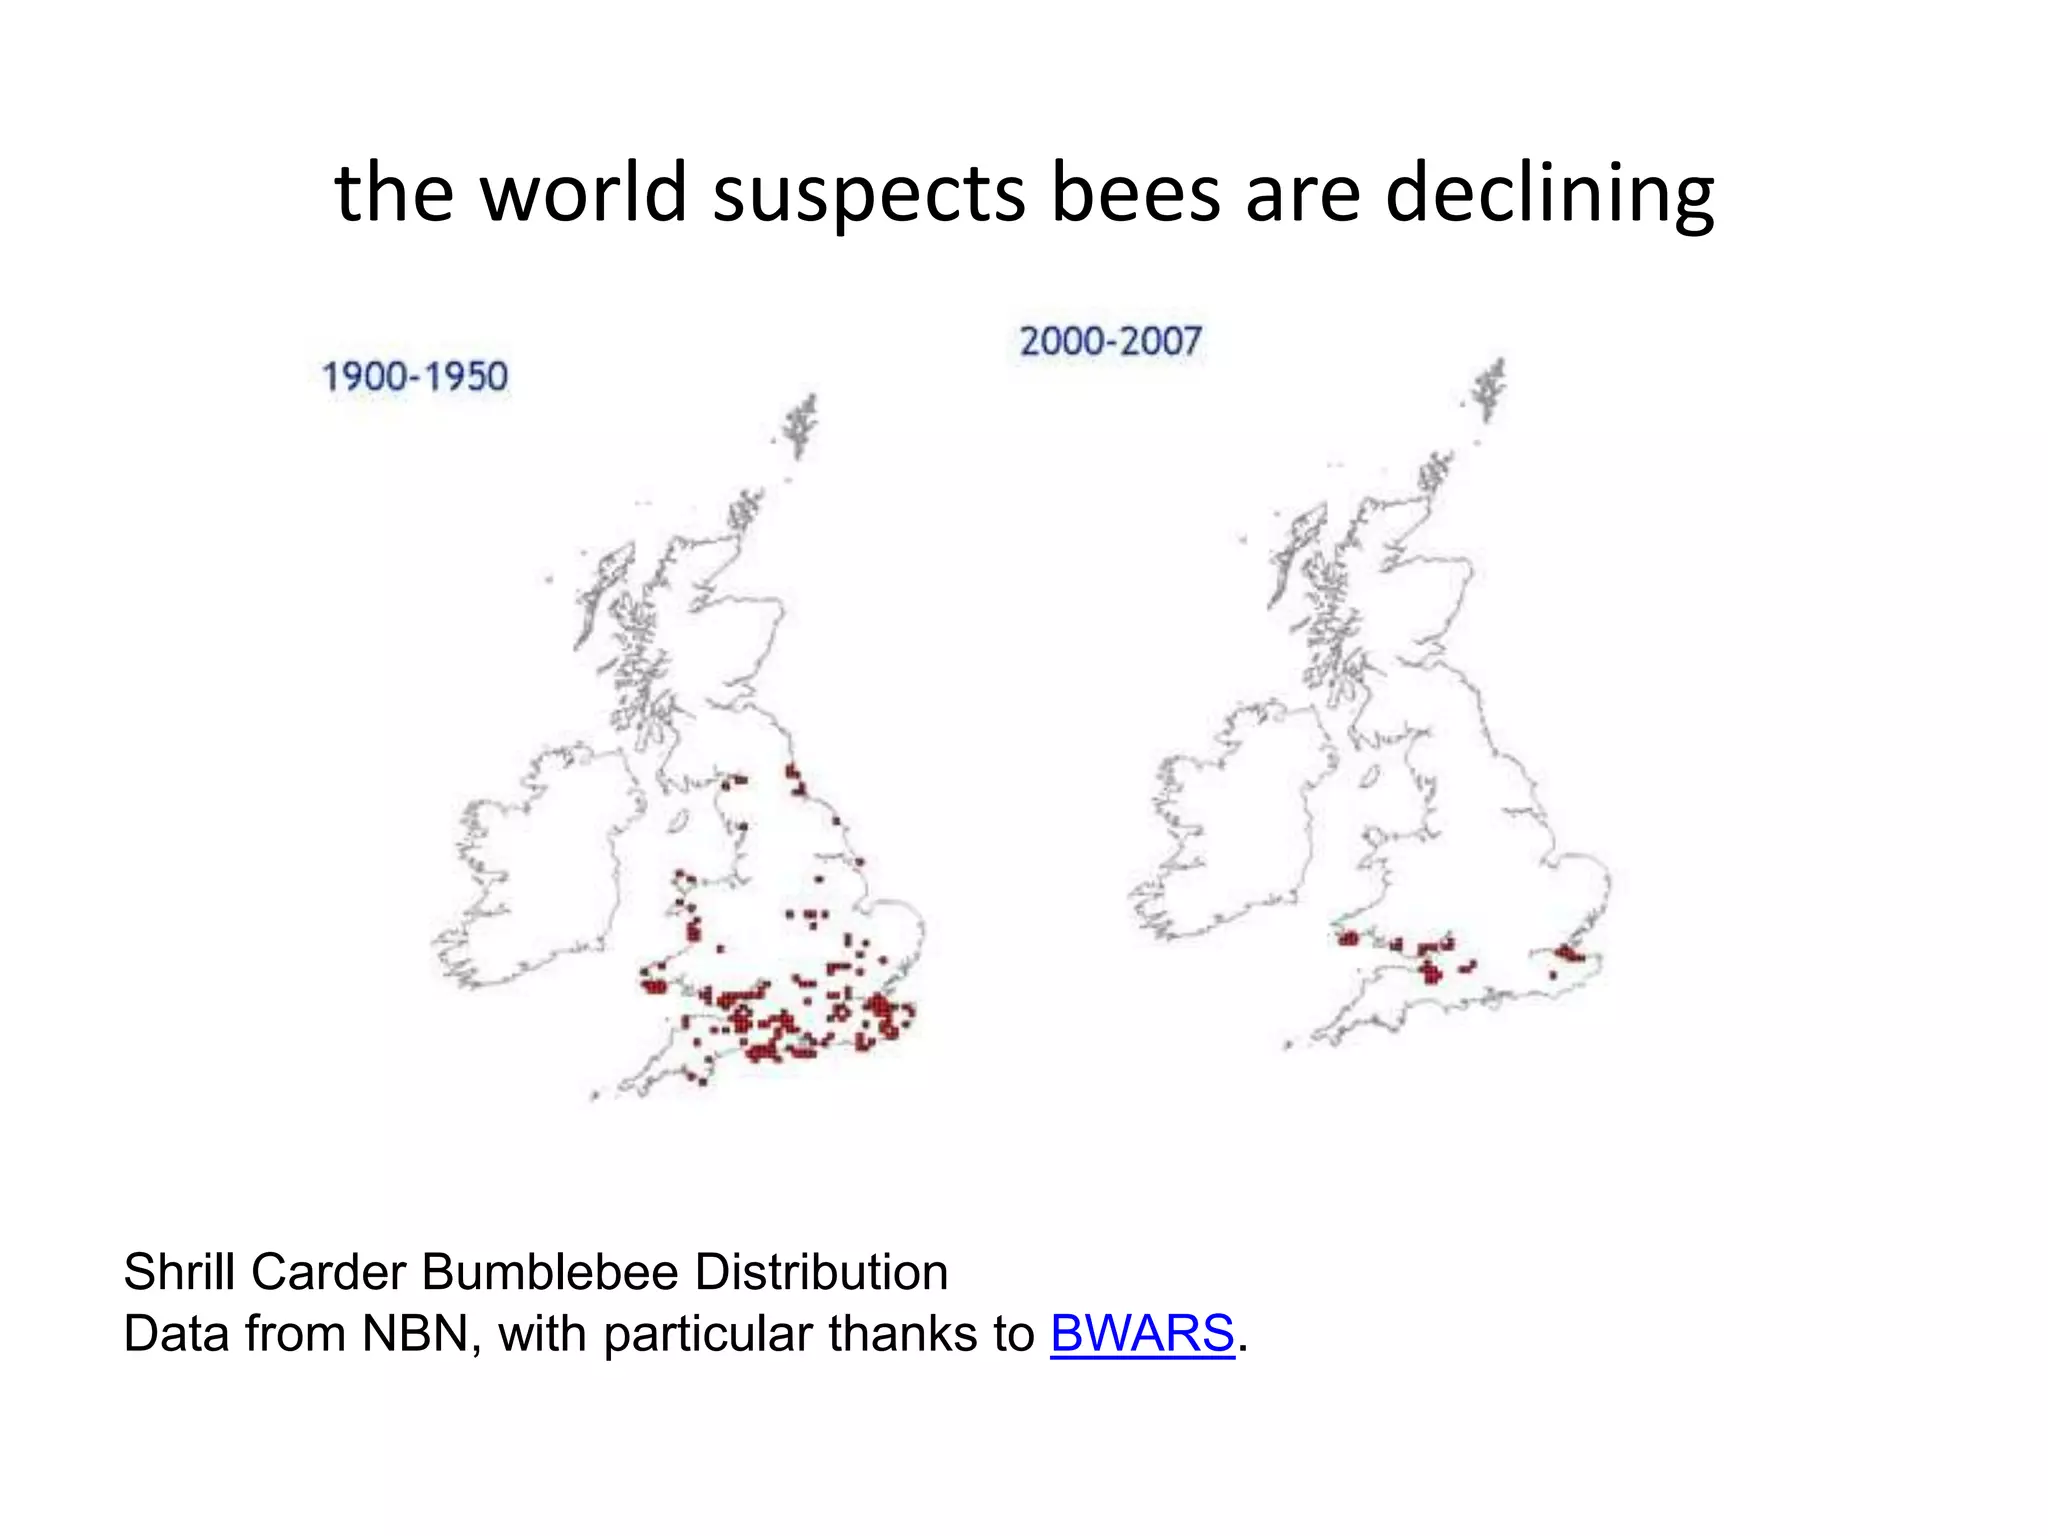
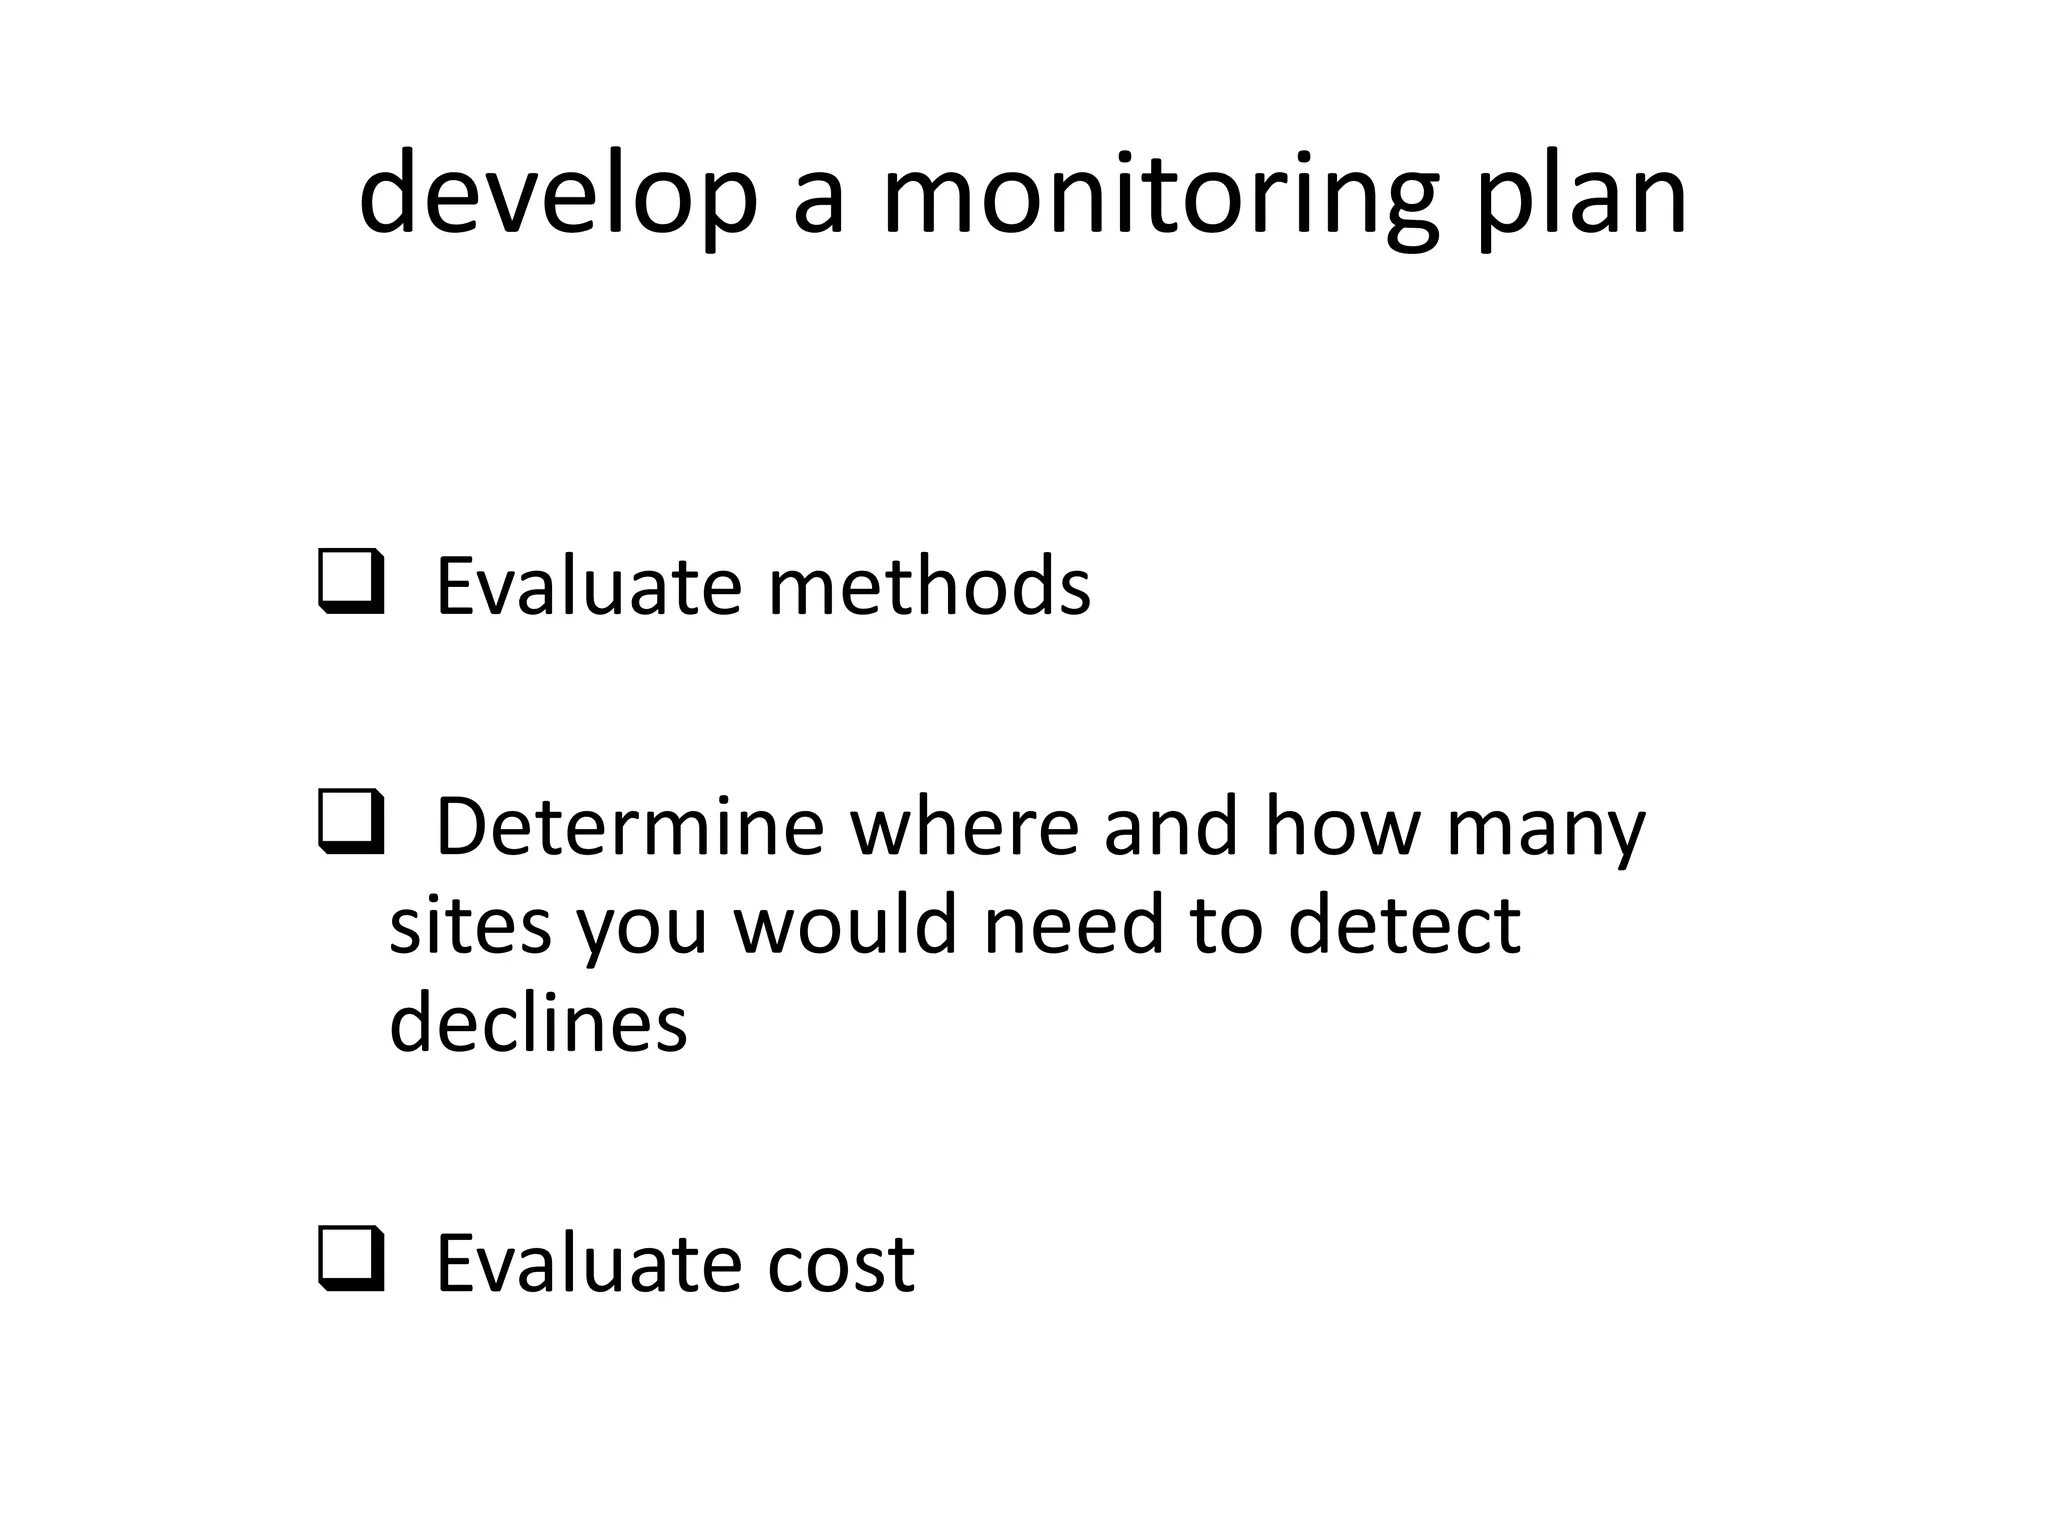
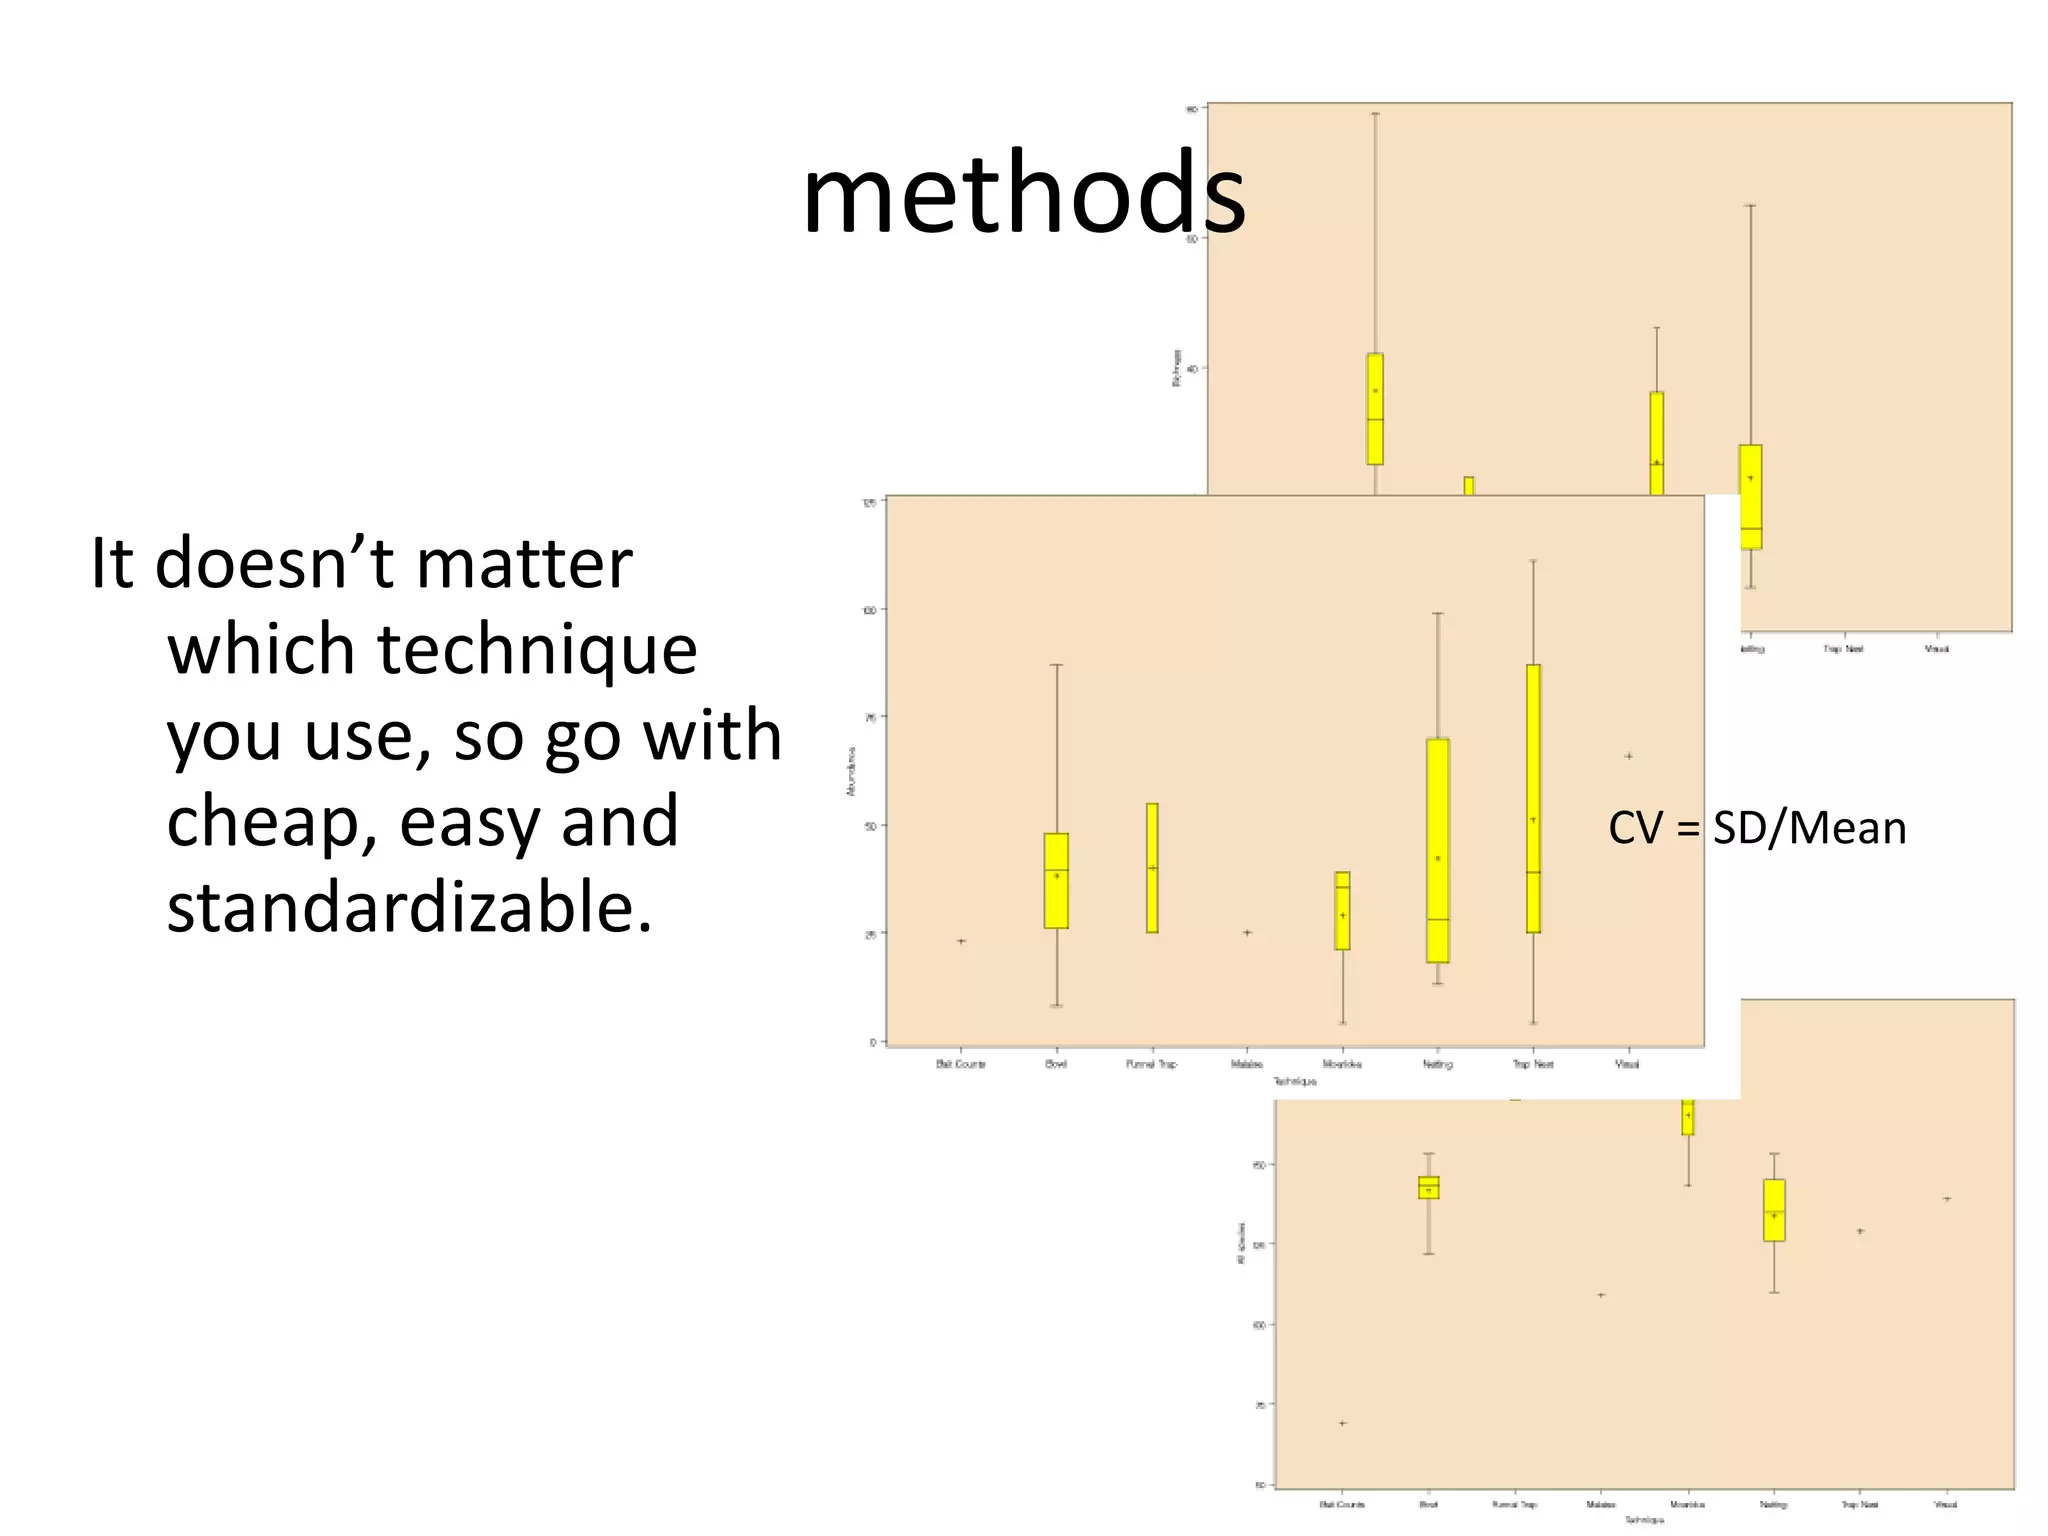
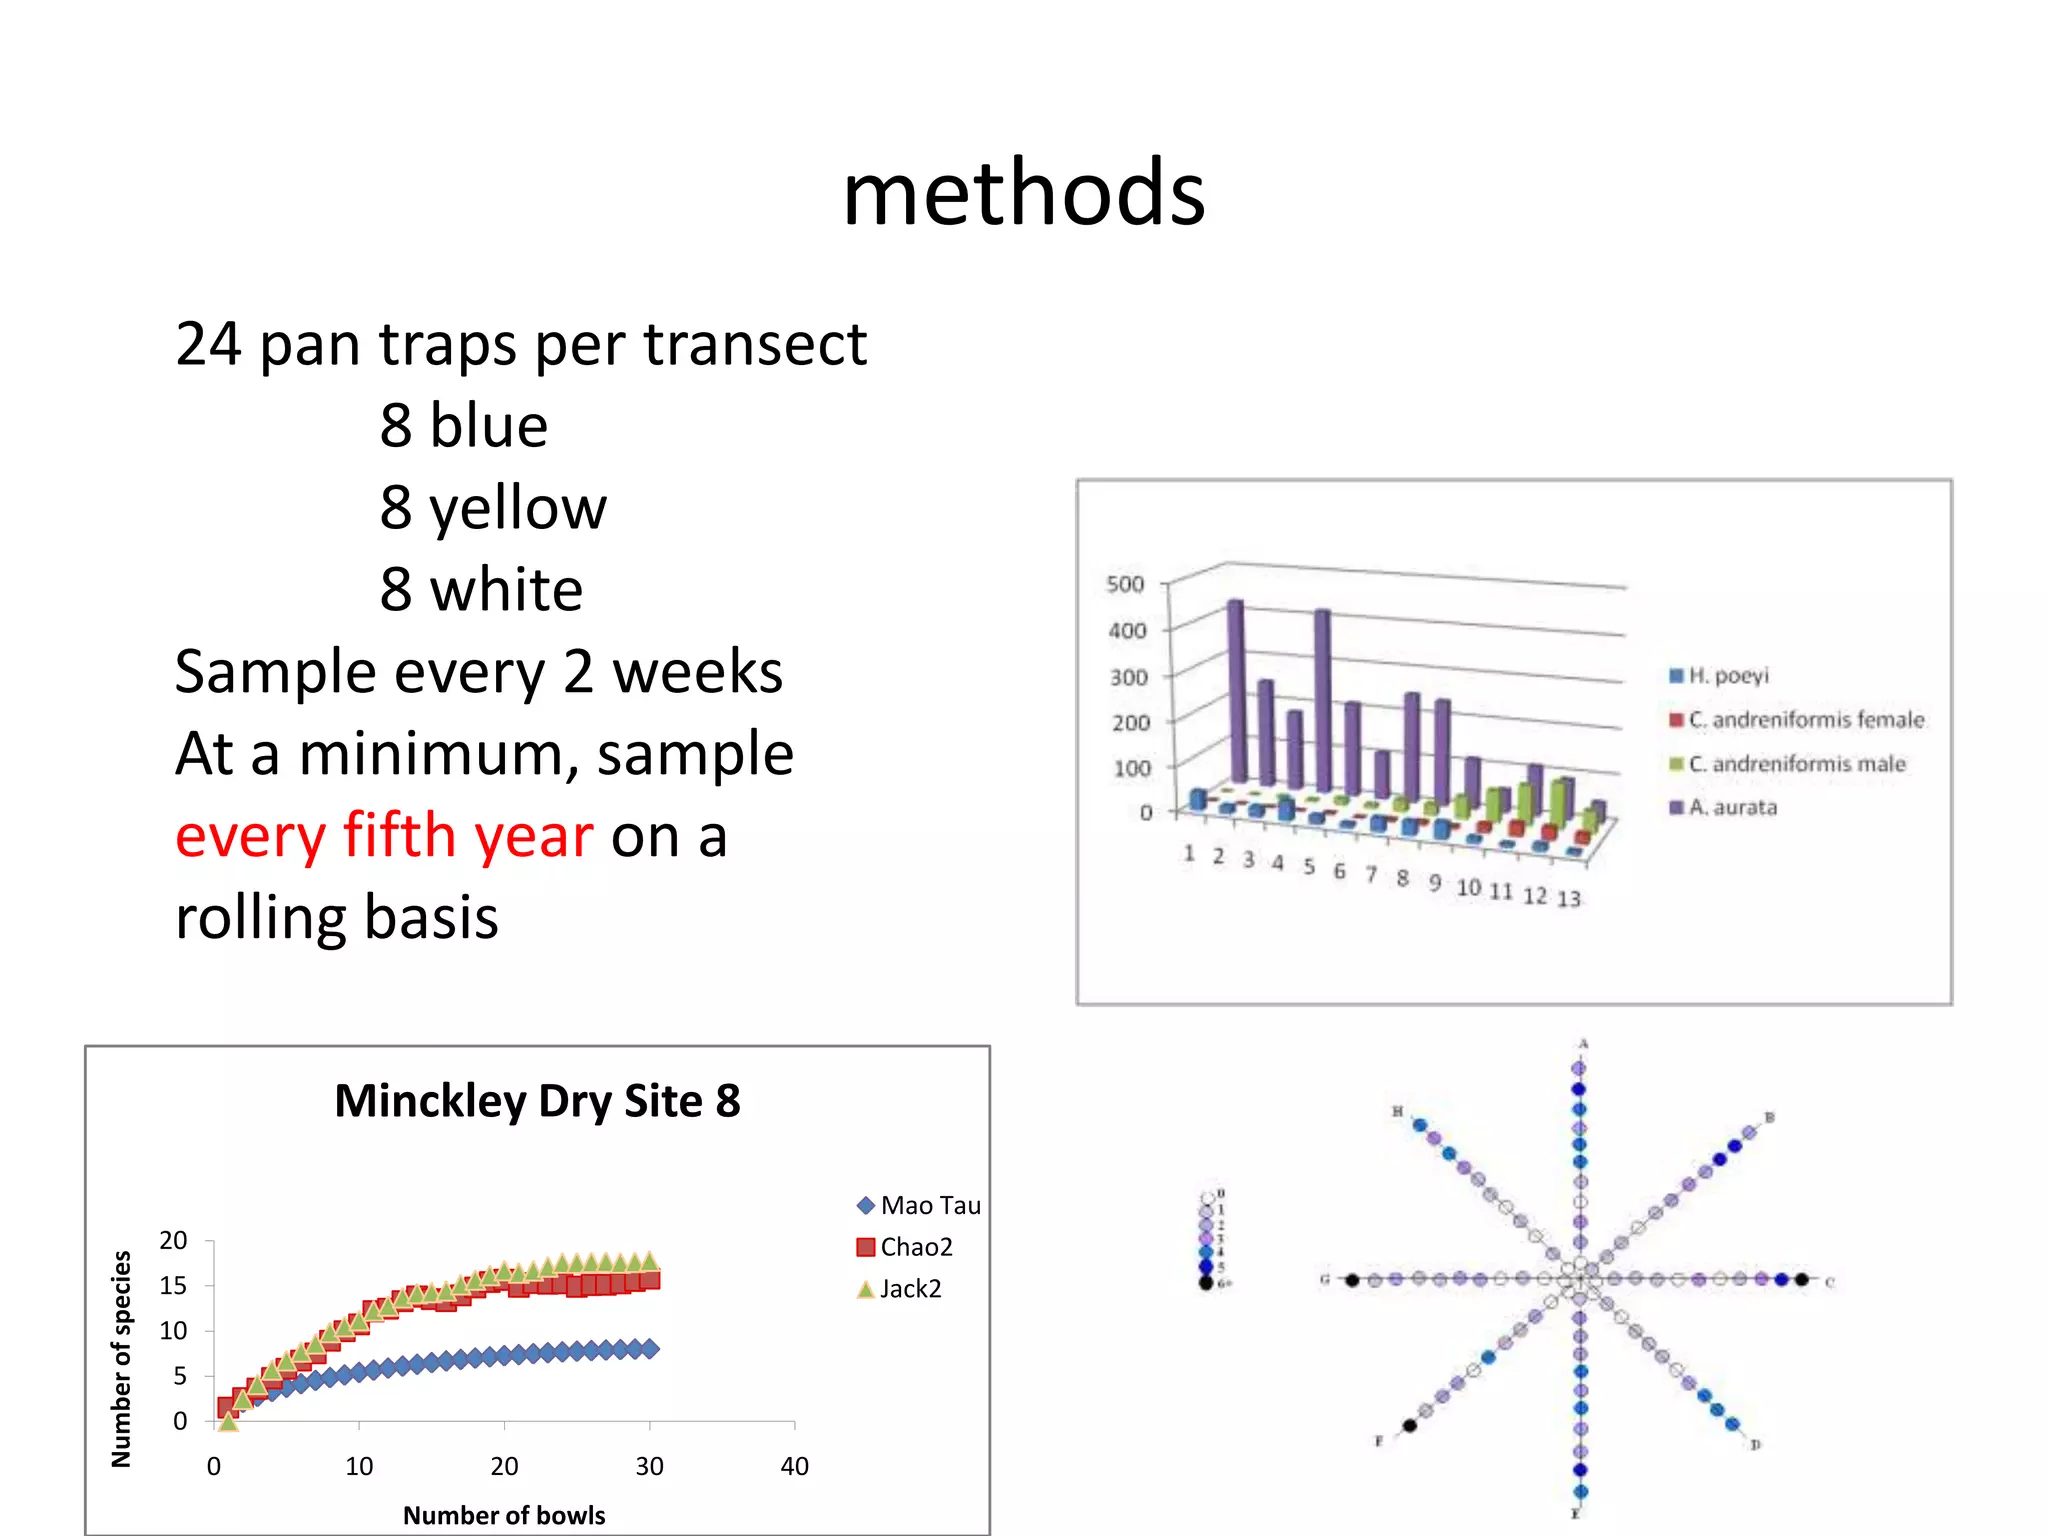
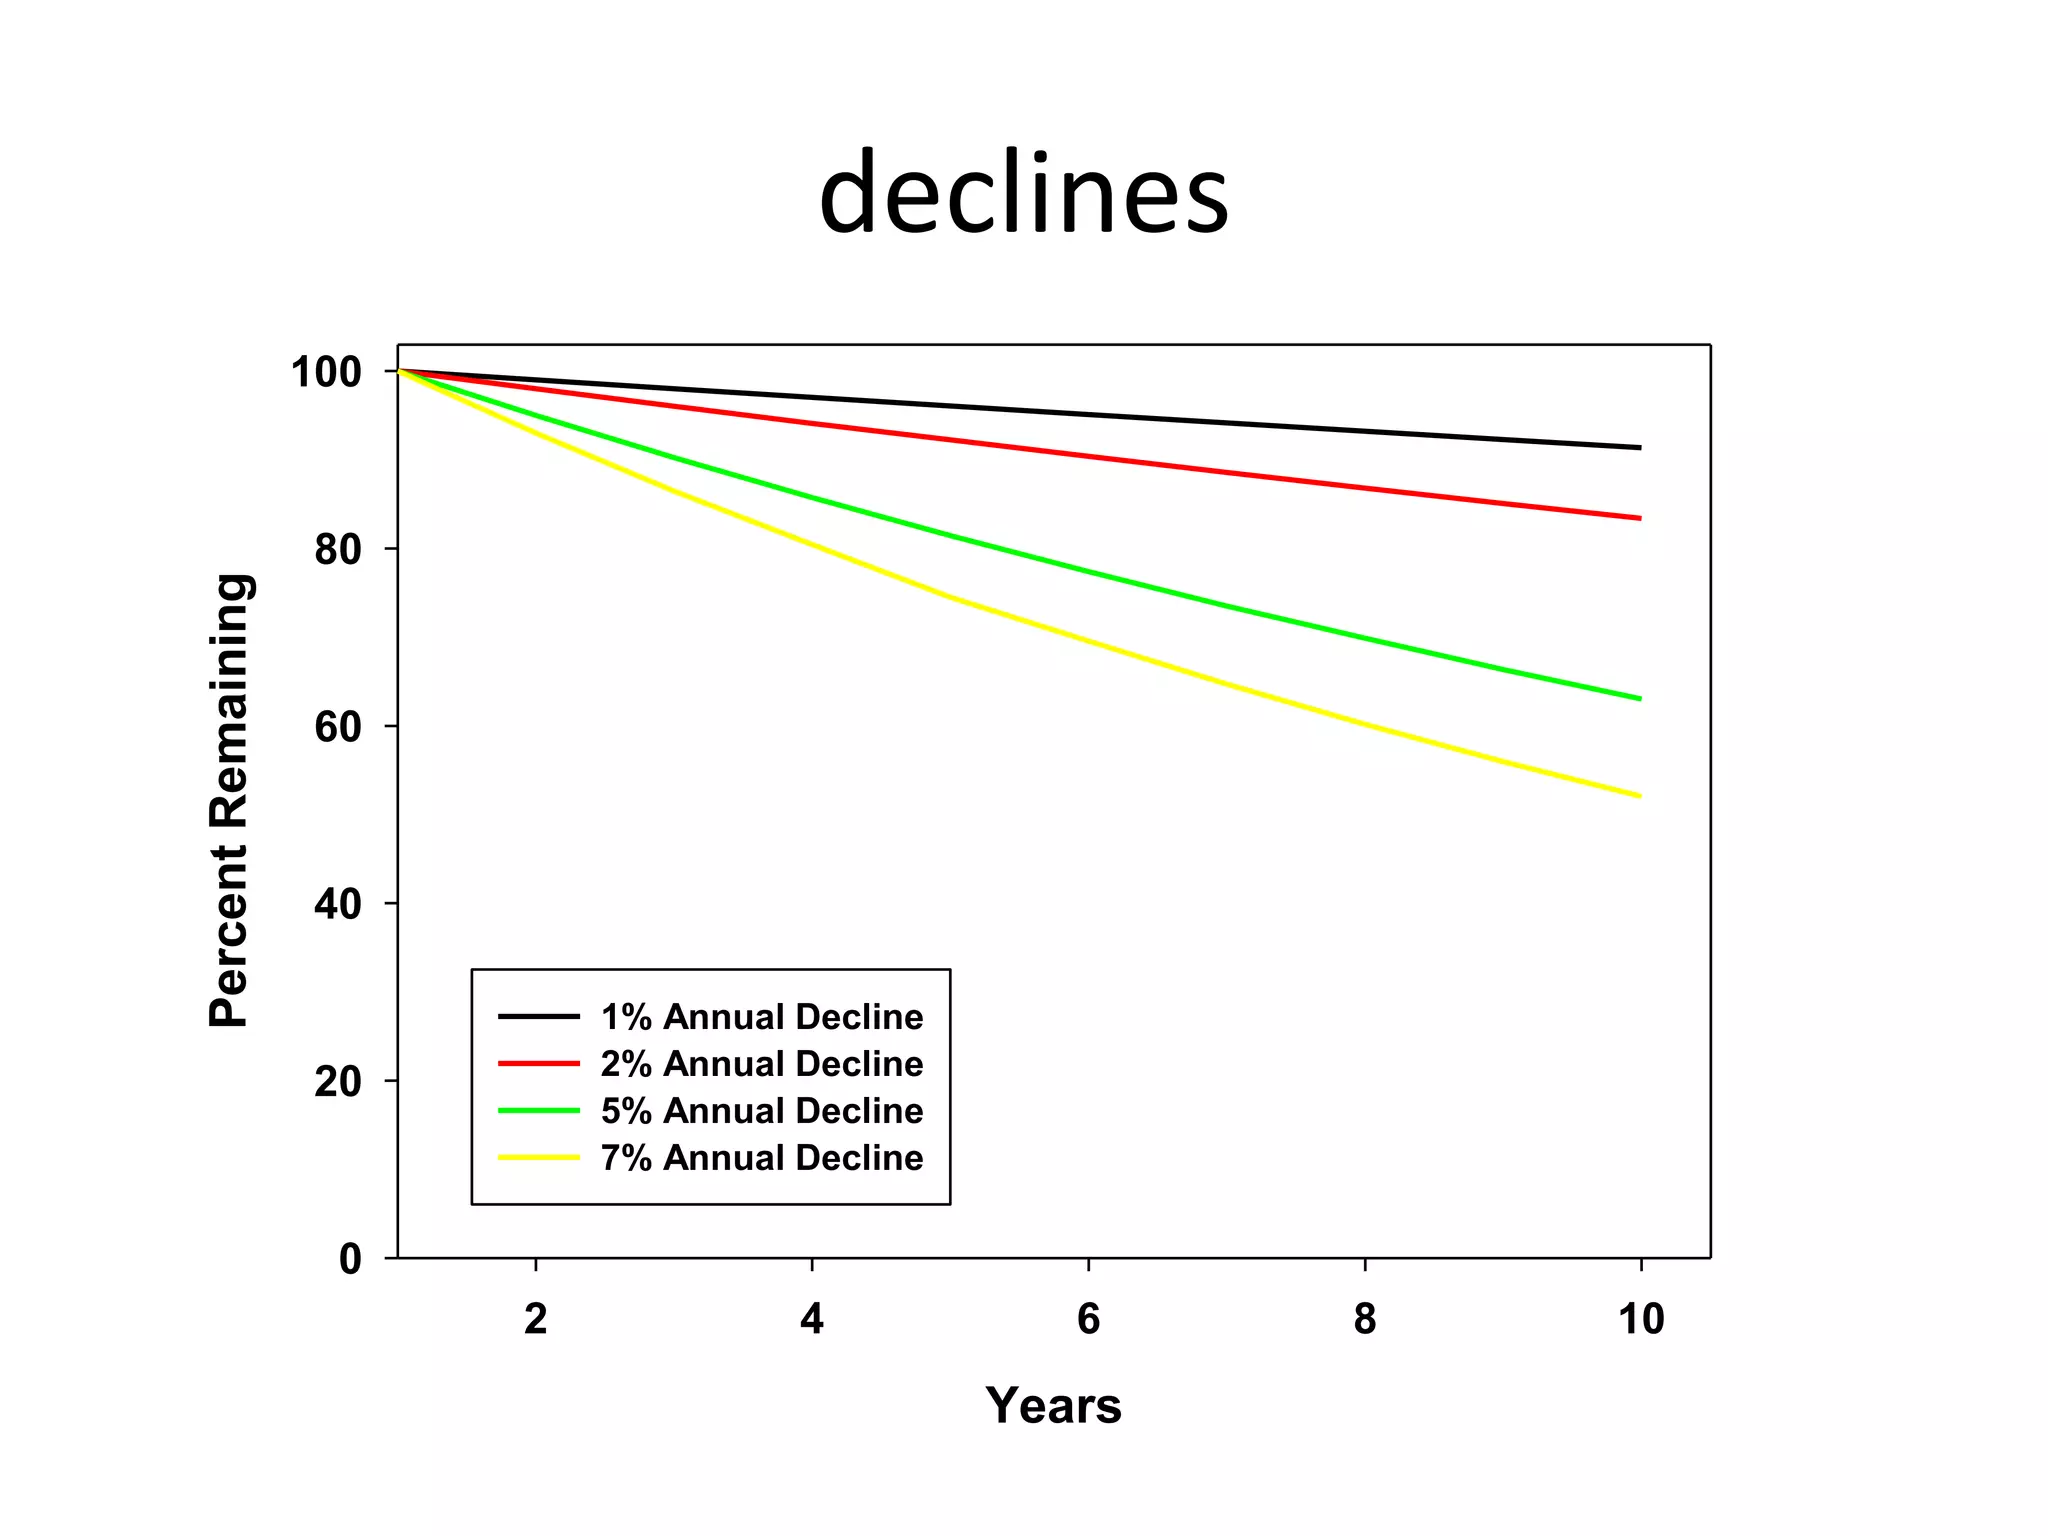
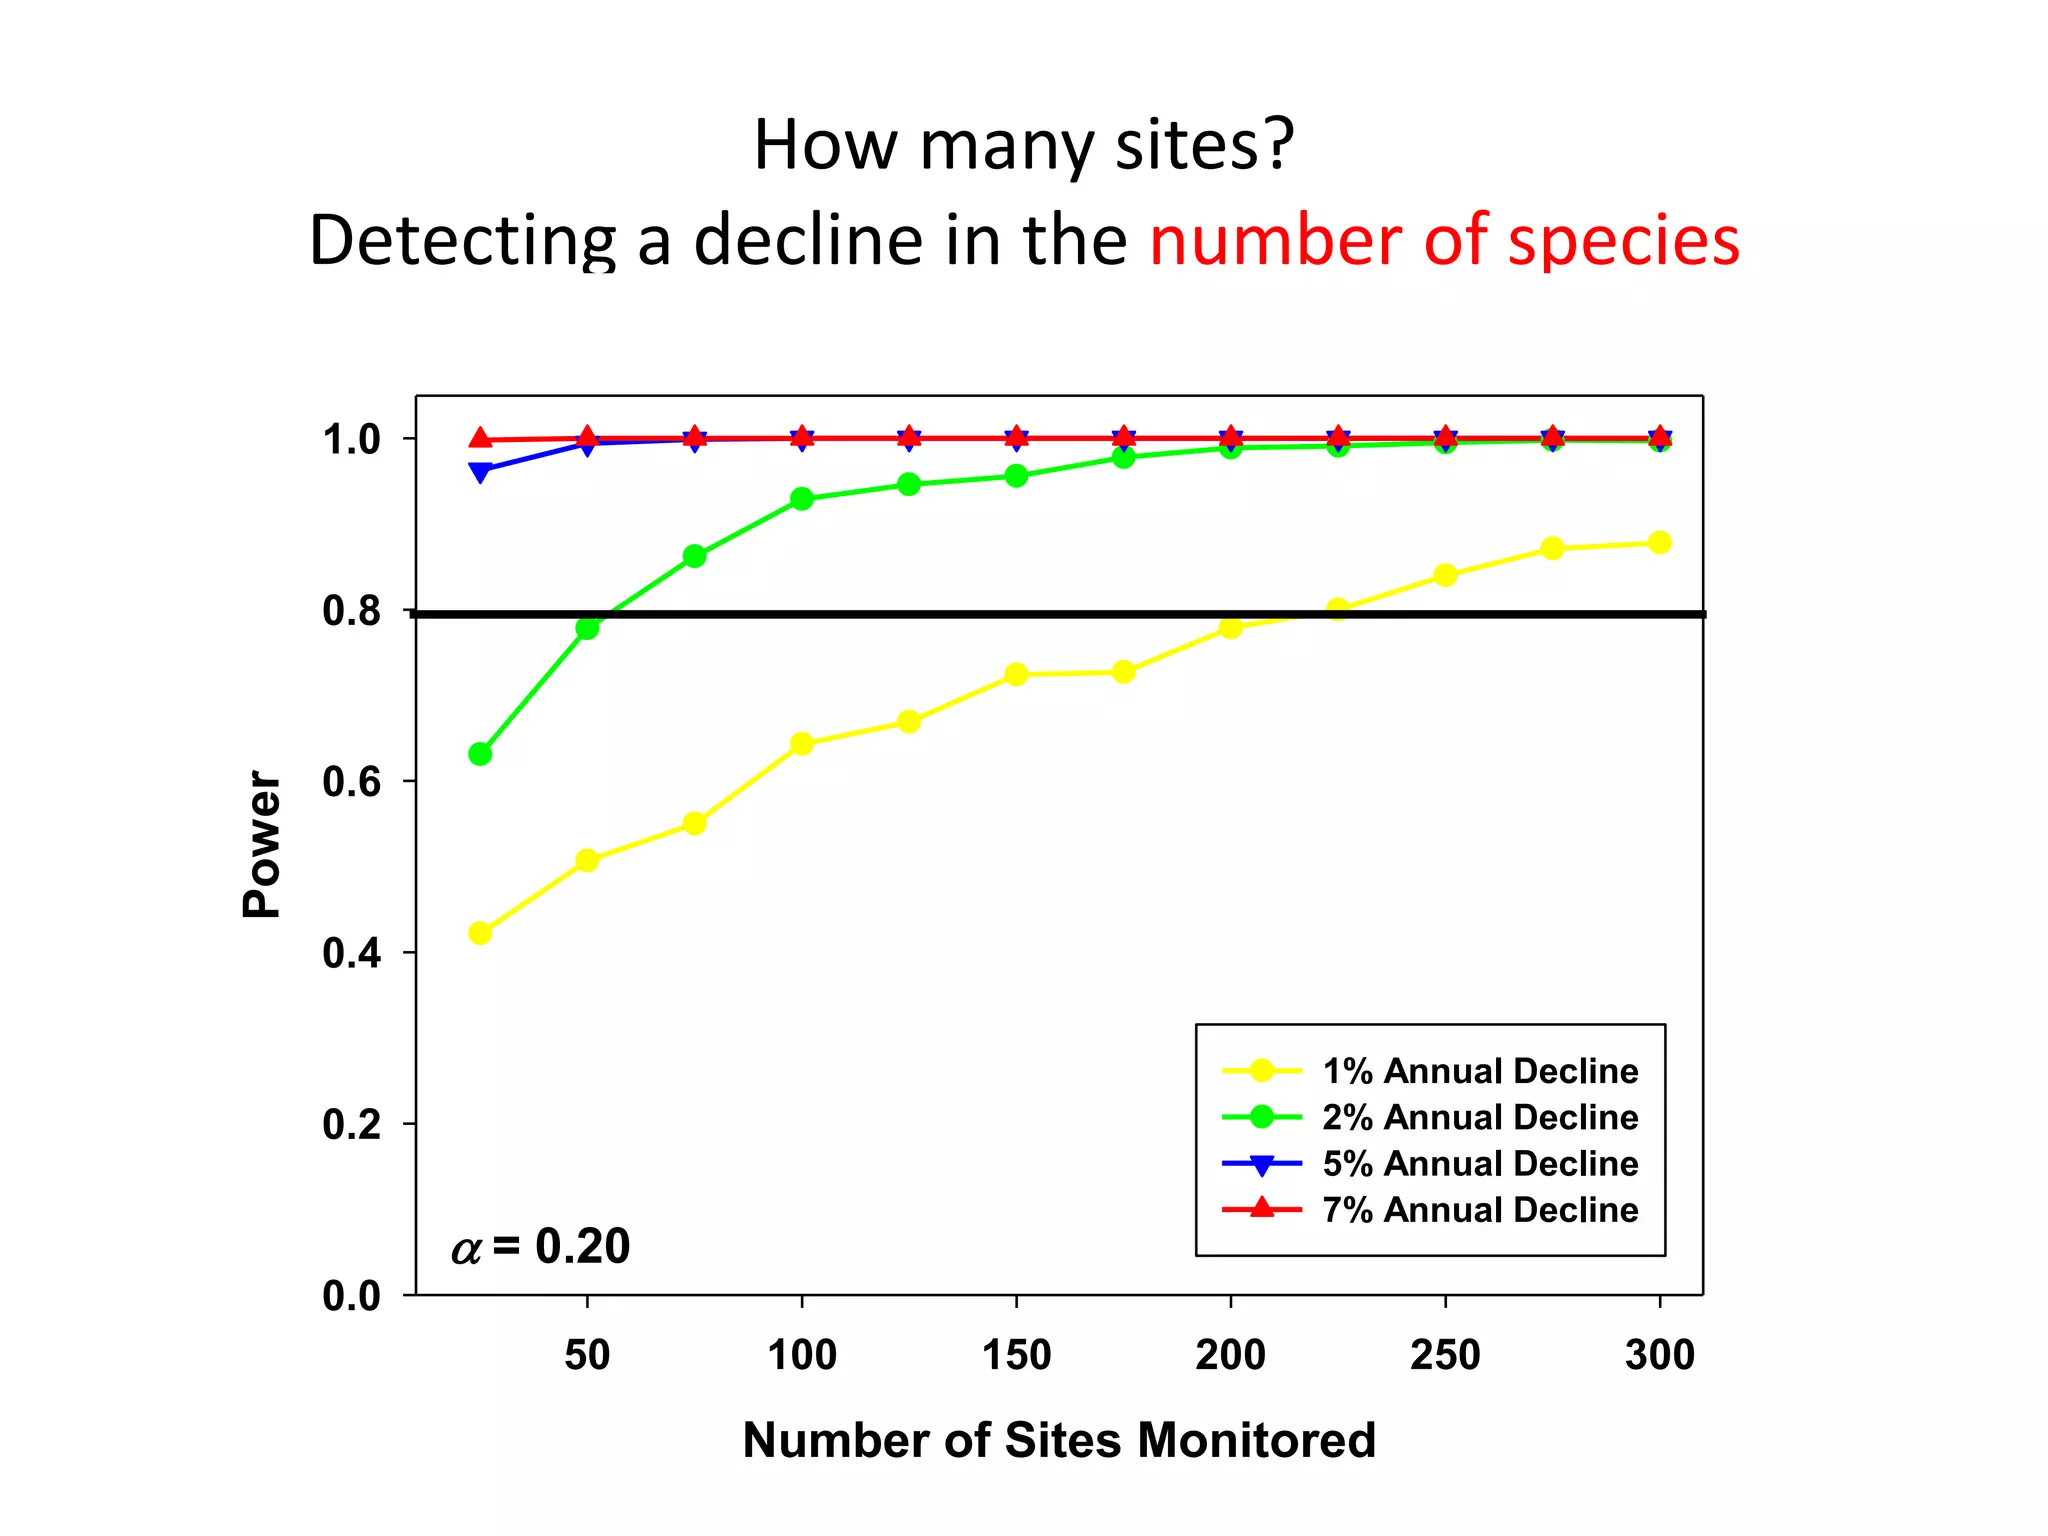
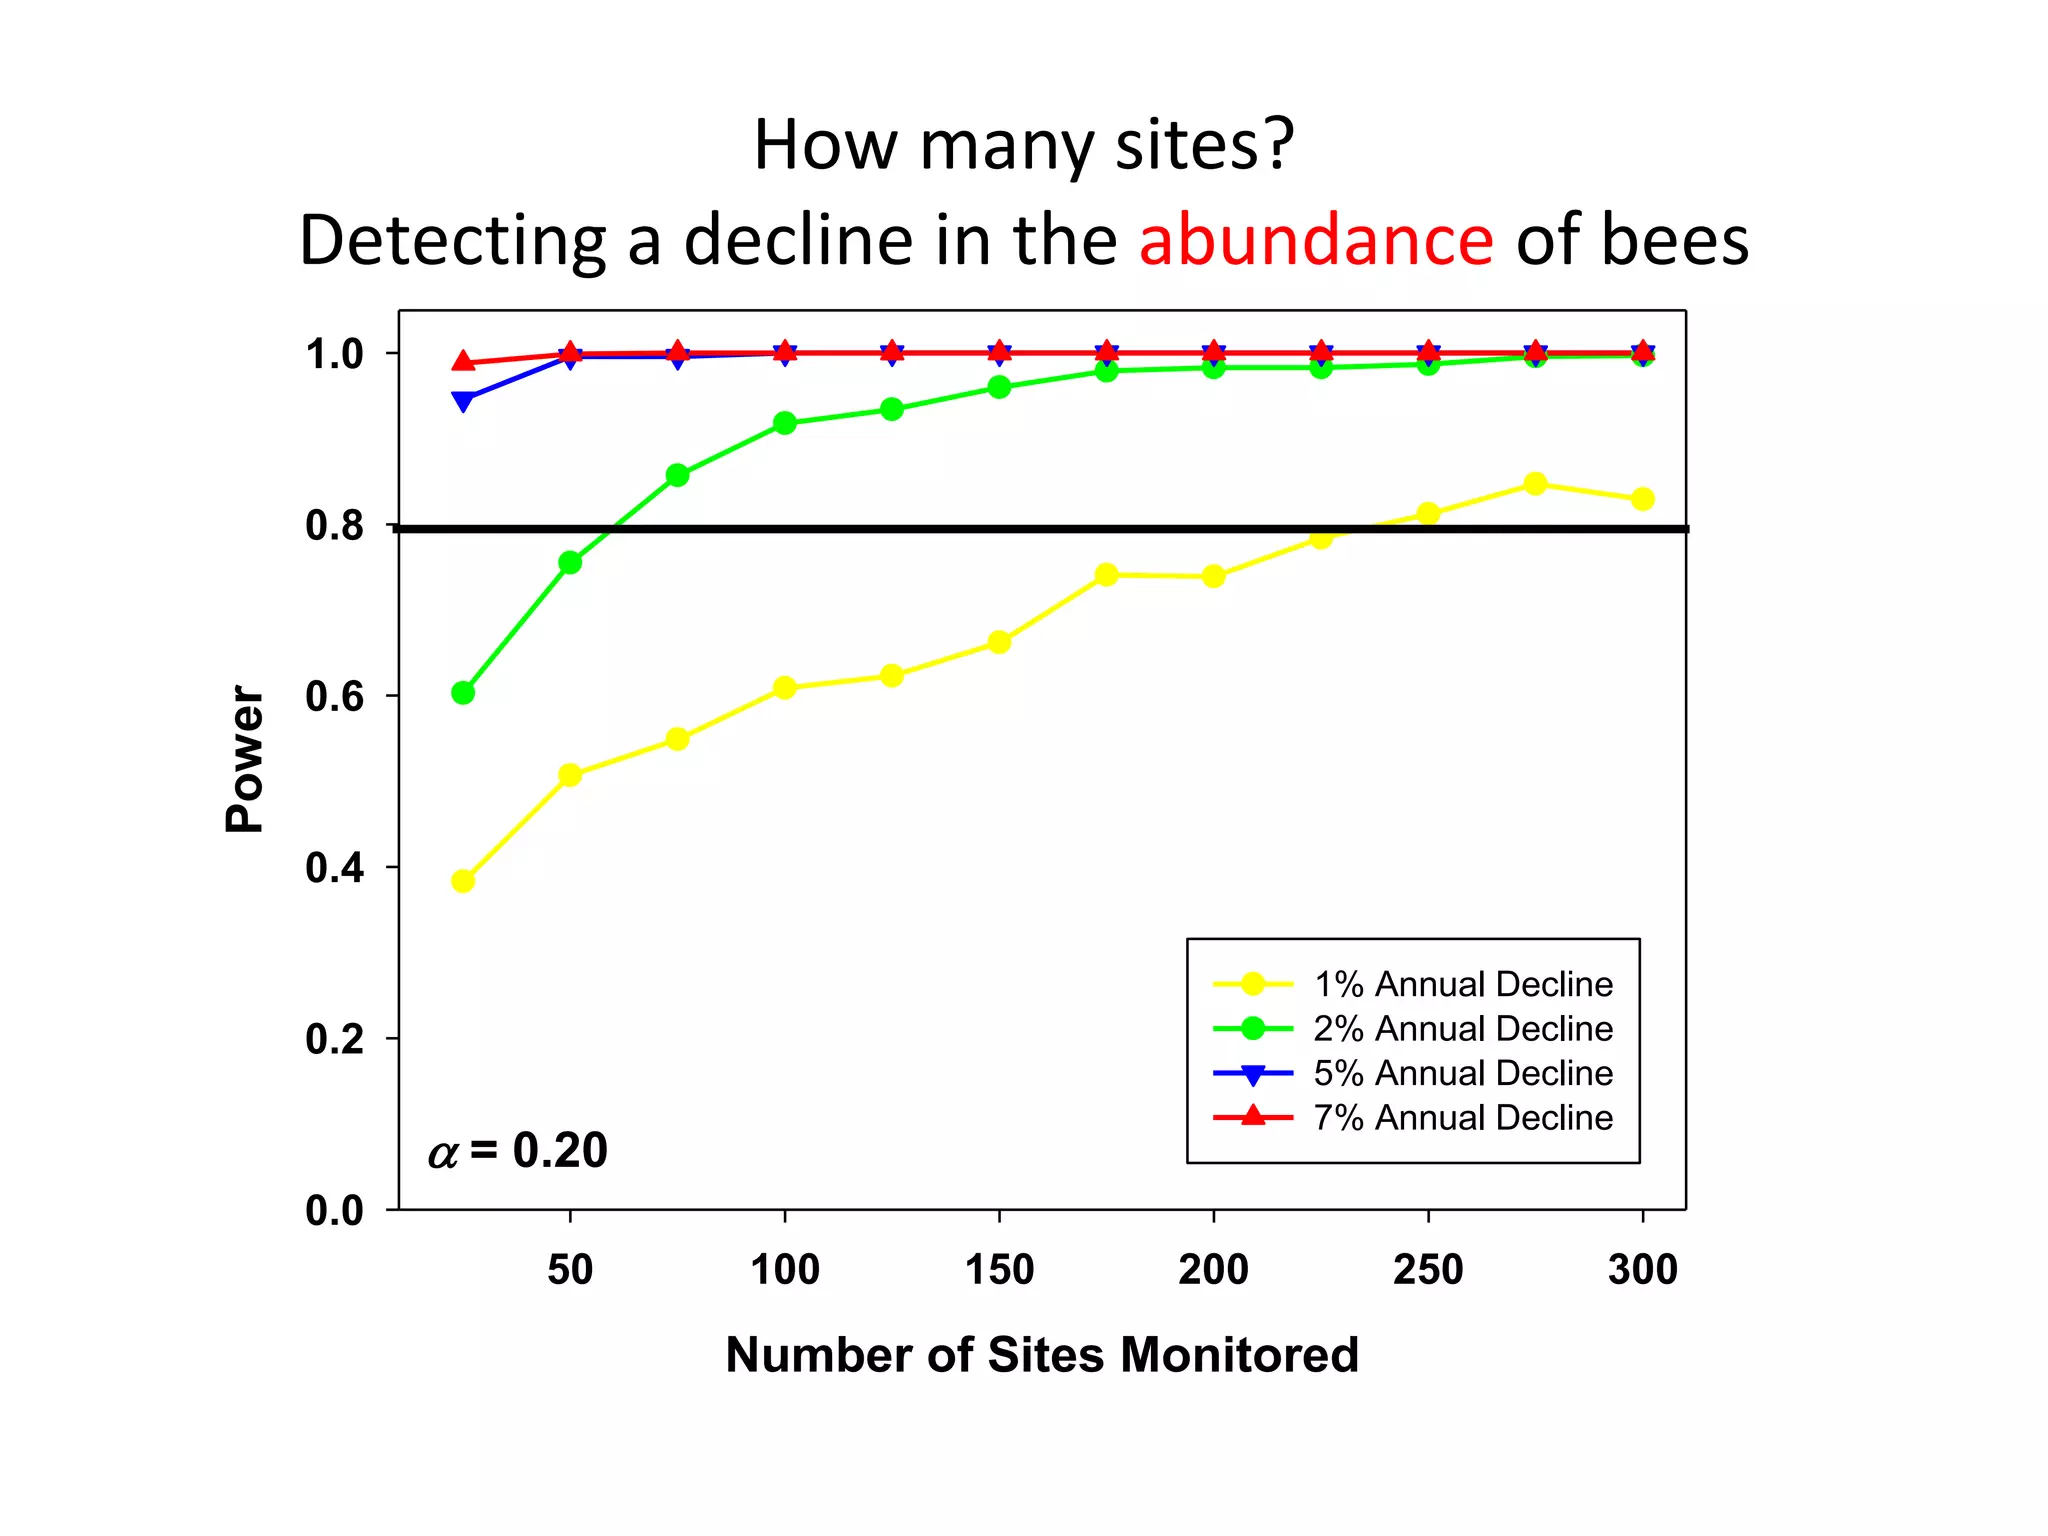
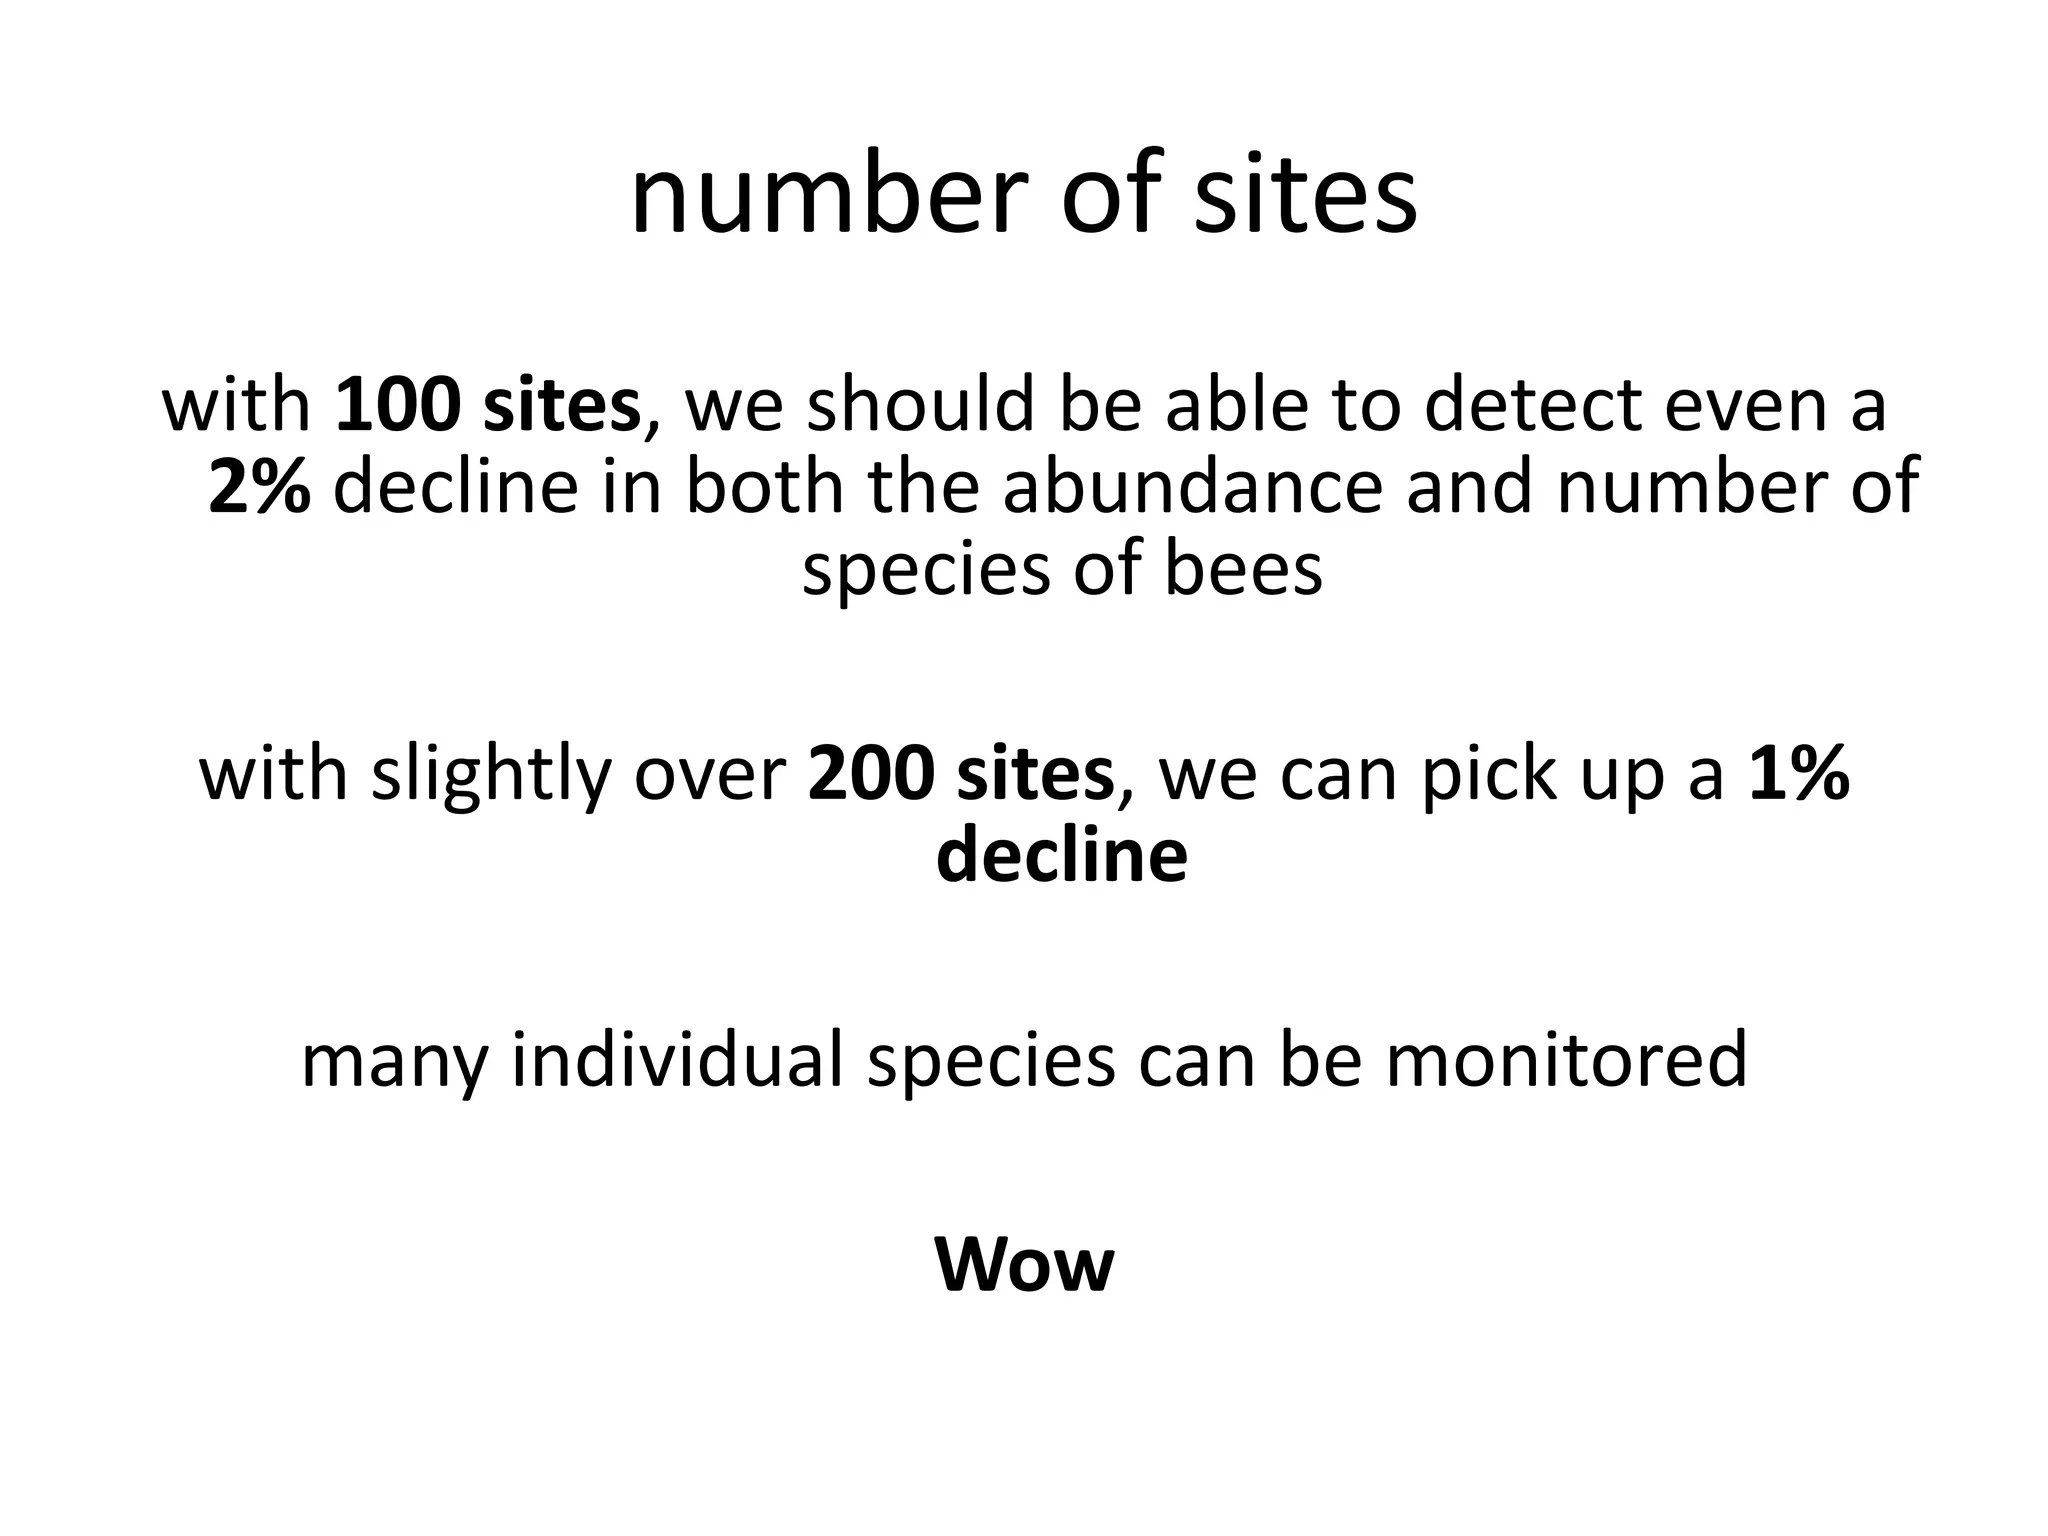
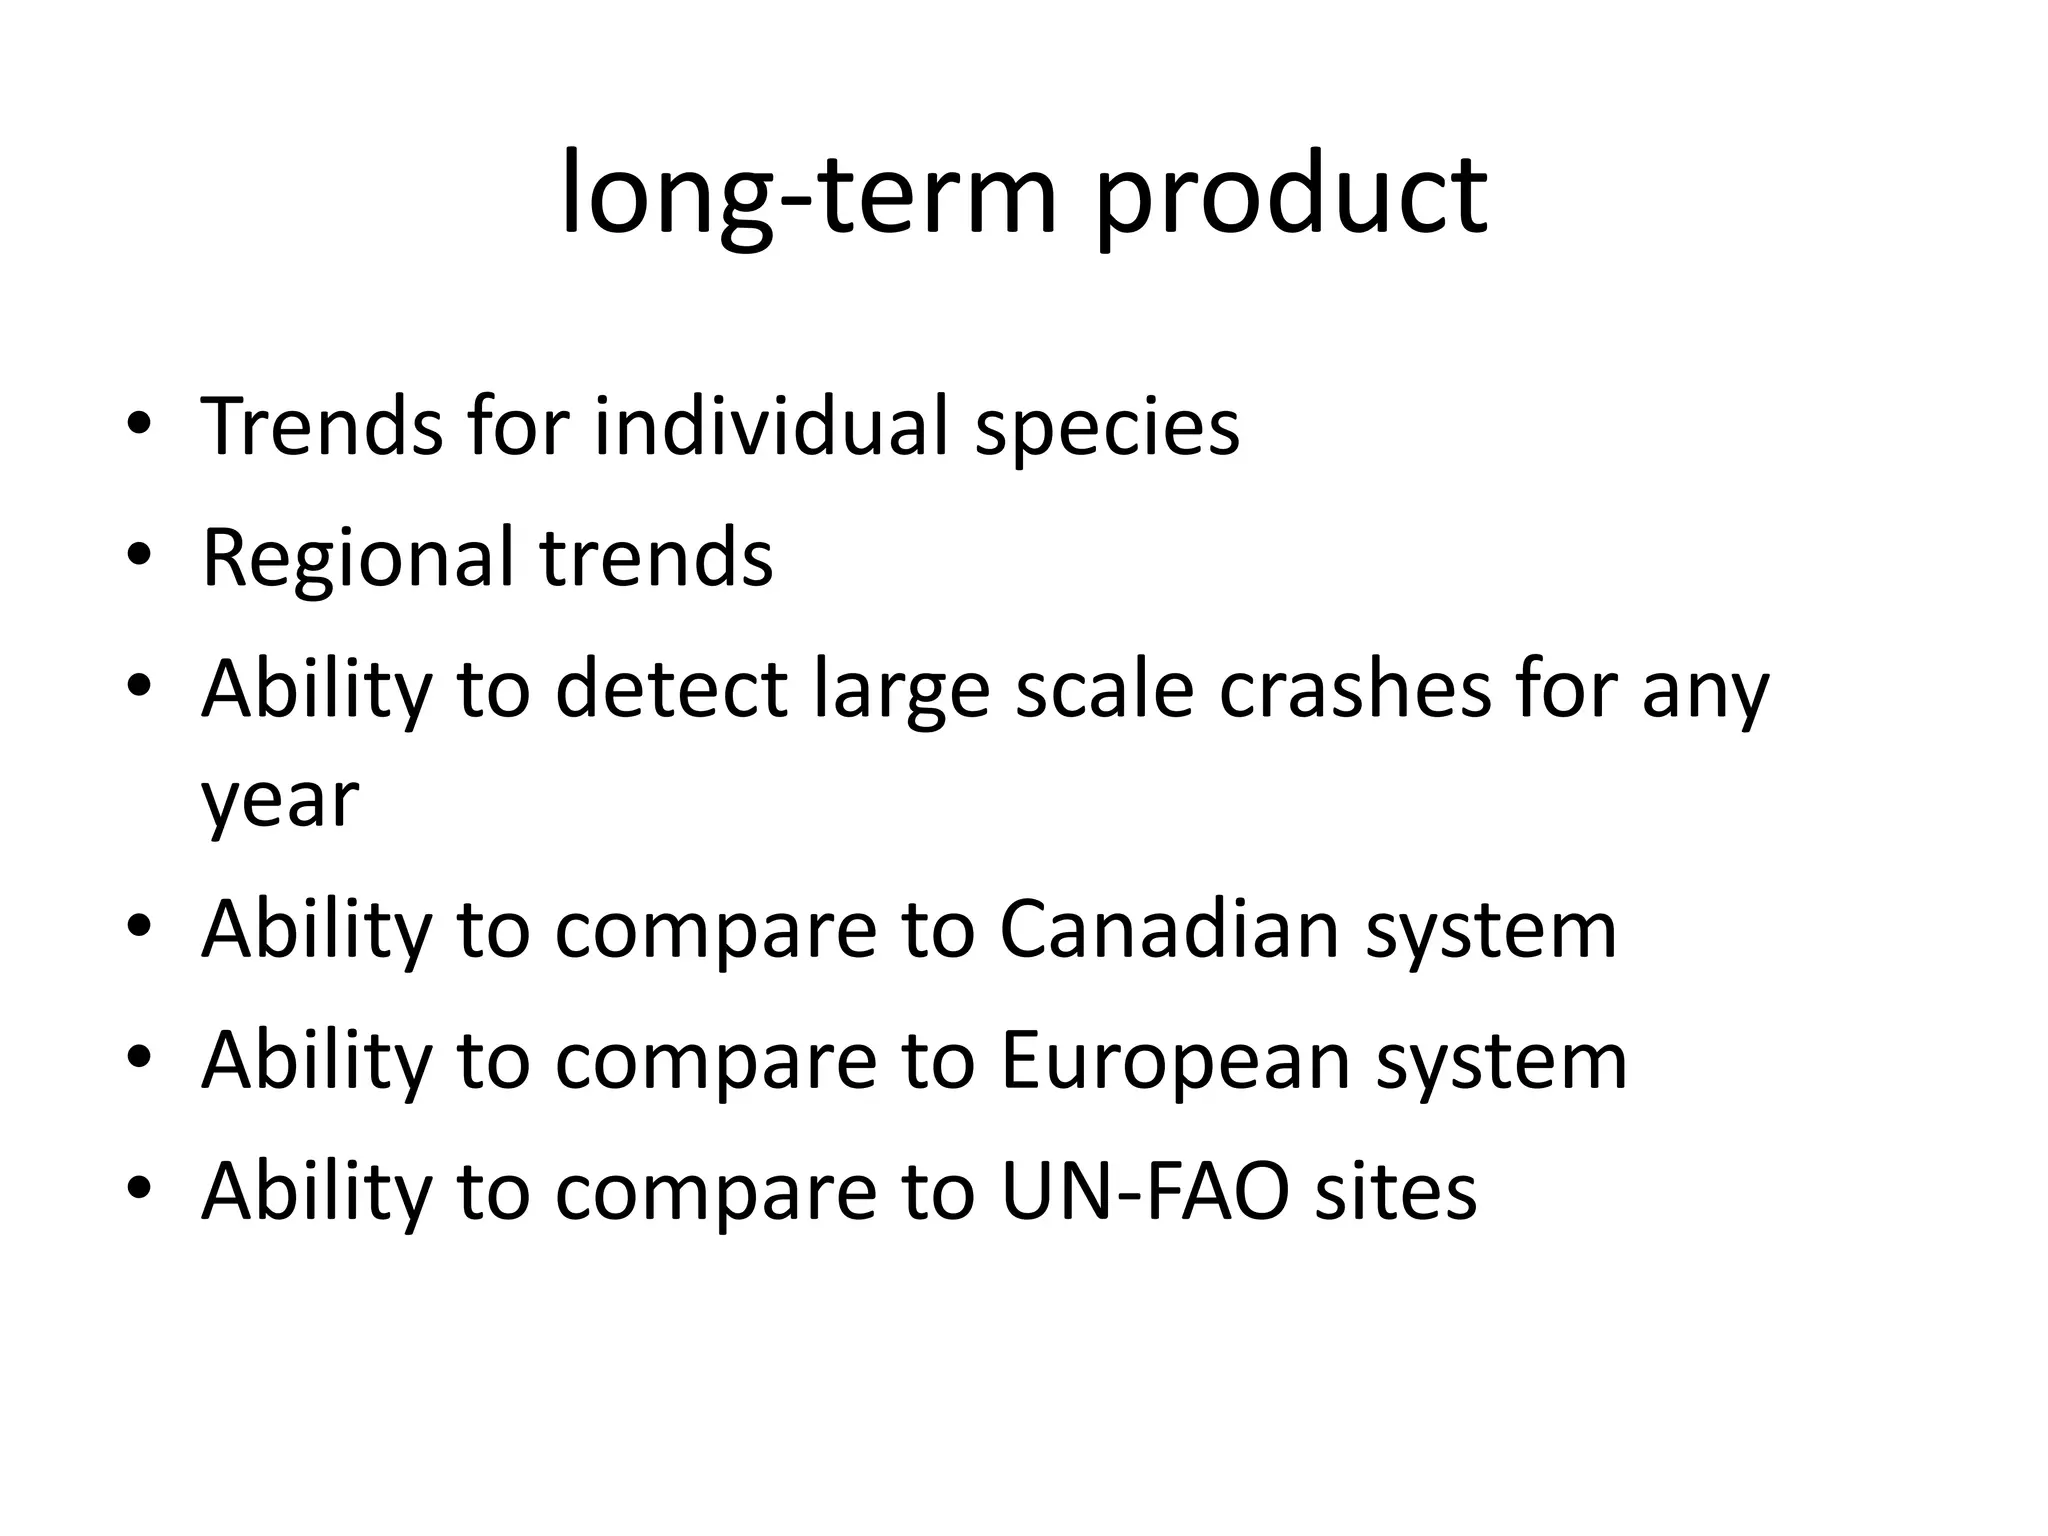
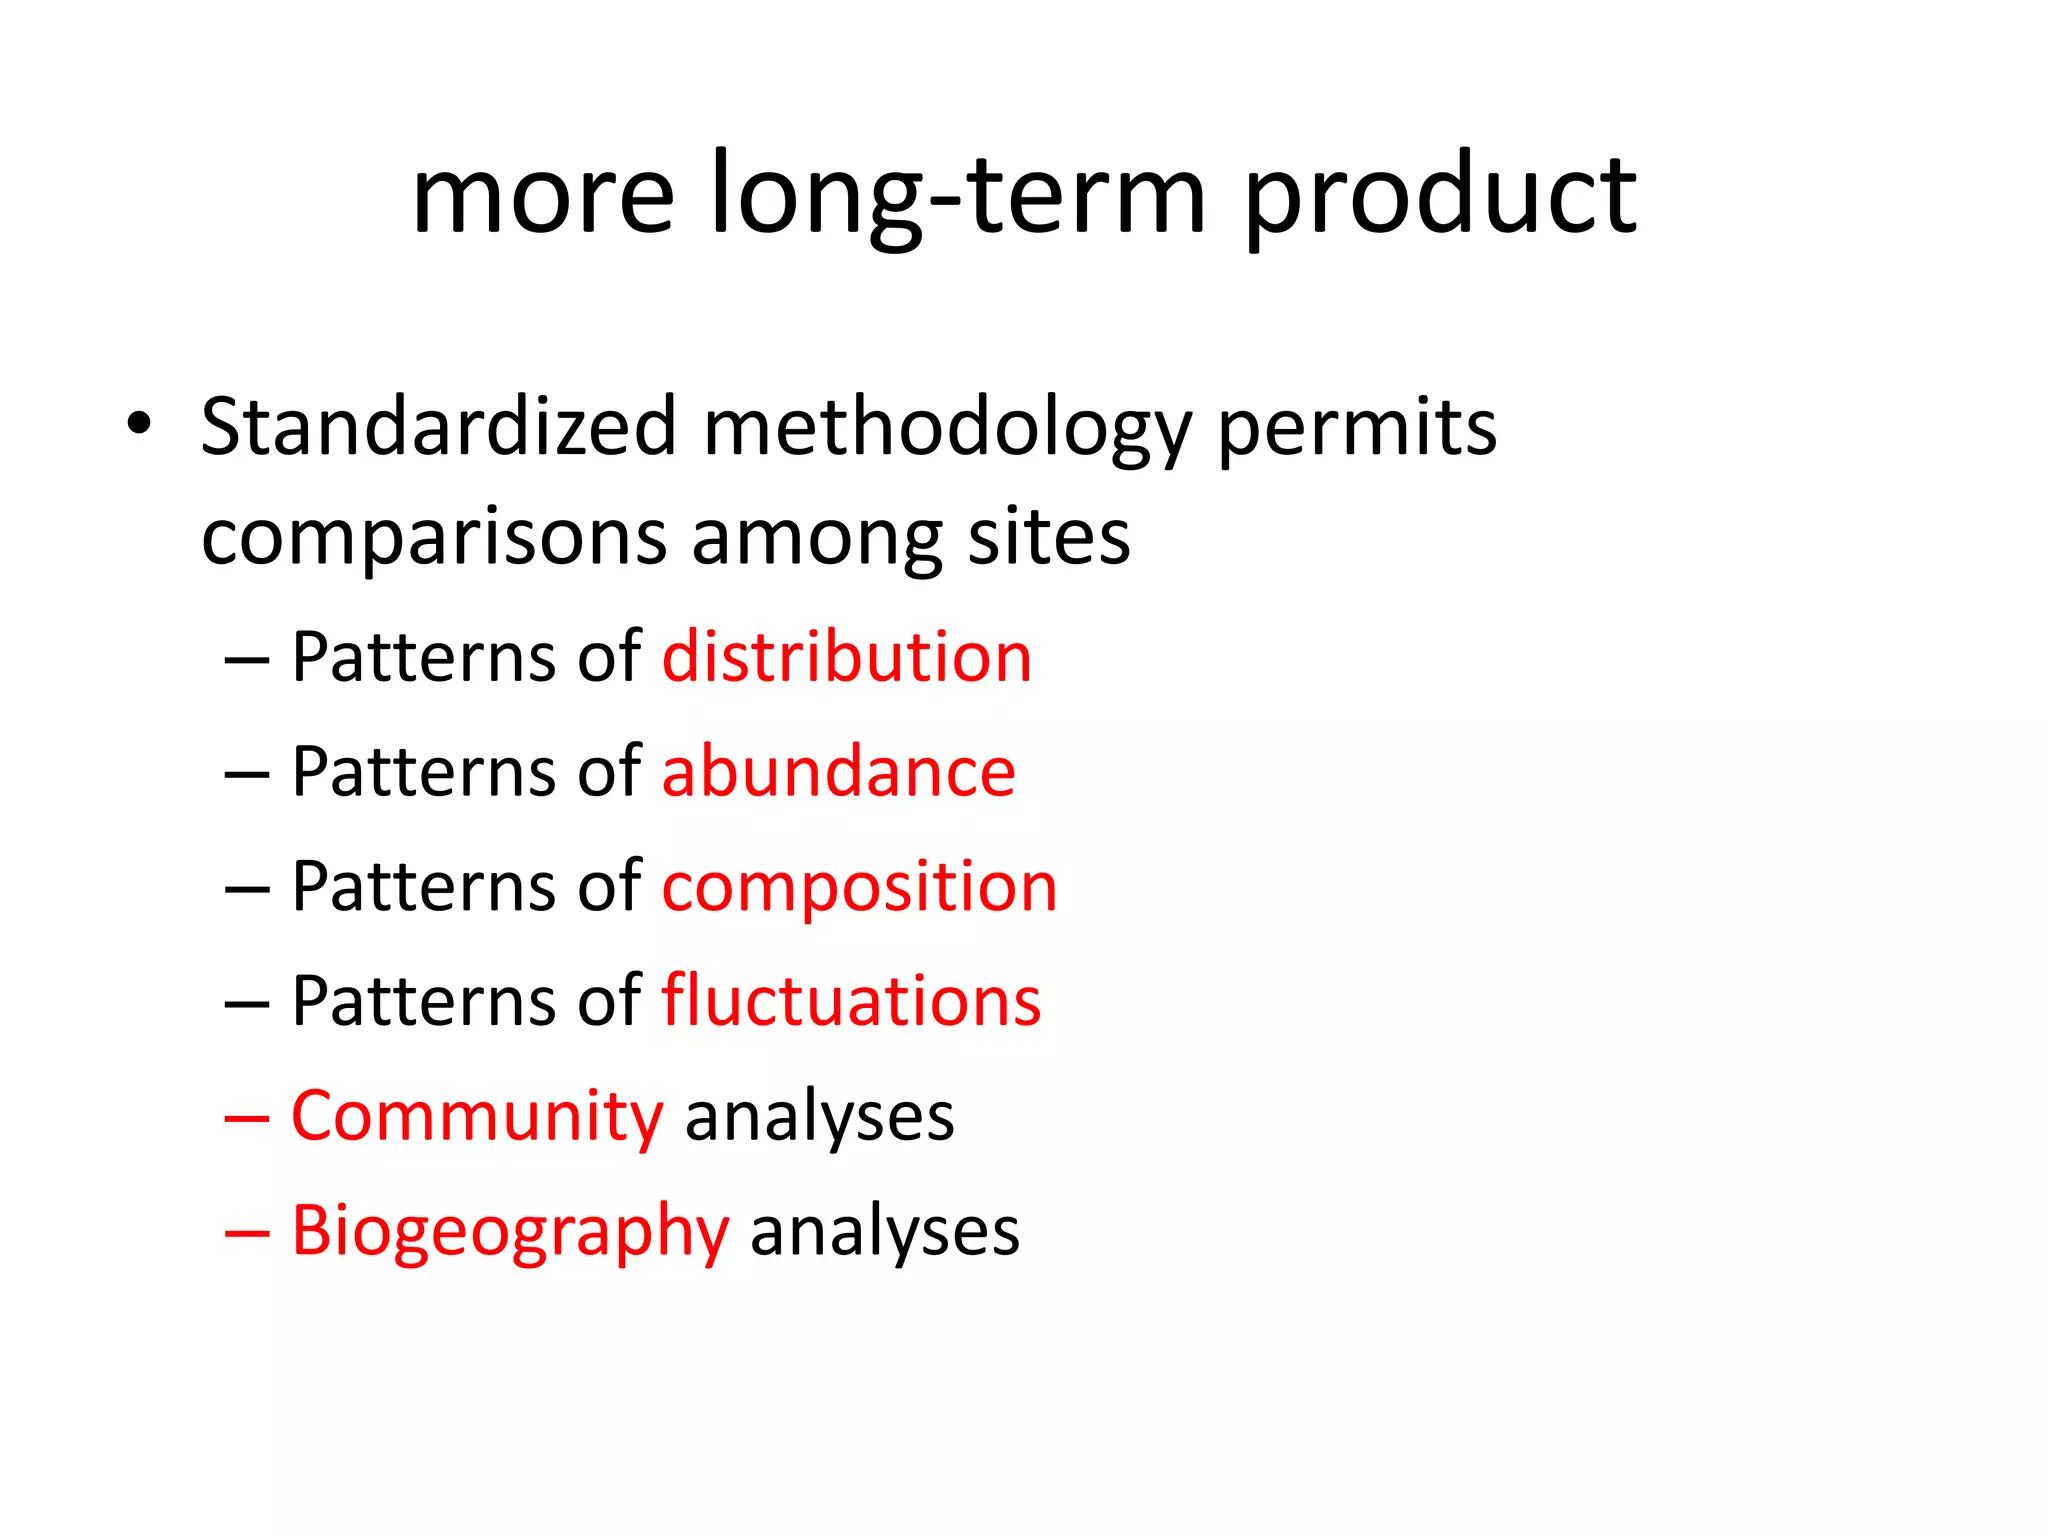
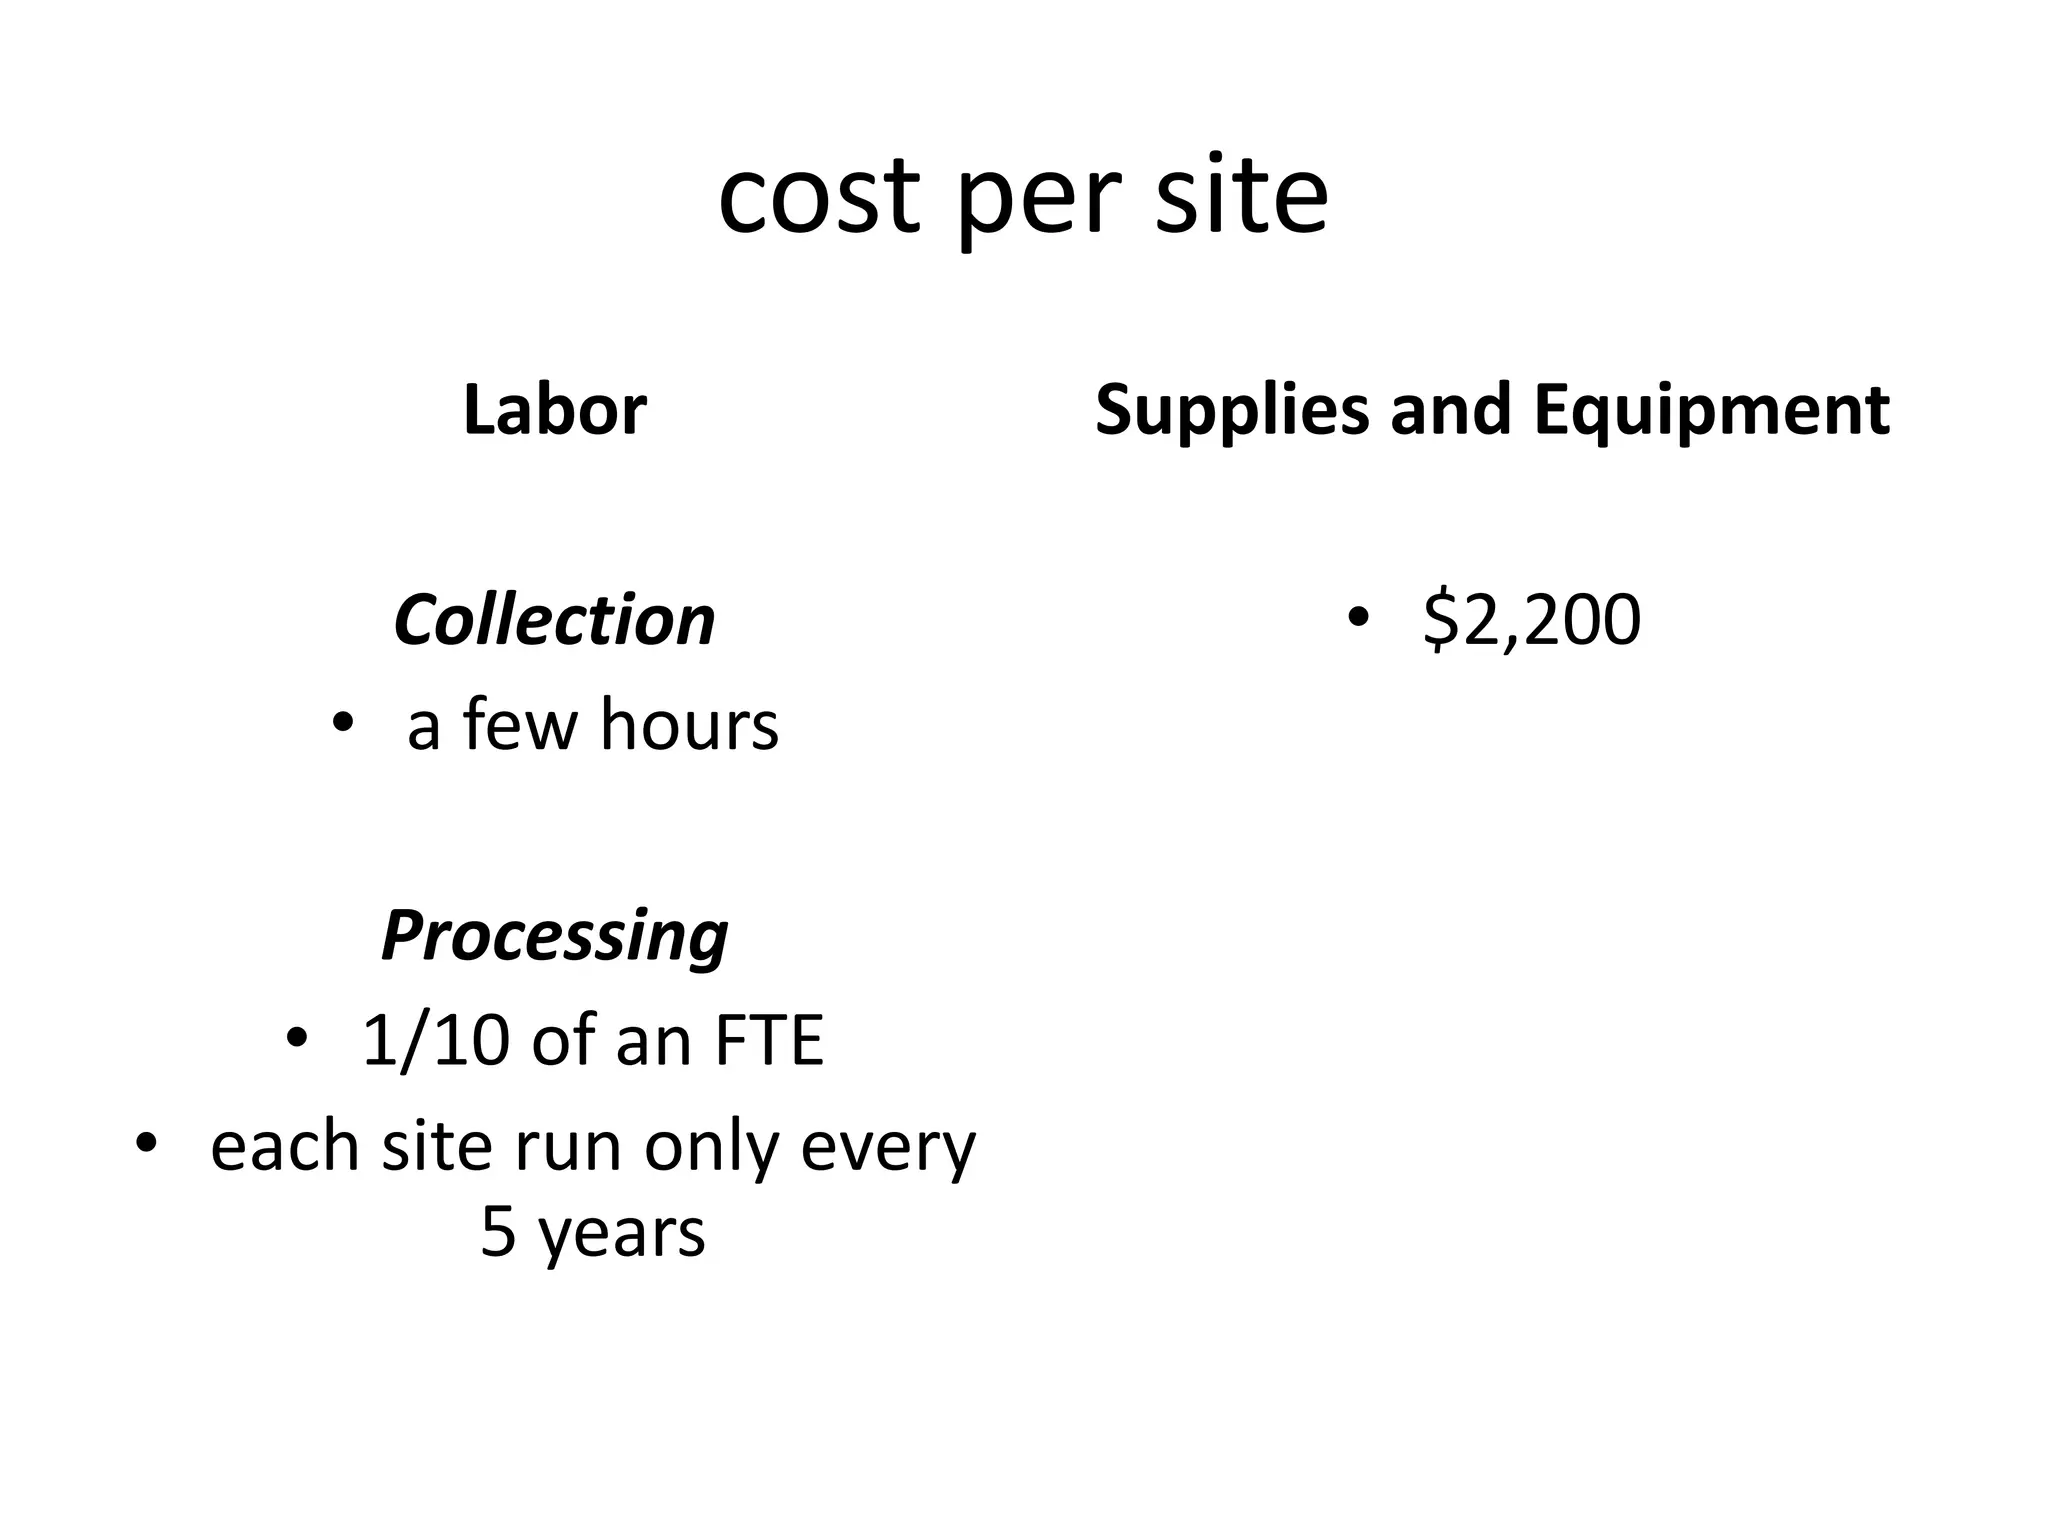
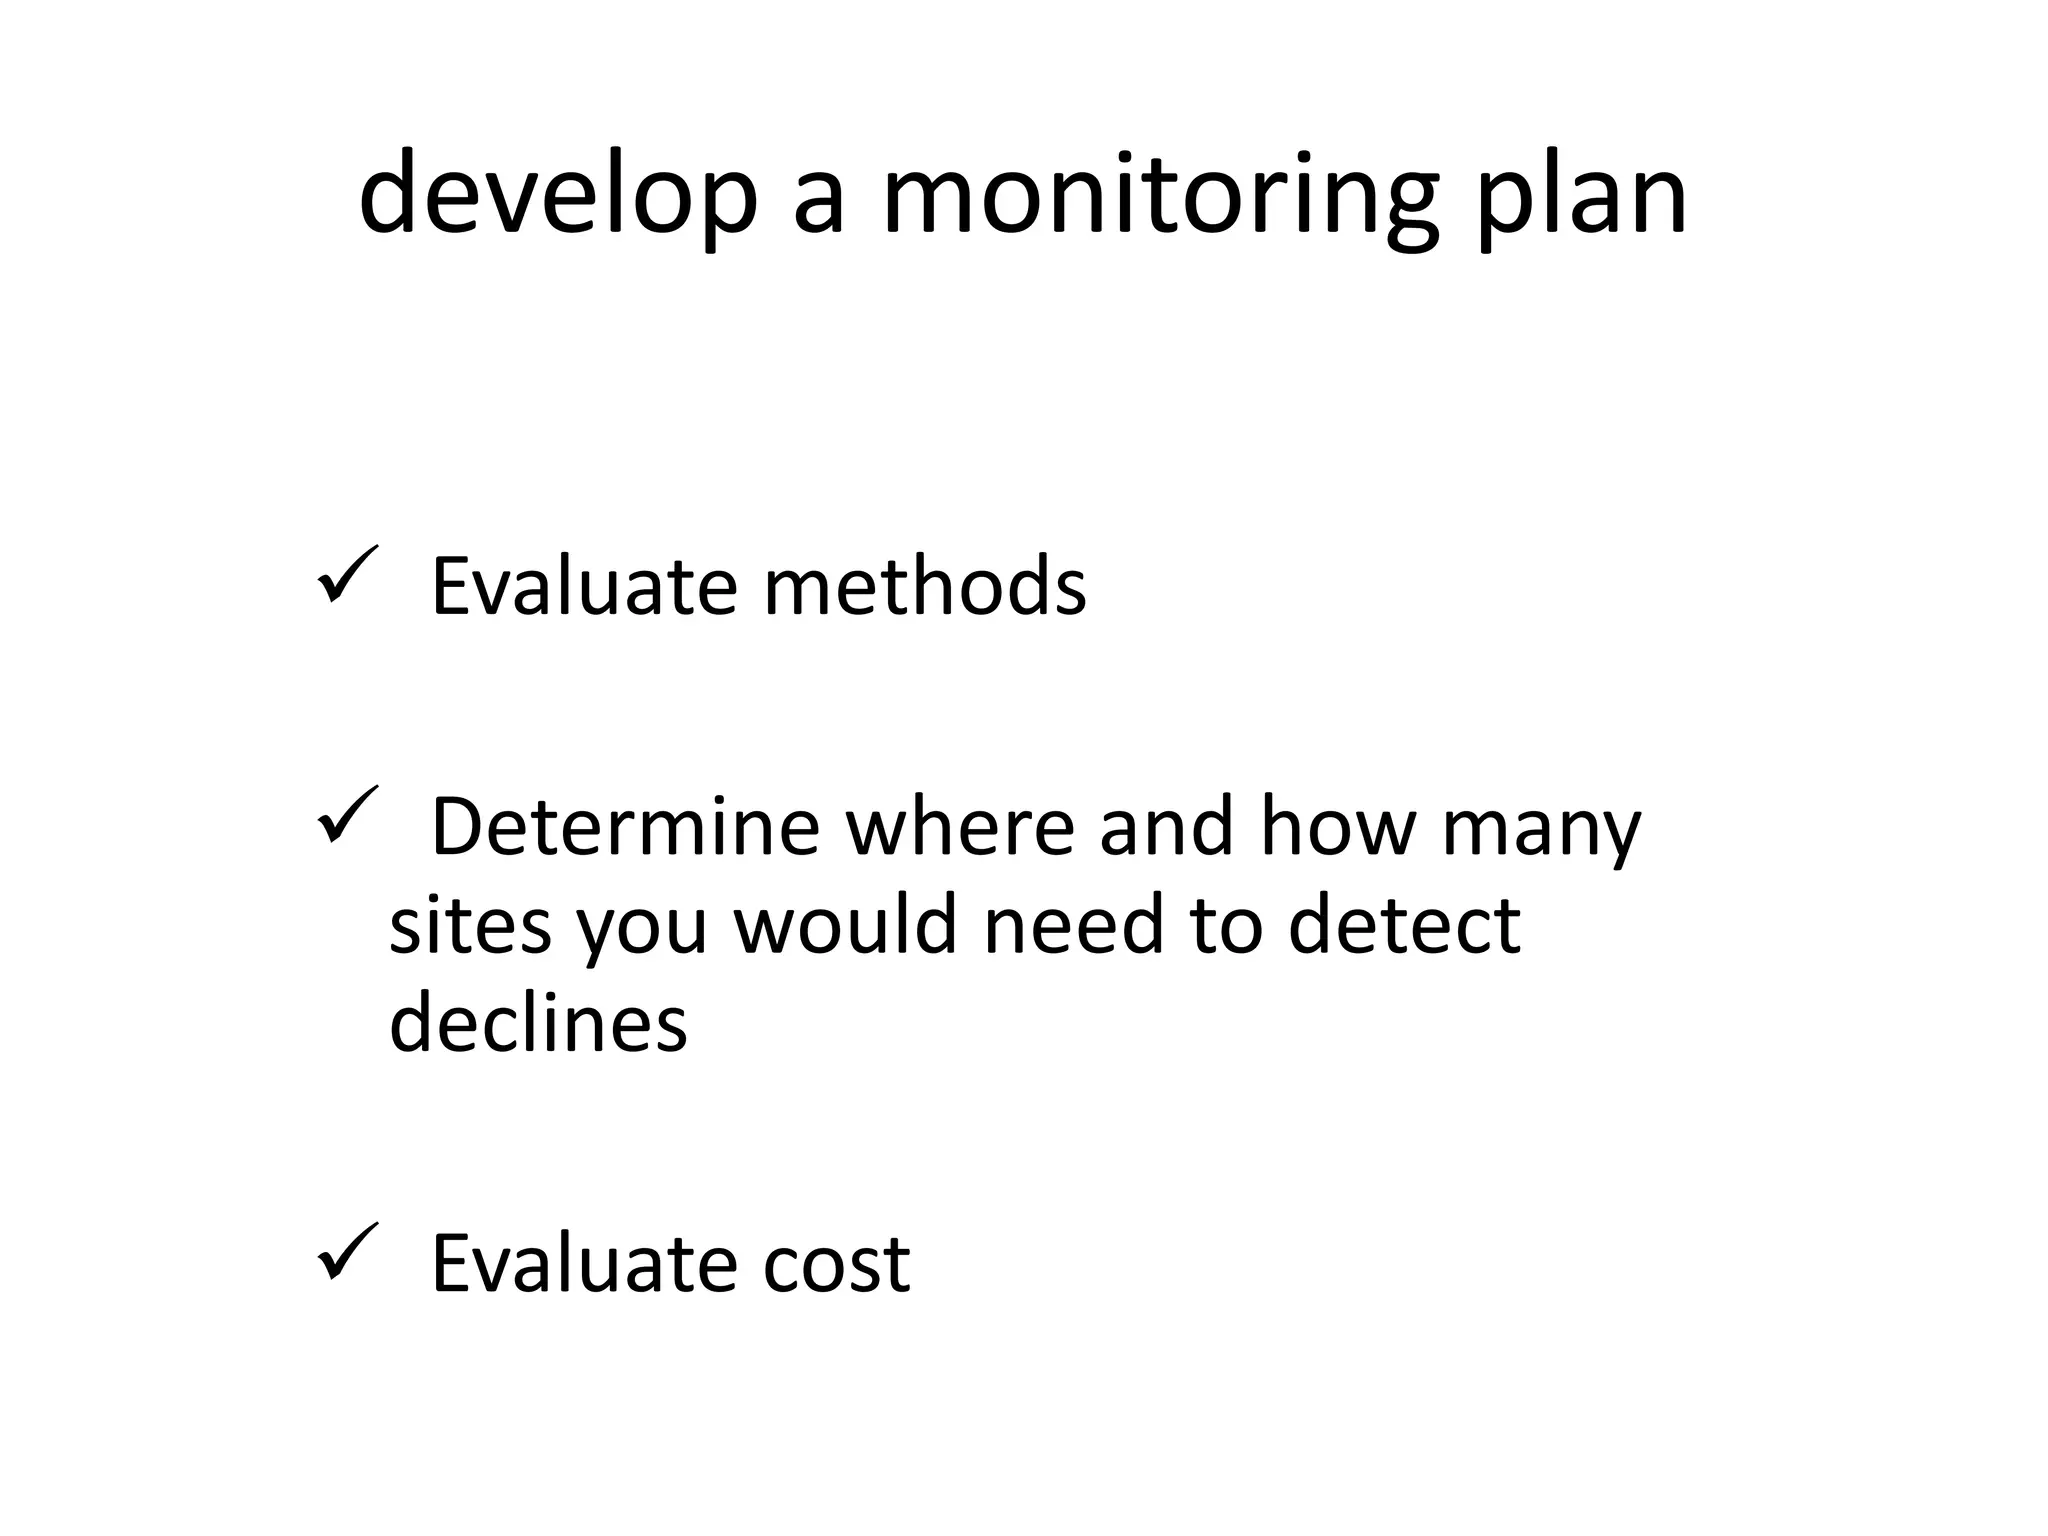
the problem.
the world suspects bees are decliningShrill Carder Bumblebee DistributionData from NBN, with particular thanks to BWARS.
We donot know if there is a crisis nor have we identified how and where to target our conservation measures because until now, there isNO NORTH AMERICAN MONITORING PROGRAM
the solution.
develop a monitoring plan  Evaluate methods
  Determine where and how many sites you would need to detect declines
  Evaluate costmethodsIt doesn’t matter which technique you use, so go with cheap, easy and standardizable.CV = SD/Mean
24 pan traps per transect 8 blue8 yellow8 whiteSample every 2 weeksAt a minimum, sample every fifth year on a rolling basismethods
develop a monitoring plan Evaluate methods
  Determine how many sites you would need to detect declines
  Evaluate costdecisions used multi-year trap studiesestimated number of samples using power analysis
good versus bad sampling>80% probability of detecting a change if one is occurring> 1-3% change in population per year
declines
How many sites?Detecting a decline in the number of species
How many sites?Detecting a decline in the abundance of bees
number of siteswith 100 sites, we should be able to detect even a 2% decline in both the abundance and number of species of beeswith slightly over 200 sites, we can pick up a 1% declinemany individual species can be monitoredWow
develop a monitoring plan  Evaluate methods
  Determine where and how many sites you would need to detect declines
  Evaluate costproductResults in 5 yearsChange in abundanceChange in total speciesChanges in major guilds and generaChanges in common abundant speciesMaps of distributionsMaps of changePublic database of all recordsTons of specimens for collections, dna, revisions, display, etc.Web-based yearly reports
longer term results
long-term productTrends for individual speciesRegional trendsAbility to detect large scale crashes for any yearAbility to compare to Canadian systemAbility to compare to European systemAbility to compare to UN-FAO sites
more long-term productStandardized methodology permits comparisons among sitesPatterns of distributionPatterns of abundancePatterns of compositionPatterns of fluctuationsCommunity analysesBiogeography analyses
the cost.
cost per siteLaborCollection a few hoursProcessing1/10 of an FTE each site run only every 5 yearsSupplies and Equipment$2,200
other costsFull time coordinator for the length of the project
develop a monitoring plan  Evaluate methods
  Determine where and how many sites you would need to detect declines
  Evaluate costa future.
4 separate sampling systems 	National ForestsFish and Wildlife Service RefugesNational ParksCommercial Orchards or other Ag Systems
usfs

Survey Design for Monitoring North American Native Bees

  • 1.
  • 2.
    the world suspectsbees are decliningShrill Carder Bumblebee DistributionData from NBN, with particular thanks to BWARS.
  • 3.
    We donot knowif there is a crisis nor have we identified how and where to target our conservation measures because until now, there isNO NORTH AMERICAN MONITORING PROGRAM
  • 4.
  • 5.
    develop a monitoringplan Evaluate methods
  • 6.
    Determinewhere and how many sites you would need to detect declines
  • 7.
    EvaluatecostmethodsIt doesn’t matter which technique you use, so go with cheap, easy and standardizable.CV = SD/Mean
  • 8.
    24 pan trapsper transect 8 blue8 yellow8 whiteSample every 2 weeksAt a minimum, sample every fifth year on a rolling basismethods
  • 9.
    develop a monitoringplan Evaluate methods
  • 10.
    Determinehow many sites you would need to detect declines
  • 11.
    Evaluatecostdecisions used multi-year trap studiesestimated number of samples using power analysis
  • 12.
    good versus badsampling>80% probability of detecting a change if one is occurring> 1-3% change in population per year
  • 13.
  • 14.
    How many sites?Detectinga decline in the number of species
  • 15.
    How many sites?Detectinga decline in the abundance of bees
  • 16.
    number of siteswith100 sites, we should be able to detect even a 2% decline in both the abundance and number of species of beeswith slightly over 200 sites, we can pick up a 1% declinemany individual species can be monitoredWow
  • 17.
    develop a monitoringplan Evaluate methods
  • 18.
    Determinewhere and how many sites you would need to detect declines
  • 19.
    EvaluatecostproductResults in 5 yearsChange in abundanceChange in total speciesChanges in major guilds and generaChanges in common abundant speciesMaps of distributionsMaps of changePublic database of all recordsTons of specimens for collections, dna, revisions, display, etc.Web-based yearly reports
  • 20.
  • 21.
    long-term productTrends forindividual speciesRegional trendsAbility to detect large scale crashes for any yearAbility to compare to Canadian systemAbility to compare to European systemAbility to compare to UN-FAO sites
  • 22.
    more long-term productStandardizedmethodology permits comparisons among sitesPatterns of distributionPatterns of abundancePatterns of compositionPatterns of fluctuationsCommunity analysesBiogeography analyses
  • 23.
  • 24.
    cost per siteLaborCollectiona few hoursProcessing1/10 of an FTE each site run only every 5 yearsSupplies and Equipment$2,200
  • 25.
    other costsFull timecoordinator for the length of the project
  • 26.
    develop a monitoringplan Evaluate methods
  • 27.
    Determinewhere and how many sites you would need to detect declines
  • 28.
    Evaluatecosta future.
  • 29.
    4 separate samplingsystems National ForestsFish and Wildlife Service RefugesNational ParksCommercial Orchards or other Ag Systems
  • 30.
  • 32.
    sampling – Foreach of the four groupsyear 1 – 50 new sitesyear 2 – 50 new sitesyear 4 – 50 new sitesyear 5 – first 50 are repeated…und so weiter
  • 33.
    centralized processing2 sorting,processing, identification, and databasing centers (West and East)170,000 bees a year between the twoEfficiency of scale1 central coordinator2 FTE’s doing the specimen processing
  • 34.
    New York Timesreports:“Bees in North America NOT declining!”- Laurie Davies Adams, NAPPC 2015
  • 35.