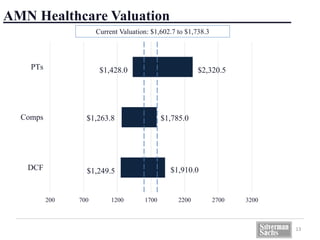
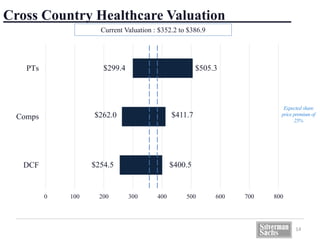
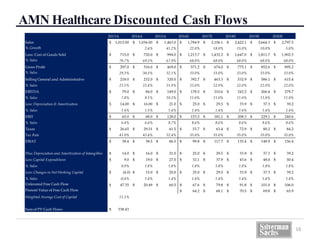
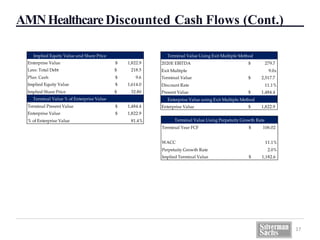
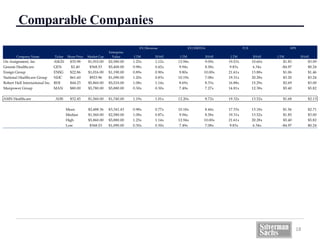
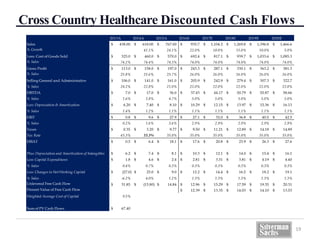
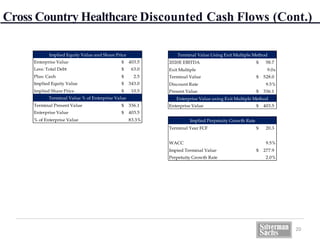
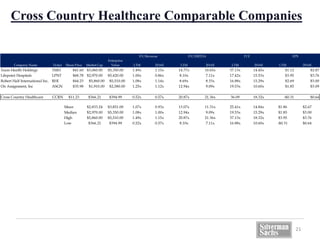
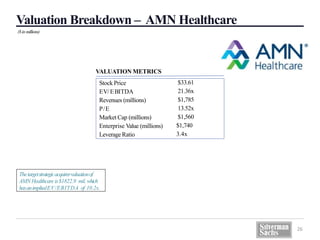
1. Finn Casey
Winnie Chin
Jonathan Faulk
Schuyler O’Reilly
AMN Healthcare Services Inc.
Strategic Discussion Materials
April 1st, 2016
2. Our Team
Finn Casey
• Indiana University, Kelley School of Business, 2019
• Majors: Finance & Accounting
• Naperville, IL
Winnie Chin
• Indiana University, Kelley School of Business, 2019
• Majors: Accounting, Business Analytics, Finance
• Taipei, Taiwan
Jonathan Faulk
• Indiana University, Kelley School of Business, 2019
• Majors: Finance & Economic Consulting
• Fort Lauderdale,FL
Schuyler O’Reilly
• Indiana University, Kelley School of Business, 2019
• Majors: Finance & Accounting
• Fishers, IN
2
3. Table of Contents
3
I. Executive Summary 4
II. Company Overviews 6
III. Industry Overview 9
IV. Strategic Opportunities 11
V. ValuationAnalysis 15
VI. Pro Forma Capital Structure 22
VII. Appendix 25
5. Executive Summary
5
AMN Healthcare Positioning
• AMN healthcare is a leader in Managed Service Programs, Vendor Management Systems,
and in Recruitment Process Outsourcing
• Top-ranked executive search firm
Industry Overview
• The Healthcare Industry has been consistently growing in the past decades due to
Baby boomers’ increasing need for healthcare services
• In the future, Healthcare sector will continue to gain market share
• There is a increasing growth in healthcare employment
Current Capital Structure
• $275.0 million Revolving Credit Facilities
• $150.0 million Term Loan A
• $75.0 million Incremental Term Loan A
• $500.0 million Senior Credit Facilities
Recommendation
• Taking the current capital structure into consideration, we recommend to fund the
acquisition of Cross Country Healthcare with about 100% Debt
• We recommend to proceed debt financing with the existing revolver, term loan A
accordion and term loan B.
7. COMPANY PROFILE
Headquarters
LTM Revenue
Revenue CAGRfrom 2012– 2017E
Market Capitalization
San Diego, CA
$1,460million
4%
$1,620million
AMN Healthcare Corporation Overview
• Operates in all 3 facets of healthcare
staffing; Nurse and Allied Healthcare
Staffing, Locum Tenens Staffing, and
Physician Permanent Placement
Services
• 20 umbrella staffing companies
Thesubstantial
EBITDA increase
in2015 isinlarge
partduetoAMN’s
acquisitionsduring
2014.
• Ameriprise Financial Inc. reduced its stake in AMN
Healthcare Services, Inc. (NYSE:AHS) by 3.3% during
Q4
• ClS Investments LLC added new position in AMN
Healthcare Services during the Fourth Quarter. The
investment management firm now holds 13,021 shares
of AMN Healthcare Services which is valued at
$422,401.
• In 2015 full year revenue increased by 41%, driven by
organic growth of 26% with the remainder from
acquisitions .
REVENUE BREAKDOWN
7
RECENT HEADLINES EBITDA (MILLIONS)
63%22%
15%
Nurse and
Allied
Solutions
Locum
Tenens
Solutions
Other
Workforce
Solutions
$-
$20.00
$40.00
$60.00
$80.00
$100.00
$120.00
$140.00
$160.00
2013 2014 2015
8. COMPANY PROFILE
Headquarters
LTM Revenue
Revenue CAGRfrom 2012– 2017E
Market Capitalization
Boca Raton, FL
$762.4million
4%
$379.3million
Cross Country Healthcare Inc. Overview
• CCRN was among the biggest gainers on the
Russell 2000 for Tuesday March 29 as the stock
popped 5.25% to $11.23
• They announced today that two of its brands
have won Inavero’s Best of Staffing® Awards
for providing superior service to their clients
and job seekers
• In 2015 full year revenue from services
increased by 24.2%
REVENUE BREAKDOWN
8
RECENT HEADLINES EBITDA (MILLIONS)
$0.00
$5.00
$10.00
$15.00
$20.00
$25.00
$30.00
$35.00
$40.00
2013 2014 2015 2016E
• Active client base of over 3,000 hospitals,
pharmaceutical companies and other
healthcare providers across all 50 states
• Currently have more than 27,000 healthcare
professionals on assignment at over 6,700
facilities
24%
26%25%
25%
Travel Nursing
Per Diem
Allied/Other
Locums
10. KEYSTATISTICS
Revenue: $13.9 billion
Profit: $91.1 billion
Annual Growth from 2014 – 2020: 3.2%
• Number of Healthcare Staffing
• Major Companies: AMN Healthcare, Cross Country
Healthcare, CHG Healthcare Services
• Employees: 1.3 million
Industry Overview
CURRENT M&ATRENDS
• Accounted for 22 transactions in 2015.
• Interest is being accelerated as buyers
realize the opportunity presented by a
growing number of healthcare
beneficiaries. Coupled with a
consolidating supplier/provider base of
companies and acquisition opportunities
they become even more attractive.
INDUSTRY TRENDS
• The industry has experienced a revenue increase in
recent years as a result of increased demand and
aging baby boomers.
• AMN Healthcare remains dominant (9%) of the total
market share. They will continue to gain market share
over the near future.
• With a shortage of registered nurses and
physicians as well as an increase of aging
baby boomers the healthcare staffing industry
will continue to grow..
• Over the next 5 years aging senior citizens are
predicted to make up 15.5% of the population,
creating more need for healthcare.
• Projected 6 million non-elderlyAmericans to gain
access to healthcare in 2016.
Annual revenue
growthof 3.29% over
thenext 4years.
10
MARKET SIZE (BILLIONS)
12. Capital Structure OpportunitiesDescriptionBenefitsConsiderations
100% debt
• Credit Revolver $125
million
• Term Loan A accordion, $
• Term B loan for $280
million
• Splitting the pro forma
capital structure allows
for less interest to be paid
and a lower corporate tax
rate
• Industry dependent
upon consumer
discretionary
spending
Short term loans
used to cover
wages and month-
to-month expenses
• Banks have strong
appetite for funded
assets
• Lowest all-in cost of
capital
• 5-10%Term Loan
amortization
requirement
• Bank market limits
leverage profile
restricted payments
Ashort term loan used
to fund mergers and
acquisitions
• Investors seeking
yield
• Strong public investor
participation
• Yield driven investor
base making borrower
friendly amendments
difficult
• Typically a 6-12 month
soft-call period
Issuing a high yield
bond
• Strong public investor
participation and
secondary market
• No maintenance
covenants
• Investors look for
$200mm+ tranches
for liquidity
Potential Capital Structure
12
Term Loan A Term Loan B High Yield
Revolver, Term Loan
A Accordion, Term
Loan B
17. AMNHealthcareDiscounted Cash Flows (Cont.)
17
Implied Equity Value and Share Price
Enterprise Value 1,822.9$
Less: Total Debt 218.5$
Plus: Cash 9.6$
Implied Equity Value 1,614.0$
Implied Share Price 32.80$
Terminal Value % of Enterprise Value
Terminal Present Value 1,484.4$
Enterprise Value 1,822.9$
% of Enterprise Value 81.4%
Terminal Value Using Exit Multiple Method
2020E EBITDA 279.7$
Exit Multiple 9.0x
Terminal Value 2,517.7$
Discount Rate 11.1%
Present Value 1,484.4$
Enterprise Value using Exit Multiple Method
Enterprise Value 1,822.9$
Terminal Year FCF 106.02$
WACC 11.1%
Perpetuity Growth Rate 2.0%
Implied Terminal Value 1,182.6$
Terminal Value Using Perpetuity Growth Rate
20. Cross Country Healthcare Discounted Cash Flows (Cont.)
20
Enterprise Value 403.5$
Less: Total Debt 63.0$
Plus: Cash 2.5$
Implied Equity Value 343.0$
Implied Share Price 10.5$
Terminal Present Value 336.1$
Enterprise Value 403.5$
% of Enterprise Value 83.3%
Terminal Value % of Enterprise Value
Implied Equity Value and Share Price
2020E EBITDA 58.7$
Exit Multiple 9.0x
Terminal Value 528.0$
Discount Rate 9.5%
Present Value 336.1$
Enterprise Value 403.5$
Terminal Value Using Exit Multiple Method
Enterprise Value using Exit Multiple Method
Terminal Year FCF 20.3$
WACC 9.5%
Impied Terminal Value 277.9$
Perpetuity Growth Rate 2.0%
Implied Perpetuity Growth Rate
21. Cross Country Healthcare Comparable Companies
Company Name Ticker Share Price Market Cap
Enterprise
Value LTM 2016E LTM 2016E LTM 2016E LTM 2016E
Team Health Holdings TMH $41.60 $3,060.00 $5,350.00 1.49x 1.15x 14.77x 10.65x 37.13x 14.45x $1.12 $2.87
Lifepoint Hospitals LPNT $68.78 $2,970.00 $5,420.00 1.00x 0.86x 8.10x 7.11x 17.42x 15.53x $3.95 $3.76
Robert Half International Inc. RHI $44.23 $5,860.00 $5,510.00 1.08x 1.14x 8.69x 8.33x 16.88x 15.29x $2.69 $3.00
On Assignment, Inc ASGN $35.98 $1,910.00 $2,580.00 1.25x 1.12x 12.94x 9.09x 19.53x 10.60x $1.85 $3.09
Cross Country Healthcare CCRN $11.23 $366.21 $394.99 0.52x 0.57x 20.87x 21.36x 36.09 18.32x -$0.31 $0.64
Mean $2,833.24 $3,851.00 1.07x 0.93x 13.07x 11.31x 25.41x 14.84x $1.86 $2.67
Median $2,970.00 $5,350.00 1.08x 1.00x 12.94x 9.09x 19.53x 15.29x $1.85 $3.00
High $5,860.00 $5,510.00 1.49x 1.15x 20.87x 21.36x 37.13x 18.32x $3.95 $3.76
Low $366.21 $394.99 0.52x 0.57x 8.10x 7.11x 16.88x 10.60x -$0.31 $0.64
EV/Revenue EV/EBITDA P/E EPS
21
26. 26
Valuation Breakdown – AMN Healthcare
($in millions)
Thetargetstrategicacquirervaluationof
AMNHealthcare is$1822.9 mil.which
hasanimpliedEV/EBITDA of 10.2x.
Stock Price
EV/EBITDA
Revenues (millions)
P/E
Market Cap (millions)
Enterprise Value (millions)
Leverage Ratio
$33.61
21.36x
$1,785
13.52x
$1,560
$1,740
3.4x
VALUATION METRICS
27. Term Sheet
27
Pro Forma Capital Structure
AHS CCRN Adjustments Pro Forma
Cash and cash equivalents $ 9.60 $ 2.50 $ 12.10
Existing Revolver $ 82.50 $ 85.00 $ 75.00 $ 242.50
Term Loan A $ 136.90 $ 125.00 $ 261.90
Incremental Term Loan A $ 75.00 $ - $ 75.00
Term Loan B $ - $ 280.00 $ 280.00
Total Debt $ 294.40 $ 85.00 $ 480.00 $ 859.40
Credit Statistics
EBITDA $ 178.49 $ 37.43 $ 215.92
Total Debt/EBITDA 1.6x 2.3x 4.0x
Net Debt/EBITDA 1.6x 2.2x 3.9x
Maturity
Purpose:
Security:
Existing Revolver espansion:
Term
Amortization
Term Loan A accordion
Term
Amortizatioin
Term Loan B
Term
Amortization
Total Interest
4.90%
$559.86
*($ millions)
6.00%
$125.00
5 years
6.00%
$280.00
5 years
Proceeds used to complete the strategic
acquisition of Cross Country Healthcare
$480.0 million financing capital structure
4/1/2021
secured by all assets
$75.00
5 years
28. Why Silverman Sachs
Previous
Success
• 95% deal success rate
Quality
• Small deal team size contributes to a
high level of quality and team synergy
Specialties
• Healthcare industry experts
• Specialize in mergers & acquisitions
28