SlideShare a Scribd company logo
Copyright © 2015 by A.M. Best Company, Inc. ALL RIGHTS RESERVED. No part of this report or document may be distributed
in any electronic form or by any means, or stored in a database or retrieval system, without the prior written permission of the A.M. Best
Company. For additional details, refer to our Terms of Use available at the A.M. Best Company website: www.ambest.com/terms.
U.S. Property/Casualty & Life/Health
Surplus Notes Overview
As of year-end 2014, there were 526 insurance carriers that held over 1,200 outstanding surplus
notes totaling $47.8 billion. In terms of the total insurance industry, the life/annuity (L/A)
segment had the largest holding of surplus notes at $29.0 billion, accounting for 7.9% of the
industry’s total capital and surplus, excluding the asset valuation reserve (AVR). The property/
casualty (P/C)
segment had $14.9
billion in total surplus
notes outstanding,
accounting for
2.1%, while the
health segment
had the smallest
dollar amount of
total surplus notes
outstanding at $3.9
billion, or 2.6% of the
industry’s total capital
and surplus. For those
companies with outstanding surplus notes, the
average percentage of surplus notes to total
capital and surplus was 21.6% for P/C, 13.6%
for L/A, and 63.4% for health (Exhibit 1).
It is important to note that 31% of all
outstanding notes in our population had a
perpetual maturity date. Excluding perpetuals,
the average maturity for outstanding notes was
12.4 years for health companies, 23.1 years
for life companies,
and 21.4 years for P/C
companies (Exhibit
2). Since 2000,
approximately 1,000
notes totaling roughly
$38.7 billion have
been issued. In 2014,
the volume of notes
issued reached a peak
of 160 notes totaling
$5.7 billion (Exhibit
3). Since 2008, the
number of surplus
notes issued per year
has more than doubled,
averaging 97 new
issuances a year. From
2000 to 2008, surplus
Life sector
leads in
surplus note
balances.
Issue Review
November 11, 2015
Analytical Contact
Jason Hopper
+1 (908) 439-2200 Ext.5016
Jason.Hopper@ambest.com
Contributor
Ken Felsher
SR-2015-709
BEST’S SPECIAL REPORTOur Insight, Your Advantage.
Exhibit 1
Surplus Notes by Segment (2014)
P/C L/A Health
Total
Industry
Number of Companies 310 106 110 526
Total Surplus Notes ($ billions) 14.9 29.0 3.9 47.8
Total Capital and Surplus ($ billions) 705.4 365.8 151.2 1,222.4
Percentage of Total Capital (Total Industry) 2.1% 7.9% 2.6% 3.9%
Percentage of Total Capital
(Average - Companies w/ outstanding surplus notes) 21.6% 13.6% 63.4% 16.6%
Source: A.M. Best data and research
Exhibit 2
Average Maturity by Segment
Segment Average Maturity
Health 12.4
Life 23.1
P&C 21.4
Total Industry 20.1
Source: A.M. Best data and research
Exhibit 3
Surplus Notes Outstanding by Issue Date
Source: A.M. Best data and research
12
24 28
57
62
56 56
34
65
81
93
59
87
136
160
0
20
40
60
80
100
120
140
160
180
0
1
2
3
4
5
6
7
8
2000
2001
2002
2003
2004
2005
2006
2007
2008
2009
2010
2011
2012
2013
2014
#ofIssuances
 Number of Issuances Total Per Year (Billions)
TotalSurplusNotes($billions)
2
Special Report	 U.S. Property/Casualty & Life/Health
note issuance fluctuated, with an
average of 41 notes per year. In
2014, each sector reached a peak
in terms of number of issuances,
with P/C companies issuing 58
notes, L/A companies issuing
22 notes, and health companies
issuing 80 notes. The health
segment saw the most dramatic
increase since 2011 following
relatively constant issuance in
earlier years and a significant dip
in issuances in 2011 (Exhibit 4).
In terms of total dollar amounts
per year, L/A companies led
the way as expected. After the
sharp increase in 2009, there
was a steady decline in the
amount of surplus notes issued
in this segment, declining to a
low of $168.9 million in 2011
and remaining relatively flat
at just over $1 billion for the
subsequent two years (Exhibit
5). In 2014, another significant
increase was seen as totals for
L/A companies rose to $3.4
billion for the year. However,
this was attributable to $2 billion
of surplus notes issued by one
company, Teachers Insurance
and Annuity Association. In
2014, the P/C segment issued
$1.4 billion in notes, which is
the third largest total on record
for one year. Prior to 2008,
health companies did not issue
surplus notes in large quantities,
averaging only five notes a year.
However, starting in 2008,
there were substantial increases
averaging 35 issuances a year. In
2014, there was a new peak of
80 notes issued, totaling $954.4
million, which is the highest
total on record. (Exhibit 6) In
terms of the total dollar amounts
issued for the last 15 years, the
L/A segment comprised 57.9%,
while P/C accounted for 33.3%
and health, 8.7%.
Exhibit 4
Number of Issuances Per Year
Exhibit 5
Surplus Note Totals
Exhibit 6
Health Segment: Surplus Notes Outstanding by Issue Date
Source: A.M. Best data and research
 Number of Issuances Total Per Year (Billions)
 # of Issuances Total Surplus Notes (Millions)
0
10
20
30
40
50
60
70
80
90
2000
2001
2002
2003
2004
2005
2006
2007
2008
2009
2010
2011
2012
2013
2014
P/C L/A Health
0
1,000
2,000
3,000
4,000
5,000
6,000
2000
2001
2002
2003
2004
2005
2006
2007
2008
2009
2010
2011
2012
2013
2014
 P/C  L/A  Health
1
4 3 5 4 4
10 7
15 17
24
9
35
67
80
0
10
20
30
40
50
60
70
80
90
0
200
400
600
800
1,000
1,200
2000
2001
2002
2003
2004
2005
2006
2007
2008
2009
2010
2011
2012
2013
2014
#ofIssuances
($millions)TotalSurplusNotes($millions)
Exhibit 4
Number of Issuances Per Year
Exhibit 5
Surplus Note Totals
Exhibit 6
Health Segment: Surplus Notes Outstanding by Issue Date
Source: A.M. Best data and research
 # of Issuances Total Surplus Notes (Millions)
0
10
20
30
40
50
60
70
80
90
2000
2001
2002
2003
2004
2005
2006
2007
2008
2009
2010
2011
2012
2013
2014
P/C L/A Health
0
1,000
2,000
3,000
4,000
5,000
6,000
2000
2001
2002
2003
2004
2005
2006
2007
2008
2009
2010
2011
2012
2013
2014
 P/C  L/A  Health
1
4 3 5 4 4
10 7
15 17
24
9
35
67
80
0
10
20
30
40
50
60
70
80
90
0
200
400
600
800
1,000
1,200
2000
2001
2002
2003
2004
2005
2006
2007
2008
2009
2010
2011
2012
2013
2014
#ofIssuances
($millions)TotalSurplusNotes($millions)
3
Special Report	 U.S. Property/Casualty & Life/Health
In terms of issuance to affiliates,
the insurance industry as a whole
has issued 61.4% of all surplus
notes to an affiliate or parent.
An analysis by segment shows
that 71.1% of health surplus
notes outstanding are held by an
affiliated company, compared to
52.6% within the L/A segment
and 60.5% in the P/C segment
(Exhibit 7).
The average coupon rate for
surplus notes held by affiliated
entities was lower for P/C and
L/A companies. For the P/C
segment, the average coupon
rate was 82 basis points lower for
affiliates at 4.79%, compared to
5.61% for non-affiliates (Exhibit
8). Similarly, for L/A companies,
the average coupon rate for
surplus notes held by an affiliate
was 5.56%, compared to 6.23%
for non-affiliates. However, for
health companies, the reverse
was seen, with the average
coupon rate for affiliates at 4.96%,
much higher than the 1.73% for
non-affiliates. This is mostly due
to the launch and operation of
Health Care Consumer Operated
and Oriented Plans (CO-OPs)
under the Patient Protection
and Affordable Care Act. This
law allowed the government
to finance the startup of these
companies at virtually no cost
to the insurers in order for them
to compete with the established
insurers. With such an easy
access to capital, the health
insurance exchanges as well as
outside companies offering these
plans have issued a large quantity
of surplus notes. Additionally,
2014 had the largest number of
floating rate surplus notes since
2006 based on our population.
Since 2011, the growth of
fixed rate surplus notes has
skyrocketed (Exhibit 9).
Exhibit 7
Surplus Notes Issued to Affiliates vs. Non-Affiliates
Exhibit 9
U.S Surplus Notes - Fixed vs. Floating
Source: A.M. Best data and research
 Affiliate  Non-Affiliate
 Affiliates Non-Affiliates
(%)
4.96
5.56
4.79
1.73
6.23
5.61
Health
L/A
P/C
0 1 2 3 4 5 6 7
0
20
40
60
80
100
120
140
2000
2001
2002
2003
2004
2005
2006
2007
2008
2009
2010
2011
2012
2013
2014
FloatingFixed
2
2
2
2
2
2
2
2
2
2
2
2
2
2
60.5
52.6
71.1
39.5
47.4
28.9
0
10
20
30
40
50
60
70
80
90
100
P/C L/A Health
Exhibit 8
Coupon Rate of Affiliates vs. Non-Affiliates
NumberofSurplusNotes(%)
Exhibit 7
Surplus Notes Issued to Affiliates vs. Non-Affiliates
Exhibit 9
U.S Surplus Notes - Fixed vs. Floating
Source: A.M. Best data and research
 Affiliate  Non-Affiliate
 Affiliates Non-Affiliates
(%)
4.96
5.56
4.79
1.73
6.23
5.61
Health
L/A
P/C
0 1 2 3 4 5 6 7
0
20
40
60
80
100
120
140
2000
2001
2002
2003
2004
2005
2006
2007
2008
2009
2010
2011
2012
2013
2014
FloatingFixed
200
20
200
200
200
200
200
200
200
200
201
201
201
201
201
60.5
52.6
71.1
39.5
47.4
28.9
0
10
20
30
40
50
60
70
80
90
100
P/C L/A Health
Exhibit 8
Coupon Rate of Affiliates vs. Non-Affiliates
NumberofSurplusNotes(%)
Exhibit 7
Surplus Notes Issued to Affiliates vs. Non-Affiliates
Exhibit 9
U.S Surplus Notes - Fixed vs. Floating
Source: A.M. Best data and research
 Affiliate  Non-Affiliate
 Affiliates Non-Affiliates
(%)
4.96
5.56
4.79
1.73
6.23
5.61
Health
L/A
P/C
0 1 2 3 4 5 6 7
0
20
40
60
80
100
120
140
2000
2001
2002
2003
2004
2005
2006
2007
2008
2009
2010
2011
2012
2013
2014
FloatingFixed
60.5
52.6
71.1
39.5
47.4
28.9
0
10
20
30
40
50
60
70
80
90
100
P/C L/A Health
Exhibit 8
Coupon Rate of Affiliates vs. Non-Affiliates
NumberofSurplusNotes(%)
Published by A.M. Best Company
Special Report
CHAIRMAN & PRESIDENT Arthur Snyder III
EXECUTIVE VICE PRESIDENT Larry G. Mayewski
EXECUTIVE VICE PRESIDENT Paul C. Tinnirello
SENIOR VICE PRESIDENTS Douglas A. Collett, Karen B. Heine,
Matthew C. Mosher, Rita L. Tedesco
A.M. BEST COMPANY
WORLD HEADQUARTERS
Ambest Road, Oldwick, NJ 08858
Phone: +1 (908) 439-2200
WASHINGTON OFFICE
830 National Press Building
529 14th Street N.W., Washington, DC 20045
Phone: +1 (202) 347-3090
A.M. BEST AMÉRICA LATINA, S.A. de C.V.
Paseo de la Reforma 412
Piso 23
Mexico City, Mexico
Phone: +52-55-5208-1264
A.M. BEST EUROPE RATING SERVICES LTD.
A.M. BEST EUROPE INFORMATION SERVICES LTD.
12 Arthur Street, 6th Floor, London, UK EC4R 9AB
Phone: +44 (0)20 7626-6264
A.M. BEST ASIA-PACIFIC LTD.
Unit 4004 Central Plaza, 18 Harbour Road, Wanchai, Hong Kong
Phone: +852 2827-3400
A.M. BEST ASIA-PACIFIC (SINGAPORE) PTE. LTD.
6 Battery Road, #40-02B, Singapore
Phone: +65 6589 8400
DUBAI OFFICE* (MENA, SOUTH & CENTRAL ASIA)
Office 102, Tower 2
Currency House, DIFC
PO Box 506617, Dubai, UAE
Phone: +971 43 752 780
*Regulated by the DFSA as a Representative Office
A Best’s Financial Strength Rating is an independent opinion of an insurer’s financial strength
and ability to meet its ongoing insurance policy and contract obligations. It is based on a com-
prehensive quantitative and qualitative evaluation of a company’s balance sheet strength, oper-
ating performance and business profile. The Financial Strength Rating opinion addresses the
relative ability of an insurer to meet its ongoing insurance policy and contract obligations. These
ratings are not a warranty of an insurer’s current or future ability to meet contractual obligations.
The rating is not assigned to specific insurance policies or contracts and does not address any
other risk, including, but not limited to, an insurer’s claims-payment policies or procedures; the
ability of the insurer to dispute or deny claims payment on grounds of misrepresentation or
fraud; or any specific liability contractually borne by the policy or contract holder. A Financial
Strength Rating is not a recommendation to purchase, hold or terminate any insurance policy,
contract or any other financial obligation issued by an insurer, nor does it address the suitability
of any particular policy or contract for a specific purpose or purchaser.
A Best’s Debt/Issuer Credit Rating is an opinion regarding the relative future credit risk of an
entity, a credit commitment or a debt or debt-like security. It is based on a comprehensive quantita-
tive and qualitative evaluation of a company’s balance sheet strength, operating performance and
business profile and, where appropriate, the specific nature and details of a rated debt security.
Credit risk is the risk that an entity may not meet its contractual, financial obligations as they come
due. These credit ratings do not address any other risk, including but not limited to liquidity risk,
market value risk or price volatility of rated securities. The rating is not a recommendation to buy,
sell or hold any securities, insurance policies, contracts or any other financial obligations, nor does it
address the suitability of any particular financial obligation for a specific purpose or purchaser.
Any and all ratings, opinions and information contained herein are provided “as is,” without
any expressed or implied warranty. A rating may be changed, suspended or withdrawn at any
time for any reason at the sole discretion of A.M. Best.
In arriving at a rating decision, A.M. Best relies on third-party audited financial data and/or
other information provided to it. While this information is believed to be reliable, A.M. Best
does not independently verify the accuracy or reliability of the information.
A.M. Best does not offer consulting or advisory services. A.M. Best is not an Investment
Adviser and does not offer investment advice of any kind, nor does the company or its Rating
Analysts offer any form of structuring or financial advice. A.M. Best does not sell securities.
A.M. Best is compensated for its interactive rating services. These rating fees can vary from
US$ 5,000 to US$ 500,000. In addition, A.M. Best may receive compensation from rated enti-
ties for non-rating related services or products offered.
Data sourced from the BestLink system is retrieved around the time of the report creation and
is subject to revision.
A.M. Best’s Special Reports and any associated spreadsheet data are available, free of
charge, to all Best’s Insurance News & Analysis subscribers. Nonsubscribers can purchase
the full report and spreadsheet data. Special Reports are available through our Web site at
www.ambest.com/research or by calling Customer Service at (908) 439-2200, ext. 5742.
Briefings and some Special Reports are offered to the general public at no cost.
For press inquiries or to contact the authors, please contact James Peavy at (908) 439-2200,
ext. 5644.
4
Special Report	 U.S. Property/Casualty & Life/Health
Over the past 15 years, insurance companies have been able to effectively utilize surplus notes
as opportunistic sources of capital. In the last five years, the launch and operation of CO-OPs
has significantly changed the landscape of surplus note issuance not only in the health sector,
but in the insurance industry as a whole. Easier access and better terms on surplus notes has
made it more efficient for health companies to raise capital.
The significant spike in the dollar amount of outstanding notes in 2009 can be attributed to
the effects of the financial crisis and driven by two main forces. First, the capital issuance was
needed to fund additional growth that was not able to be supported by existing capital. The
new surplus note issuances were somewhat concentrated in insurers specializing in annuities,
who reported declining profitability due to their exposure to equity markets through variable
annuity products. This inflow of new capital allowed L/A insurers to maintain capitalization
levels in line with their historical levels despite reporting declining profitability or operating
losses. The second driving force of increased usage of surplus notes stems from the need to
replace capital that had been depleted by losses from existing business and/or investment
portfolios. While it can be said that the economy has been steadily recovering, the continued
low interest rate environment allows surplus notes to remain an attractive option for insurers
to maintain strong risk-adjusted capital.

More Related Content

What's hot

Dragon Fund_Sector Update
Dragon Fund_Sector UpdateDragon Fund_Sector Update
Dragon Fund_Sector Update
Sara Golshahr
 
2015 BioTech Briefing Report
2015 BioTech Briefing Report2015 BioTech Briefing Report
2015 BioTech Briefing Report
Ryan Starkes
 
Investor presentation may 2012
Investor presentation may 2012Investor presentation may 2012
Investor presentation may 2012
Intact
 

What's hot (17)

The Thawing of the Credit Markets
The Thawing of the Credit MarketsThe Thawing of the Credit Markets
The Thawing of the Credit Markets
 
A Summary of the US Economy through Corporate Finance
A Summary of the US Economy through Corporate FinanceA Summary of the US Economy through Corporate Finance
A Summary of the US Economy through Corporate Finance
 
Hoffman
HoffmanHoffman
Hoffman
 
HCUK-mid-year-review
HCUK-mid-year-reviewHCUK-mid-year-review
HCUK-mid-year-review
 
Miami University 2016 Harvard Financial Analyst Symposium Competition Finalist
Miami University 2016 Harvard Financial Analyst Symposium Competition FinalistMiami University 2016 Harvard Financial Analyst Symposium Competition Finalist
Miami University 2016 Harvard Financial Analyst Symposium Competition Finalist
 
Managed Care Sector Insights – Summer 2018
Managed Care Sector Insights – Summer 2018Managed Care Sector Insights – Summer 2018
Managed Care Sector Insights – Summer 2018
 
Quarterly note
Quarterly noteQuarterly note
Quarterly note
 
Mercer Capital's Value Focus: Insurance Industry | Q4 2015
Mercer Capital's Value Focus: Insurance Industry | Q4 2015 Mercer Capital's Value Focus: Insurance Industry | Q4 2015
Mercer Capital's Value Focus: Insurance Industry | Q4 2015
 
6th Annual Brunswick Group M&A Survey
6th Annual Brunswick Group M&A Survey6th Annual Brunswick Group M&A Survey
6th Annual Brunswick Group M&A Survey
 
Dragon Fund_Sector Update
Dragon Fund_Sector UpdateDragon Fund_Sector Update
Dragon Fund_Sector Update
 
Miami University 2016 Cleveland Research Company Stock Pitch Competition Winner
Miami University 2016 Cleveland Research Company Stock Pitch Competition WinnerMiami University 2016 Cleveland Research Company Stock Pitch Competition Winner
Miami University 2016 Cleveland Research Company Stock Pitch Competition Winner
 
2015 BioTech Briefing Report
2015 BioTech Briefing Report2015 BioTech Briefing Report
2015 BioTech Briefing Report
 
Mercer Capital's Value Focus: Auto Dealer Industry | Year-End 2018
Mercer Capital's Value Focus: Auto Dealer Industry | Year-End 2018Mercer Capital's Value Focus: Auto Dealer Industry | Year-End 2018
Mercer Capital's Value Focus: Auto Dealer Industry | Year-End 2018
 
Thor Citi Investor Meetings
Thor Citi Investor MeetingsThor Citi Investor Meetings
Thor Citi Investor Meetings
 
Mercer Capital's Value Focus: Transportation & Logistics | Q3 2021 | Feature...
Mercer Capital's Value Focus: Transportation & Logistics  | Q3 2021 | Feature...Mercer Capital's Value Focus: Transportation & Logistics  | Q3 2021 | Feature...
Mercer Capital's Value Focus: Transportation & Logistics | Q3 2021 | Feature...
 
Aksigorta cc presentation_2017_june_v2
Aksigorta cc presentation_2017_june_v2Aksigorta cc presentation_2017_june_v2
Aksigorta cc presentation_2017_june_v2
 
Investor presentation may 2012
Investor presentation may 2012Investor presentation may 2012
Investor presentation may 2012
 

Viewers also liked (17)

ClientConnection2015-03
ClientConnection2015-03ClientConnection2015-03
ClientConnection2015-03
 
CONTABILIDAD
CONTABILIDADCONTABILIDAD
CONTABILIDAD
 
ClientConnection2015-08
ClientConnection2015-08ClientConnection2015-08
ClientConnection2015-08
 
Awarded travalarm app
Awarded travalarm appAwarded travalarm app
Awarded travalarm app
 
Business presentation copy
Business presentation   copyBusiness presentation   copy
Business presentation copy
 
ClientConnection2014-12
ClientConnection2014-12ClientConnection2014-12
ClientConnection2014-12
 
ClientConnection2015-06
ClientConnection2015-06ClientConnection2015-06
ClientConnection2015-06
 
Planning production
Planning productionPlanning production
Planning production
 
Meet Me!
Meet Me!Meet Me!
Meet Me!
 
The Arts + Healthcare Initiative
The Arts + Healthcare InitiativeThe Arts + Healthcare Initiative
The Arts + Healthcare Initiative
 
Resume
ResumeResume
Resume
 
ali_safe
ali_safeali_safe
ali_safe
 
ClientConnection2016-05
ClientConnection2016-05ClientConnection2016-05
ClientConnection2016-05
 
App store
App storeApp store
App store
 
Makalah Peran Wanita
Makalah Peran Wanita Makalah Peran Wanita
Makalah Peran Wanita
 
Analisis dan rancangan basis data terpusat
Analisis dan rancangan basis data terpusatAnalisis dan rancangan basis data terpusat
Analisis dan rancangan basis data terpusat
 
Client Connection 2016-11
Client Connection 2016-11Client Connection 2016-11
Client Connection 2016-11
 

Similar to Surplus Note report - A.M. Best

2016-us-goodwill-impairment-study
2016-us-goodwill-impairment-study2016-us-goodwill-impairment-study
2016-us-goodwill-impairment-study
Dave Wright
 
Mutual Fund Analysis
Mutual Fund AnalysisMutual Fund Analysis
Mutual Fund Analysis
William Namen
 
Running Head FINANCIAL ANALYSIS1FINANCIAL ANALYSIS7.docx
Running Head FINANCIAL ANALYSIS1FINANCIAL ANALYSIS7.docxRunning Head FINANCIAL ANALYSIS1FINANCIAL ANALYSIS7.docx
Running Head FINANCIAL ANALYSIS1FINANCIAL ANALYSIS7.docx
charisellington63520
 
TenetQ106PreparedRemarks
TenetQ106PreparedRemarksTenetQ106PreparedRemarks
TenetQ106PreparedRemarks
finance42
 
quest diagnostics Q308_Transcript
quest diagnostics Q308_Transcriptquest diagnostics Q308_Transcript
quest diagnostics Q308_Transcript
finance34
 
3© HAP, 2014. Reproduction without permission is prohibite.docx
3© HAP, 2014. Reproduction without permission is prohibite.docx3© HAP, 2014. Reproduction without permission is prohibite.docx
3© HAP, 2014. Reproduction without permission is prohibite.docx
tamicawaysmith
 
Emerging Accounting Markets
Emerging Accounting MarketsEmerging Accounting Markets
Emerging Accounting Markets
Jeremy Edwards
 
EY-beyond-borders-2015
EY-beyond-borders-2015EY-beyond-borders-2015
EY-beyond-borders-2015
Ray Minehan
 
OW_EN_HLS_PUBL_2011_Beyond_the_Shadow_of_a_Drought(3)
OW_EN_HLS_PUBL_2011_Beyond_the_Shadow_of_a_Drought(3)OW_EN_HLS_PUBL_2011_Beyond_the_Shadow_of_a_Drought(3)
OW_EN_HLS_PUBL_2011_Beyond_the_Shadow_of_a_Drought(3)
J. David Campbell
 

Similar to Surplus Note report - A.M. Best (20)

Mercer Capital's Value Focus: Medical Device Manufacturers | Q4 2015 | Five T...
Mercer Capital's Value Focus: Medical Device Manufacturers | Q4 2015 | Five T...Mercer Capital's Value Focus: Medical Device Manufacturers | Q4 2015 | Five T...
Mercer Capital's Value Focus: Medical Device Manufacturers | Q4 2015 | Five T...
 
2016-us-goodwill-impairment-study
2016-us-goodwill-impairment-study2016-us-goodwill-impairment-study
2016-us-goodwill-impairment-study
 
Duff Phelps Valuation Insights Q1 2017
Duff Phelps Valuation Insights Q1 2017Duff Phelps Valuation Insights Q1 2017
Duff Phelps Valuation Insights Q1 2017
 
Hospital Financial Analysis
Hospital Financial AnalysisHospital Financial Analysis
Hospital Financial Analysis
 
Mutual Fund Analysis
Mutual Fund AnalysisMutual Fund Analysis
Mutual Fund Analysis
 
ABT2016-4
ABT2016-4ABT2016-4
ABT2016-4
 
Fresenius Allocation - Report
Fresenius Allocation - ReportFresenius Allocation - Report
Fresenius Allocation - Report
 
Running Head FINANCIAL ANALYSIS1FINANCIAL ANALYSIS7.docx
Running Head FINANCIAL ANALYSIS1FINANCIAL ANALYSIS7.docxRunning Head FINANCIAL ANALYSIS1FINANCIAL ANALYSIS7.docx
Running Head FINANCIAL ANALYSIS1FINANCIAL ANALYSIS7.docx
 
Comprehensive Congressional Hlt Reform Bills 2009 Figures
Comprehensive Congressional Hlt Reform Bills 2009 FiguresComprehensive Congressional Hlt Reform Bills 2009 Figures
Comprehensive Congressional Hlt Reform Bills 2009 Figures
 
TenetQ106PreparedRemarks
TenetQ106PreparedRemarksTenetQ106PreparedRemarks
TenetQ106PreparedRemarks
 
World insurancereport 2015
World insurancereport 2015World insurancereport 2015
World insurancereport 2015
 
World Insurance Report 2015 from Capgemini and Efma
World Insurance Report 2015 from Capgemini and EfmaWorld Insurance Report 2015 from Capgemini and Efma
World Insurance Report 2015 from Capgemini and Efma
 
quest diagnostics Q308_Transcript
quest diagnostics Q308_Transcriptquest diagnostics Q308_Transcript
quest diagnostics Q308_Transcript
 
3© HAP, 2014. Reproduction without permission is prohibite.docx
3© HAP, 2014. Reproduction without permission is prohibite.docx3© HAP, 2014. Reproduction without permission is prohibite.docx
3© HAP, 2014. Reproduction without permission is prohibite.docx
 
Mercer Capital's Value Focus: Laboratory Services | Mid-Year 2015
Mercer Capital's Value Focus: Laboratory Services | Mid-Year 2015Mercer Capital's Value Focus: Laboratory Services | Mid-Year 2015
Mercer Capital's Value Focus: Laboratory Services | Mid-Year 2015
 
Trends in Healthcare Investments and Exits Report
Trends in Healthcare Investments and Exits ReportTrends in Healthcare Investments and Exits Report
Trends in Healthcare Investments and Exits Report
 
Emerging Accounting Markets
Emerging Accounting MarketsEmerging Accounting Markets
Emerging Accounting Markets
 
Ace Limited Investor Presentation - December 2014
Ace Limited Investor Presentation - December 2014Ace Limited Investor Presentation - December 2014
Ace Limited Investor Presentation - December 2014
 
EY-beyond-borders-2015
EY-beyond-borders-2015EY-beyond-borders-2015
EY-beyond-borders-2015
 
OW_EN_HLS_PUBL_2011_Beyond_the_Shadow_of_a_Drought(3)
OW_EN_HLS_PUBL_2011_Beyond_the_Shadow_of_a_Drought(3)OW_EN_HLS_PUBL_2011_Beyond_the_Shadow_of_a_Drought(3)
OW_EN_HLS_PUBL_2011_Beyond_the_Shadow_of_a_Drought(3)
 

Surplus Note report - A.M. Best

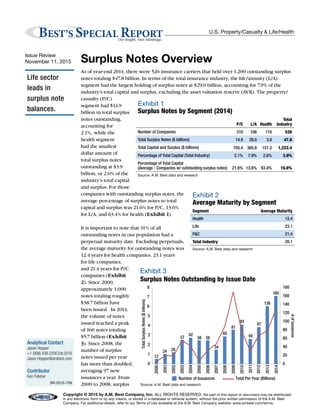
  • 1. Copyright © 2015 by A.M. Best Company, Inc. ALL RIGHTS RESERVED. No part of this report or document may be distributed in any electronic form or by any means, or stored in a database or retrieval system, without the prior written permission of the A.M. Best Company. For additional details, refer to our Terms of Use available at the A.M. Best Company website: www.ambest.com/terms. U.S. Property/Casualty & Life/Health Surplus Notes Overview As of year-end 2014, there were 526 insurance carriers that held over 1,200 outstanding surplus notes totaling $47.8 billion. In terms of the total insurance industry, the life/annuity (L/A) segment had the largest holding of surplus notes at $29.0 billion, accounting for 7.9% of the industry’s total capital and surplus, excluding the asset valuation reserve (AVR). The property/ casualty (P/C) segment had $14.9 billion in total surplus notes outstanding, accounting for 2.1%, while the health segment had the smallest dollar amount of total surplus notes outstanding at $3.9 billion, or 2.6% of the industry’s total capital and surplus. For those companies with outstanding surplus notes, the average percentage of surplus notes to total capital and surplus was 21.6% for P/C, 13.6% for L/A, and 63.4% for health (Exhibit 1). It is important to note that 31% of all outstanding notes in our population had a perpetual maturity date. Excluding perpetuals, the average maturity for outstanding notes was 12.4 years for health companies, 23.1 years for life companies, and 21.4 years for P/C companies (Exhibit 2). Since 2000, approximately 1,000 notes totaling roughly $38.7 billion have been issued. In 2014, the volume of notes issued reached a peak of 160 notes totaling $5.7 billion (Exhibit 3). Since 2008, the number of surplus notes issued per year has more than doubled, averaging 97 new issuances a year. From 2000 to 2008, surplus Life sector leads in surplus note balances. Issue Review November 11, 2015 Analytical Contact Jason Hopper +1 (908) 439-2200 Ext.5016 Jason.Hopper@ambest.com Contributor Ken Felsher SR-2015-709 BEST’S SPECIAL REPORTOur Insight, Your Advantage. Exhibit 1 Surplus Notes by Segment (2014) P/C L/A Health Total Industry Number of Companies 310 106 110 526 Total Surplus Notes ($ billions) 14.9 29.0 3.9 47.8 Total Capital and Surplus ($ billions) 705.4 365.8 151.2 1,222.4 Percentage of Total Capital (Total Industry) 2.1% 7.9% 2.6% 3.9% Percentage of Total Capital (Average - Companies w/ outstanding surplus notes) 21.6% 13.6% 63.4% 16.6% Source: A.M. Best data and research Exhibit 2 Average Maturity by Segment Segment Average Maturity Health 12.4 Life 23.1 P&C 21.4 Total Industry 20.1 Source: A.M. Best data and research Exhibit 3 Surplus Notes Outstanding by Issue Date Source: A.M. Best data and research 12 24 28 57 62 56 56 34 65 81 93 59 87 136 160 0 20 40 60 80 100 120 140 160 180 0 1 2 3 4 5 6 7 8 2000 2001 2002 2003 2004 2005 2006 2007 2008 2009 2010 2011 2012 2013 2014 #ofIssuances  Number of Issuances Total Per Year (Billions) TotalSurplusNotes($billions)
  • 2. 2 Special Report U.S. Property/Casualty & Life/Health note issuance fluctuated, with an average of 41 notes per year. In 2014, each sector reached a peak in terms of number of issuances, with P/C companies issuing 58 notes, L/A companies issuing 22 notes, and health companies issuing 80 notes. The health segment saw the most dramatic increase since 2011 following relatively constant issuance in earlier years and a significant dip in issuances in 2011 (Exhibit 4). In terms of total dollar amounts per year, L/A companies led the way as expected. After the sharp increase in 2009, there was a steady decline in the amount of surplus notes issued in this segment, declining to a low of $168.9 million in 2011 and remaining relatively flat at just over $1 billion for the subsequent two years (Exhibit 5). In 2014, another significant increase was seen as totals for L/A companies rose to $3.4 billion for the year. However, this was attributable to $2 billion of surplus notes issued by one company, Teachers Insurance and Annuity Association. In 2014, the P/C segment issued $1.4 billion in notes, which is the third largest total on record for one year. Prior to 2008, health companies did not issue surplus notes in large quantities, averaging only five notes a year. However, starting in 2008, there were substantial increases averaging 35 issuances a year. In 2014, there was a new peak of 80 notes issued, totaling $954.4 million, which is the highest total on record. (Exhibit 6) In terms of the total dollar amounts issued for the last 15 years, the L/A segment comprised 57.9%, while P/C accounted for 33.3% and health, 8.7%. Exhibit 4 Number of Issuances Per Year Exhibit 5 Surplus Note Totals Exhibit 6 Health Segment: Surplus Notes Outstanding by Issue Date Source: A.M. Best data and research Source: A.M. Best data and research Source: A.M. Best data and research Source: A.M. Best data and research  Number of Issuances Total Per Year (Billions)  # of Issuances Total Surplus Notes (Millions) 0 10 20 30 40 50 60 70 80 90 2000 2001 2002 2003 2004 2005 2006 2007 2008 2009 2010 2011 2012 2013 2014 P/C L/A Health 0 1,000 2,000 3,000 4,000 5,000 6,000 2000 2001 2002 2003 2004 2005 2006 2007 2008 2009 2010 2011 2012 2013 2014  P/C  L/A  Health 1 4 3 5 4 4 10 7 15 17 24 9 35 67 80 0 10 20 30 40 50 60 70 80 90 0 200 400 600 800 1,000 1,200 2000 2001 2002 2003 2004 2005 2006 2007 2008 2009 2010 2011 2012 2013 2014 #ofIssuances ($millions)TotalSurplusNotes($millions) Exhibit 4 Number of Issuances Per Year Exhibit 5 Surplus Note Totals Exhibit 6 Health Segment: Surplus Notes Outstanding by Issue Date Source: A.M. Best data and research Source: A.M. Best data and research Source: A.M. Best data and research Source: A.M. Best data and research  # of Issuances Total Surplus Notes (Millions) 0 10 20 30 40 50 60 70 80 90 2000 2001 2002 2003 2004 2005 2006 2007 2008 2009 2010 2011 2012 2013 2014 P/C L/A Health 0 1,000 2,000 3,000 4,000 5,000 6,000 2000 2001 2002 2003 2004 2005 2006 2007 2008 2009 2010 2011 2012 2013 2014  P/C  L/A  Health 1 4 3 5 4 4 10 7 15 17 24 9 35 67 80 0 10 20 30 40 50 60 70 80 90 0 200 400 600 800 1,000 1,200 2000 2001 2002 2003 2004 2005 2006 2007 2008 2009 2010 2011 2012 2013 2014 #ofIssuances ($millions)TotalSurplusNotes($millions) Exhibit 4 Number of Issuances Per Year Exhibit 5 Surplus Note Totals Exhibit 6 Health Segment: Surplus Notes Outstanding by Issue Date Source: A.M. Best data and research Source: A.M. Best data and research Source: A.M. Best data and research Source: A.M. Best data and research  # of Issuances Total Surplus Notes (Millions) 0 10 20 30 40 50 60 70 80 90 2000 2001 2002 2003 2004 2005 2006 2007 2008 2009 2010 2011 2012 2013 2014 P/C L/A Health 0 1,000 2,000 3,000 4,000 5,000 6,000 2000 2001 2002 2003 2004 2005 2006 2007 2008 2009 2010 2011 2012 2013 2014  P/C  L/A  Health 1 4 3 5 4 4 10 7 15 17 24 9 35 67 80 0 10 20 30 40 50 60 70 80 90 0 200 400 600 800 1,000 1,200 2000 2001 2002 2003 2004 2005 2006 2007 2008 2009 2010 2011 2012 2013 2014 #ofIssuances ($millions)TotalSurplusNotes($millions)
  • 3. 3 Special Report U.S. Property/Casualty & Life/Health In terms of issuance to affiliates, the insurance industry as a whole has issued 61.4% of all surplus notes to an affiliate or parent. An analysis by segment shows that 71.1% of health surplus notes outstanding are held by an affiliated company, compared to 52.6% within the L/A segment and 60.5% in the P/C segment (Exhibit 7). The average coupon rate for surplus notes held by affiliated entities was lower for P/C and L/A companies. For the P/C segment, the average coupon rate was 82 basis points lower for affiliates at 4.79%, compared to 5.61% for non-affiliates (Exhibit 8). Similarly, for L/A companies, the average coupon rate for surplus notes held by an affiliate was 5.56%, compared to 6.23% for non-affiliates. However, for health companies, the reverse was seen, with the average coupon rate for affiliates at 4.96%, much higher than the 1.73% for non-affiliates. This is mostly due to the launch and operation of Health Care Consumer Operated and Oriented Plans (CO-OPs) under the Patient Protection and Affordable Care Act. This law allowed the government to finance the startup of these companies at virtually no cost to the insurers in order for them to compete with the established insurers. With such an easy access to capital, the health insurance exchanges as well as outside companies offering these plans have issued a large quantity of surplus notes. Additionally, 2014 had the largest number of floating rate surplus notes since 2006 based on our population. Since 2011, the growth of fixed rate surplus notes has skyrocketed (Exhibit 9). Exhibit 7 Surplus Notes Issued to Affiliates vs. Non-Affiliates Exhibit 9 U.S Surplus Notes - Fixed vs. Floating Source: A.M. Best data and research Source: A.M. Best data and research Source: A.M. Best data and research Source: A.M. Best data and research  Affiliate  Non-Affiliate  Affiliates Non-Affiliates (%) 4.96 5.56 4.79 1.73 6.23 5.61 Health L/A P/C 0 1 2 3 4 5 6 7 0 20 40 60 80 100 120 140 2000 2001 2002 2003 2004 2005 2006 2007 2008 2009 2010 2011 2012 2013 2014 FloatingFixed 2 2 2 2 2 2 2 2 2 2 2 2 2 2 60.5 52.6 71.1 39.5 47.4 28.9 0 10 20 30 40 50 60 70 80 90 100 P/C L/A Health Exhibit 8 Coupon Rate of Affiliates vs. Non-Affiliates NumberofSurplusNotes(%) Exhibit 7 Surplus Notes Issued to Affiliates vs. Non-Affiliates Exhibit 9 U.S Surplus Notes - Fixed vs. Floating Source: A.M. Best data and research Source: A.M. Best data and research Source: A.M. Best data and research Source: A.M. Best data and research  Affiliate  Non-Affiliate  Affiliates Non-Affiliates (%) 4.96 5.56 4.79 1.73 6.23 5.61 Health L/A P/C 0 1 2 3 4 5 6 7 0 20 40 60 80 100 120 140 2000 2001 2002 2003 2004 2005 2006 2007 2008 2009 2010 2011 2012 2013 2014 FloatingFixed 200 20 200 200 200 200 200 200 200 200 201 201 201 201 201 60.5 52.6 71.1 39.5 47.4 28.9 0 10 20 30 40 50 60 70 80 90 100 P/C L/A Health Exhibit 8 Coupon Rate of Affiliates vs. Non-Affiliates NumberofSurplusNotes(%) Exhibit 7 Surplus Notes Issued to Affiliates vs. Non-Affiliates Exhibit 9 U.S Surplus Notes - Fixed vs. Floating Source: A.M. Best data and research Source: A.M. Best data and research Source: A.M. Best data and research Source: A.M. Best data and research  Affiliate  Non-Affiliate  Affiliates Non-Affiliates (%) 4.96 5.56 4.79 1.73 6.23 5.61 Health L/A P/C 0 1 2 3 4 5 6 7 0 20 40 60 80 100 120 140 2000 2001 2002 2003 2004 2005 2006 2007 2008 2009 2010 2011 2012 2013 2014 FloatingFixed 60.5 52.6 71.1 39.5 47.4 28.9 0 10 20 30 40 50 60 70 80 90 100 P/C L/A Health Exhibit 8 Coupon Rate of Affiliates vs. Non-Affiliates NumberofSurplusNotes(%)
  • 4. Published by A.M. Best Company Special Report CHAIRMAN & PRESIDENT Arthur Snyder III EXECUTIVE VICE PRESIDENT Larry G. Mayewski EXECUTIVE VICE PRESIDENT Paul C. Tinnirello SENIOR VICE PRESIDENTS Douglas A. Collett, Karen B. Heine, Matthew C. Mosher, Rita L. Tedesco A.M. BEST COMPANY WORLD HEADQUARTERS Ambest Road, Oldwick, NJ 08858 Phone: +1 (908) 439-2200 WASHINGTON OFFICE 830 National Press Building 529 14th Street N.W., Washington, DC 20045 Phone: +1 (202) 347-3090 A.M. BEST AMÉRICA LATINA, S.A. de C.V. Paseo de la Reforma 412 Piso 23 Mexico City, Mexico Phone: +52-55-5208-1264 A.M. BEST EUROPE RATING SERVICES LTD. A.M. BEST EUROPE INFORMATION SERVICES LTD. 12 Arthur Street, 6th Floor, London, UK EC4R 9AB Phone: +44 (0)20 7626-6264 A.M. BEST ASIA-PACIFIC LTD. Unit 4004 Central Plaza, 18 Harbour Road, Wanchai, Hong Kong Phone: +852 2827-3400 A.M. BEST ASIA-PACIFIC (SINGAPORE) PTE. LTD. 6 Battery Road, #40-02B, Singapore Phone: +65 6589 8400 DUBAI OFFICE* (MENA, SOUTH & CENTRAL ASIA) Office 102, Tower 2 Currency House, DIFC PO Box 506617, Dubai, UAE Phone: +971 43 752 780 *Regulated by the DFSA as a Representative Office A Best’s Financial Strength Rating is an independent opinion of an insurer’s financial strength and ability to meet its ongoing insurance policy and contract obligations. It is based on a com- prehensive quantitative and qualitative evaluation of a company’s balance sheet strength, oper- ating performance and business profile. The Financial Strength Rating opinion addresses the relative ability of an insurer to meet its ongoing insurance policy and contract obligations. These ratings are not a warranty of an insurer’s current or future ability to meet contractual obligations. The rating is not assigned to specific insurance policies or contracts and does not address any other risk, including, but not limited to, an insurer’s claims-payment policies or procedures; the ability of the insurer to dispute or deny claims payment on grounds of misrepresentation or fraud; or any specific liability contractually borne by the policy or contract holder. A Financial Strength Rating is not a recommendation to purchase, hold or terminate any insurance policy, contract or any other financial obligation issued by an insurer, nor does it address the suitability of any particular policy or contract for a specific purpose or purchaser. A Best’s Debt/Issuer Credit Rating is an opinion regarding the relative future credit risk of an entity, a credit commitment or a debt or debt-like security. It is based on a comprehensive quantita- tive and qualitative evaluation of a company’s balance sheet strength, operating performance and business profile and, where appropriate, the specific nature and details of a rated debt security. Credit risk is the risk that an entity may not meet its contractual, financial obligations as they come due. These credit ratings do not address any other risk, including but not limited to liquidity risk, market value risk or price volatility of rated securities. The rating is not a recommendation to buy, sell or hold any securities, insurance policies, contracts or any other financial obligations, nor does it address the suitability of any particular financial obligation for a specific purpose or purchaser. Any and all ratings, opinions and information contained herein are provided “as is,” without any expressed or implied warranty. A rating may be changed, suspended or withdrawn at any time for any reason at the sole discretion of A.M. Best. In arriving at a rating decision, A.M. Best relies on third-party audited financial data and/or other information provided to it. While this information is believed to be reliable, A.M. Best does not independently verify the accuracy or reliability of the information. A.M. Best does not offer consulting or advisory services. A.M. Best is not an Investment Adviser and does not offer investment advice of any kind, nor does the company or its Rating Analysts offer any form of structuring or financial advice. A.M. Best does not sell securities. A.M. Best is compensated for its interactive rating services. These rating fees can vary from US$ 5,000 to US$ 500,000. In addition, A.M. Best may receive compensation from rated enti- ties for non-rating related services or products offered. Data sourced from the BestLink system is retrieved around the time of the report creation and is subject to revision. A.M. Best’s Special Reports and any associated spreadsheet data are available, free of charge, to all Best’s Insurance News & Analysis subscribers. Nonsubscribers can purchase the full report and spreadsheet data. Special Reports are available through our Web site at www.ambest.com/research or by calling Customer Service at (908) 439-2200, ext. 5742. Briefings and some Special Reports are offered to the general public at no cost. For press inquiries or to contact the authors, please contact James Peavy at (908) 439-2200, ext. 5644. 4 Special Report U.S. Property/Casualty & Life/Health Over the past 15 years, insurance companies have been able to effectively utilize surplus notes as opportunistic sources of capital. In the last five years, the launch and operation of CO-OPs has significantly changed the landscape of surplus note issuance not only in the health sector, but in the insurance industry as a whole. Easier access and better terms on surplus notes has made it more efficient for health companies to raise capital. The significant spike in the dollar amount of outstanding notes in 2009 can be attributed to the effects of the financial crisis and driven by two main forces. First, the capital issuance was needed to fund additional growth that was not able to be supported by existing capital. The new surplus note issuances were somewhat concentrated in insurers specializing in annuities, who reported declining profitability due to their exposure to equity markets through variable annuity products. This inflow of new capital allowed L/A insurers to maintain capitalization levels in line with their historical levels despite reporting declining profitability or operating losses. The second driving force of increased usage of surplus notes stems from the need to replace capital that had been depleted by losses from existing business and/or investment portfolios. While it can be said that the economy has been steadily recovering, the continued low interest rate environment allows surplus notes to remain an attractive option for insurers to maintain strong risk-adjusted capital.