Download to read offline


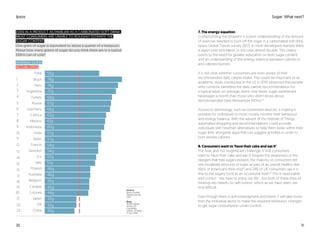


The document discusses the urgent need to address the global obesity crisis, emphasizing sugar consumption as a key factor. It highlights public perceptions of responsibility for tackling obesity, with a consensus that both individuals and the food industry must take action, while proposing a framework for effective interventions. The report also presents insights into consumer behavior regarding sugar intake and the challenges of changing these behaviors to promote healthier choices.


