Download as PDF, PPTX


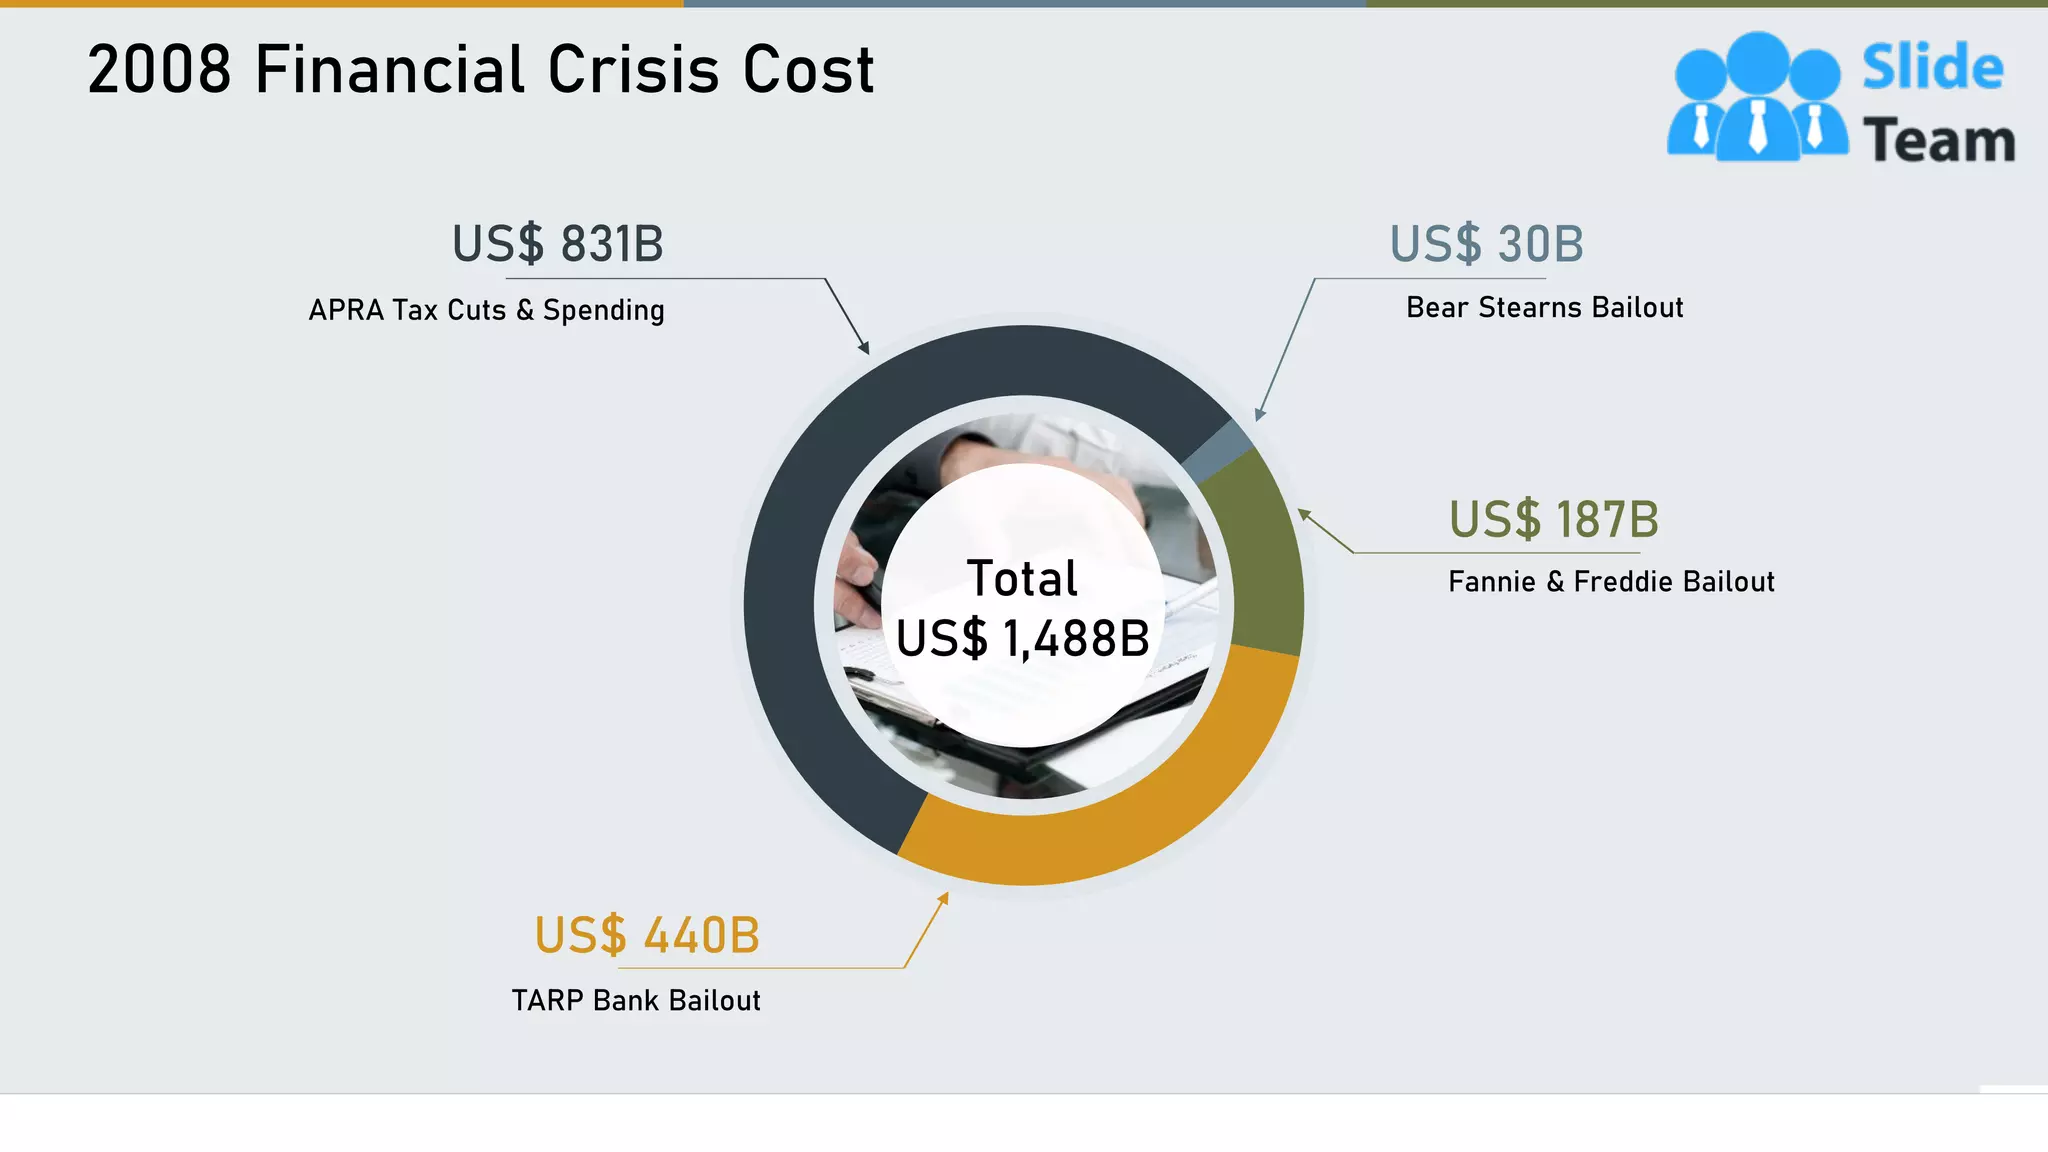


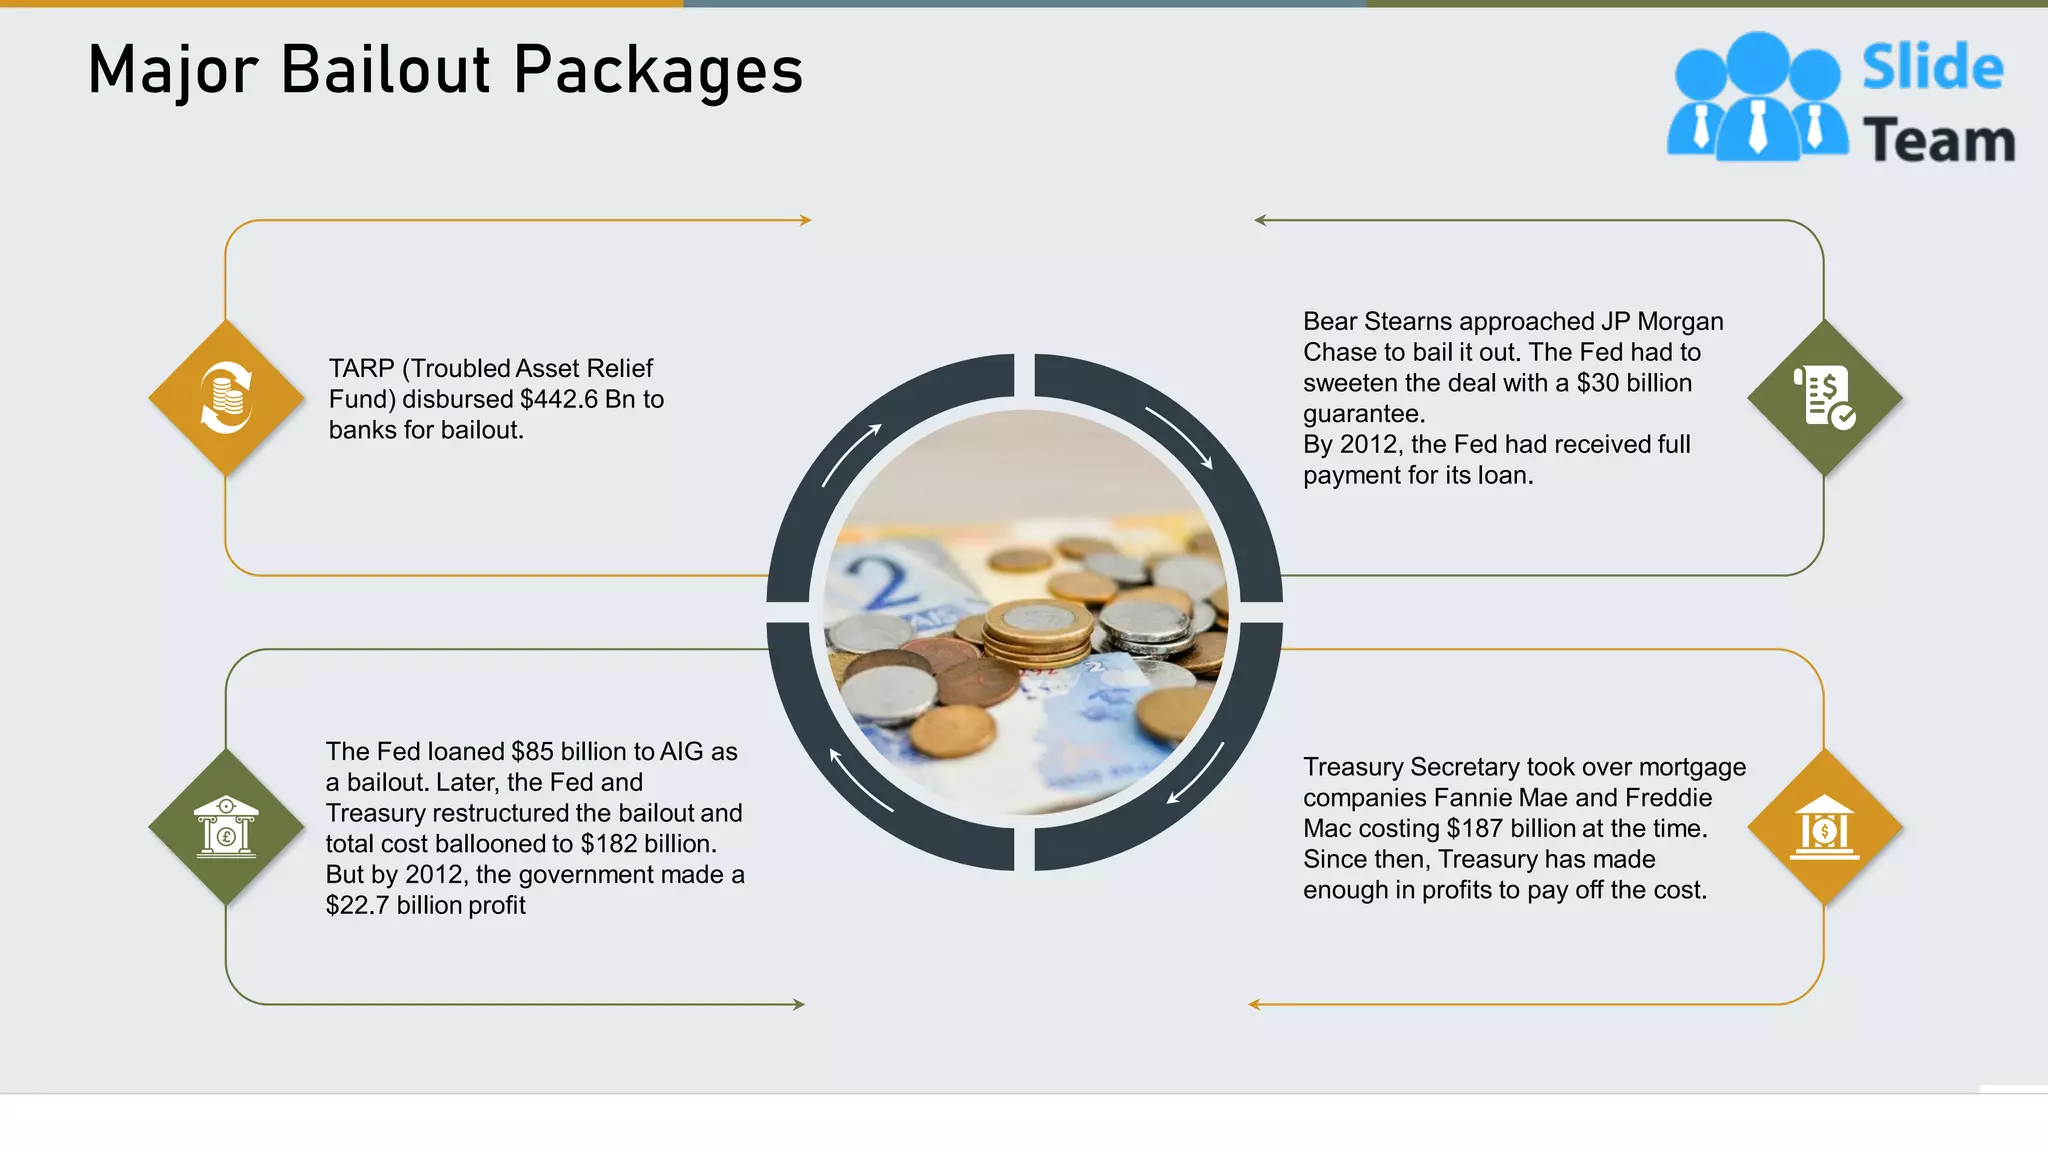


The document outlines the subprime mortgage crisis and its economic impact, highlighting key statistics such as housing prices falling by 31.8% and unemployment exceeding 9% in 2010. It details the extensive financial bailouts totaling $1.488 trillion and the collapse of major institutions like Lehman Brothers, which precipitated a loss of trust among banks and led to the 2008 financial crisis. It also discusses the aftermath and ongoing concerns within the financial sector, including regulatory challenges and the resurgence of complex financial instruments.


![[BROCHURE] Italy Tour Project | @SlideON](https://cdn.slidesharecdn.com/ss_thumbnails/brochure8-251215152319-2805af68-thumbnail.jpg?width=640&height=640&fit=bounds)


