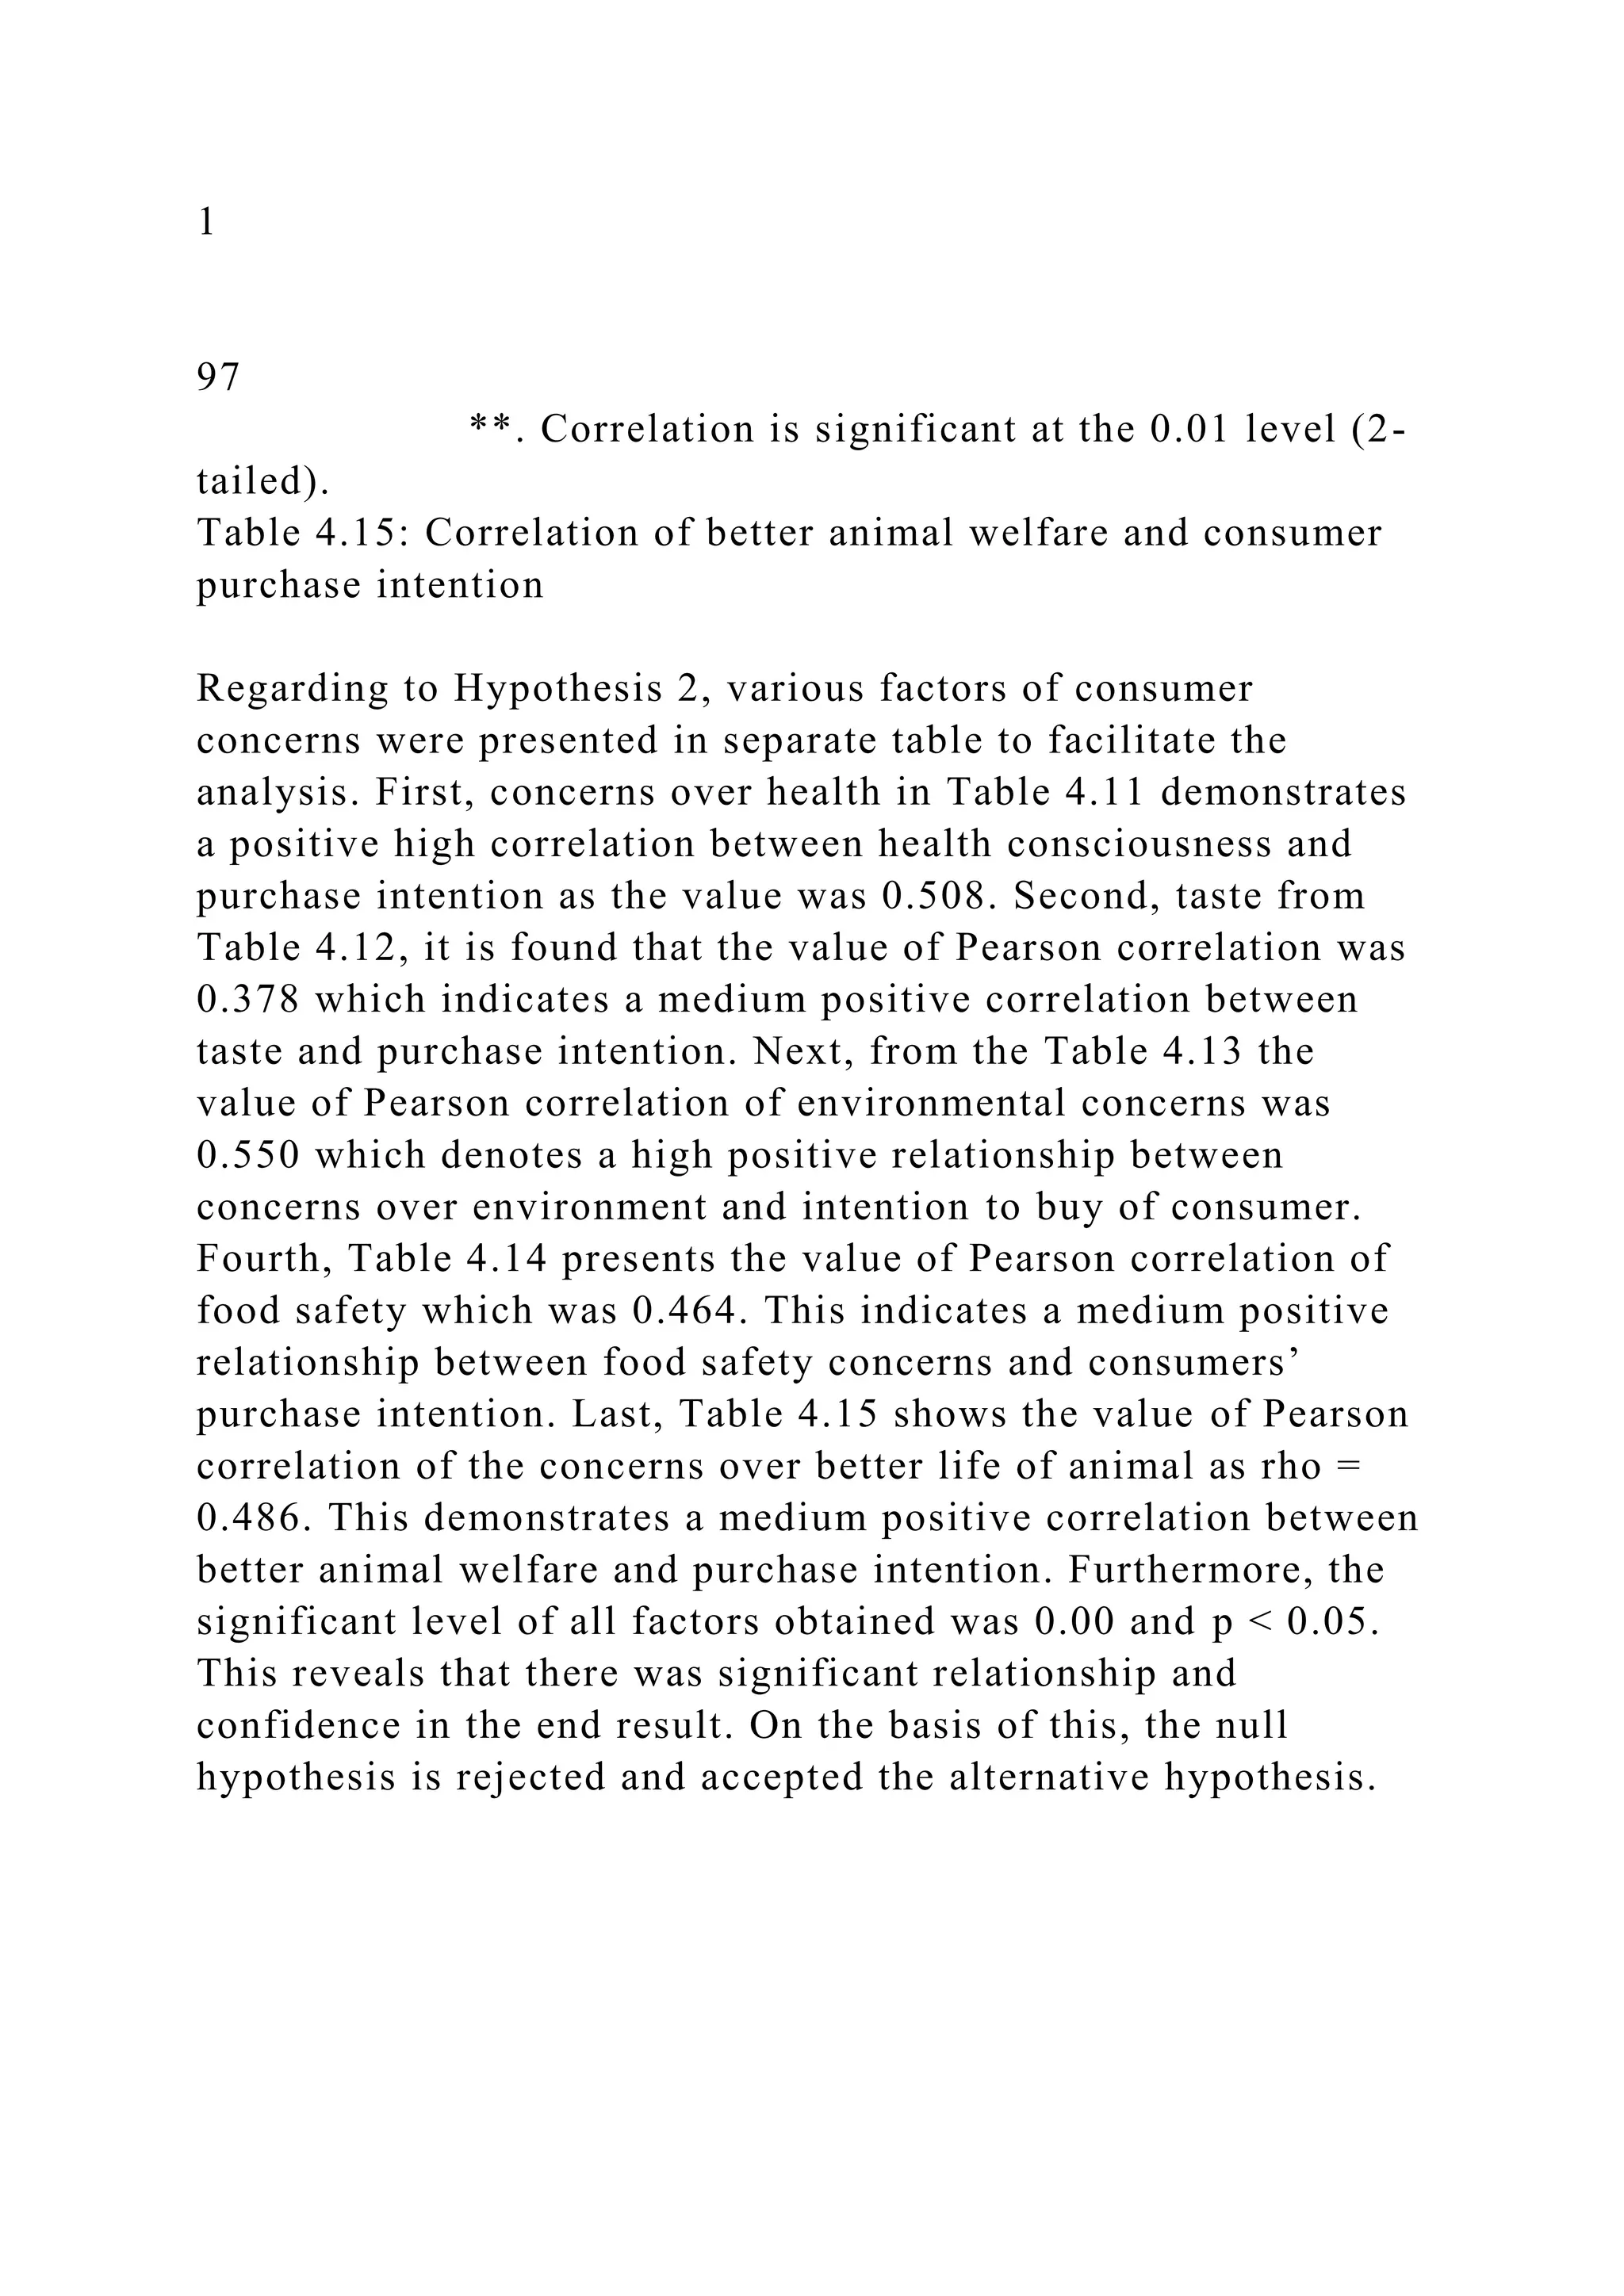
This research investigates consumer attitudes and purchase intentions regarding organic food in the UK, noting the growing significance of the organic food market, which has expanded beyond a niche market due to consumer demand and wider availability in various retail outlets. Key factors influencing purchase intentions include organic certification labels, health and environmental concerns, and price, with findings indicating price remains a barrier for consumers. Additionally, the study highlights the importance of consumer knowledge as a determinant of their attitudes towards organic products, suggesting enhanced public education on organic food could bolster market growth.
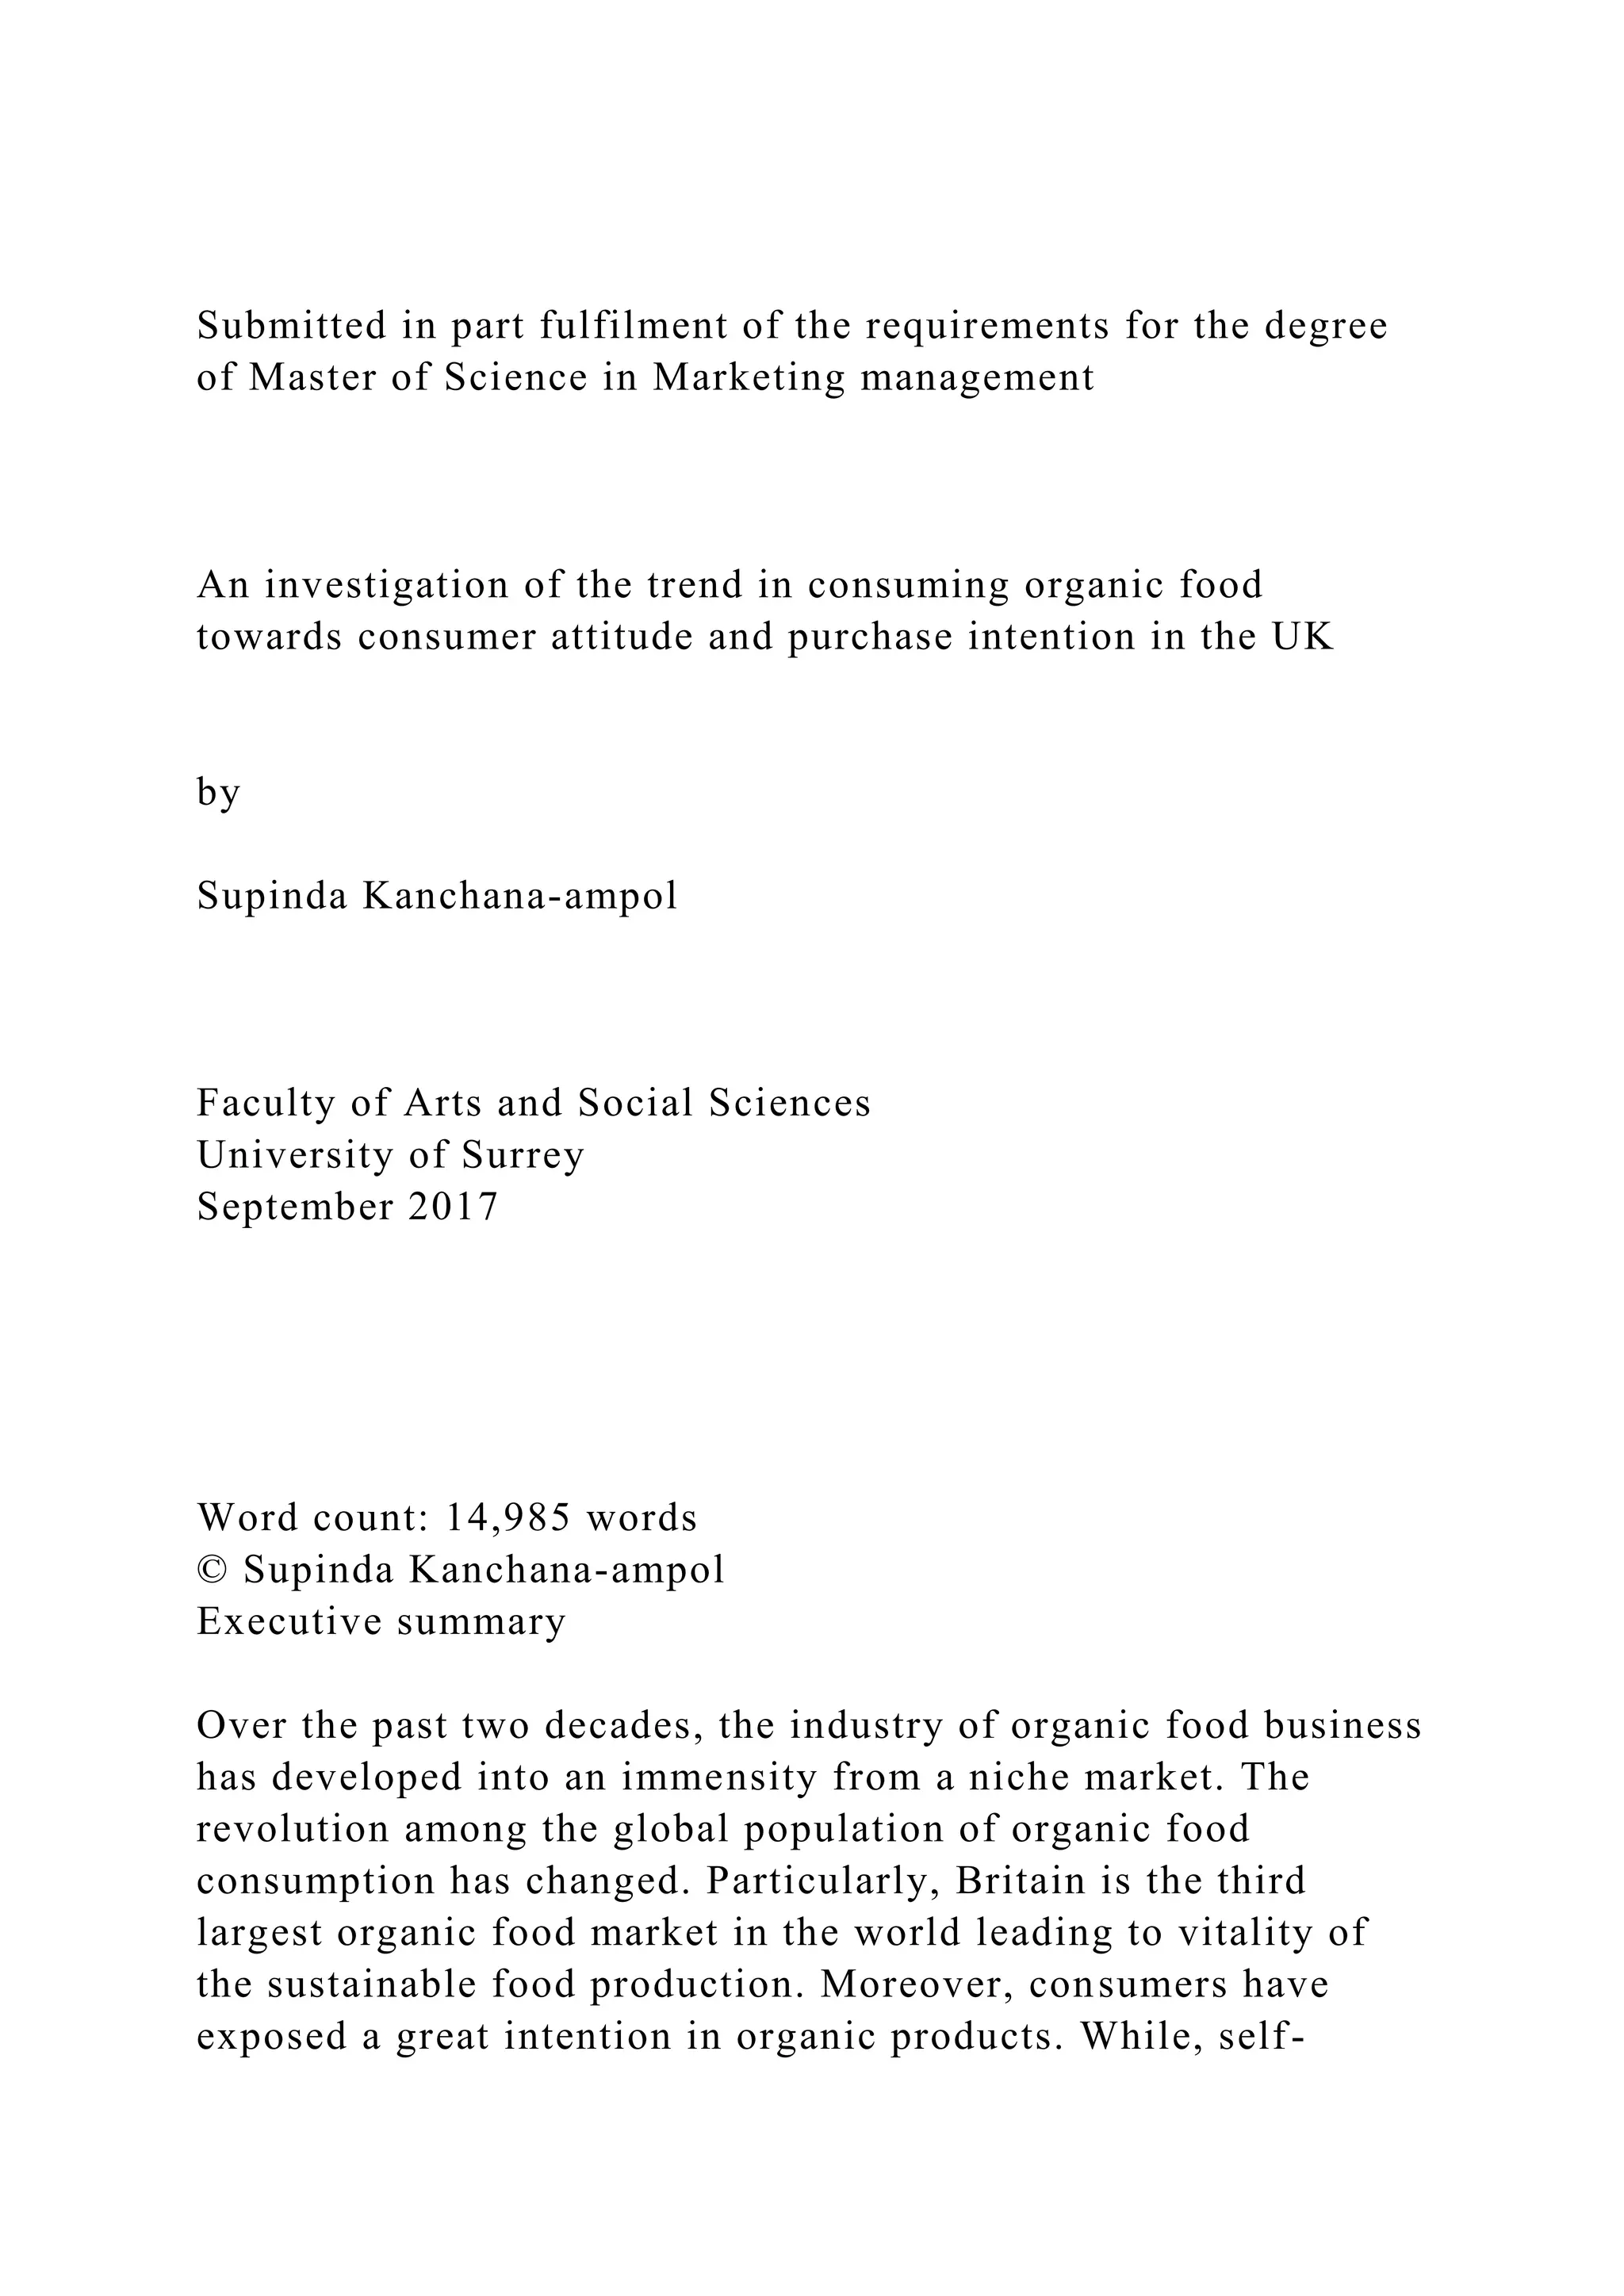


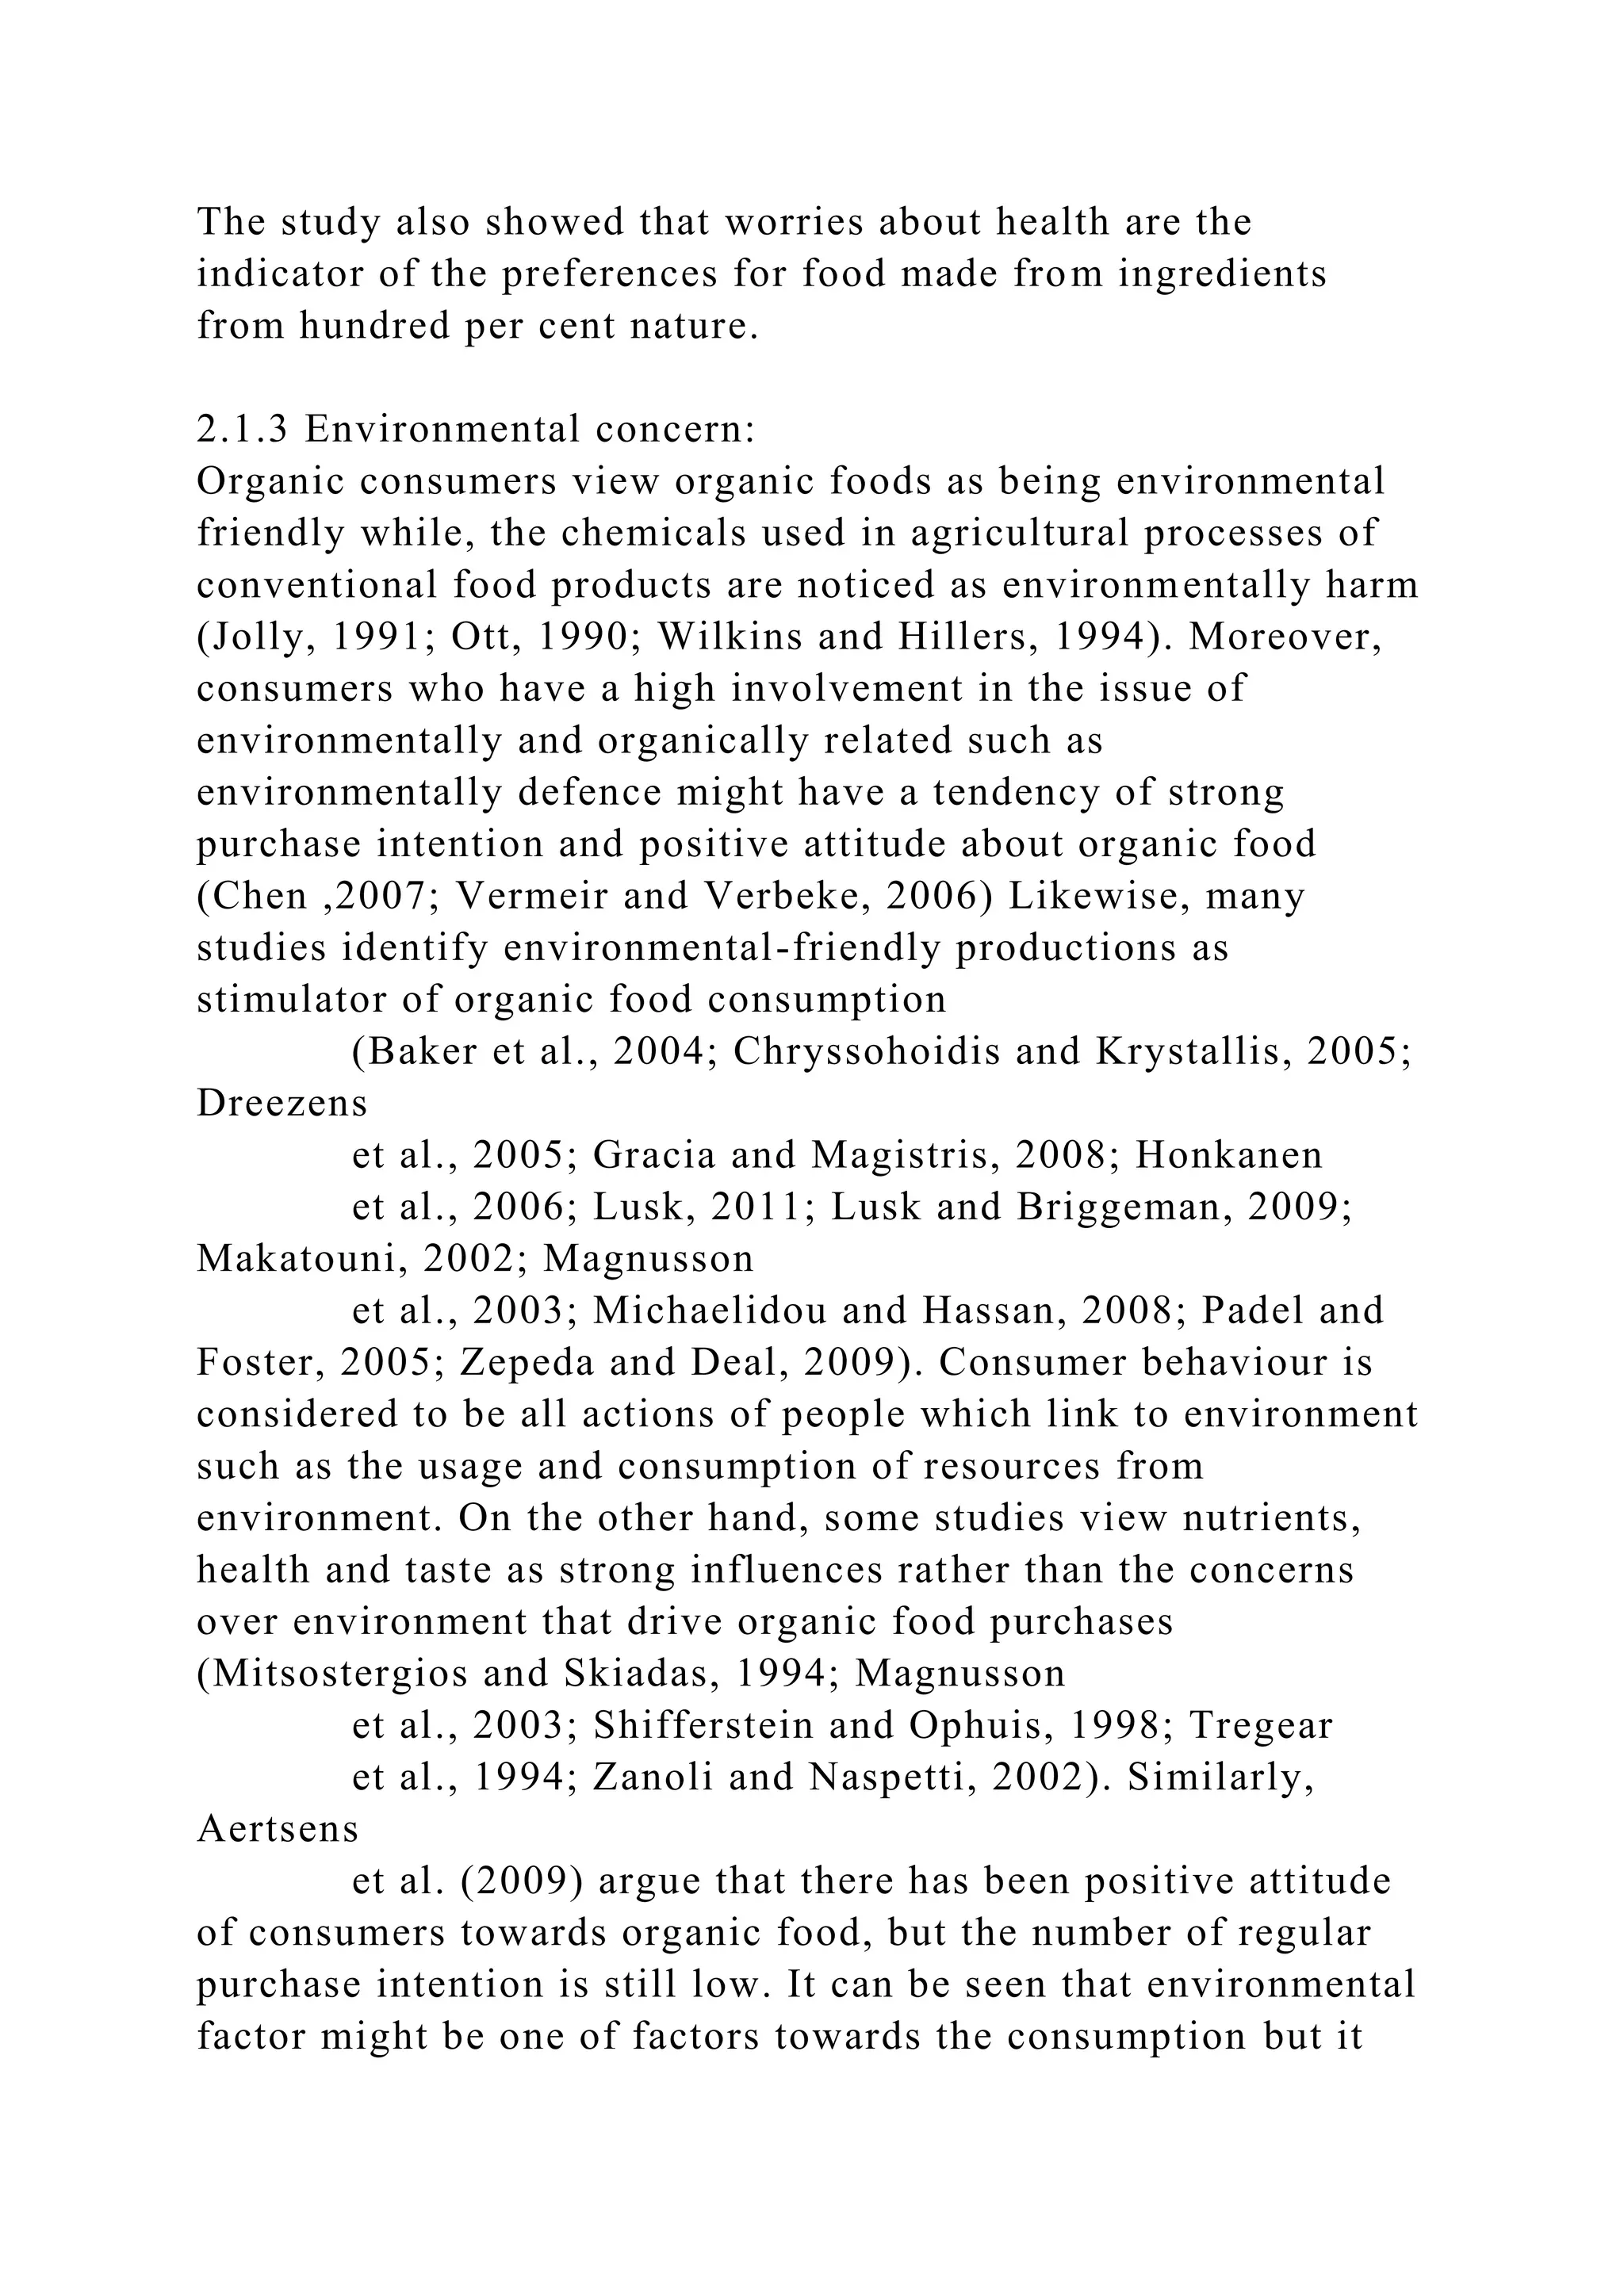
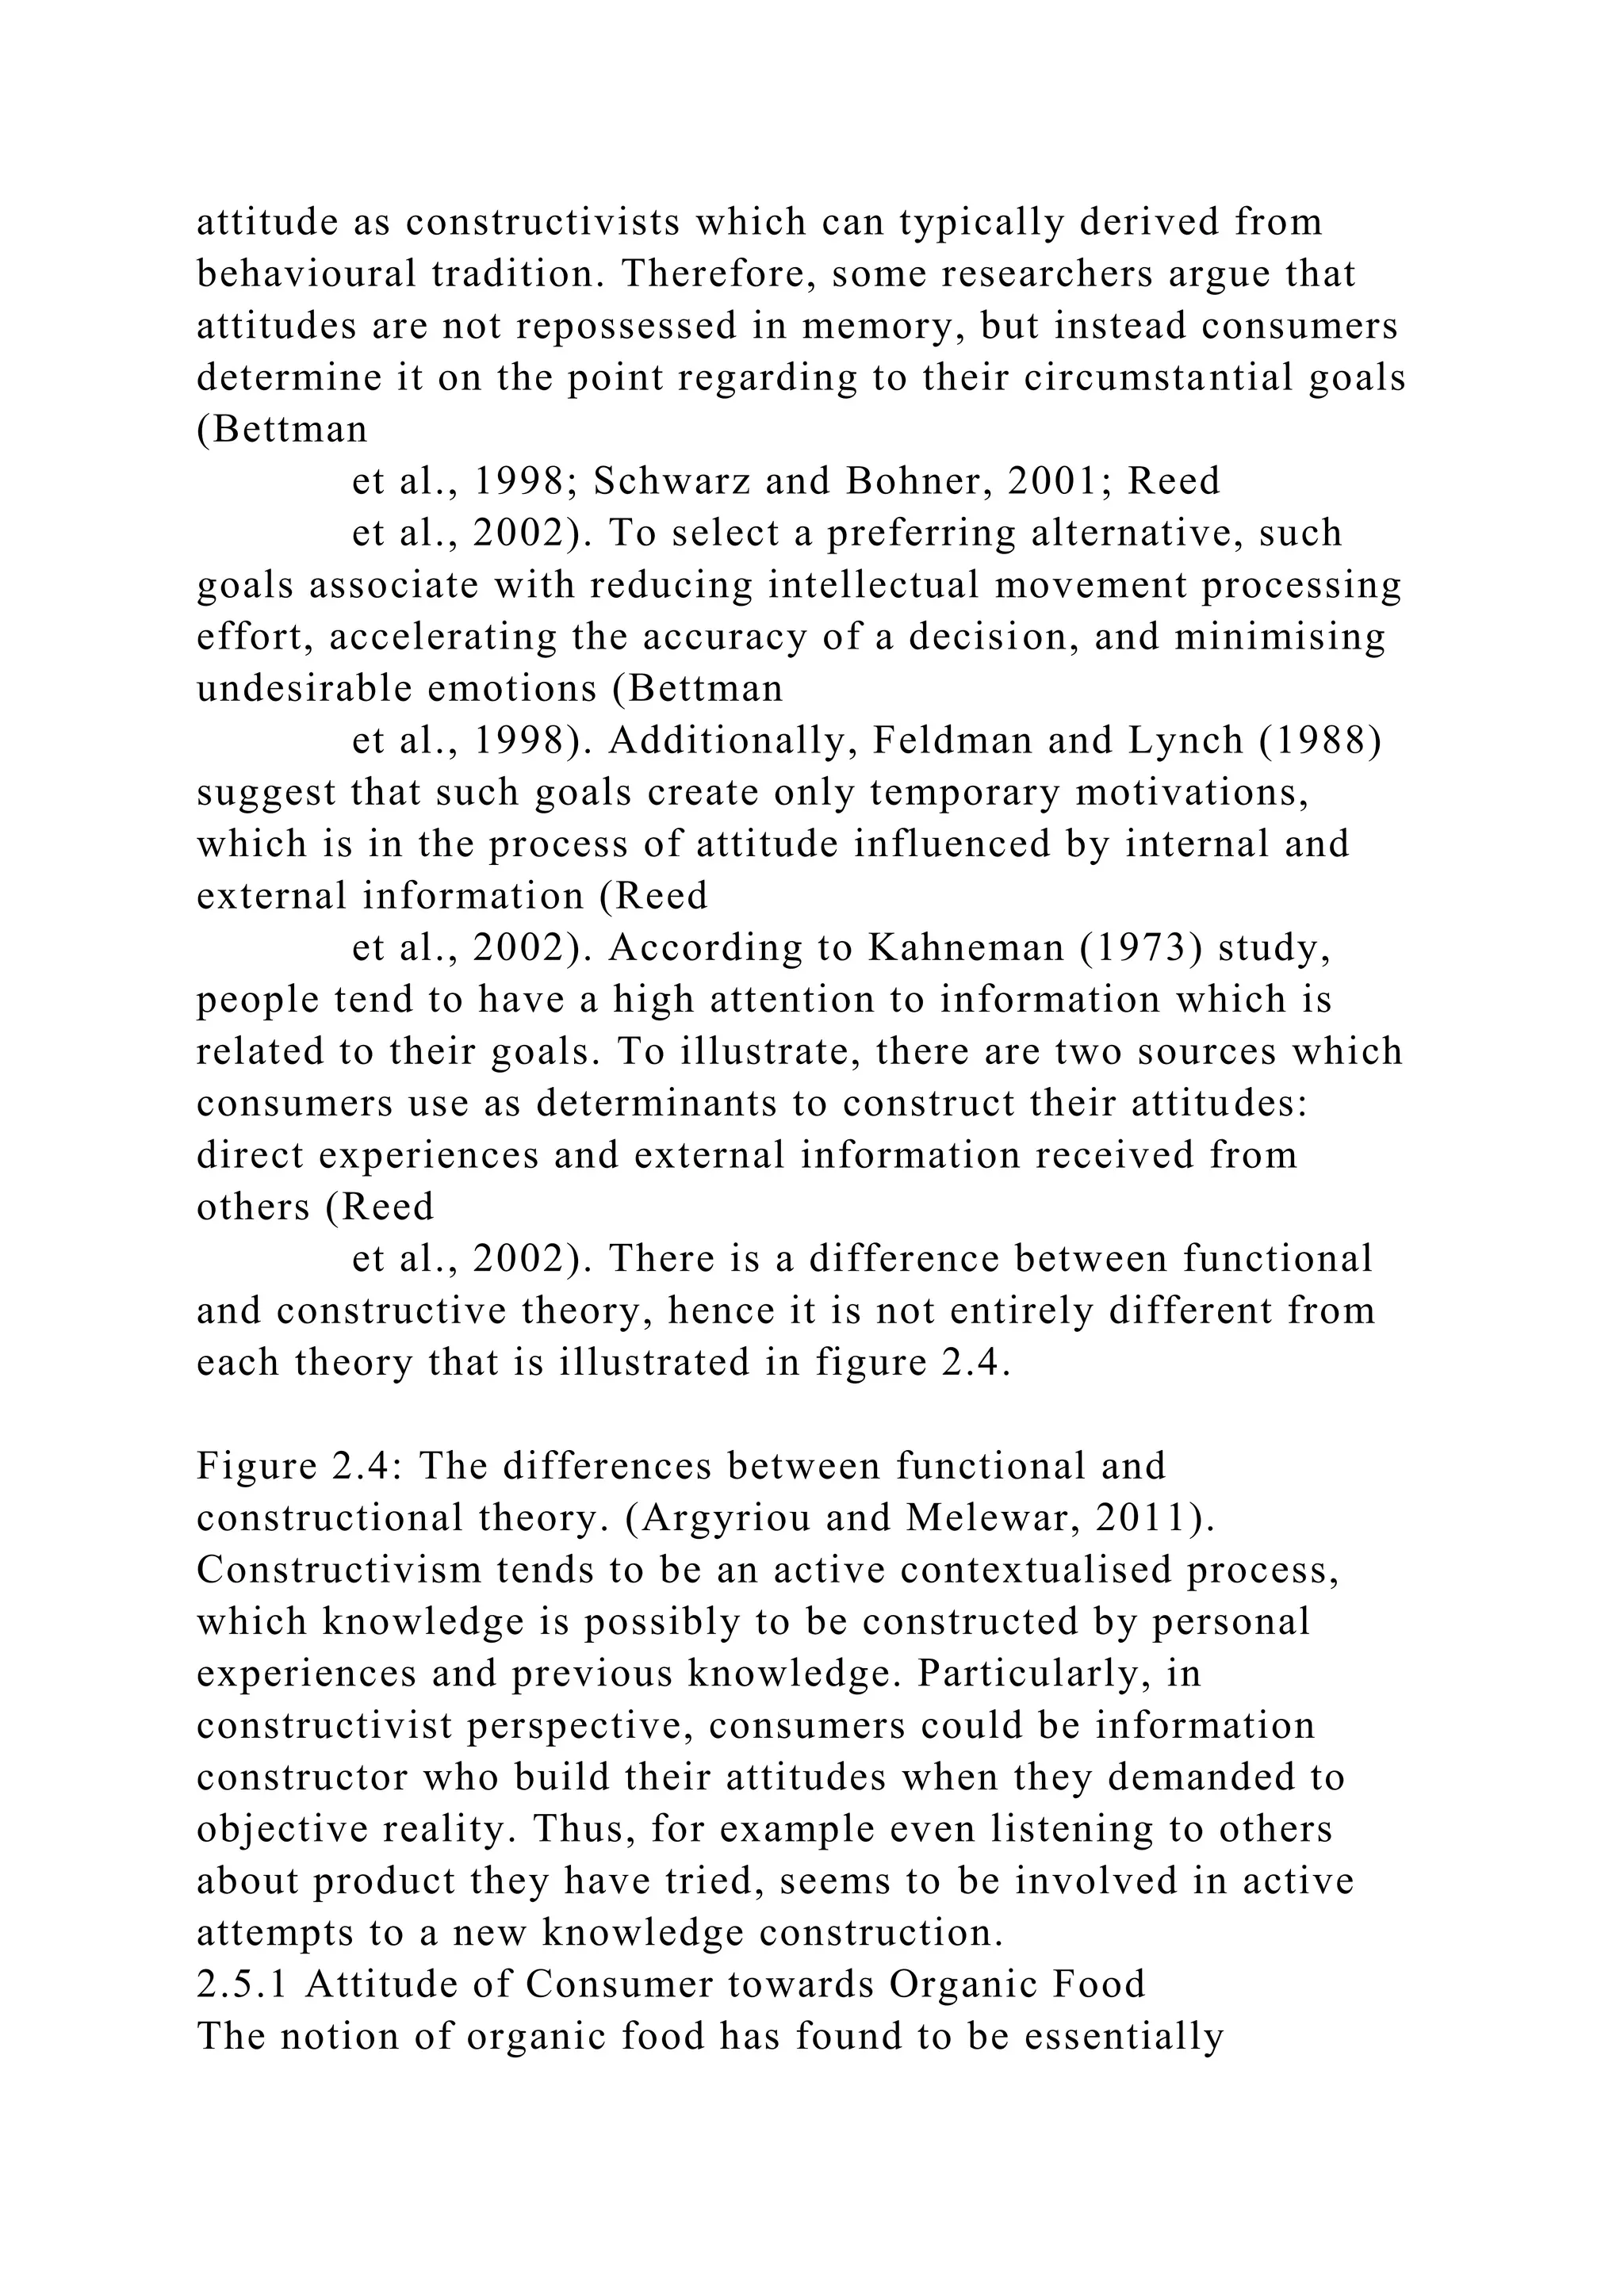
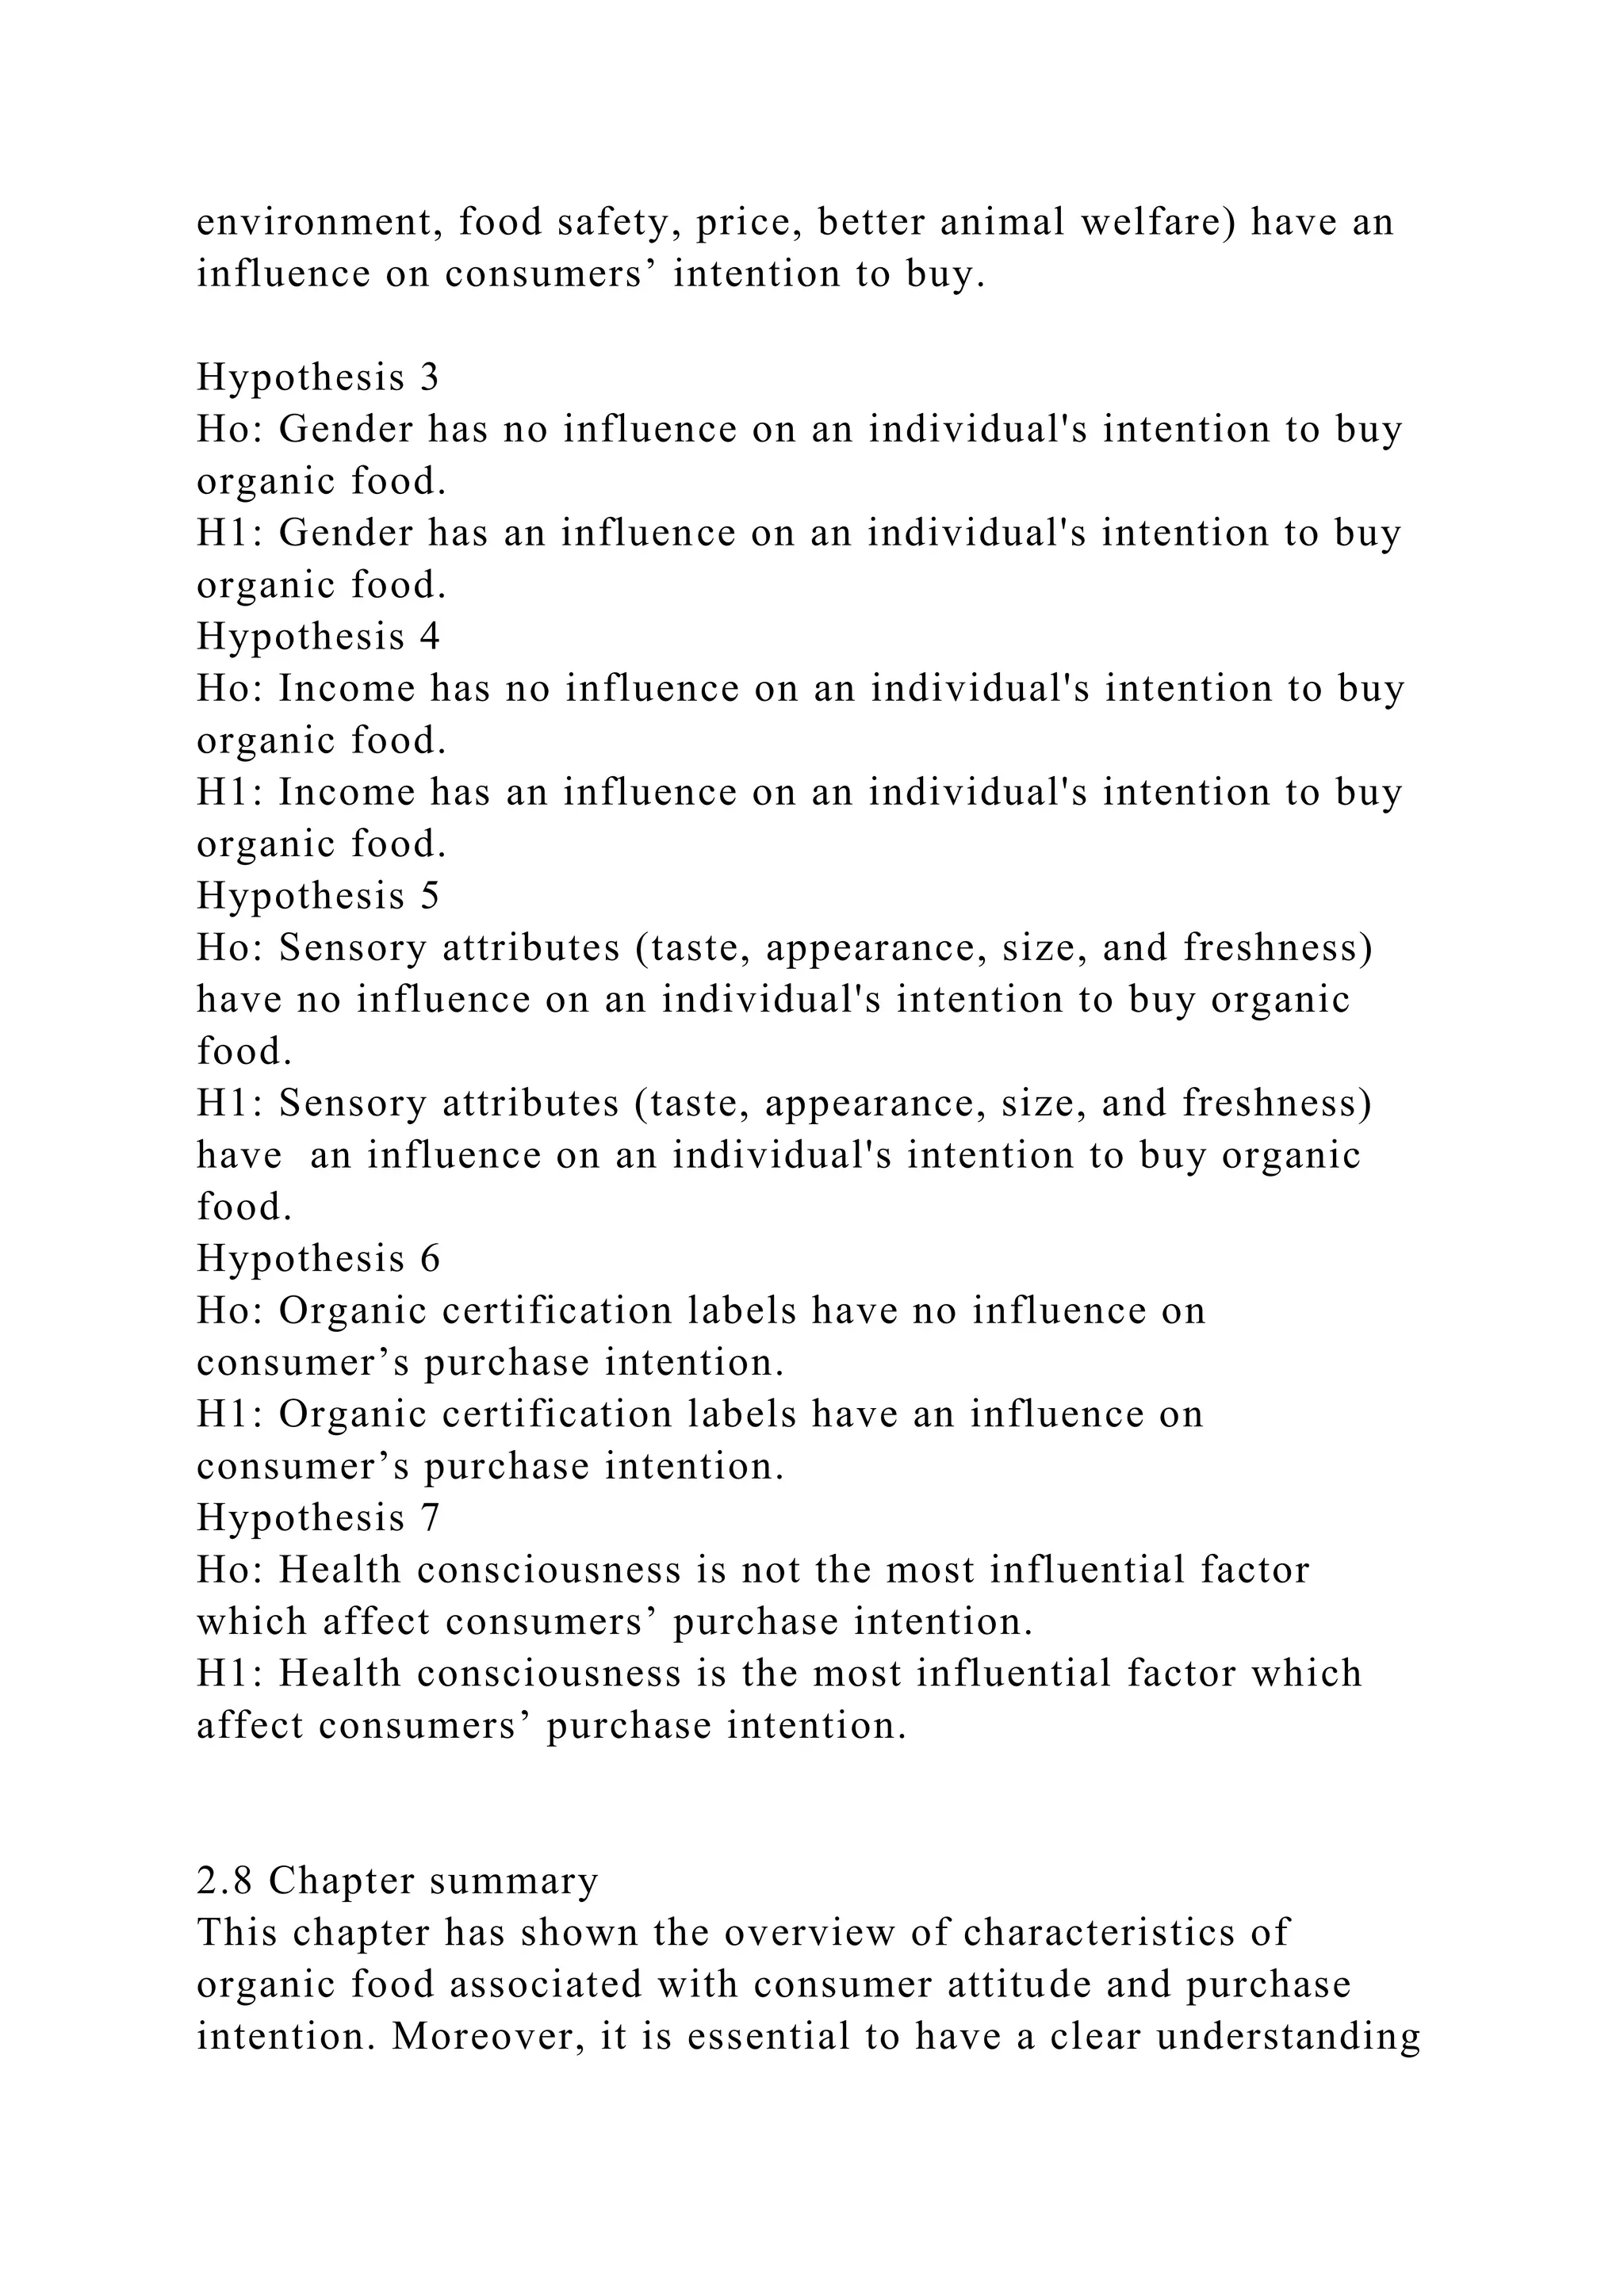
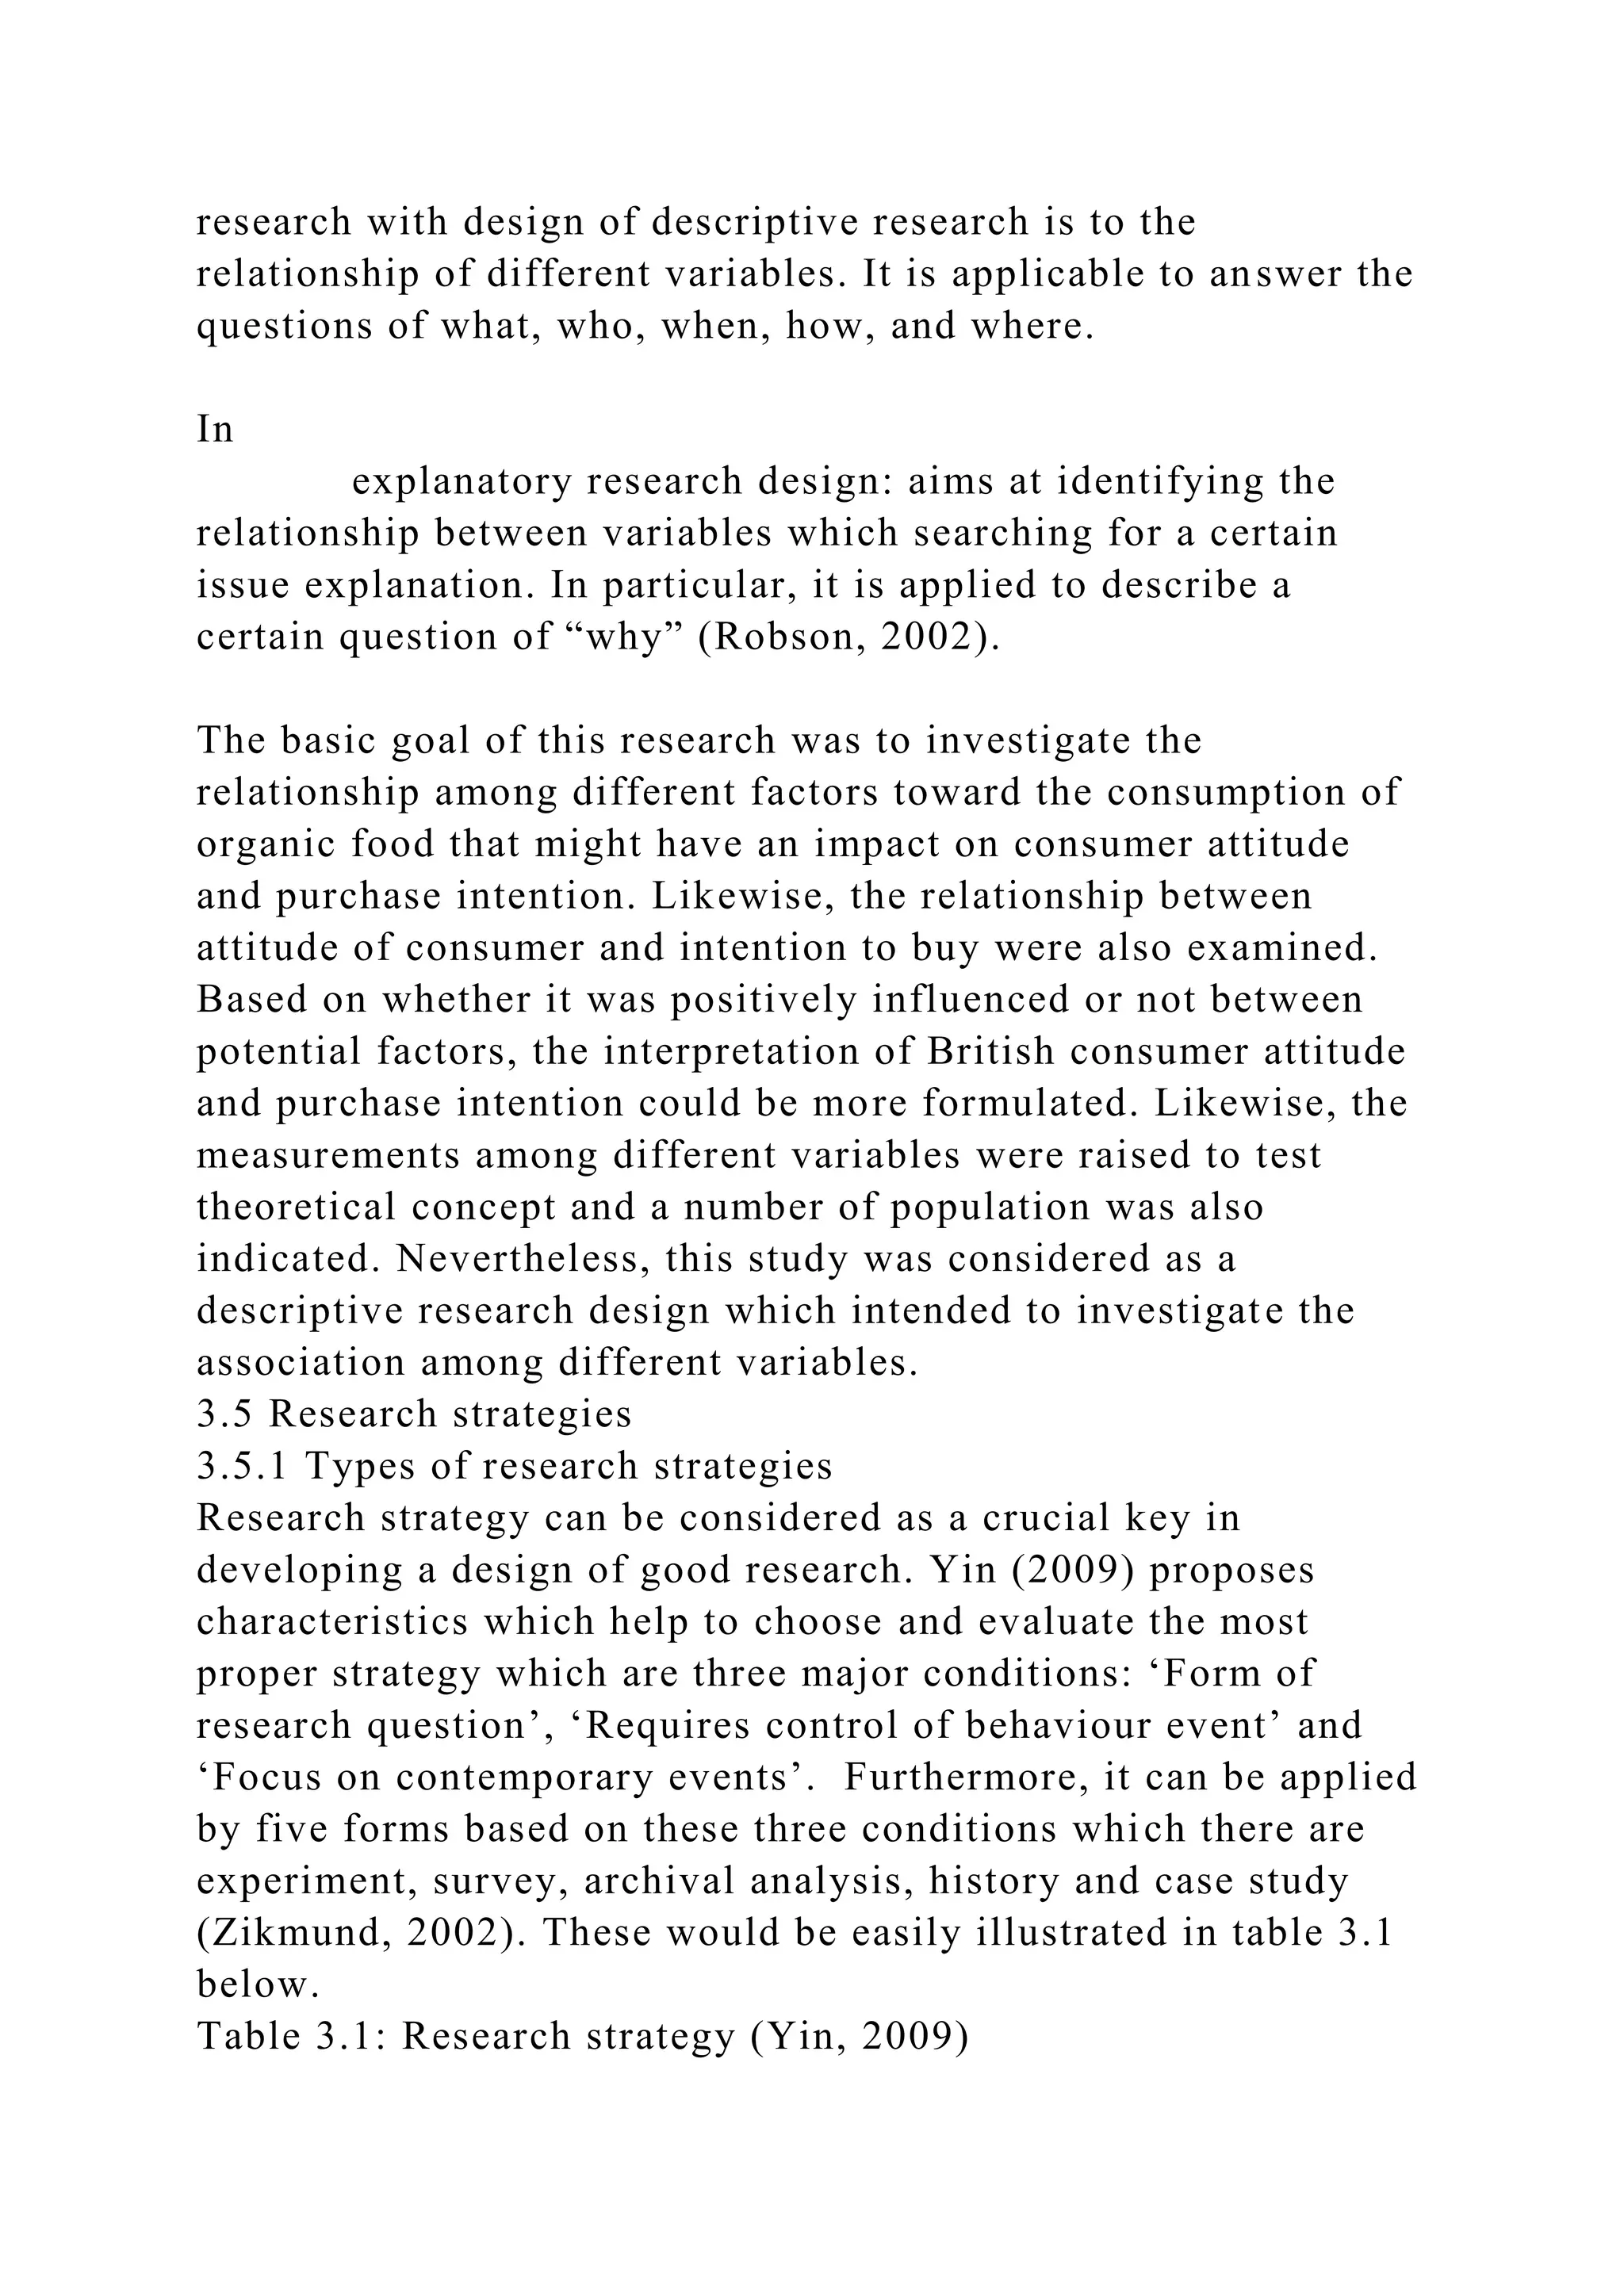
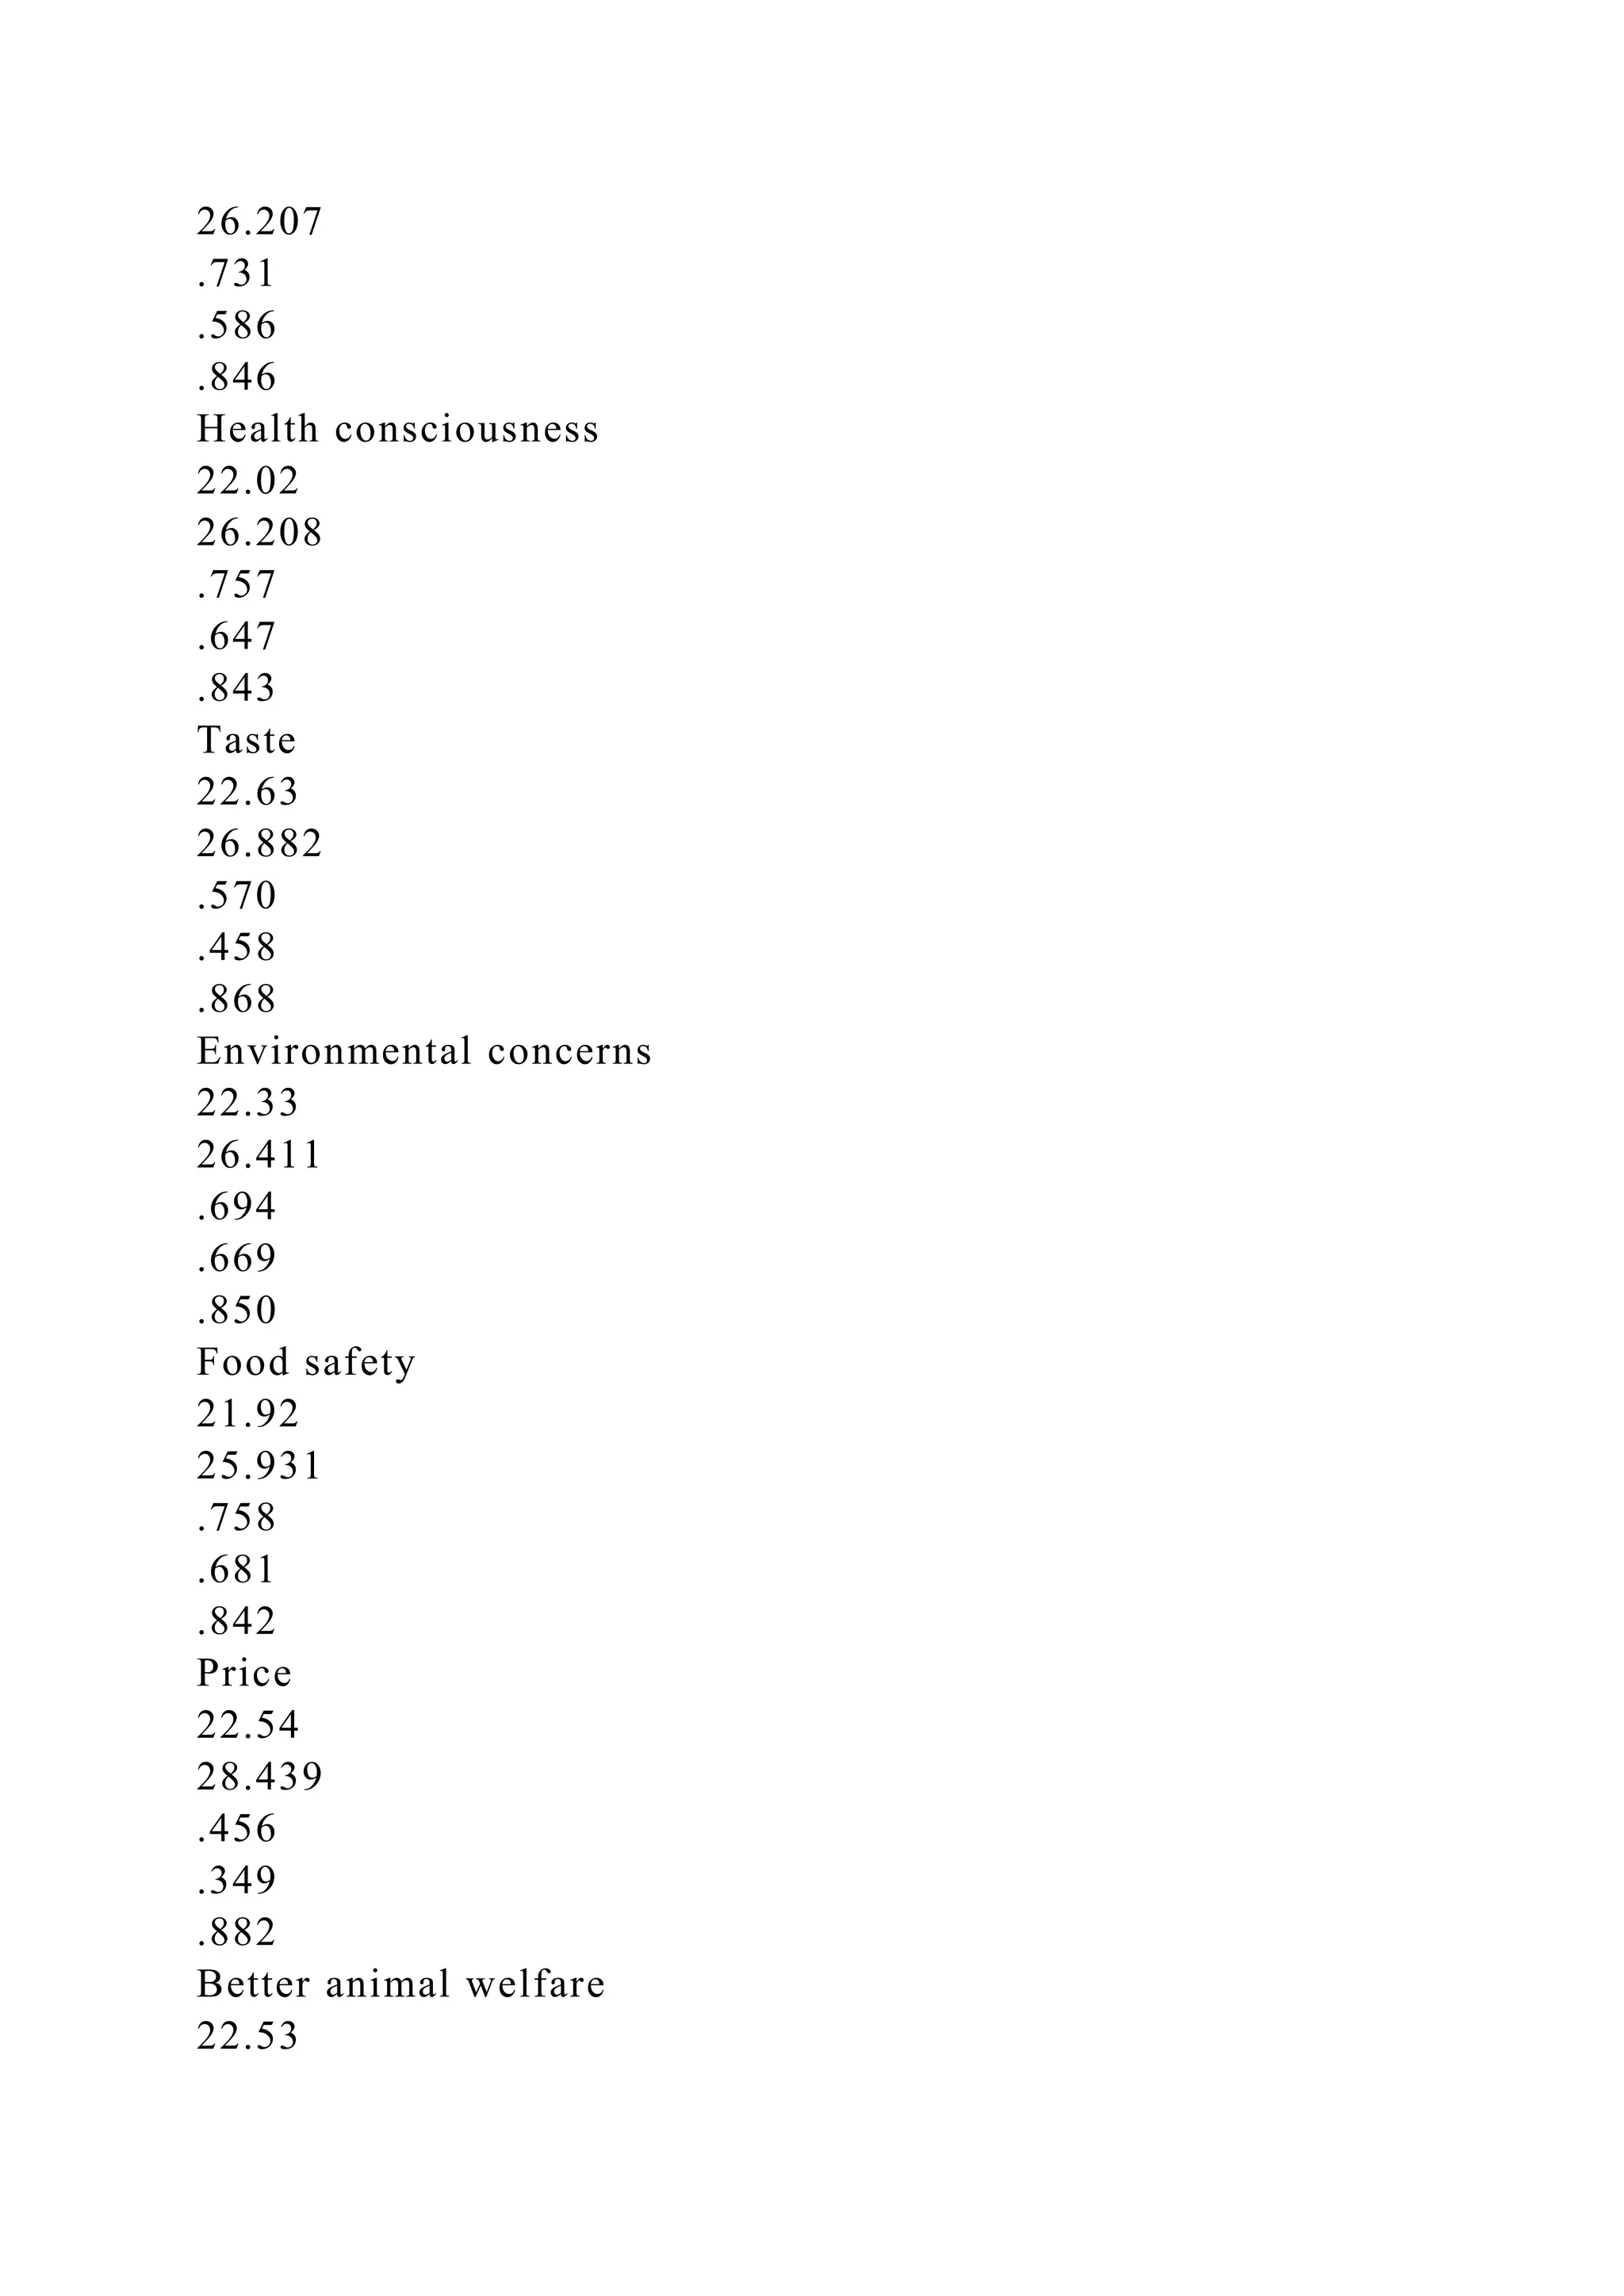
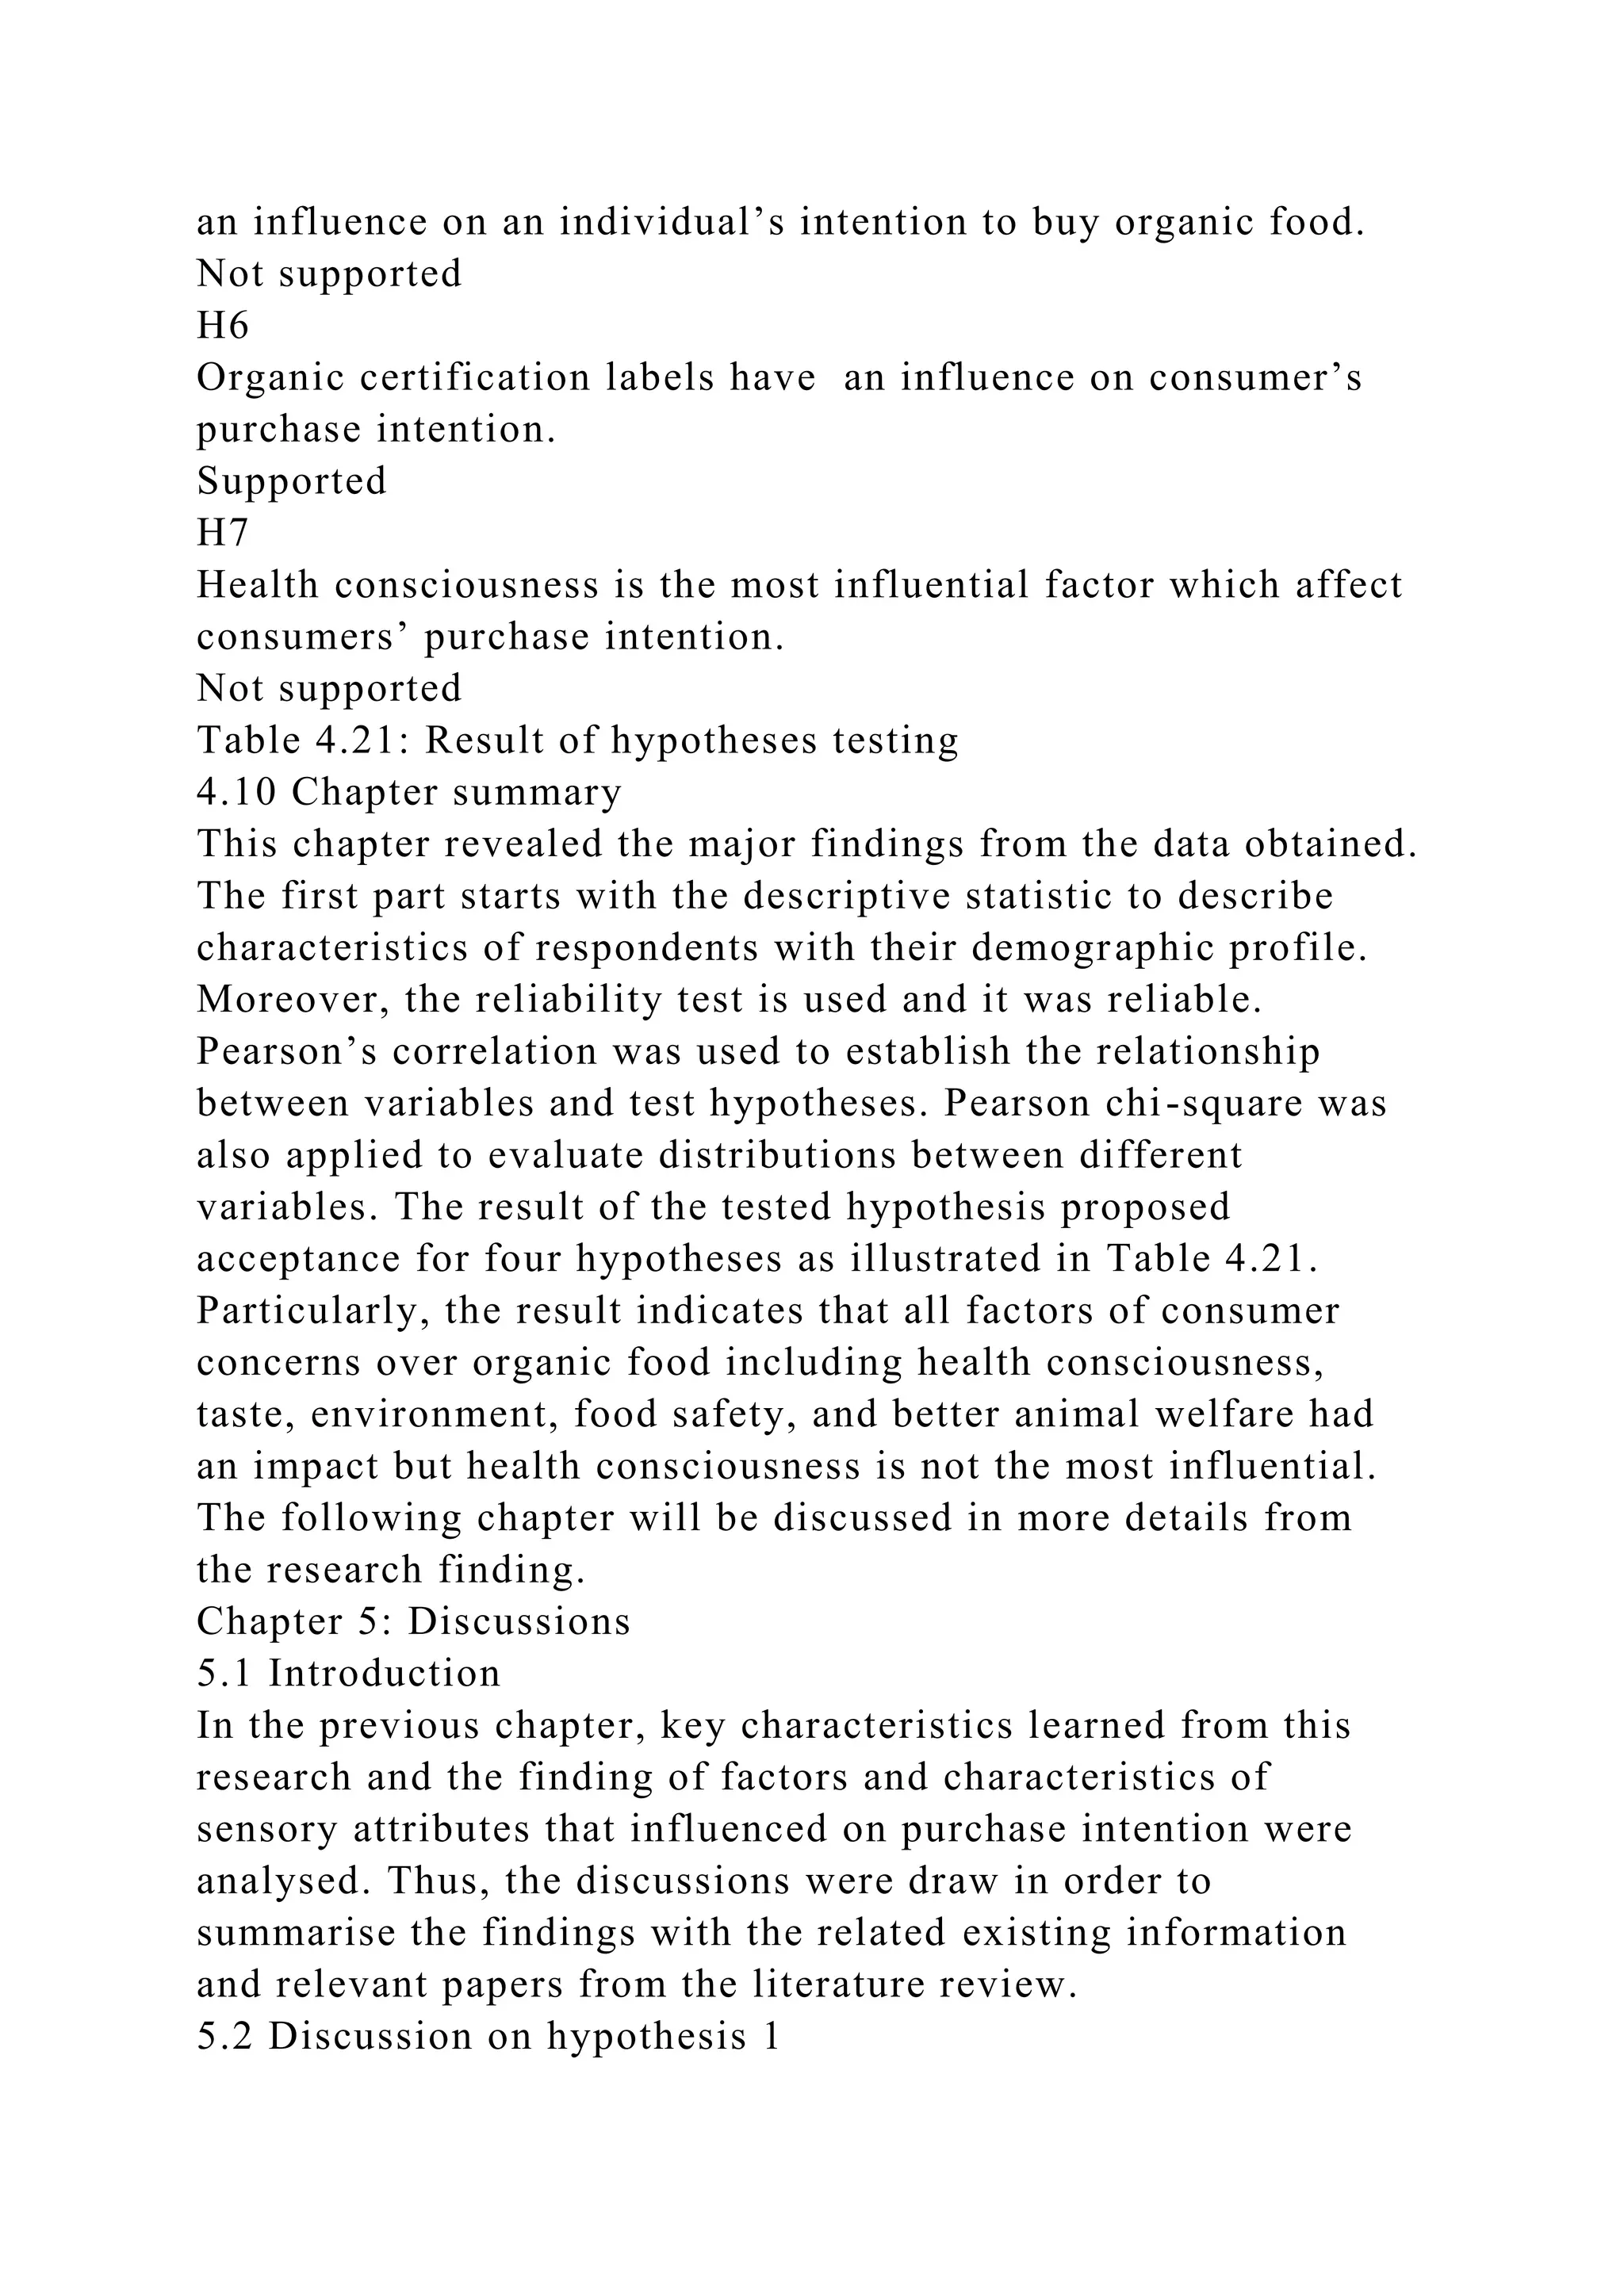
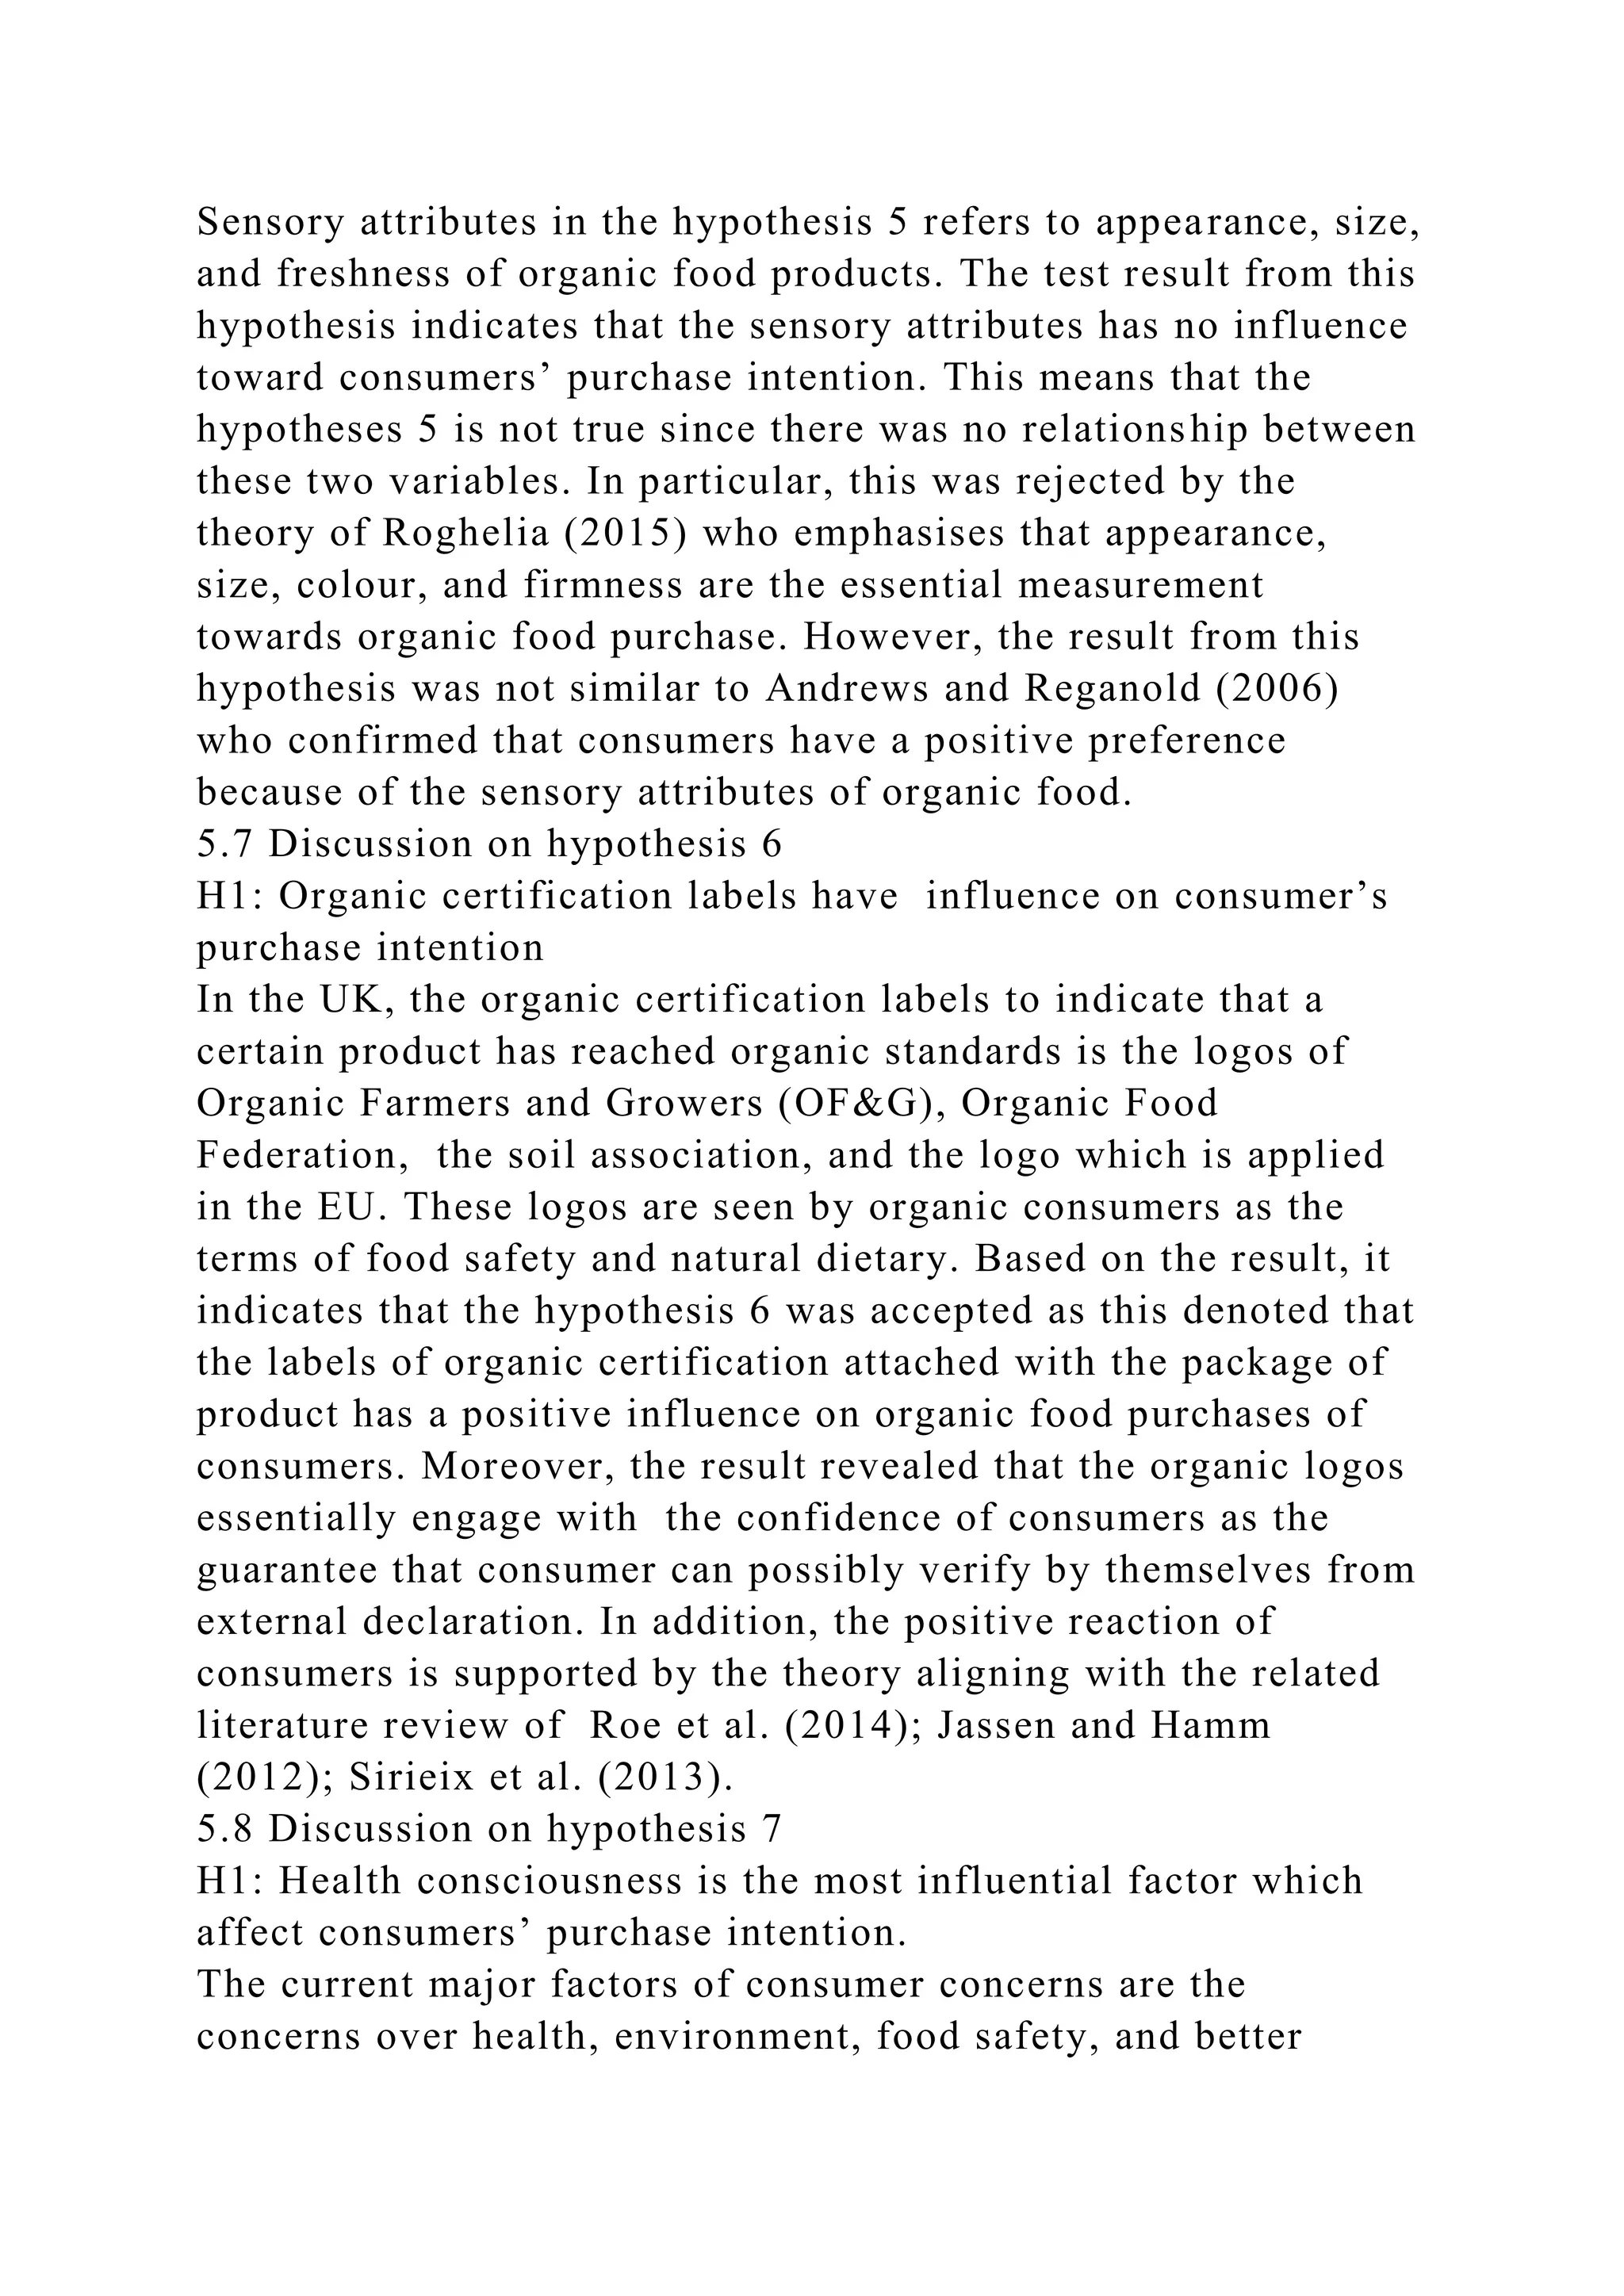
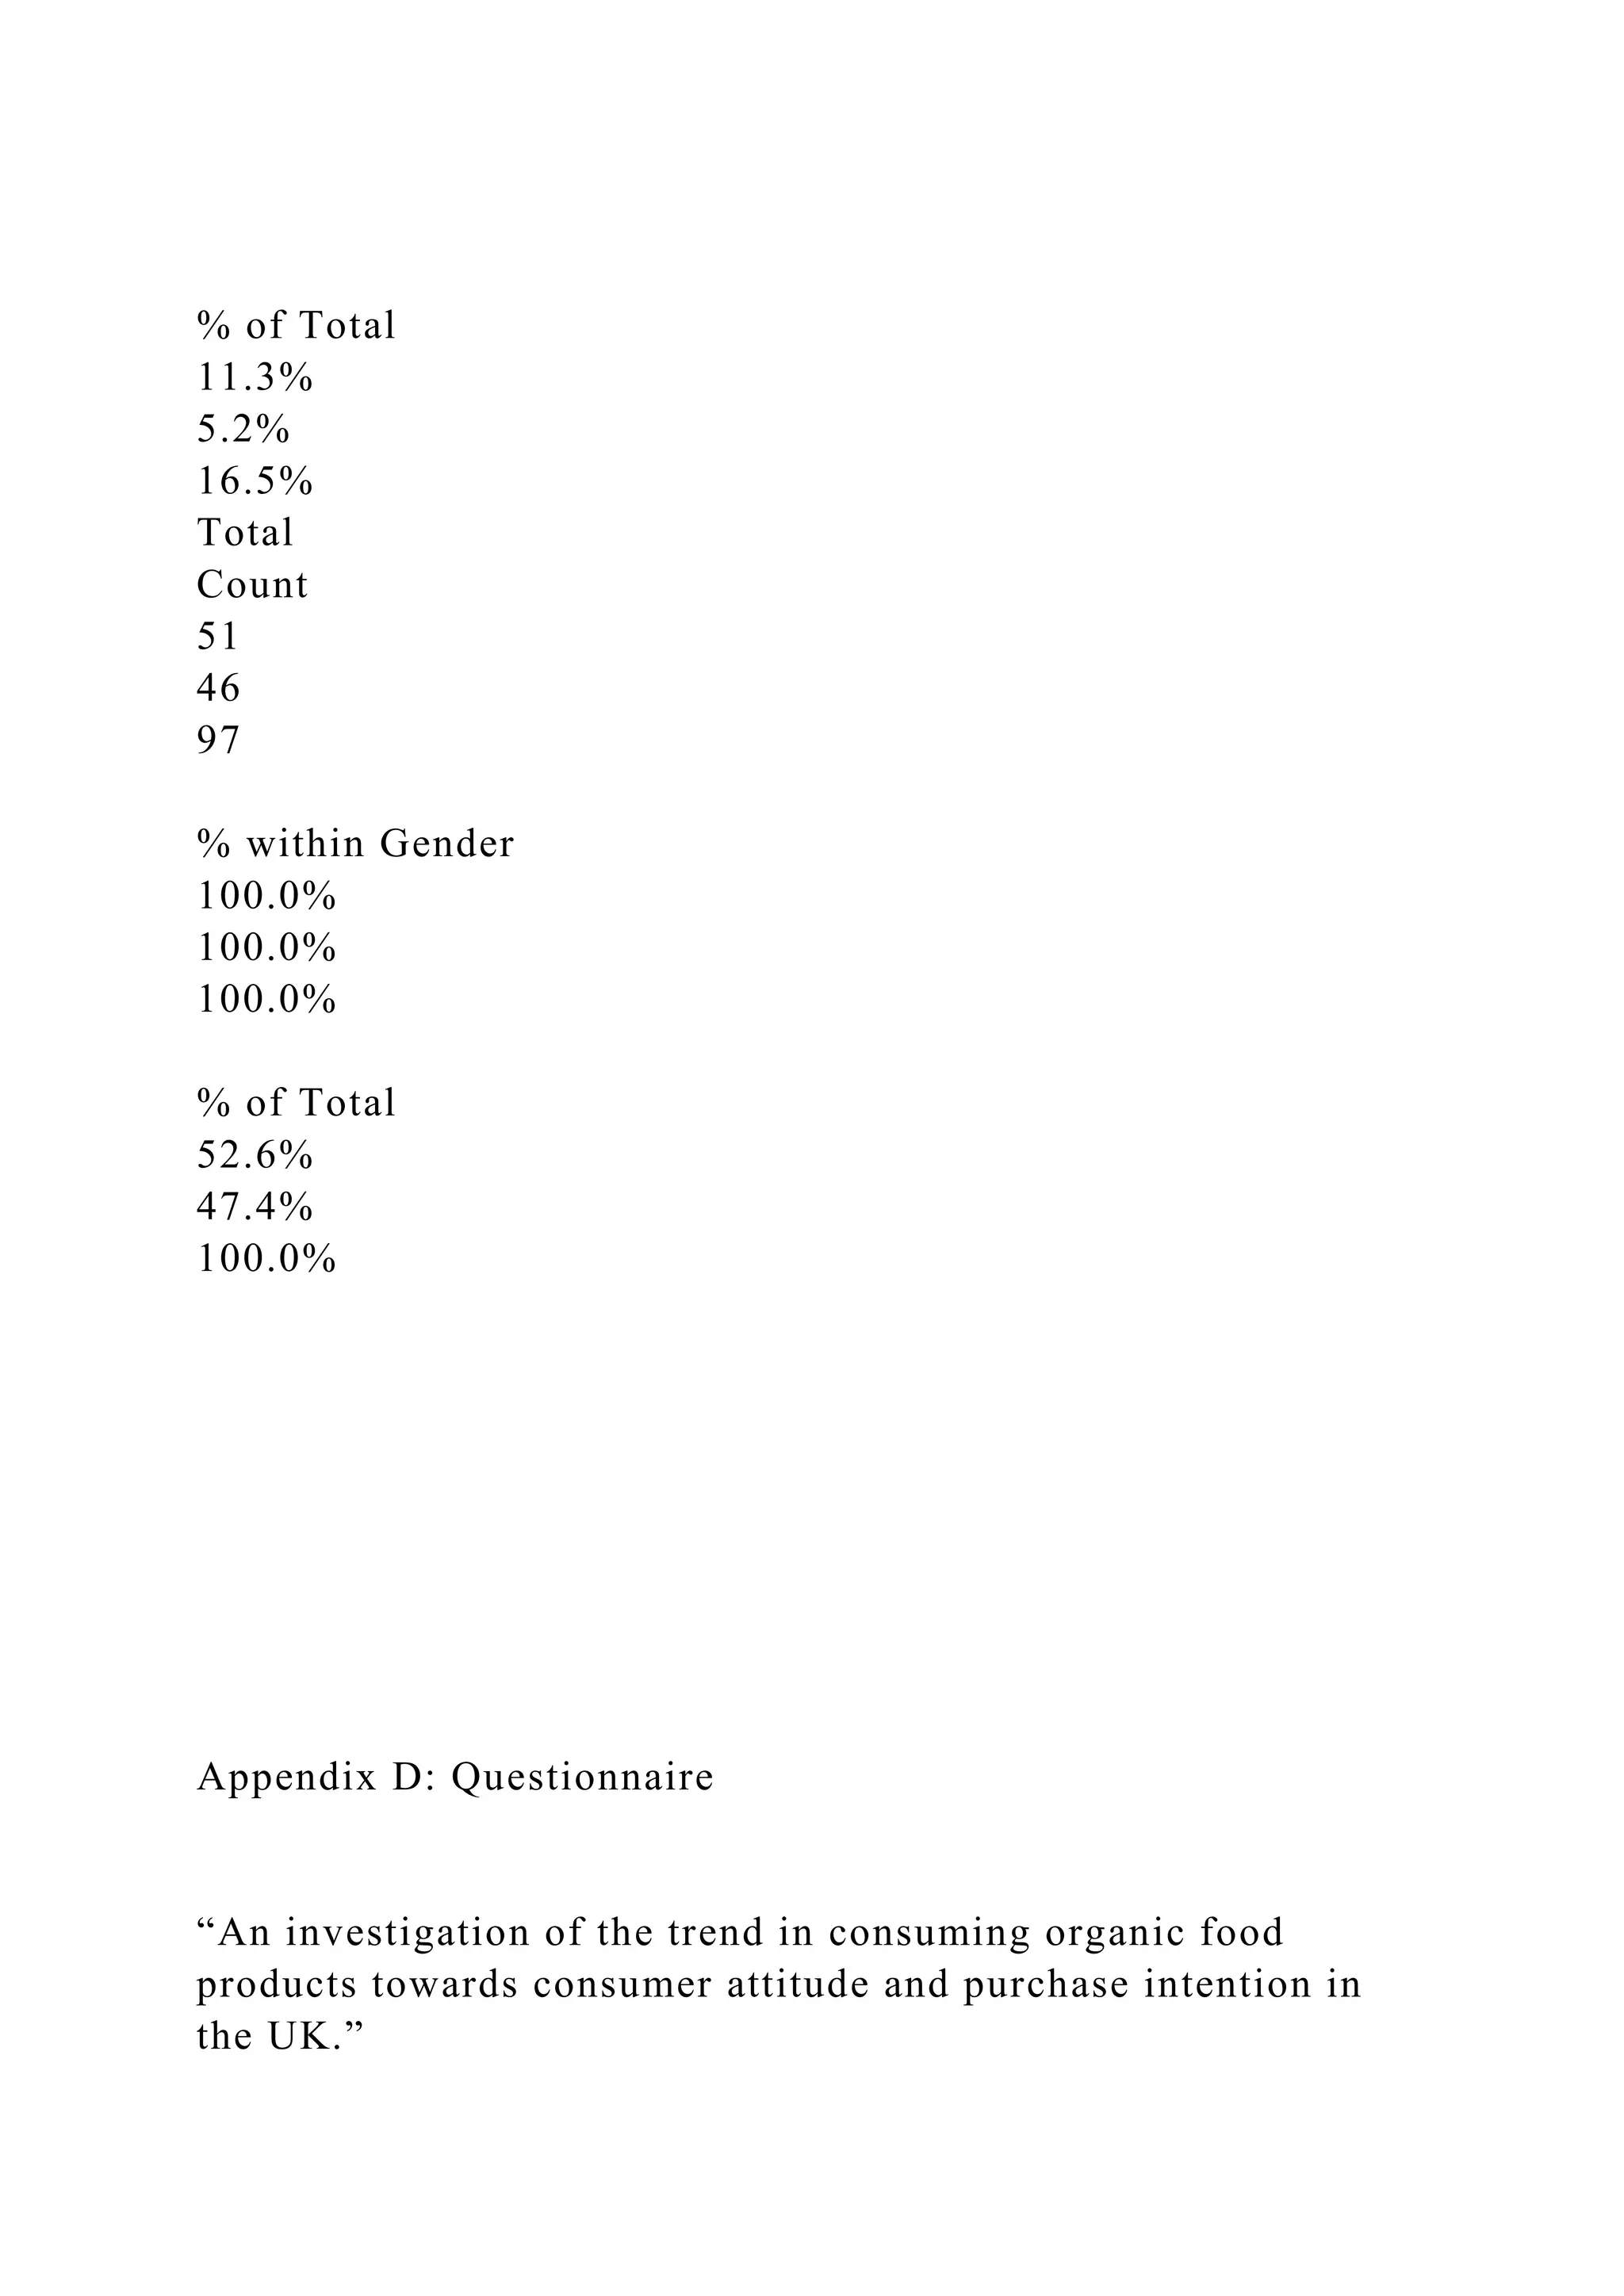
![may imply that the higher products have the organic
certification labels, the stronger determinant of purchase
intention. As a result of this, the Hypothesis 5 (H1) is accepted.
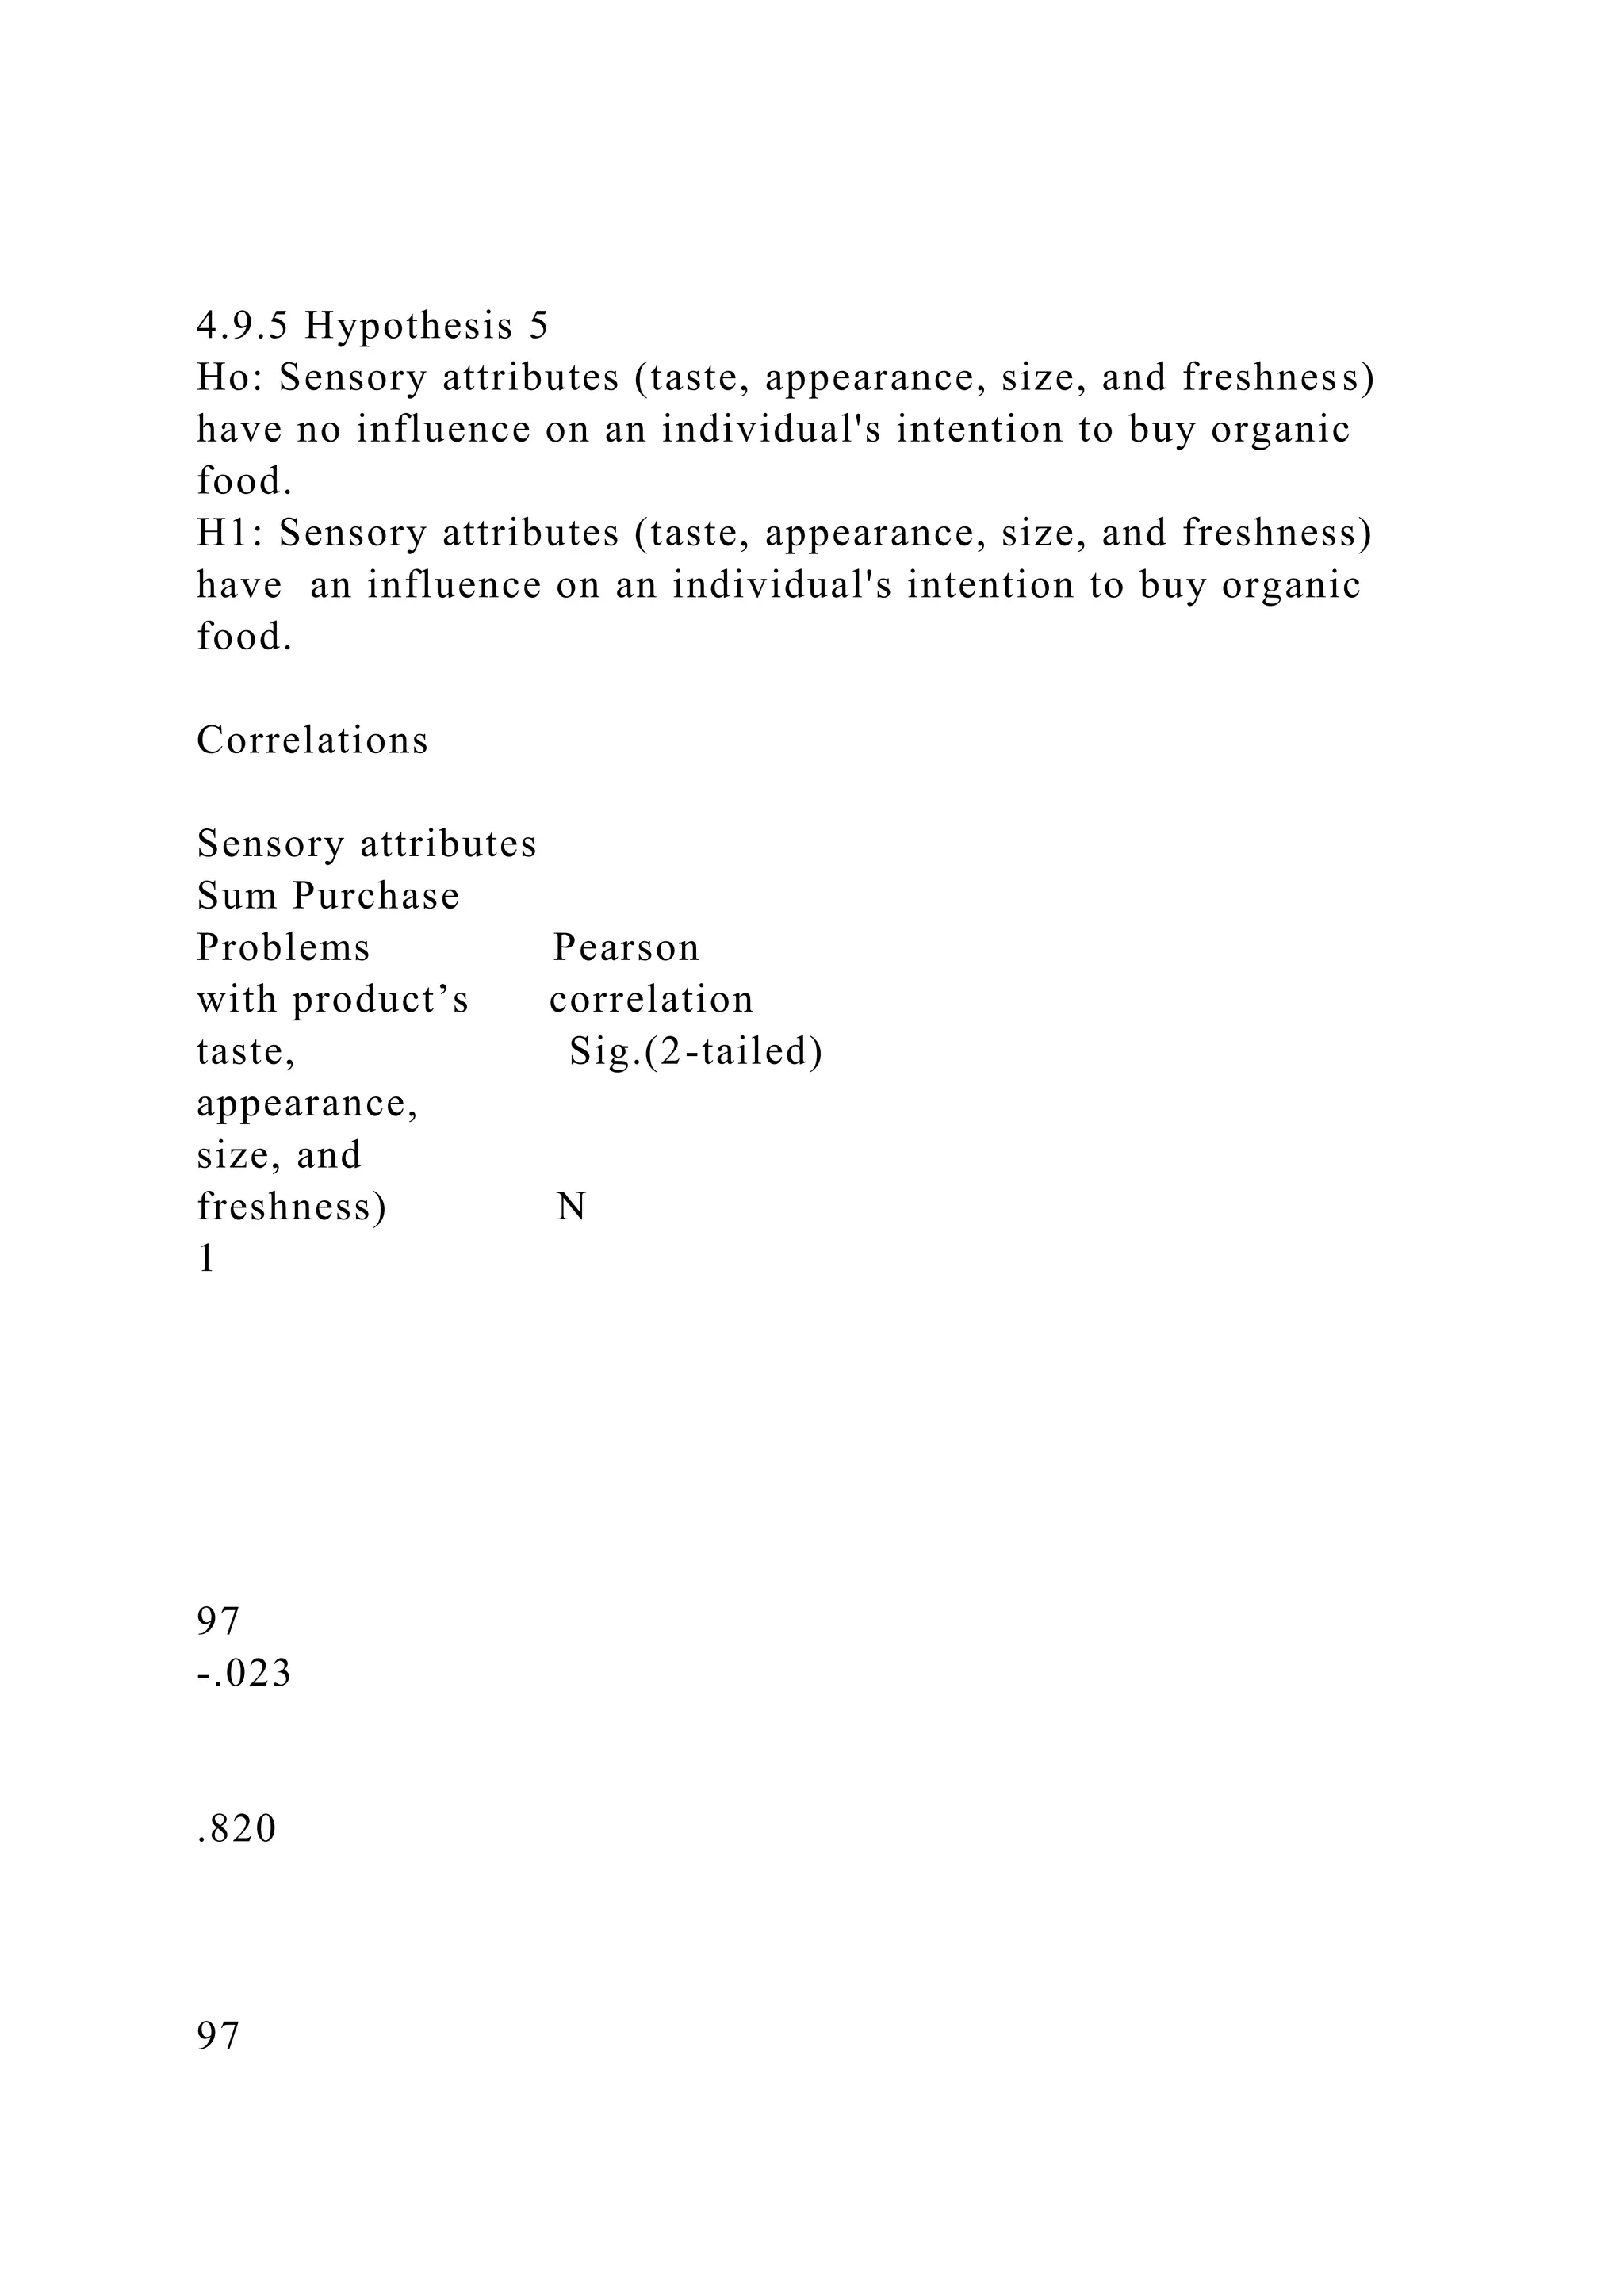
4.9.7 Hypothesis 7
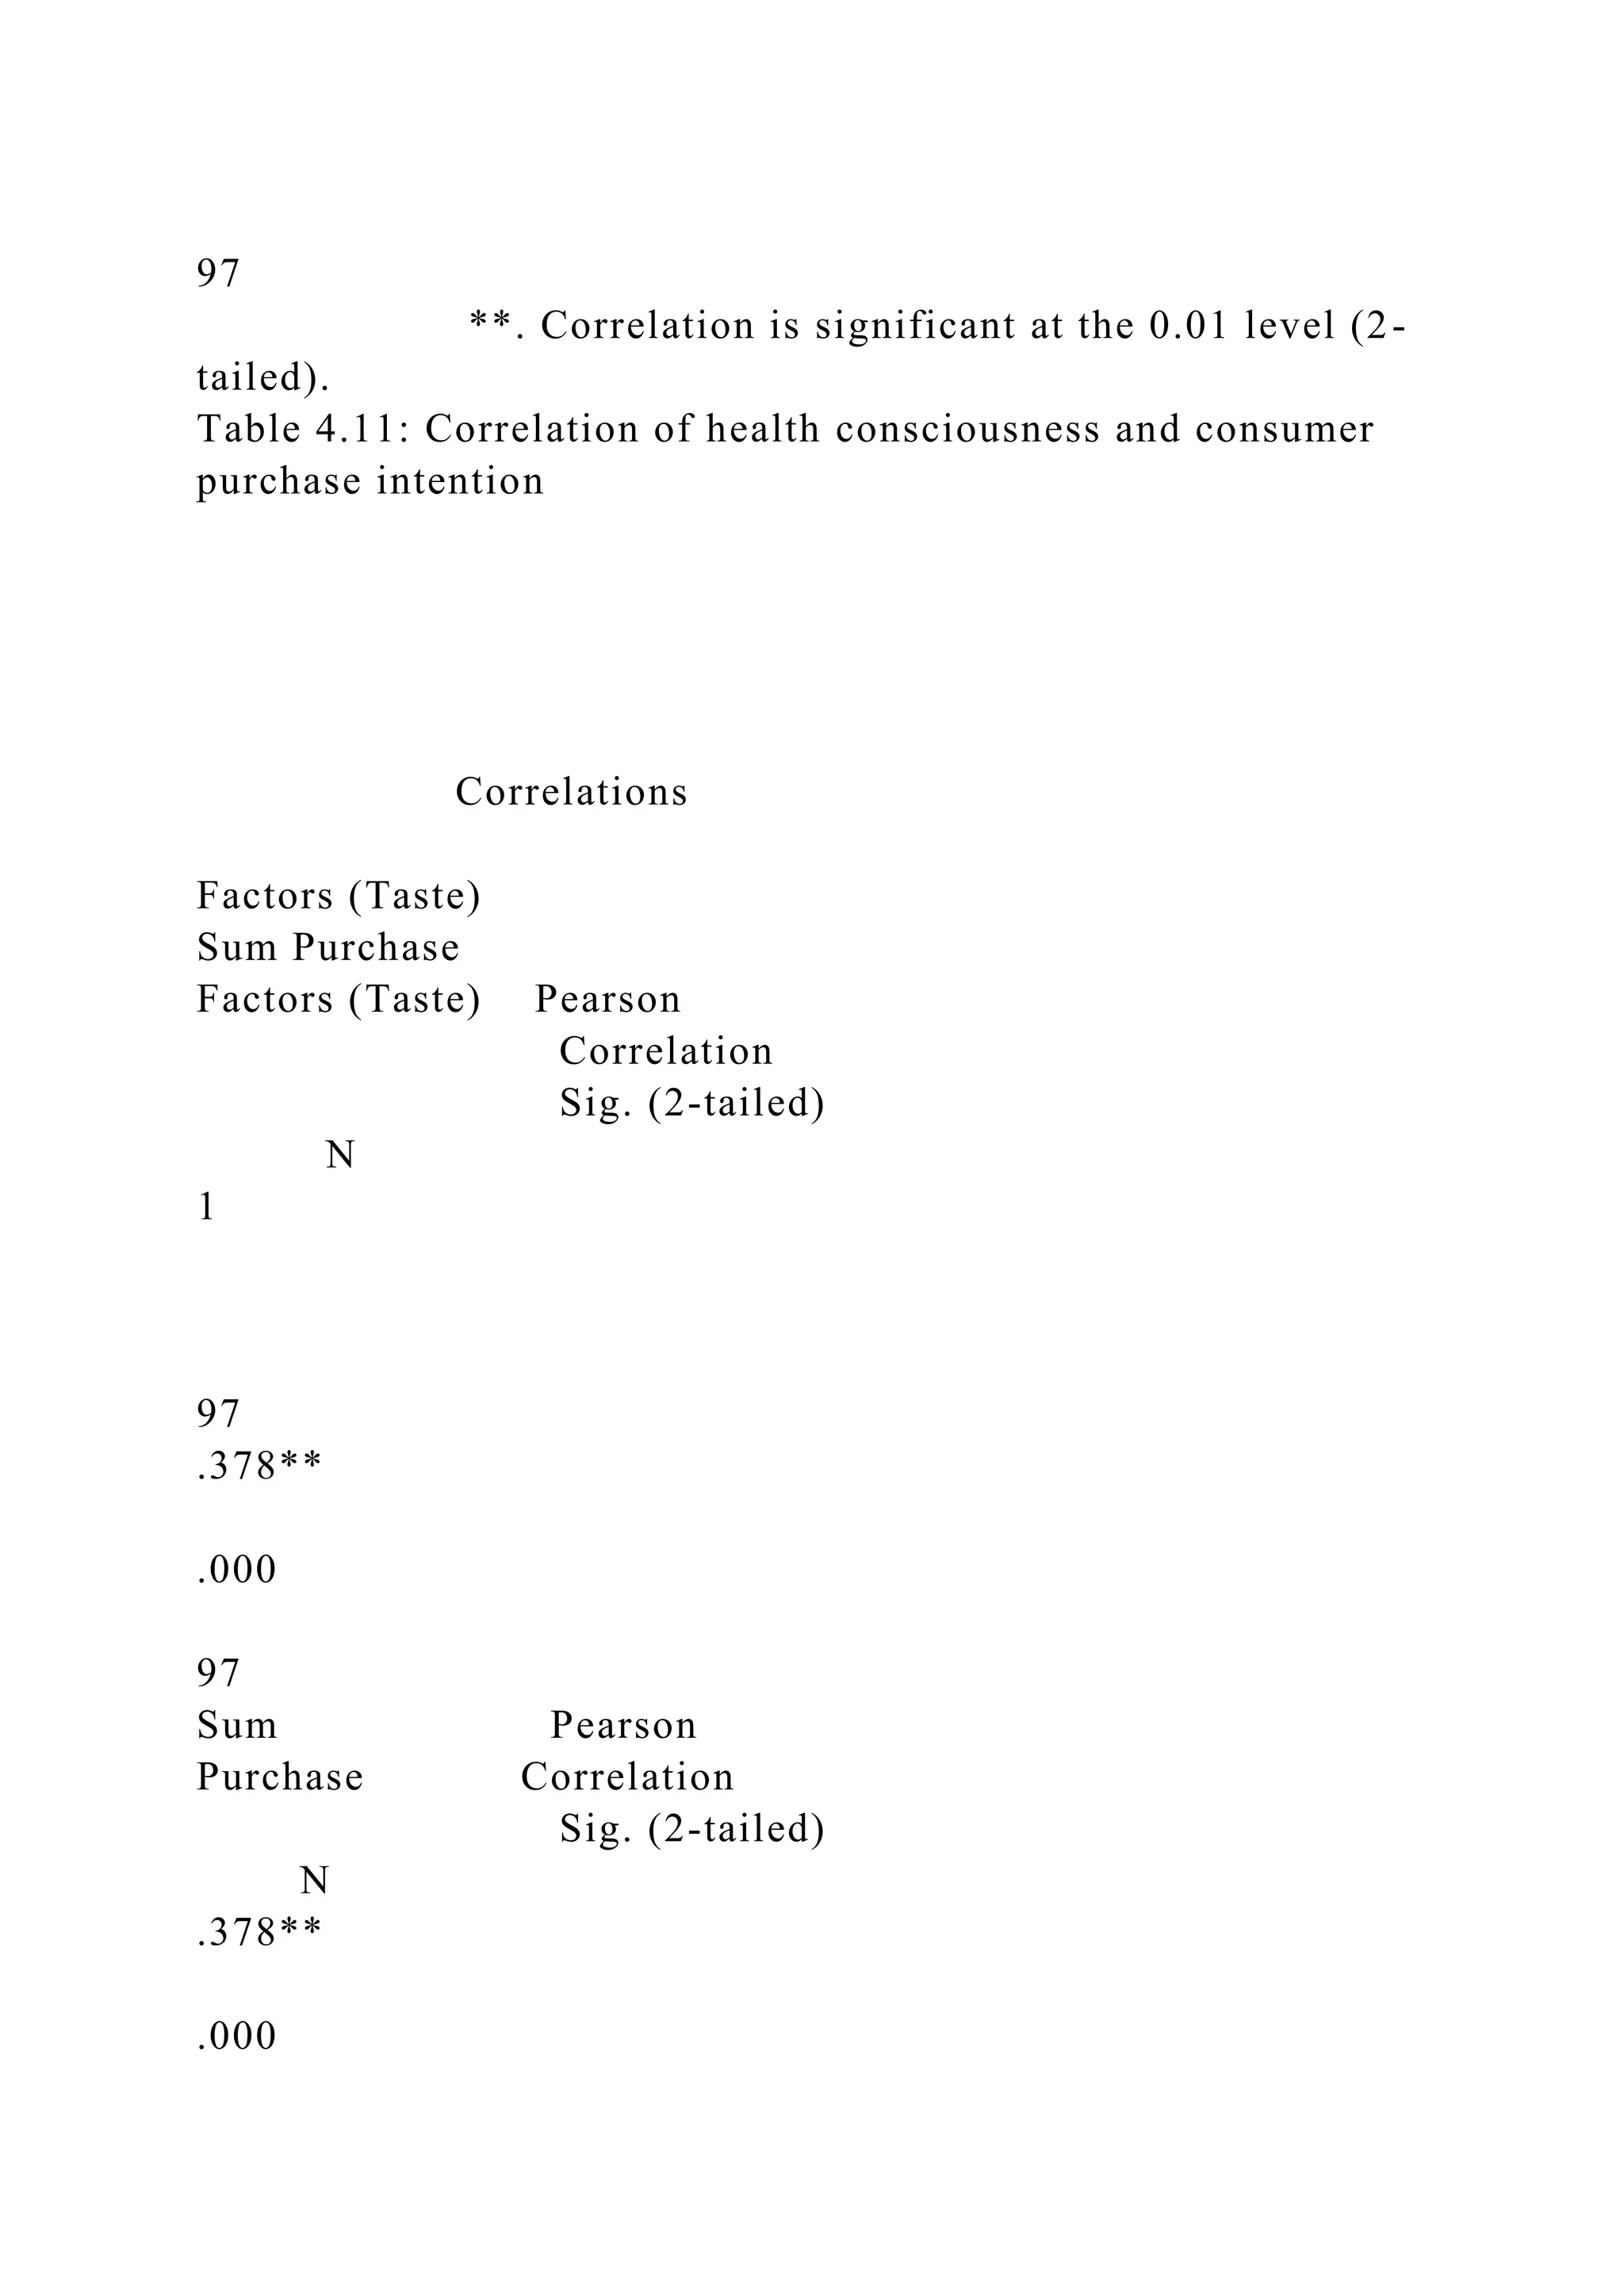
Ho: Health consciousness is not the most influential factor
which affect consumer purchase intention.
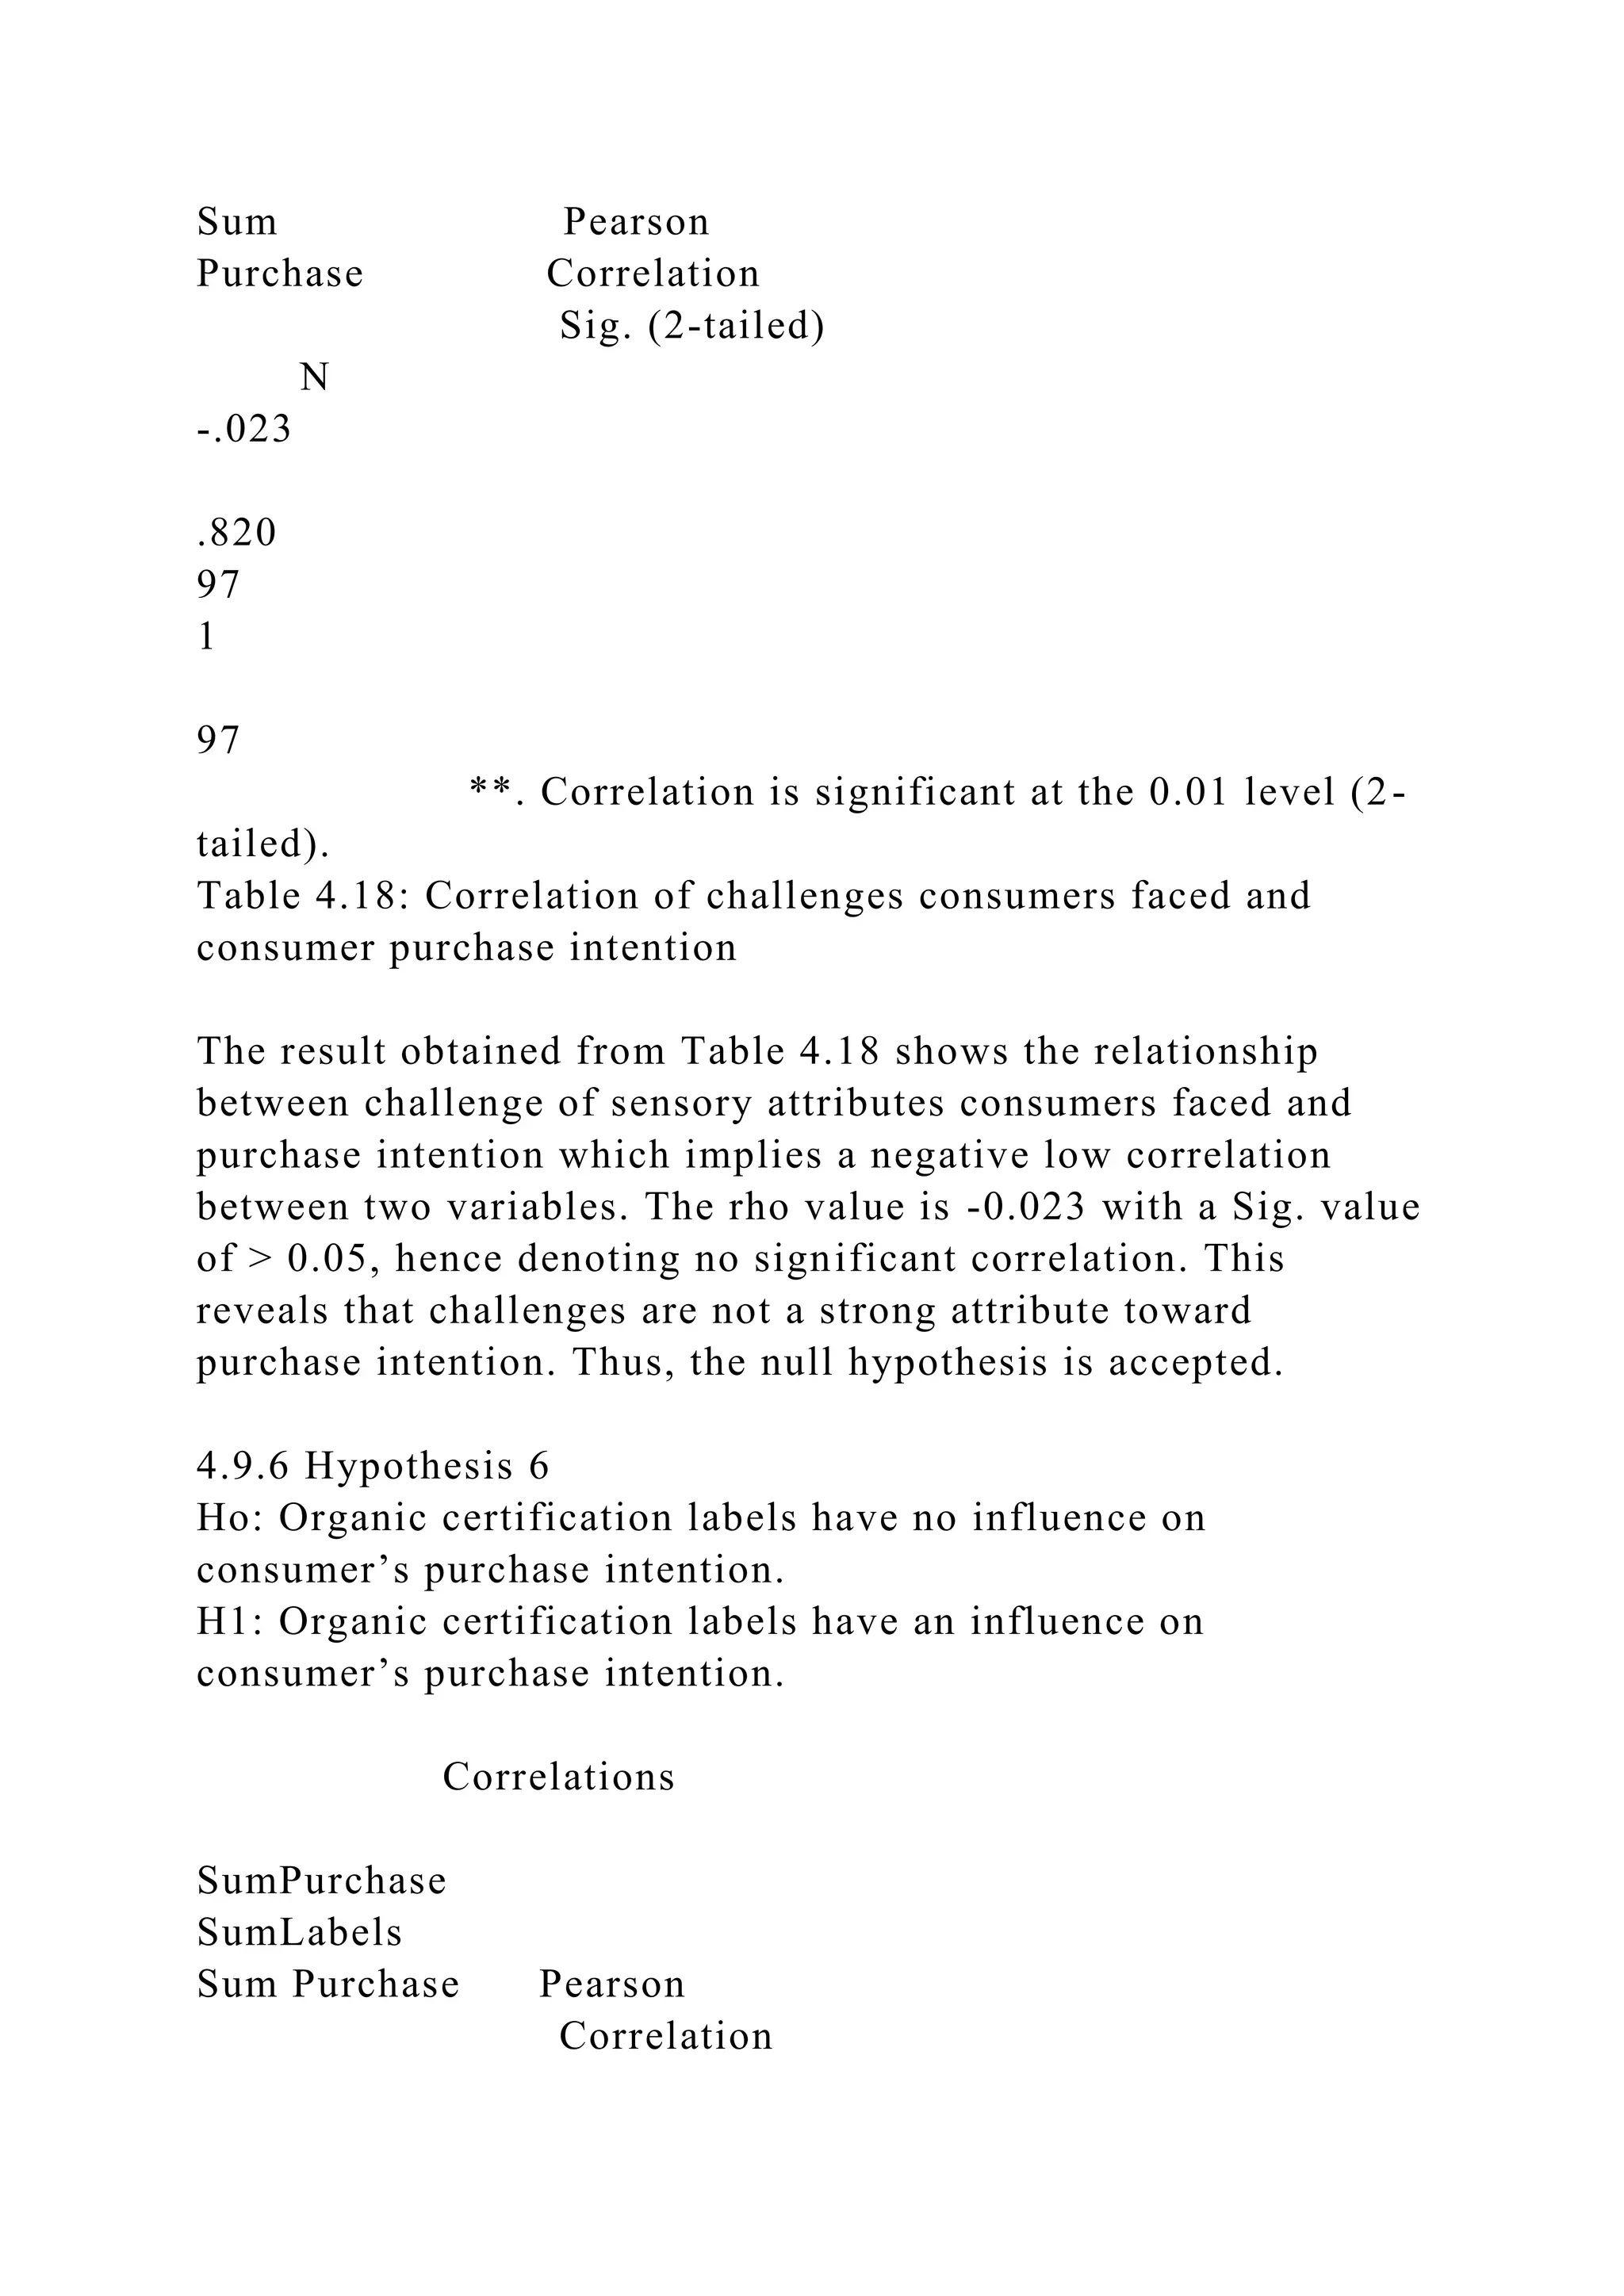
Model
Unstandardized Coefficients
Standardized Coefficients
Model
Unstandardized Coefficients
t
Sig.
1
(Constant)
2.246
.245
9.155
.000
Factors [Health
consciousness]
.156
.084
.250
1.855
.067
Factors [Taste]
.126
.059](https://image.slidesharecdn.com/submittedinpartfulfilmentoftherequirementsforthedegreeof-230119024927-31555ff9/75/Submitted-in-part-fulfilment-of-the-requirements-for-the-degree-of-docx-82-2048.jpg)
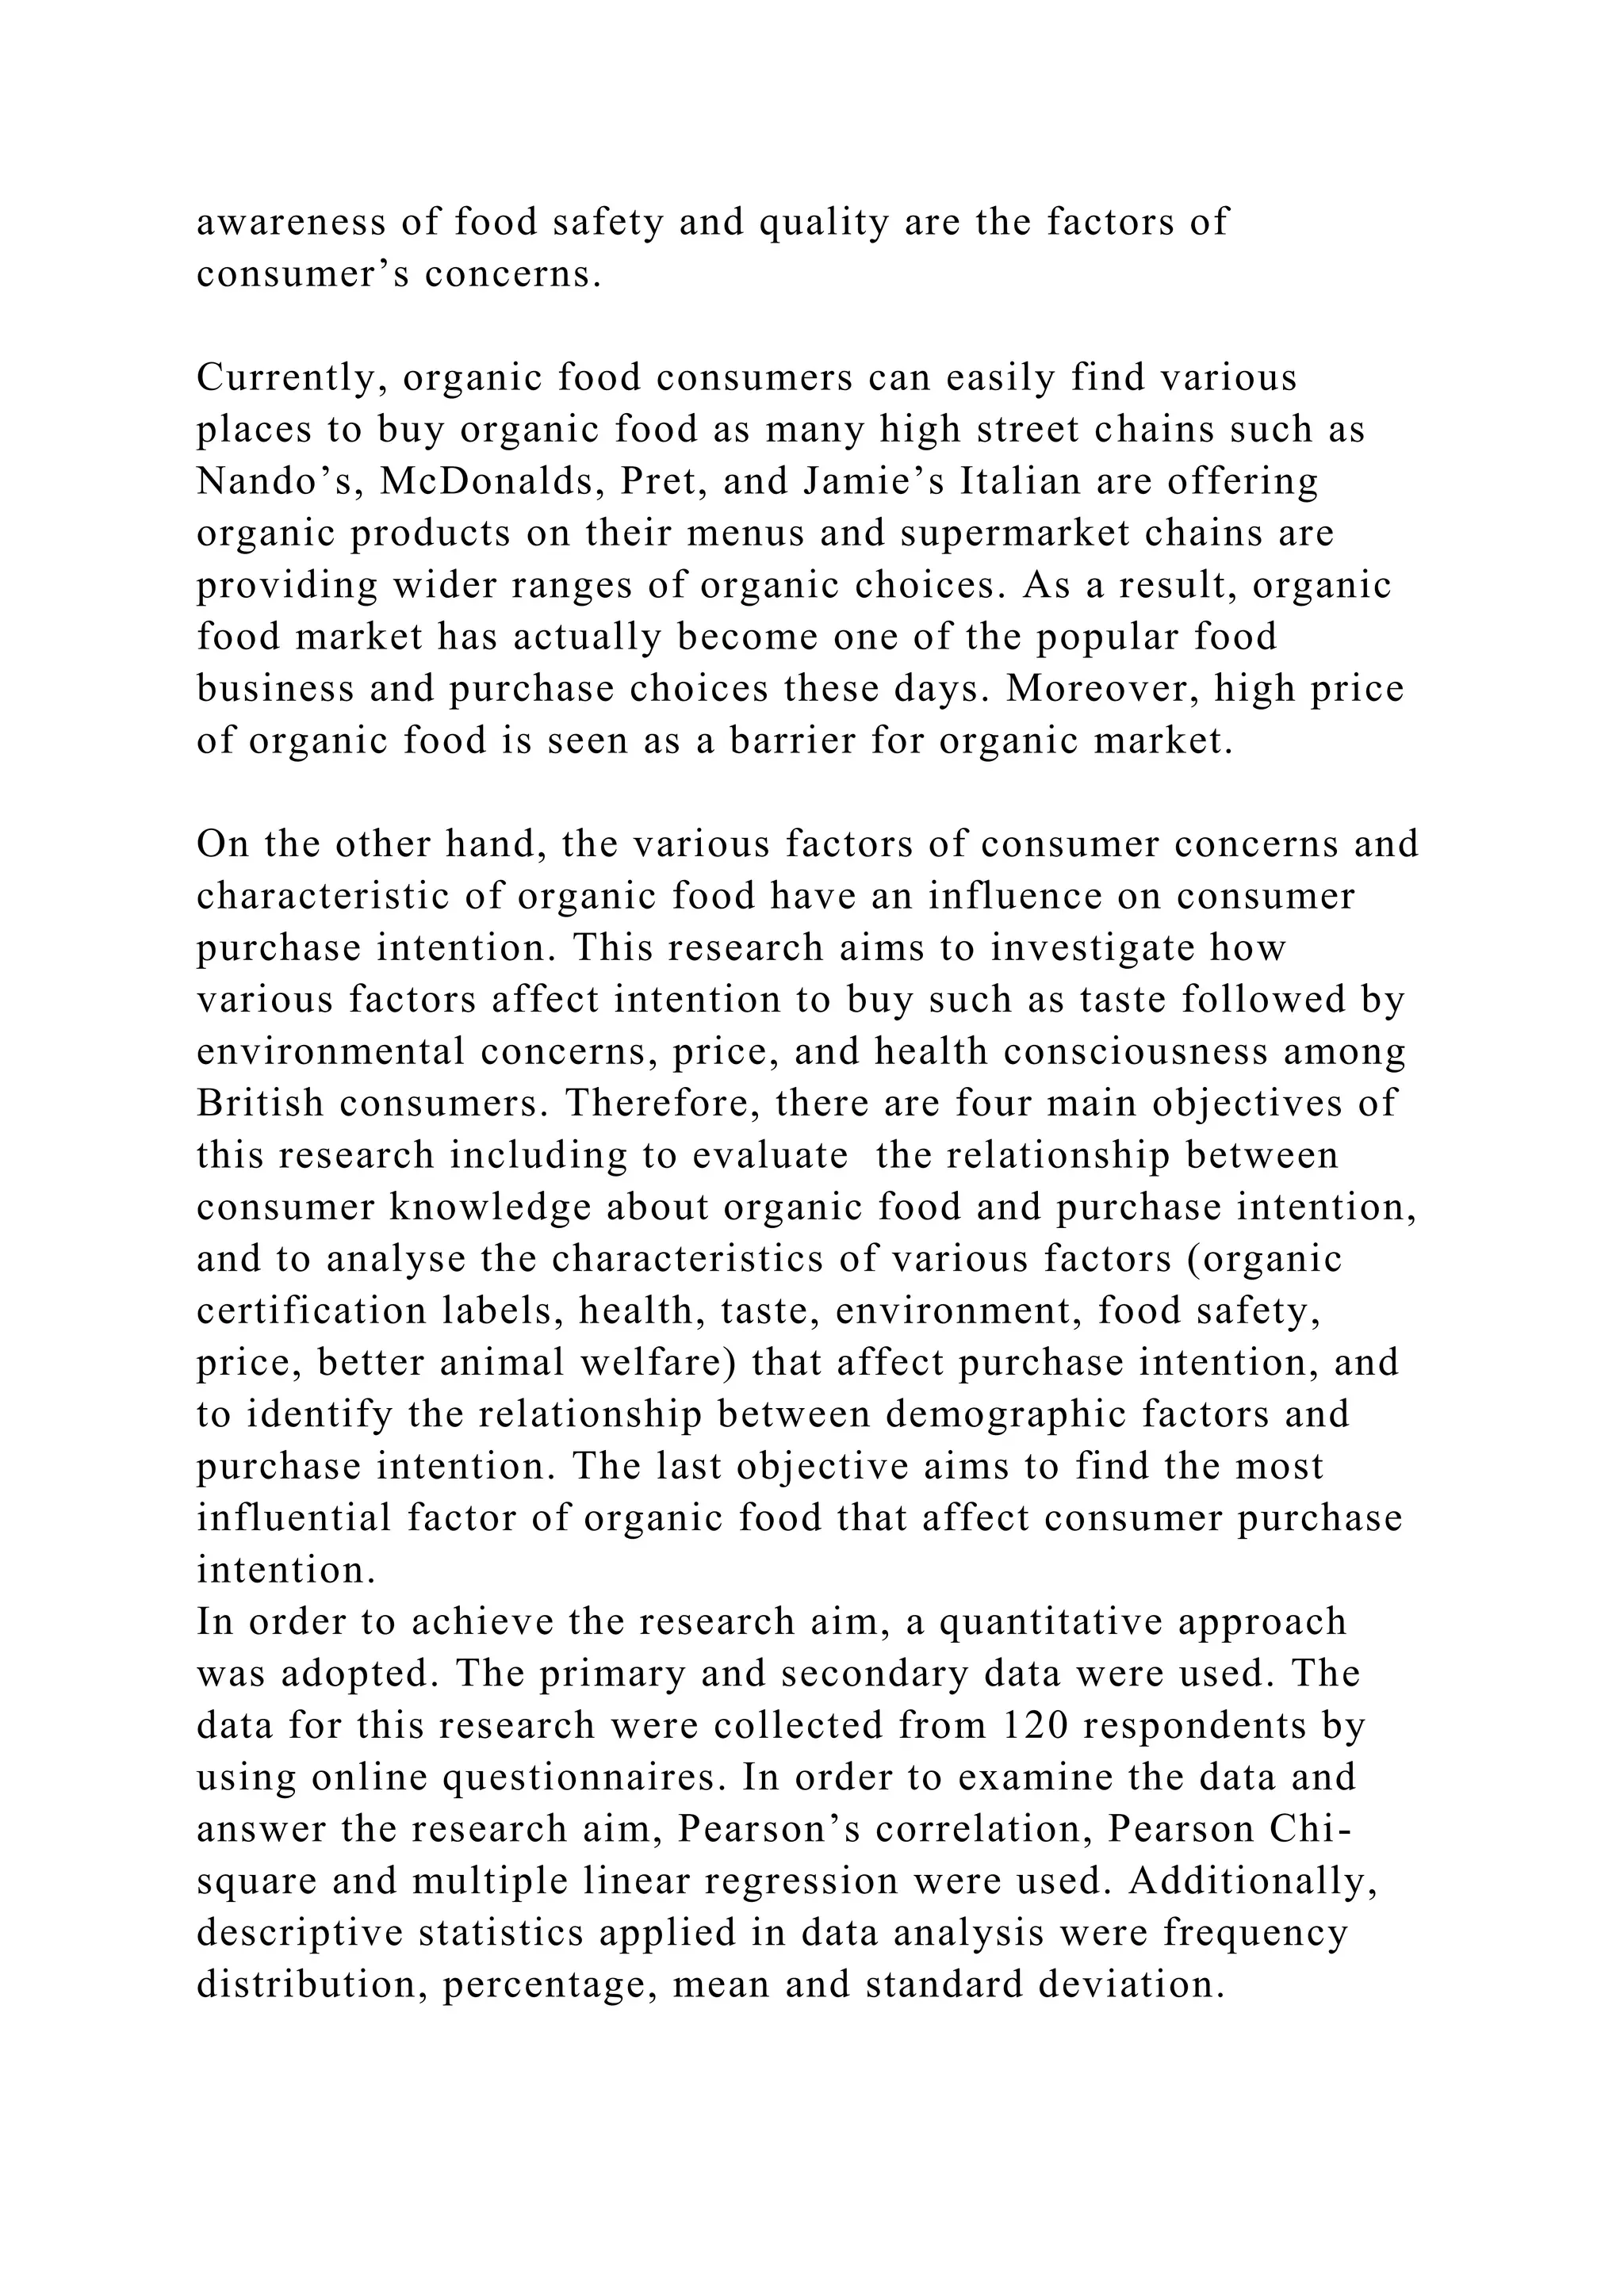
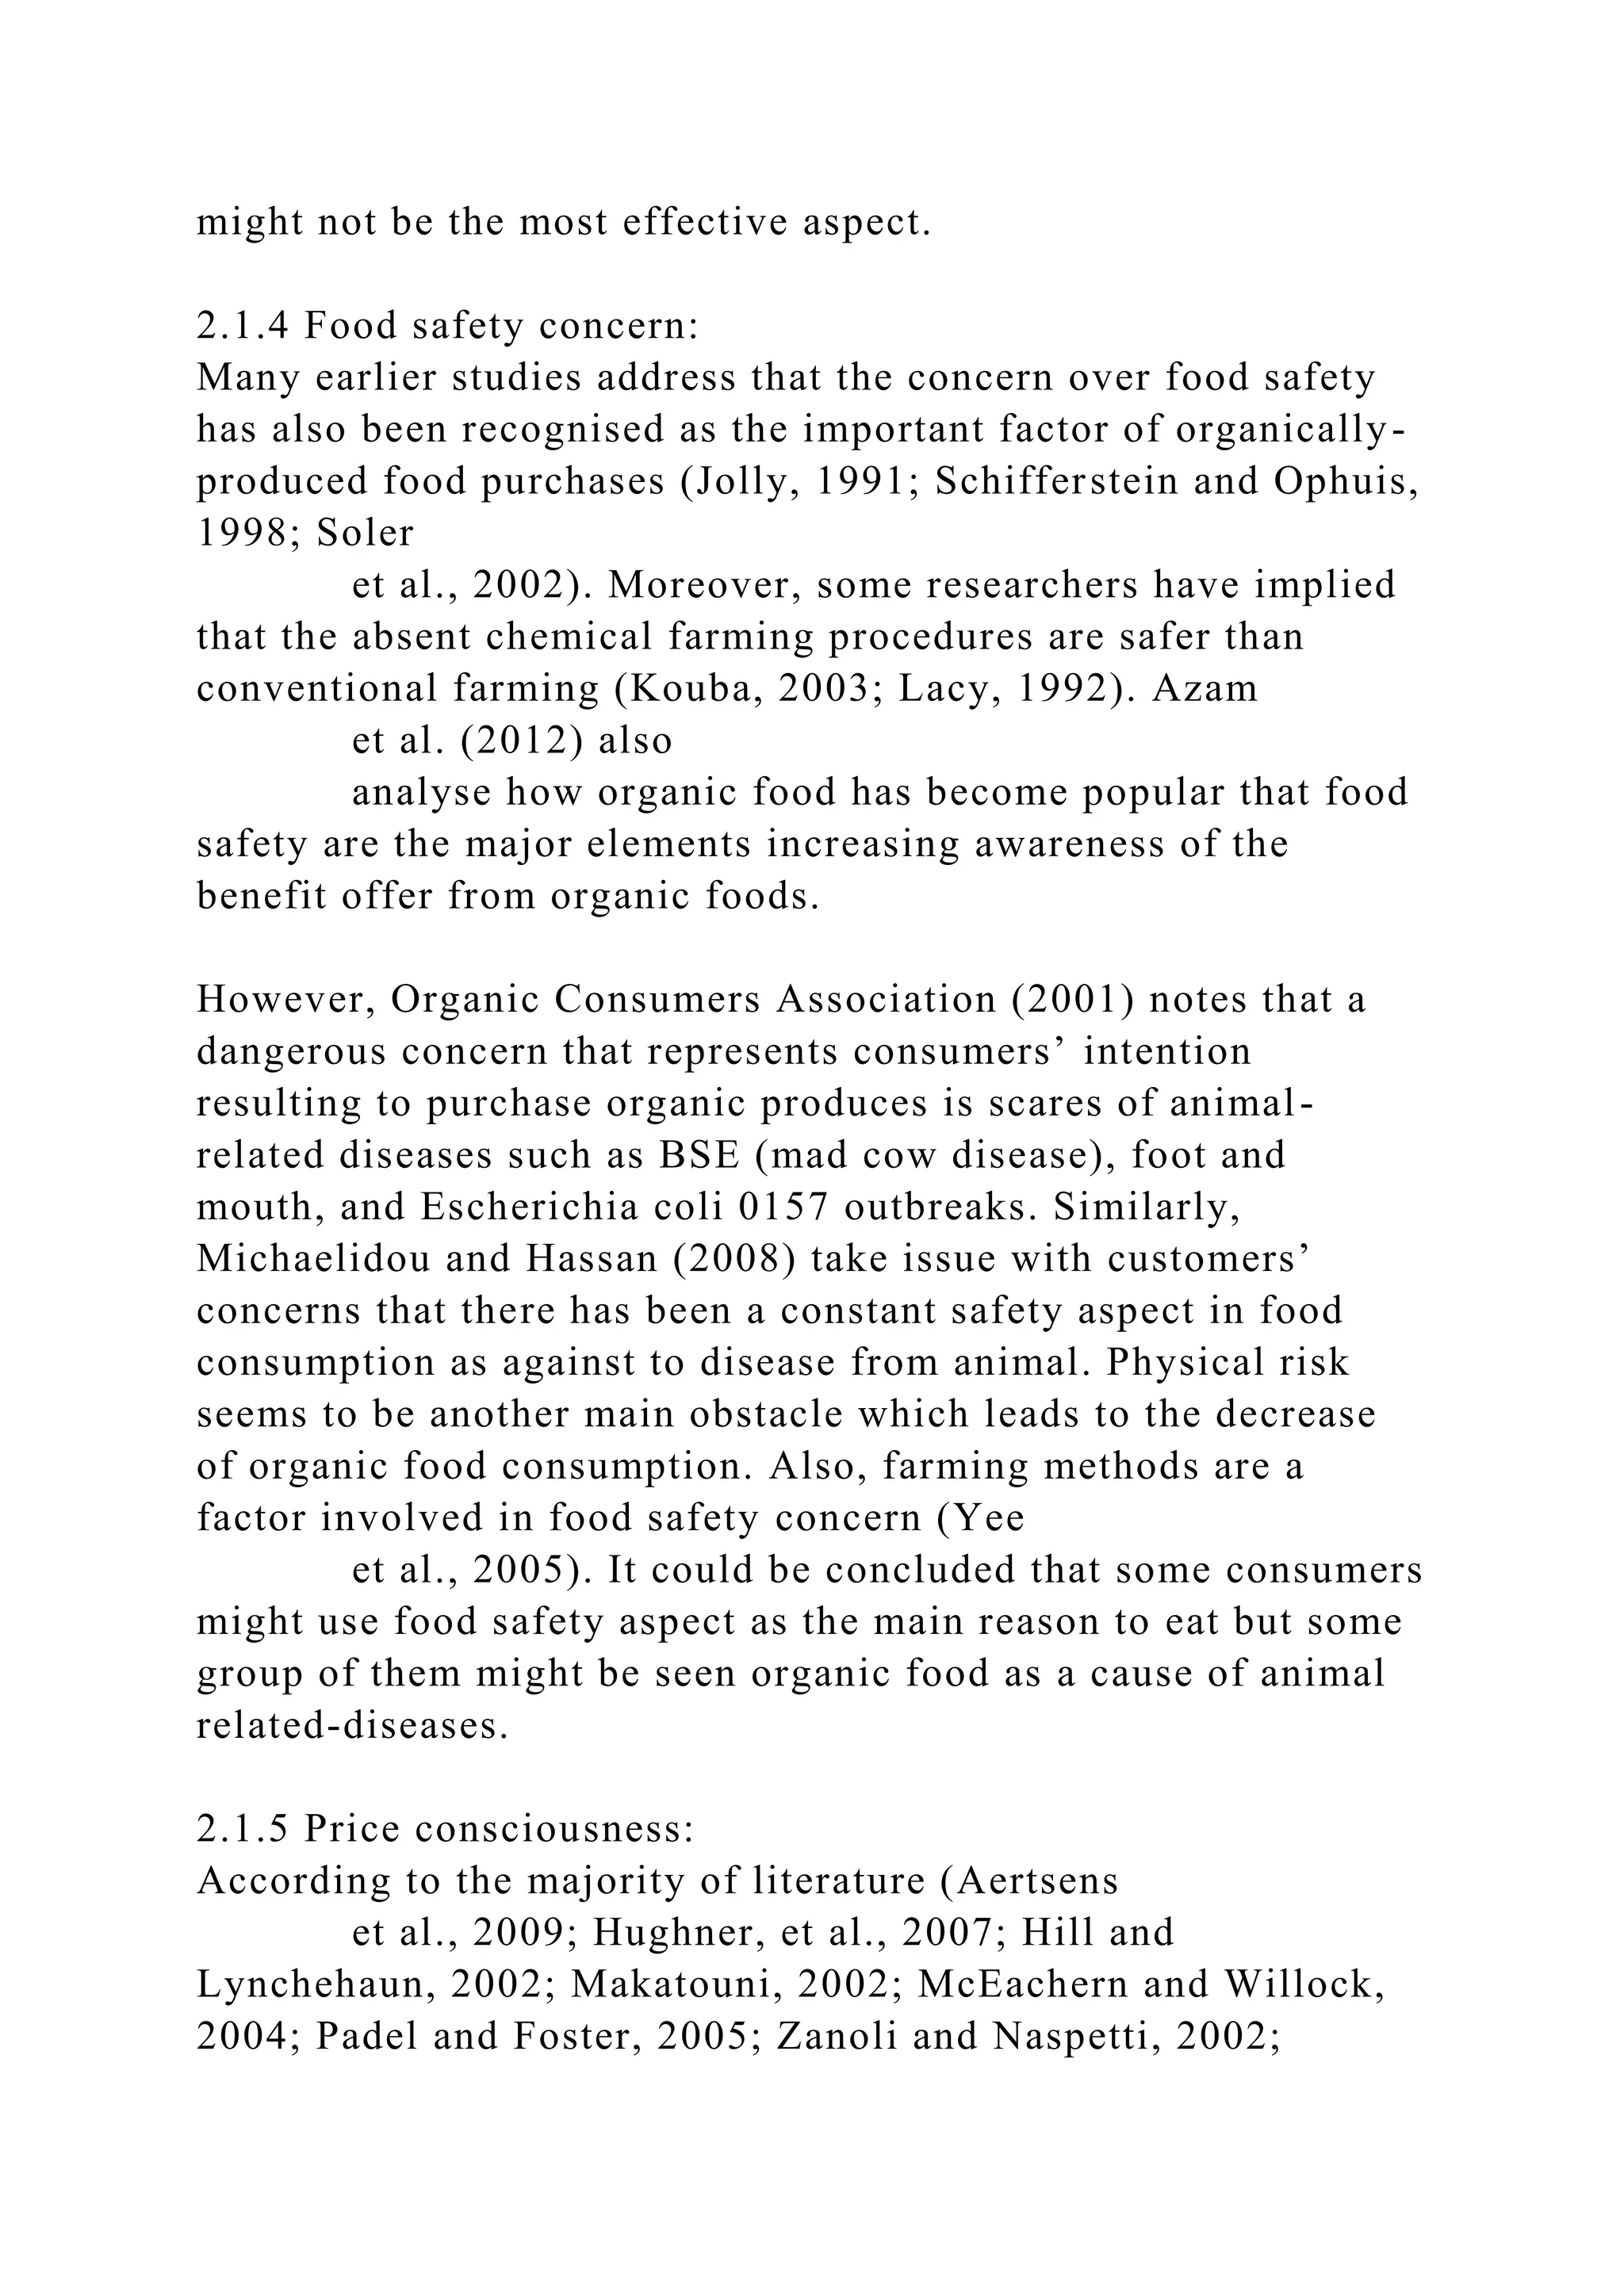
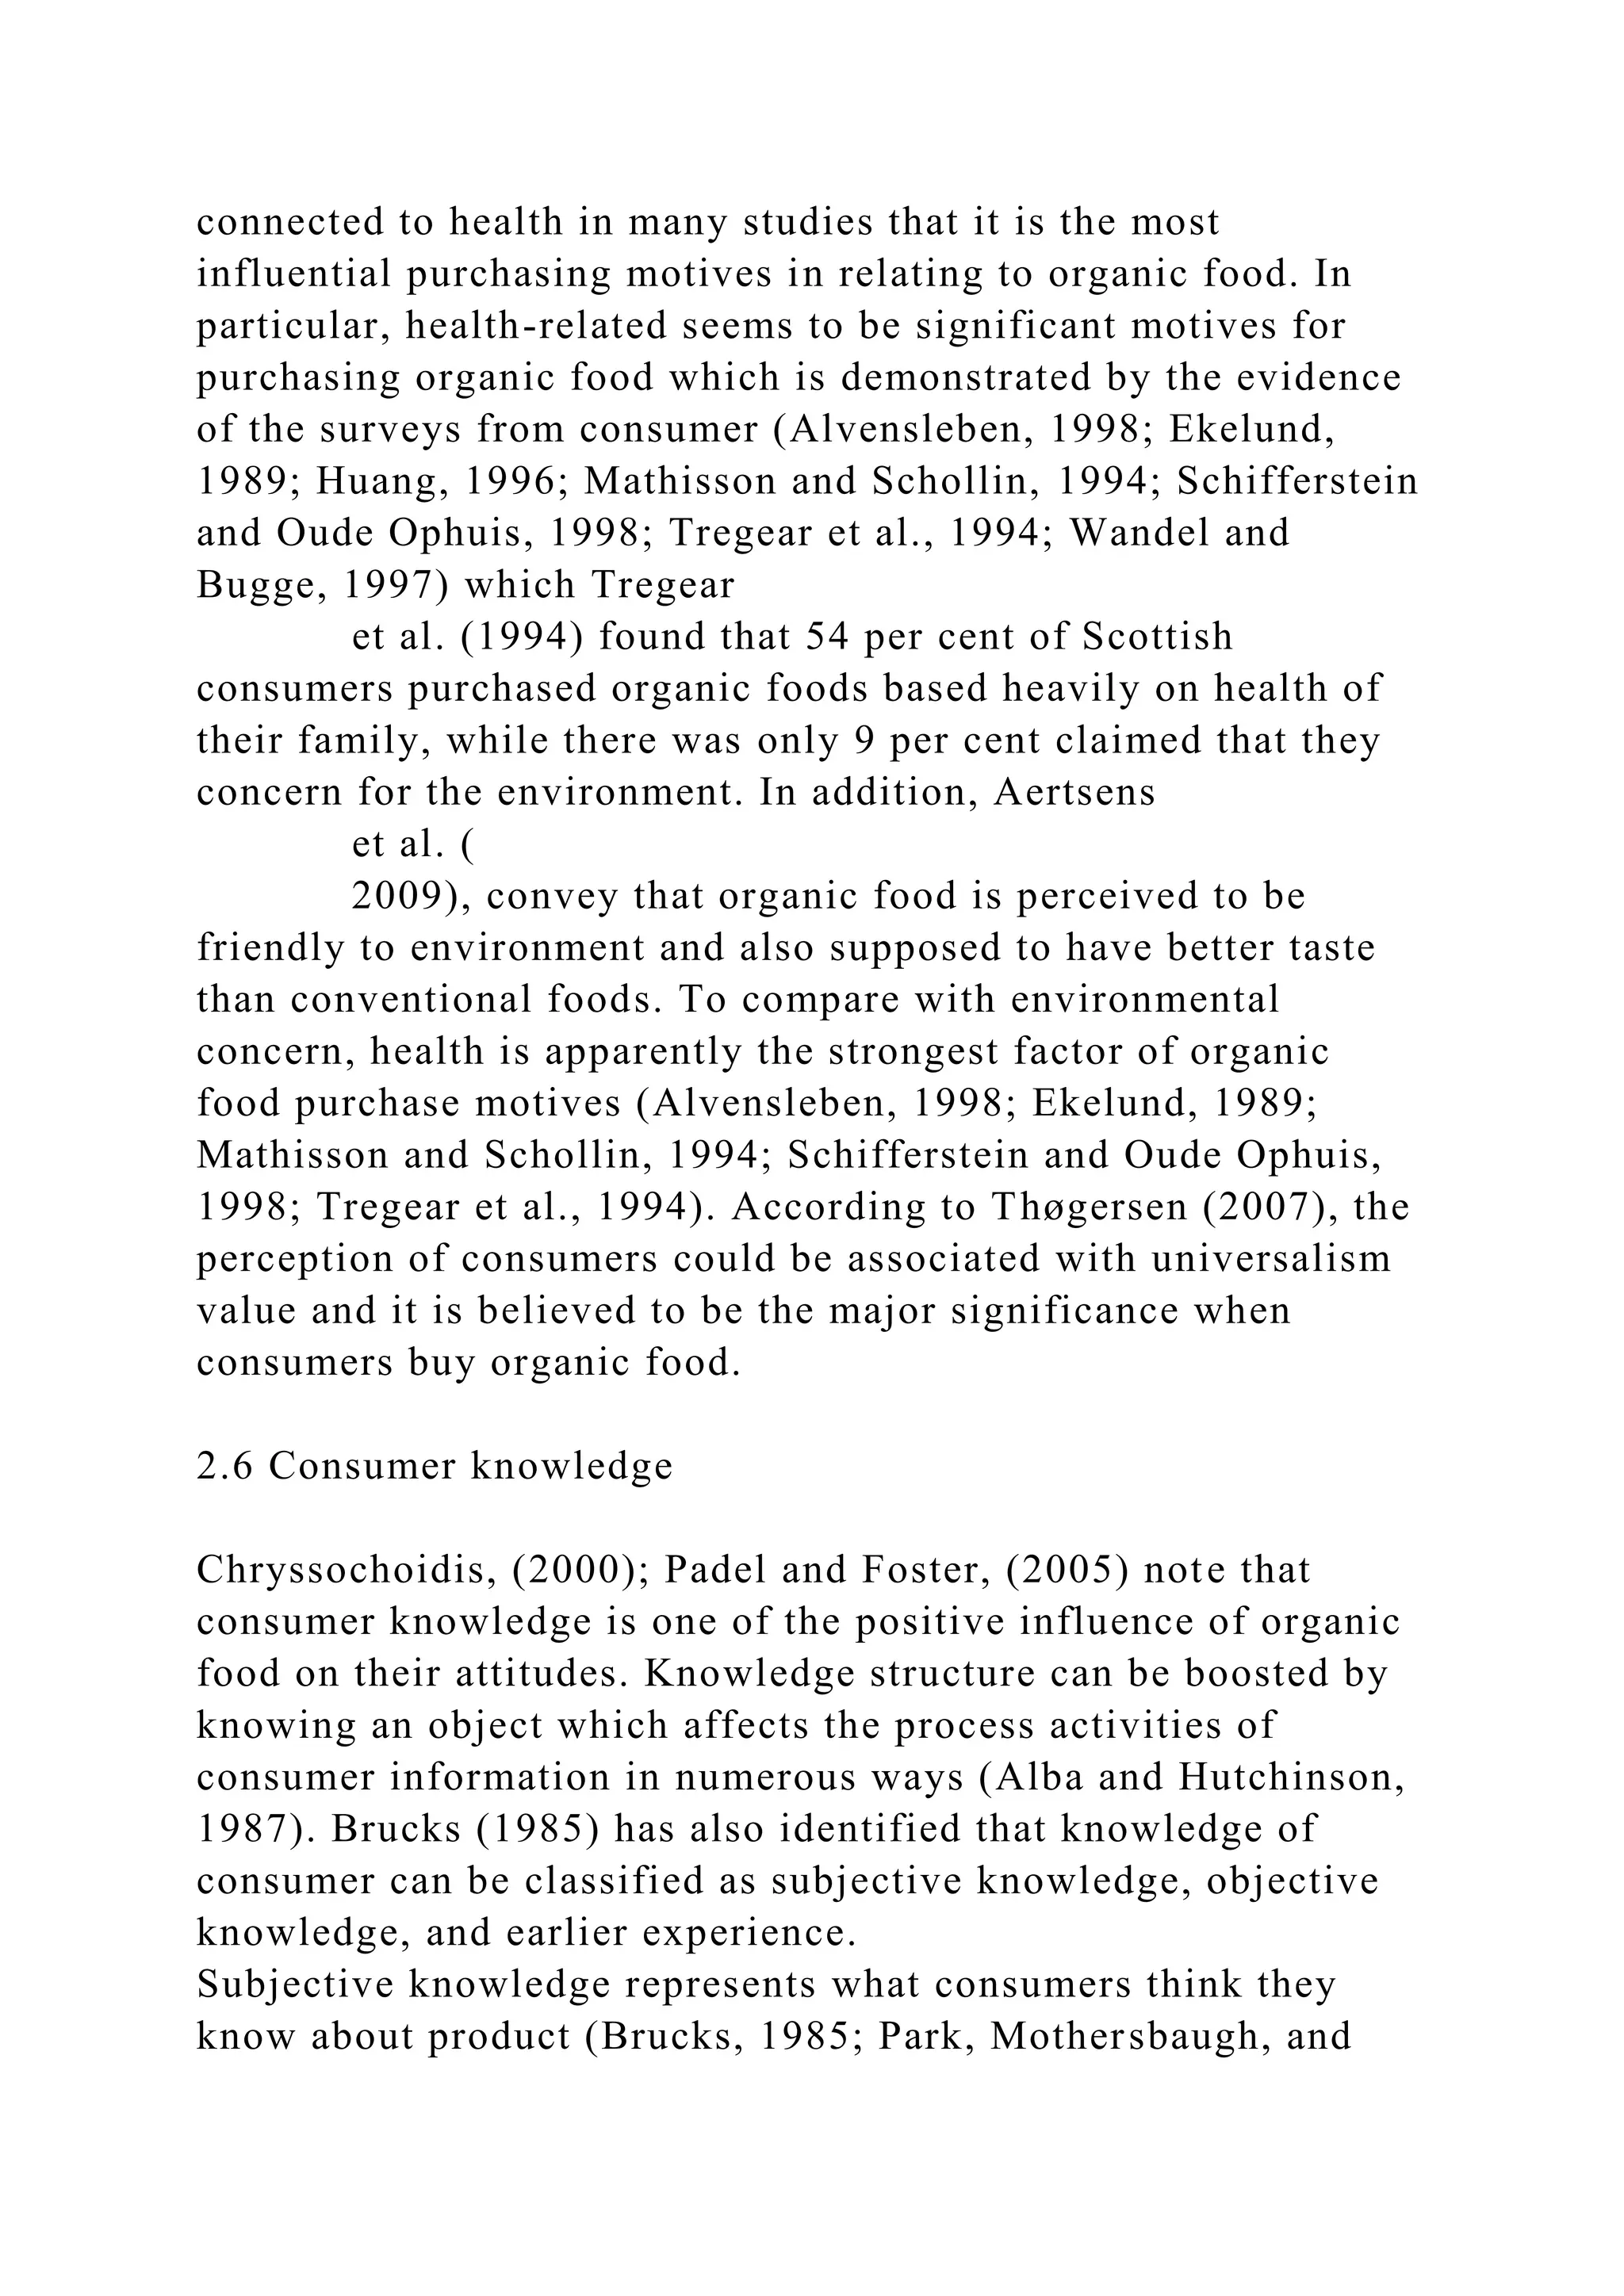
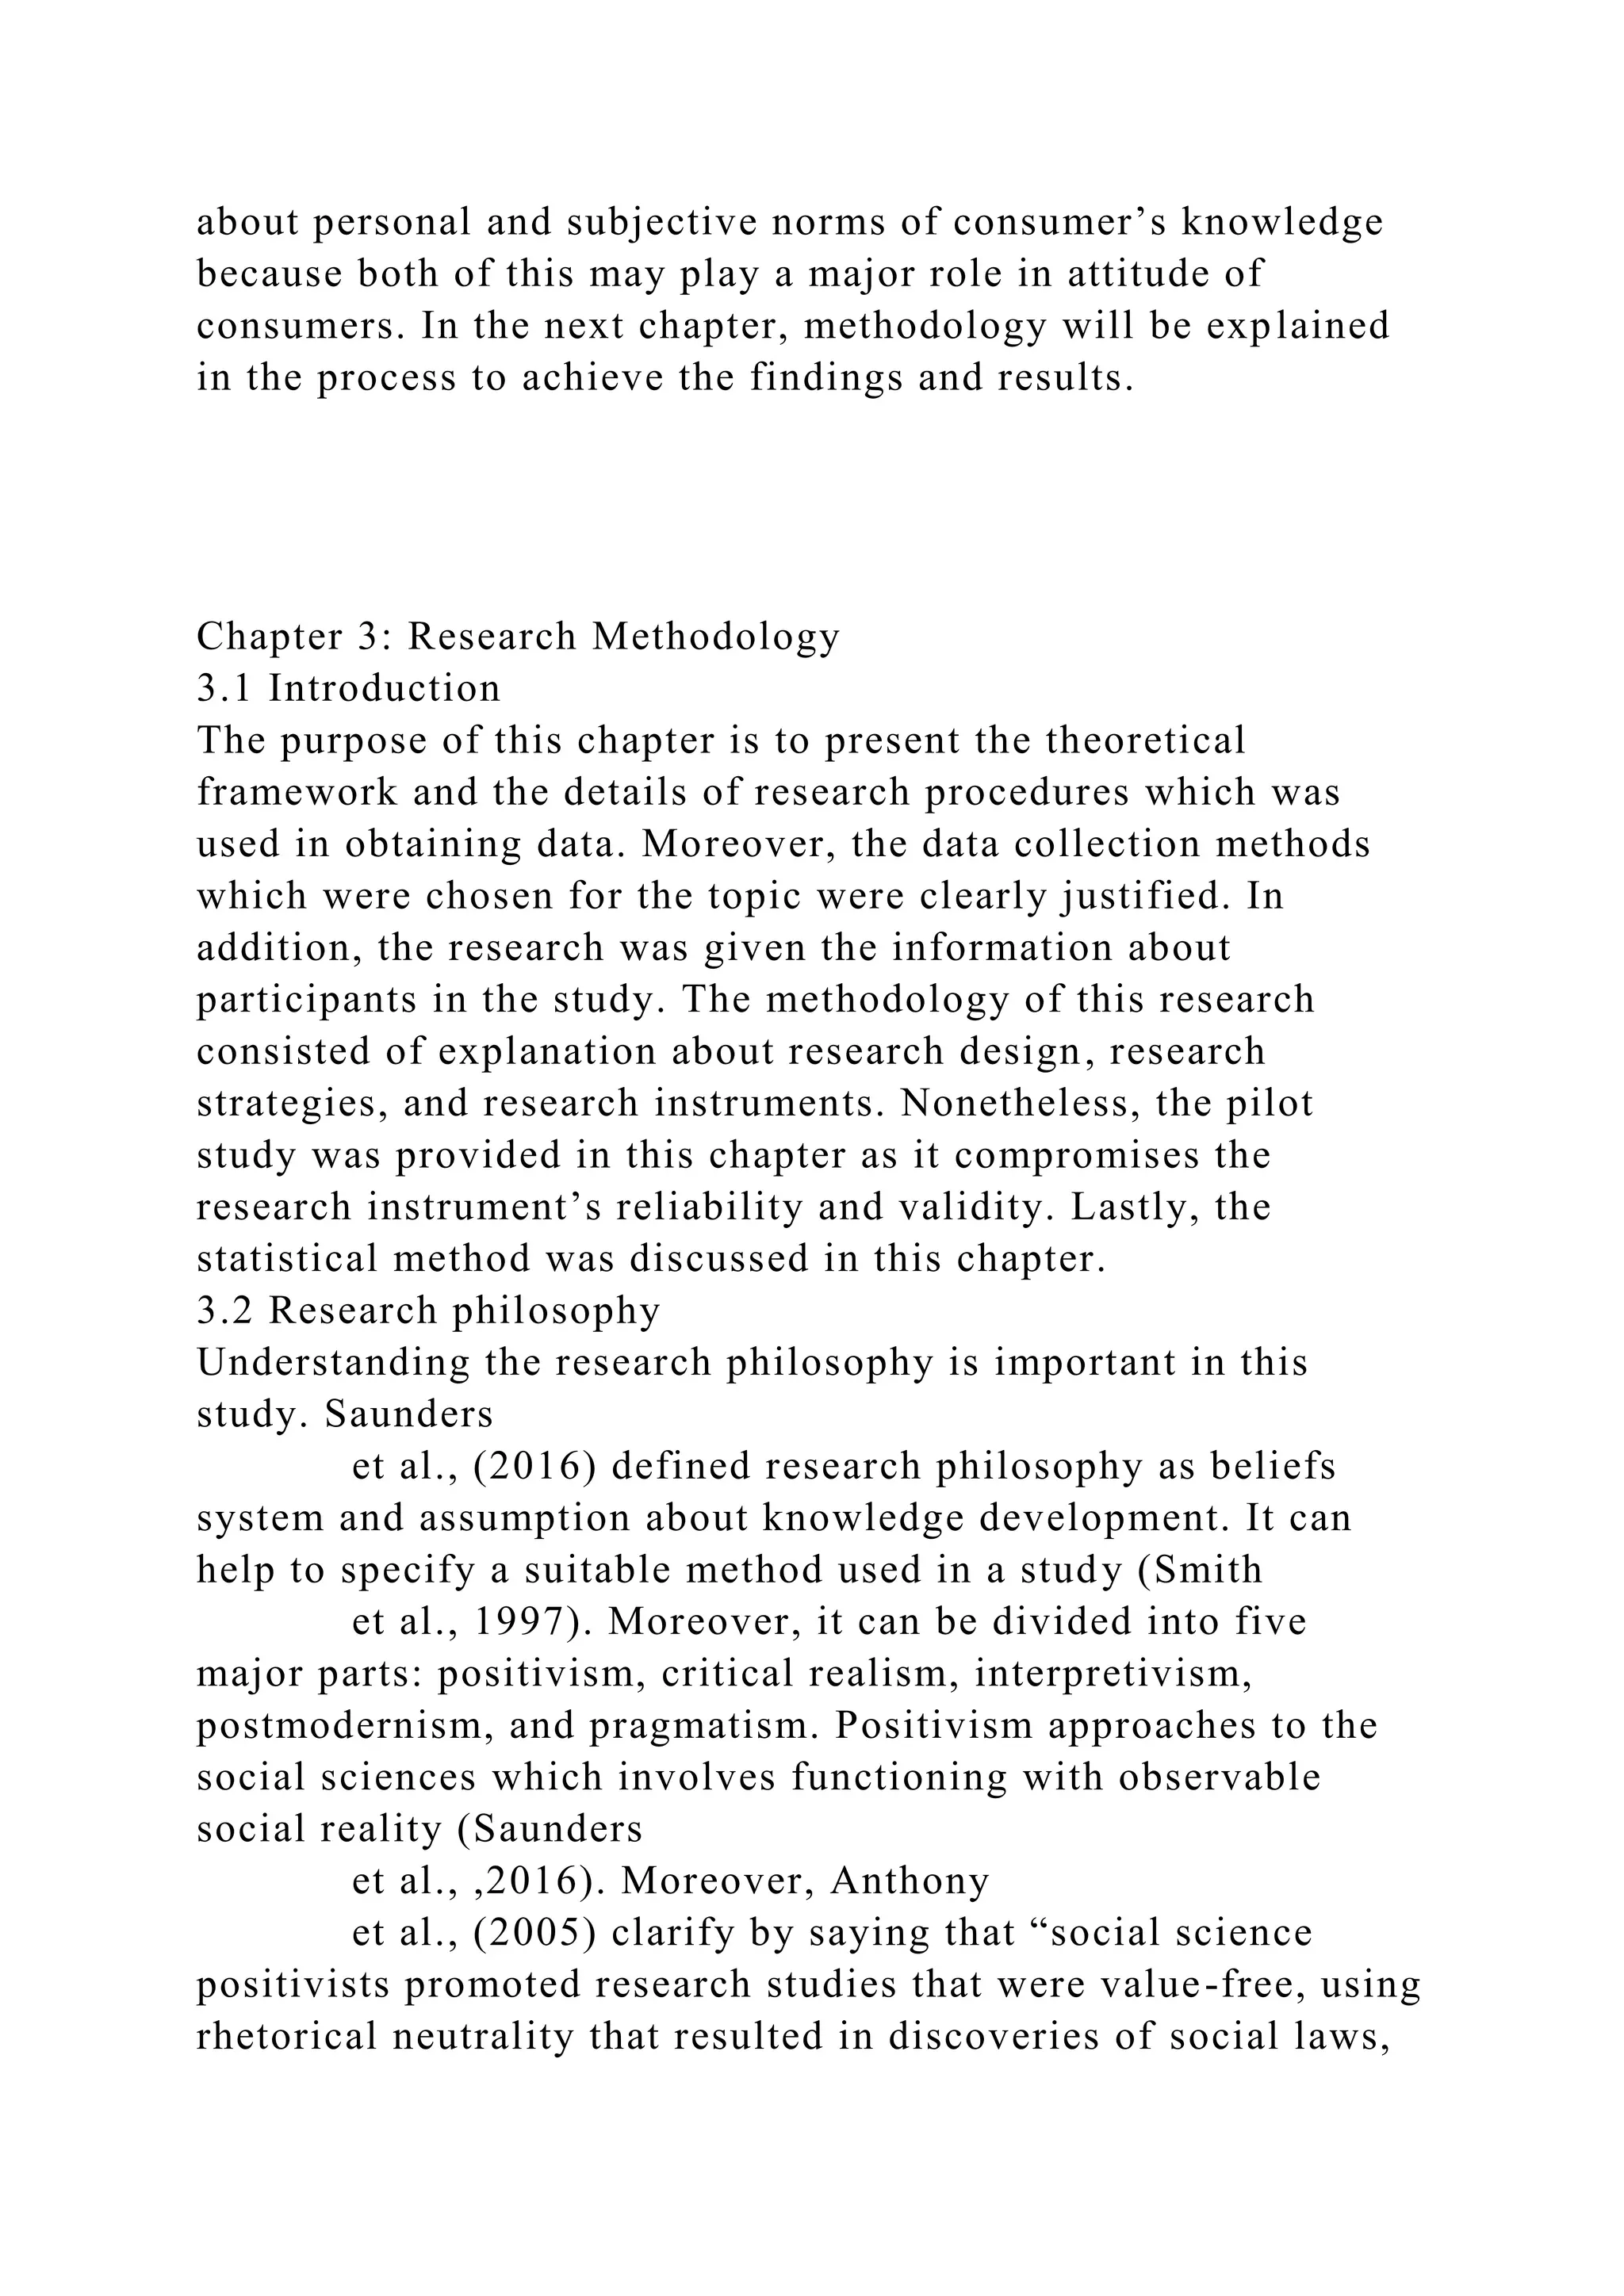
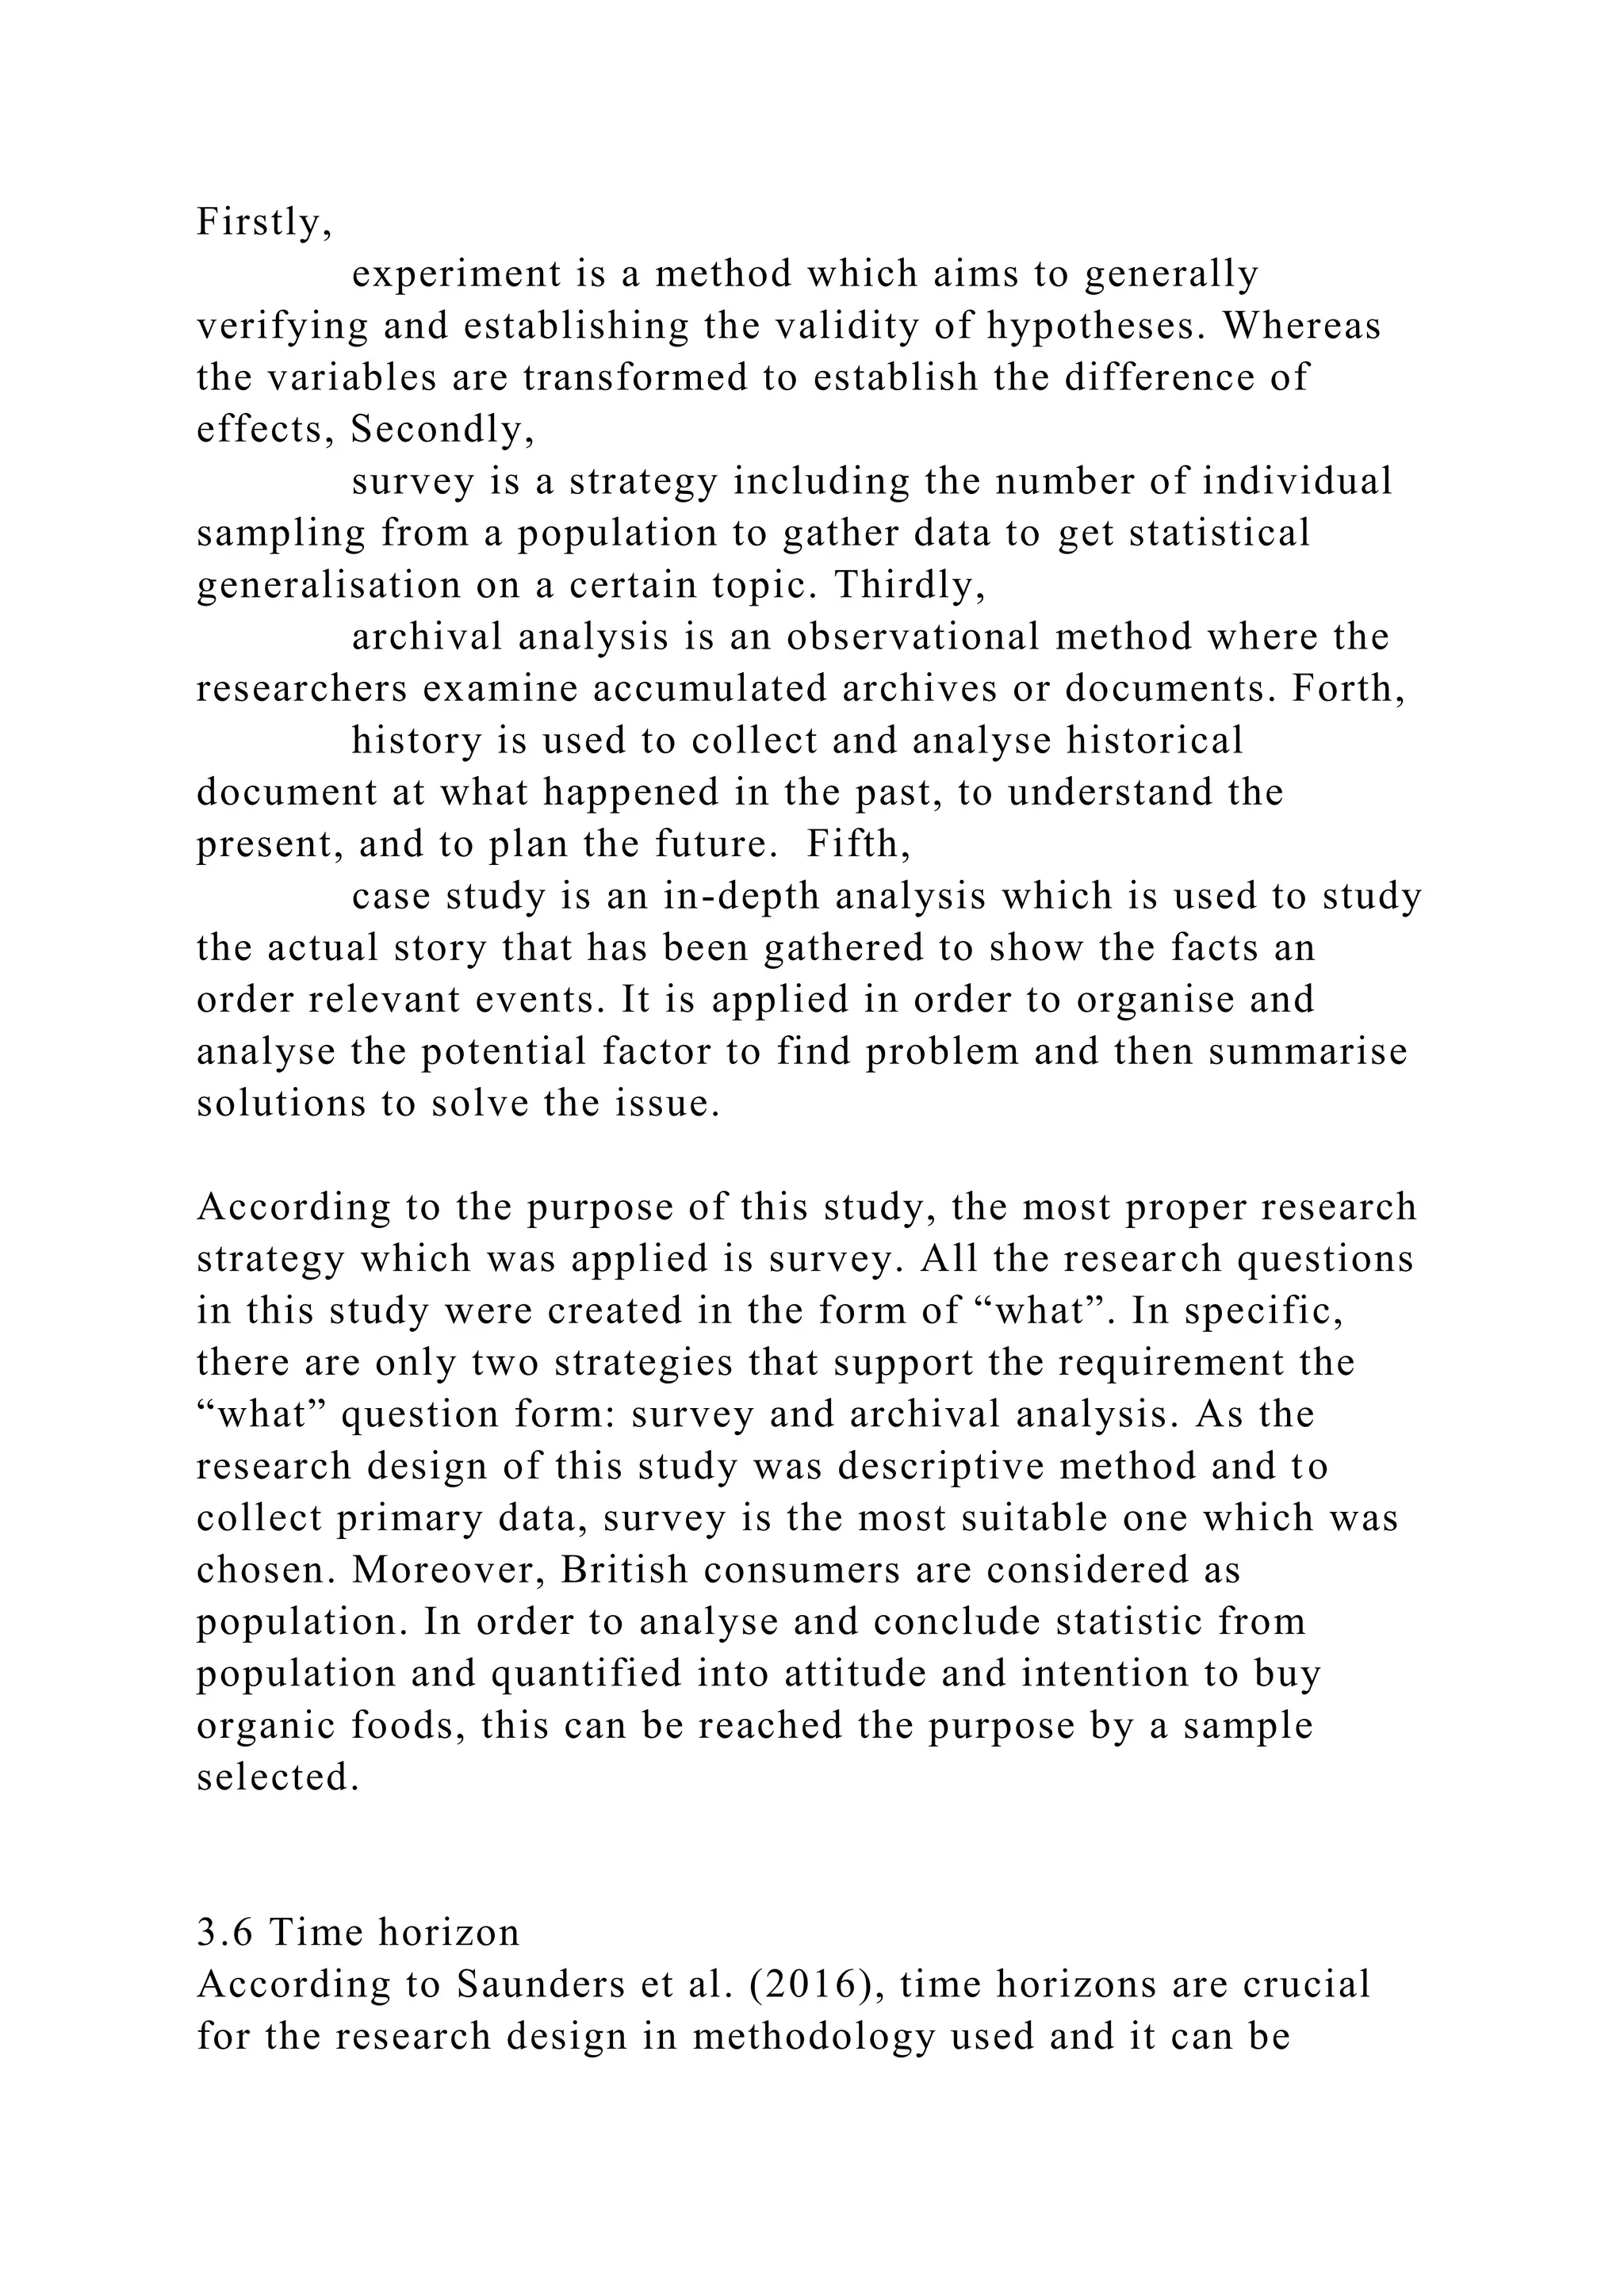
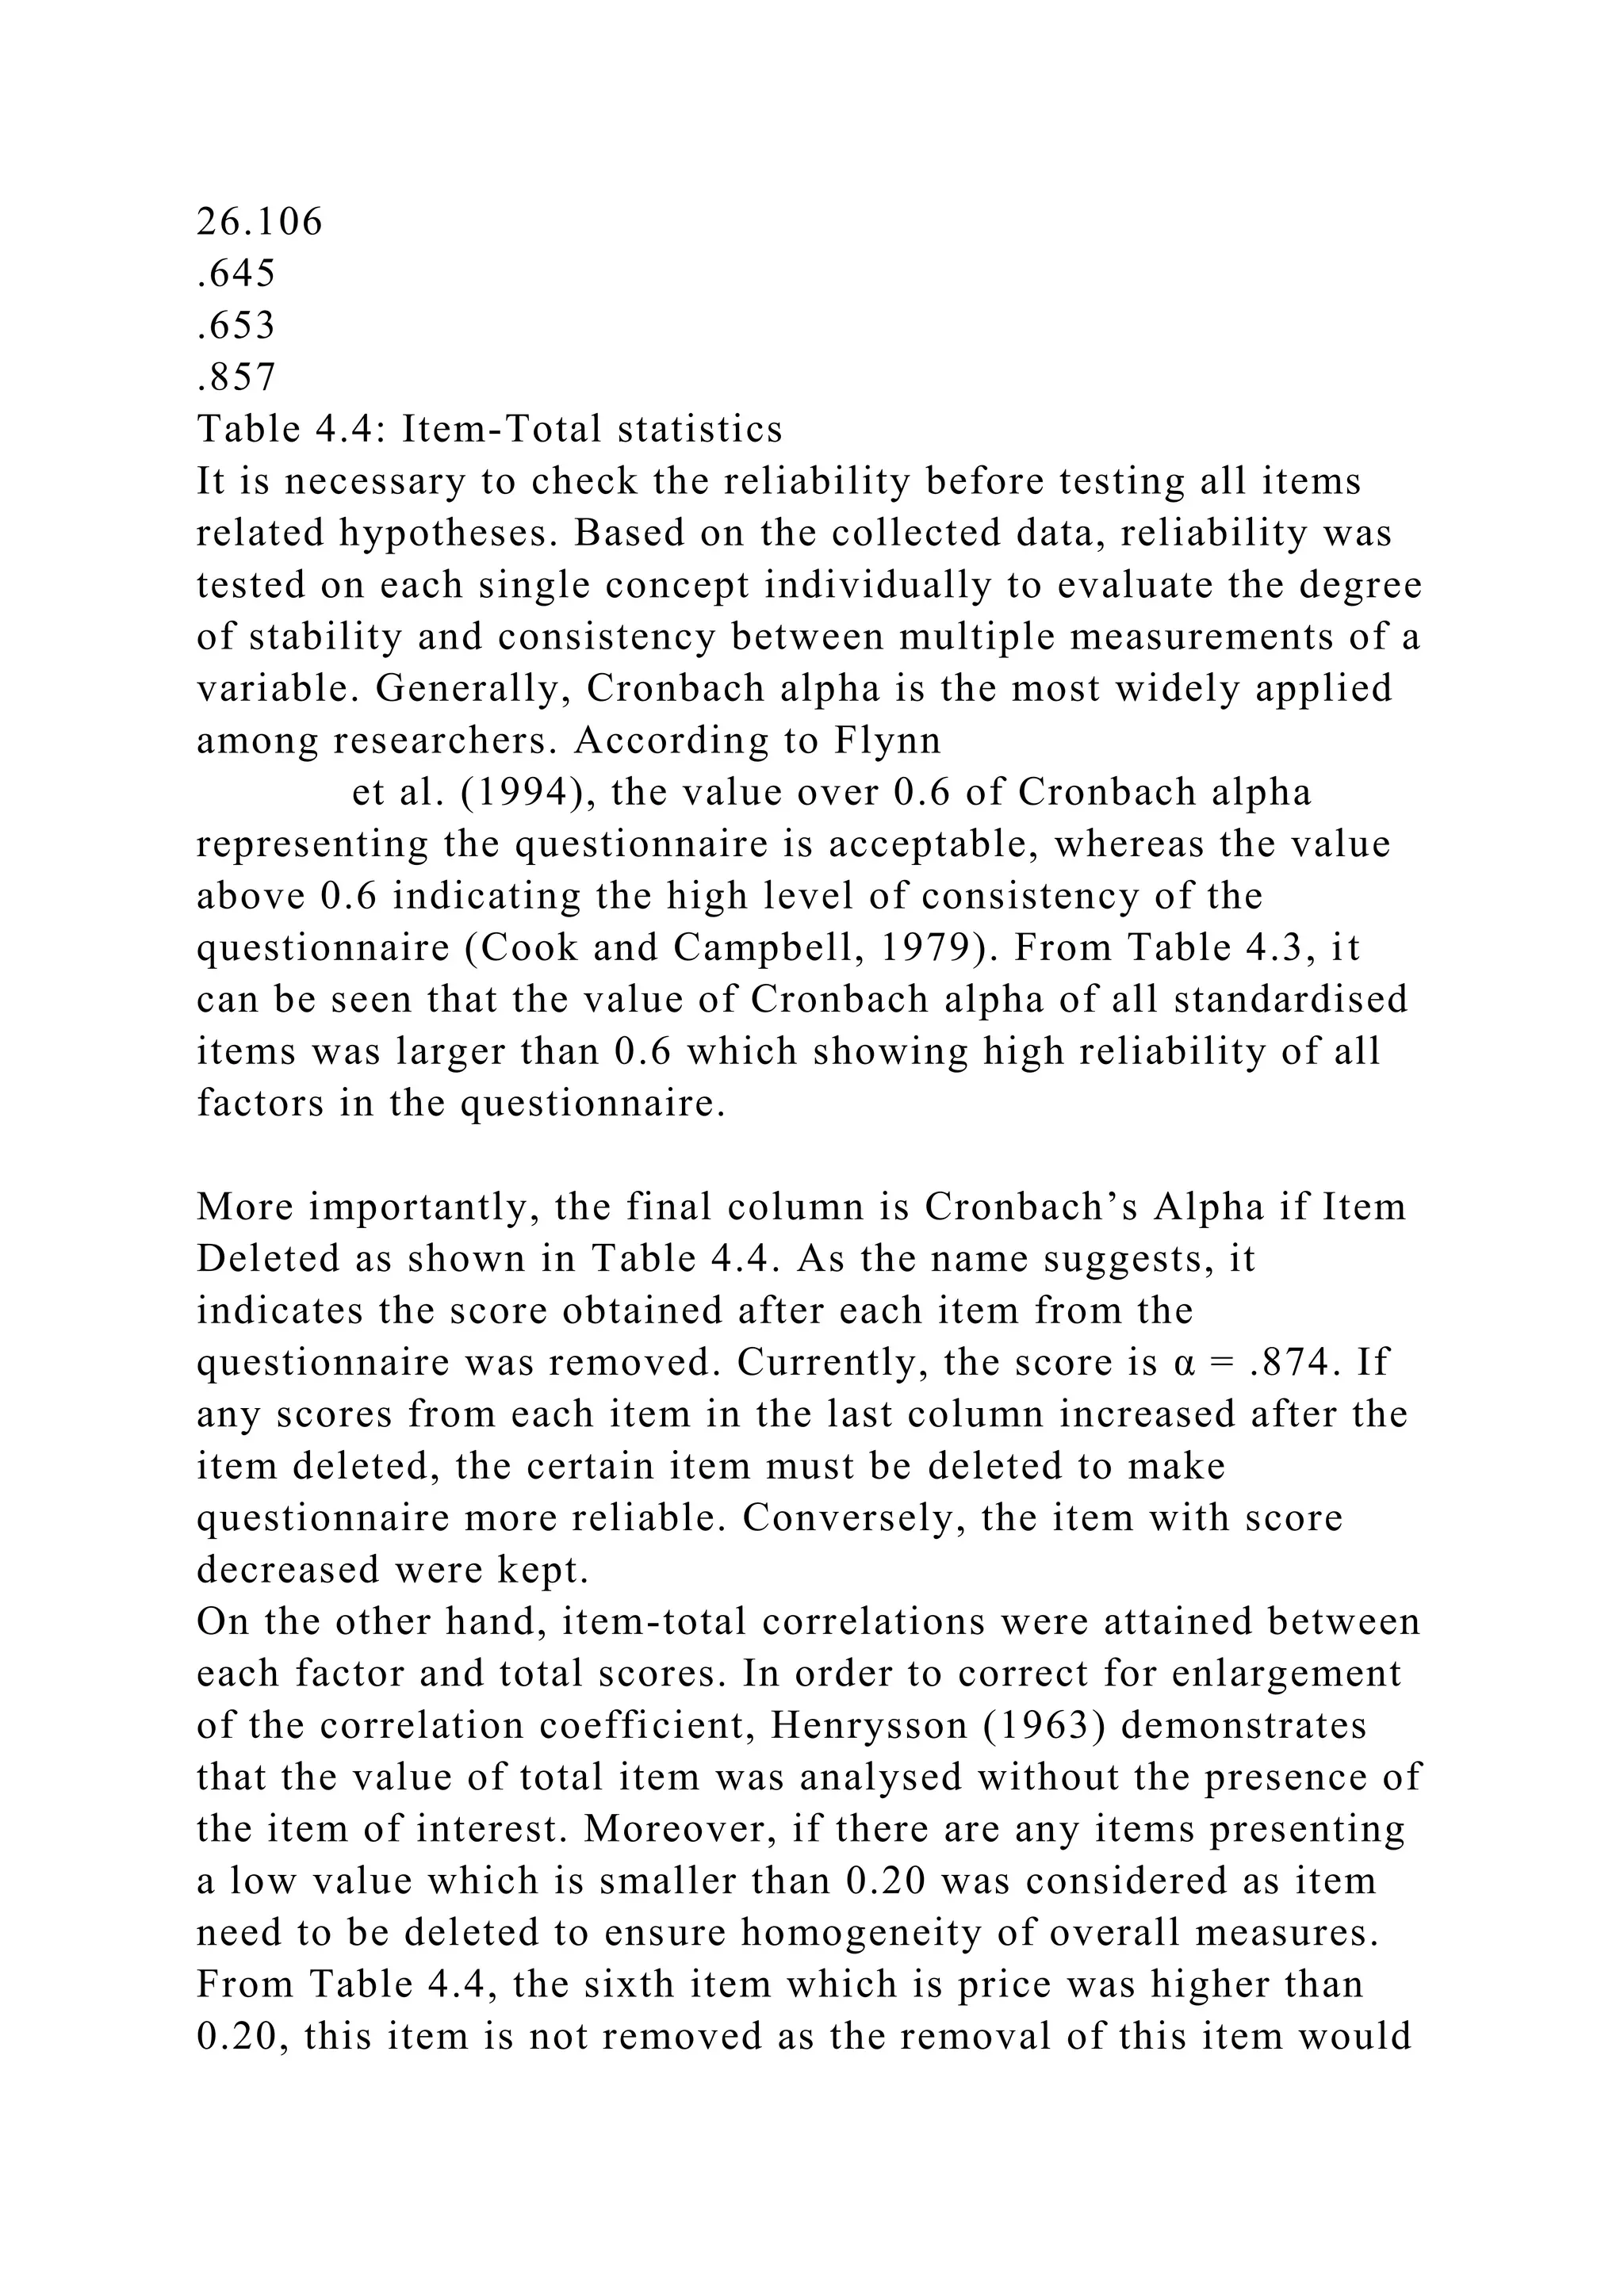
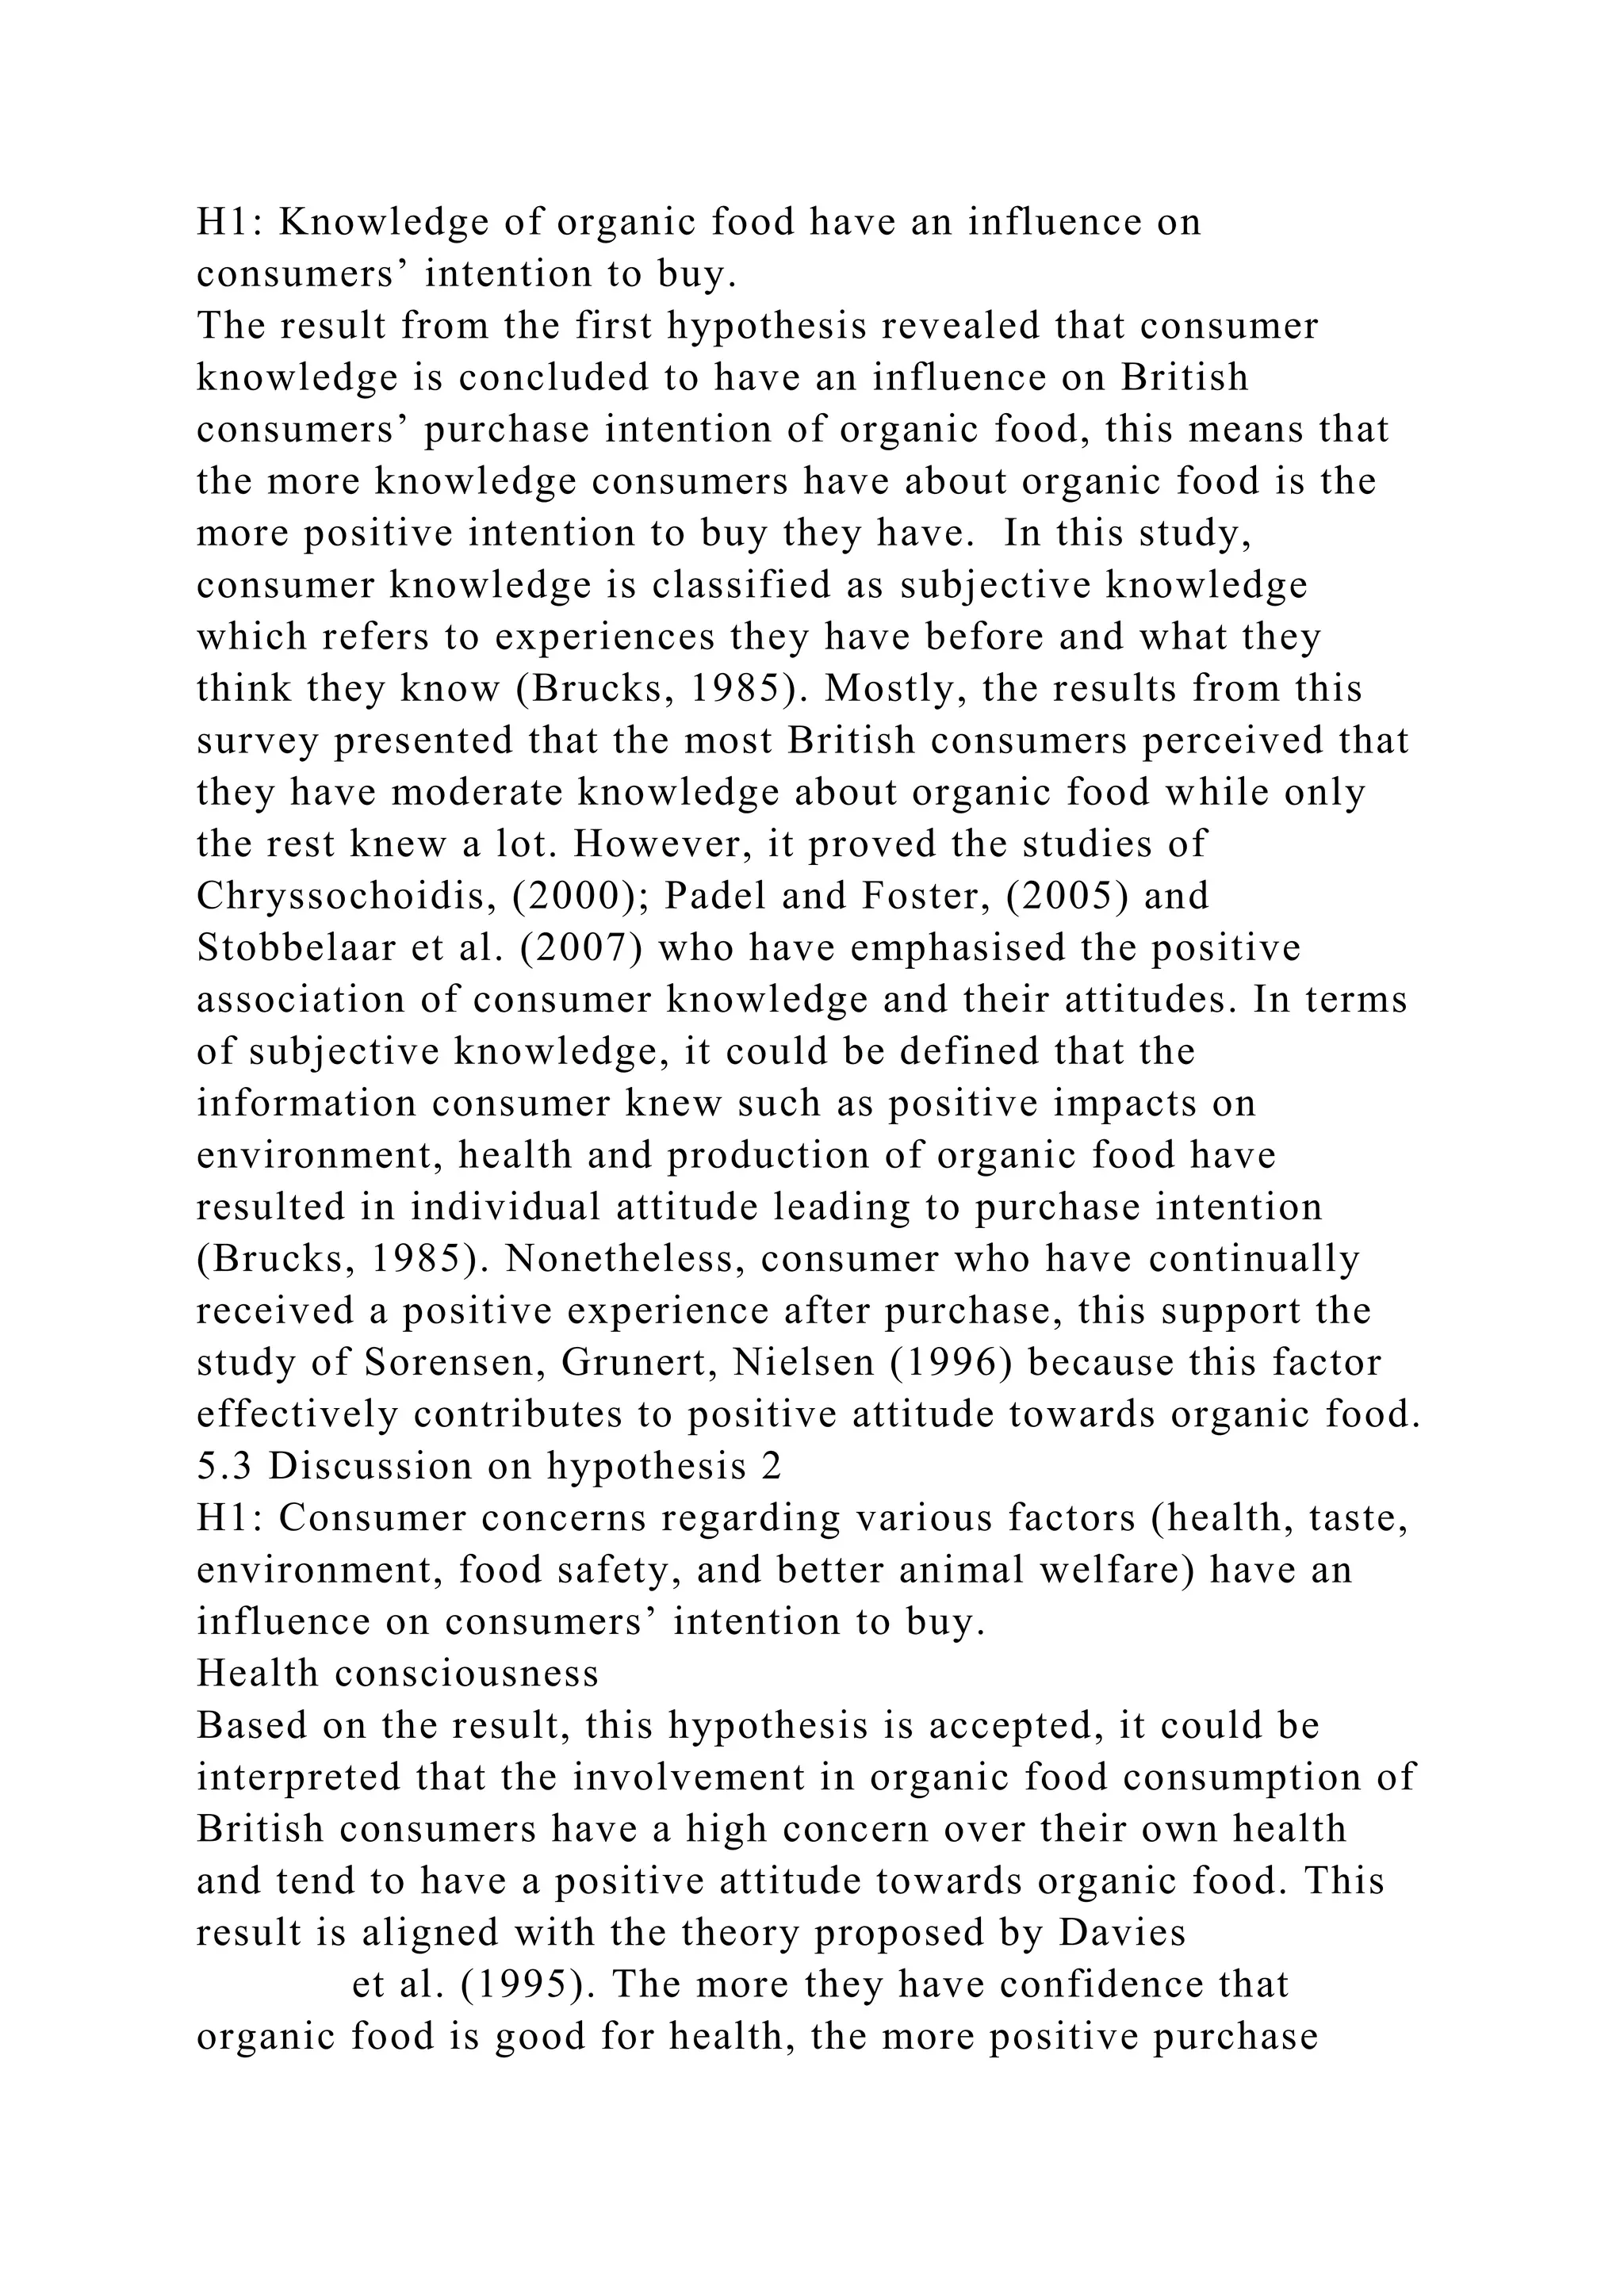
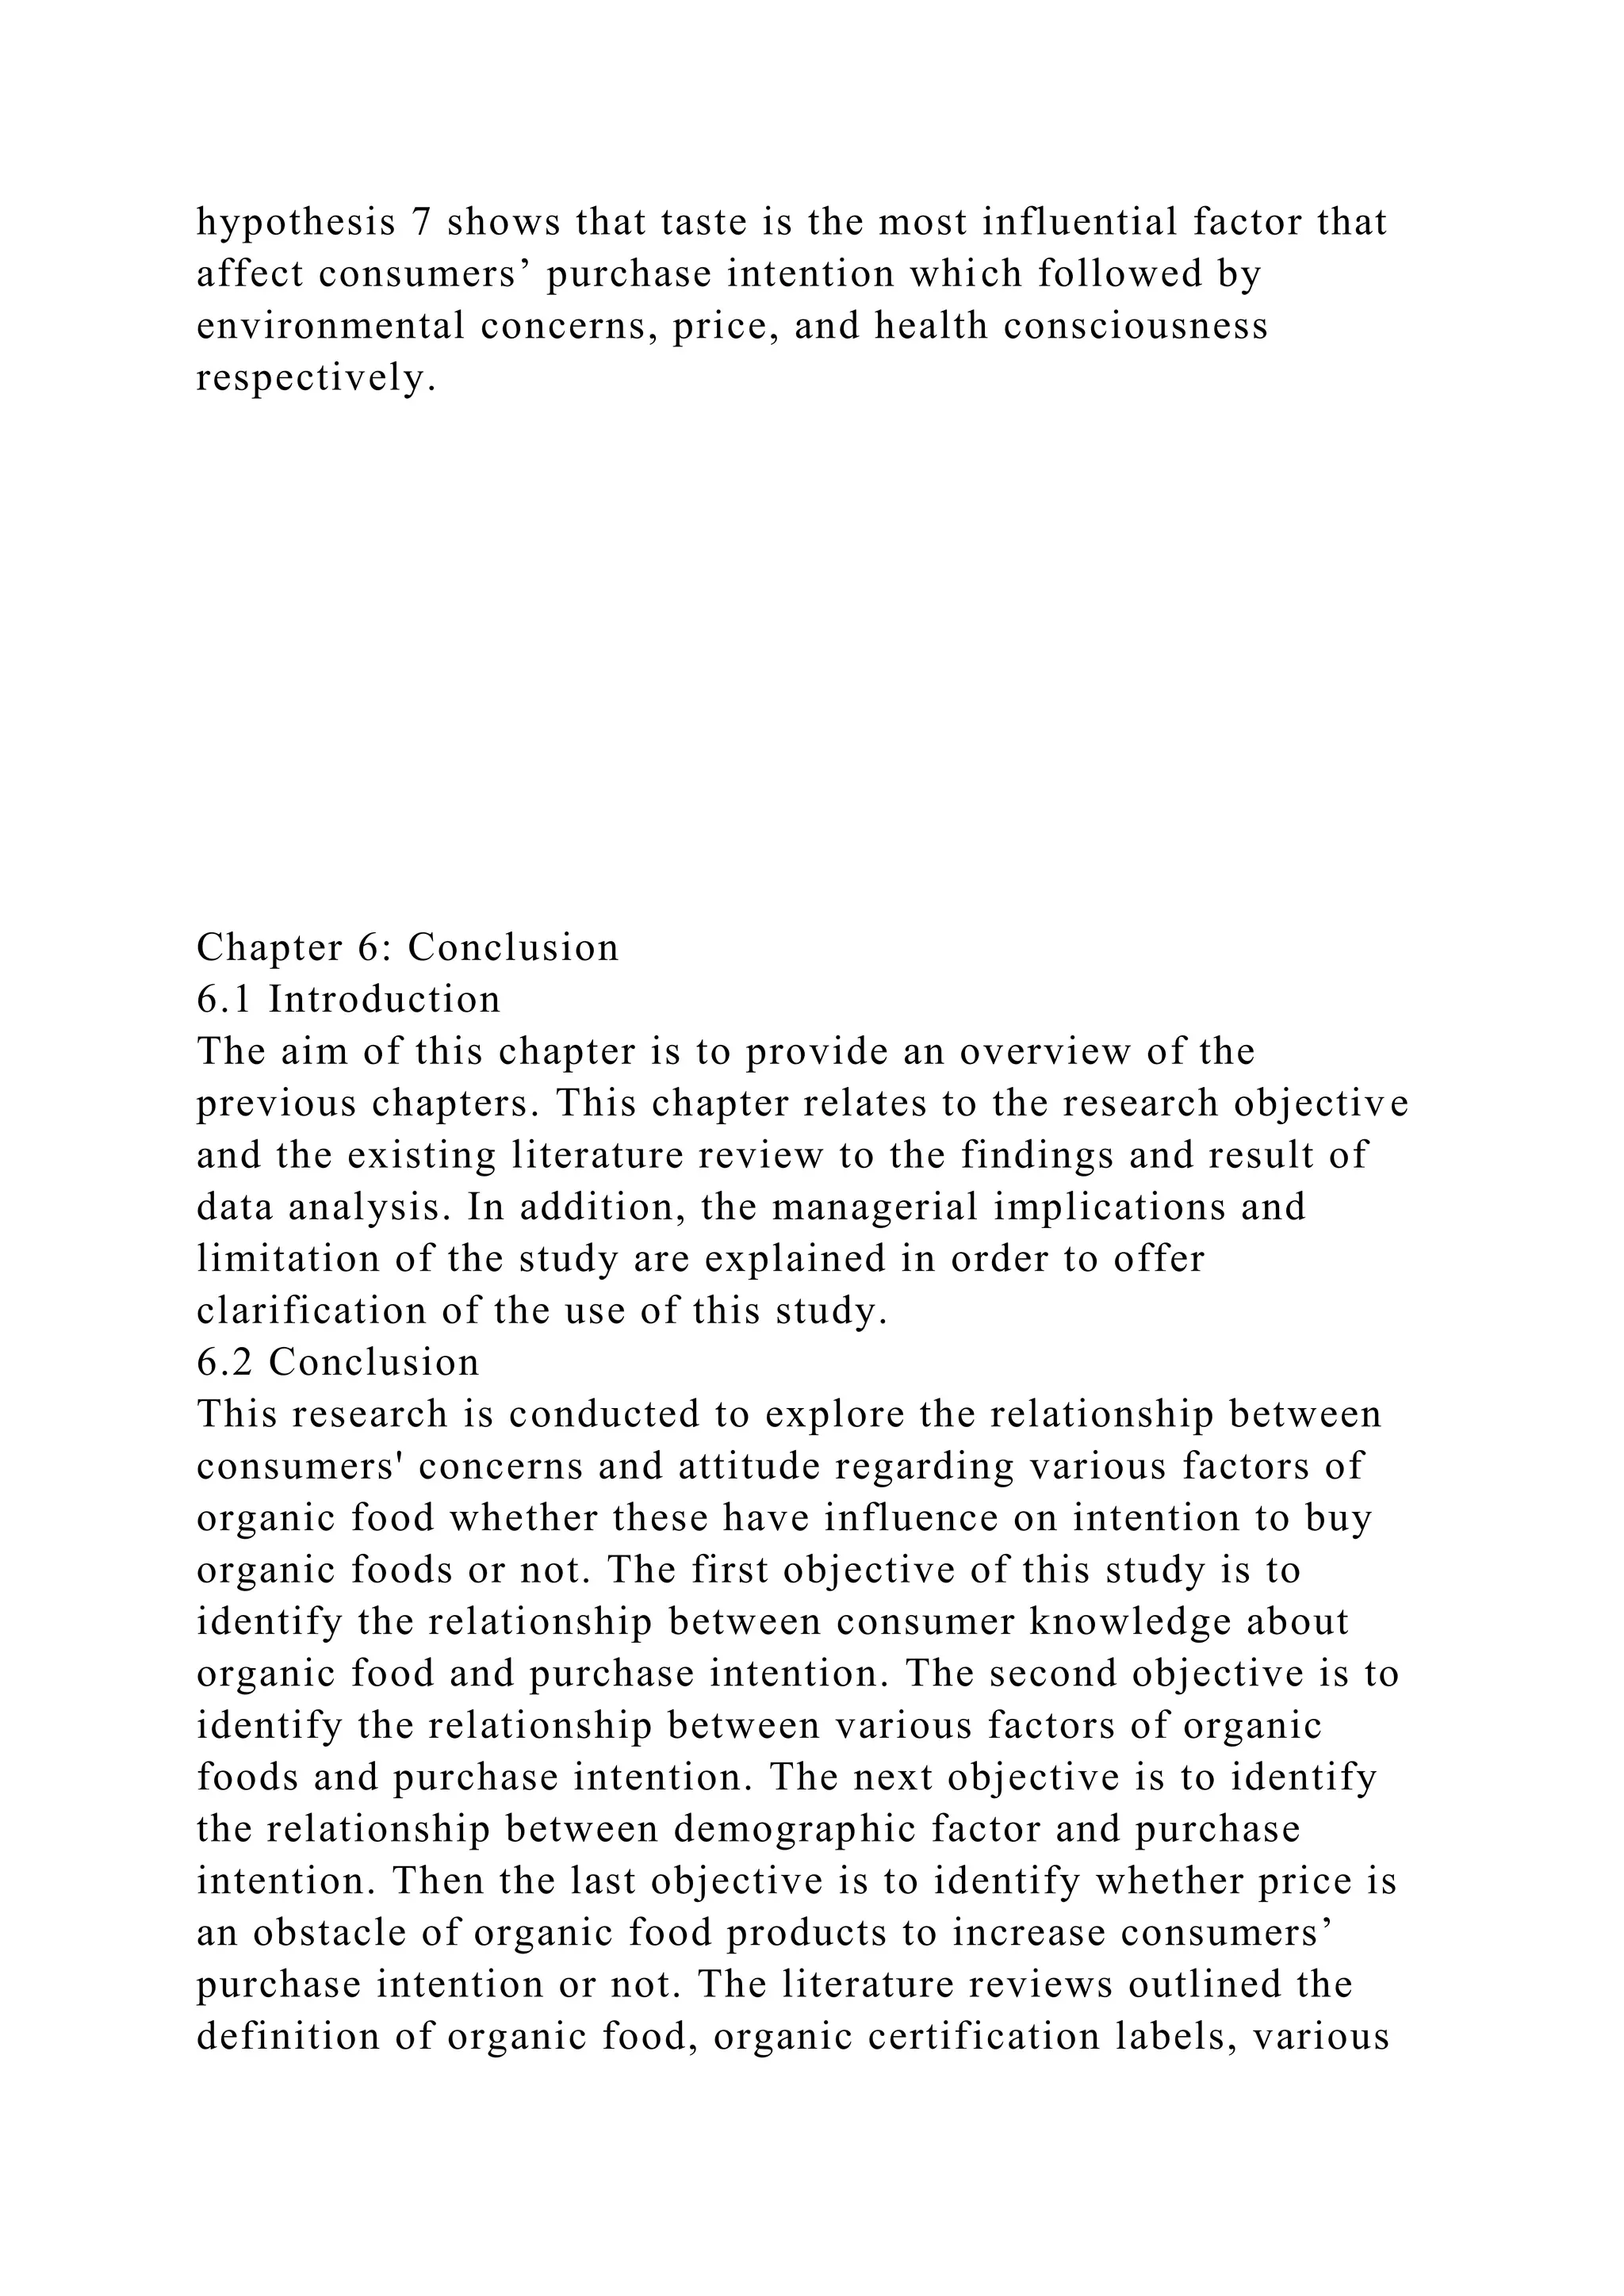
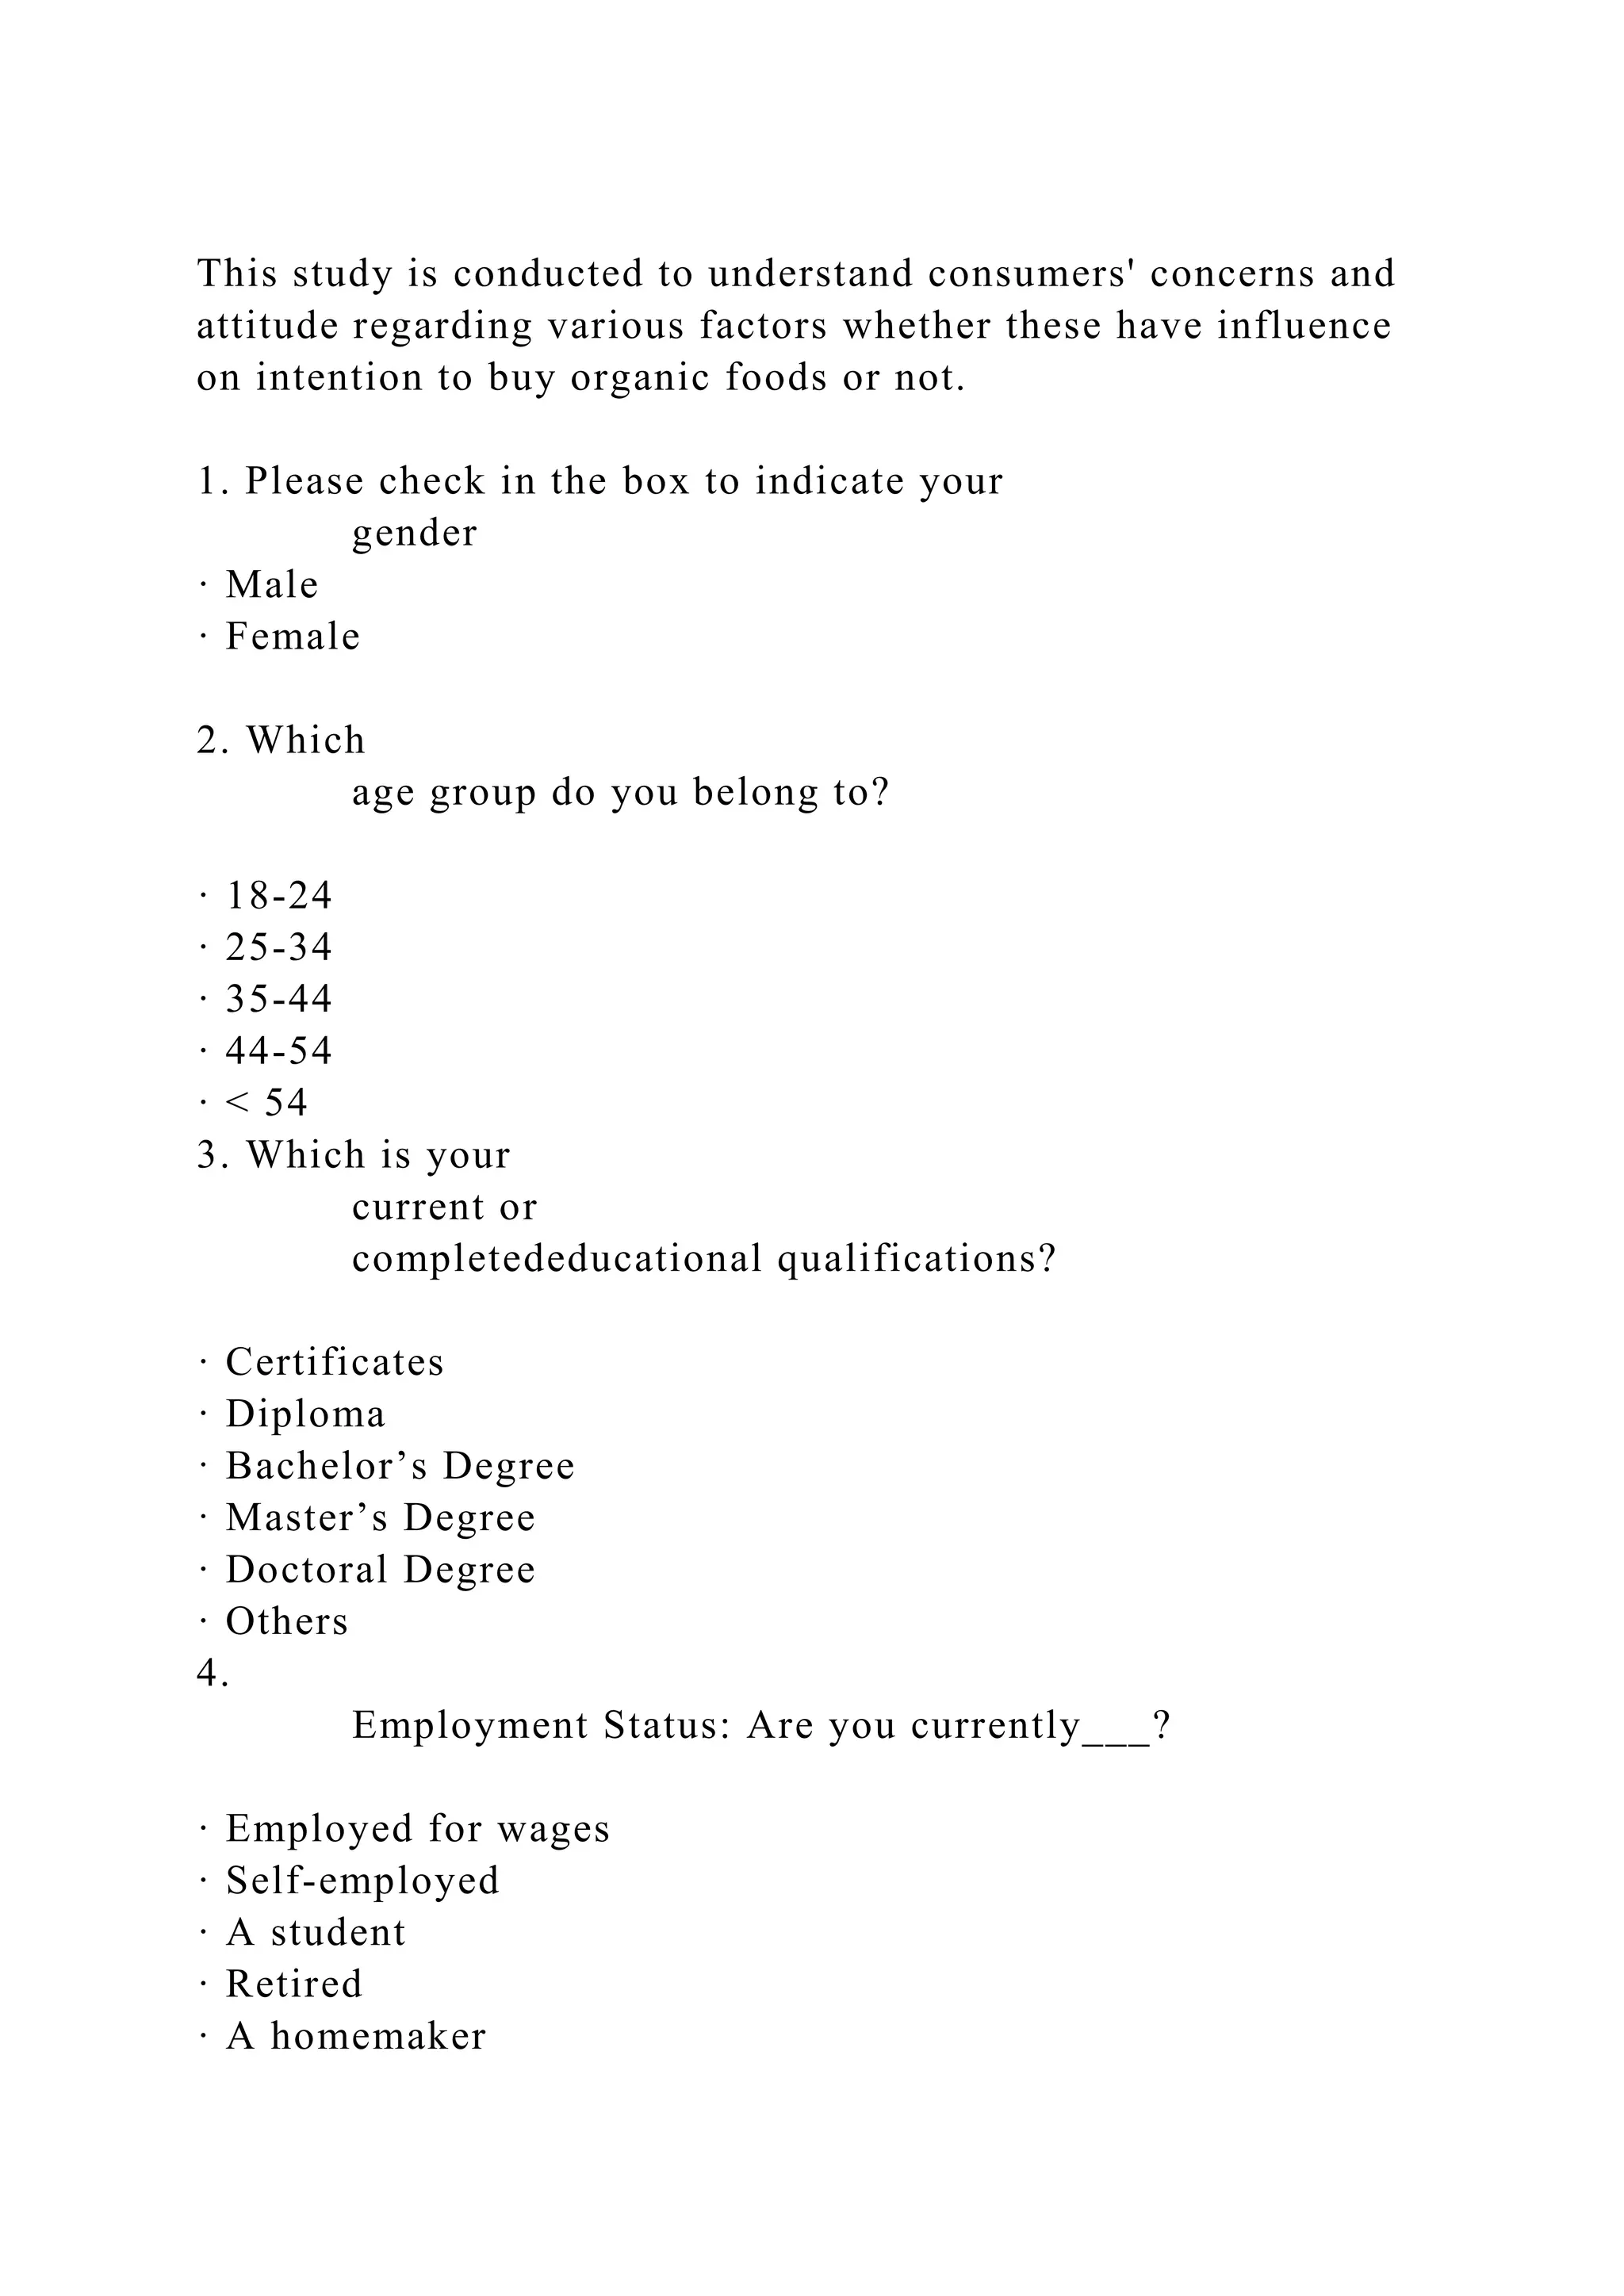
![.232
2.118
.037
Factors
[Environmental concerns]
.161
.085
.271
1.905
.060
Factors [Food safety]
-.008
.084
-.014
-.099
.921
Factors [Price]
-.106
.057
-.190
-1.869
.065
Factors [Better animal welfare]
.072
.073
.133
.988
.326
H1: Health consciousness is the most influential factor which
affect consumer purchase intention.
a. Dependent Variable: SumPurchase](https://image.slidesharecdn.com/submittedinpartfulfilmentoftherequirementsforthedegreeof-230119024927-31555ff9/75/Submitted-in-part-fulfilment-of-the-requirements-for-the-degree-of-docx-83-2048.jpg)
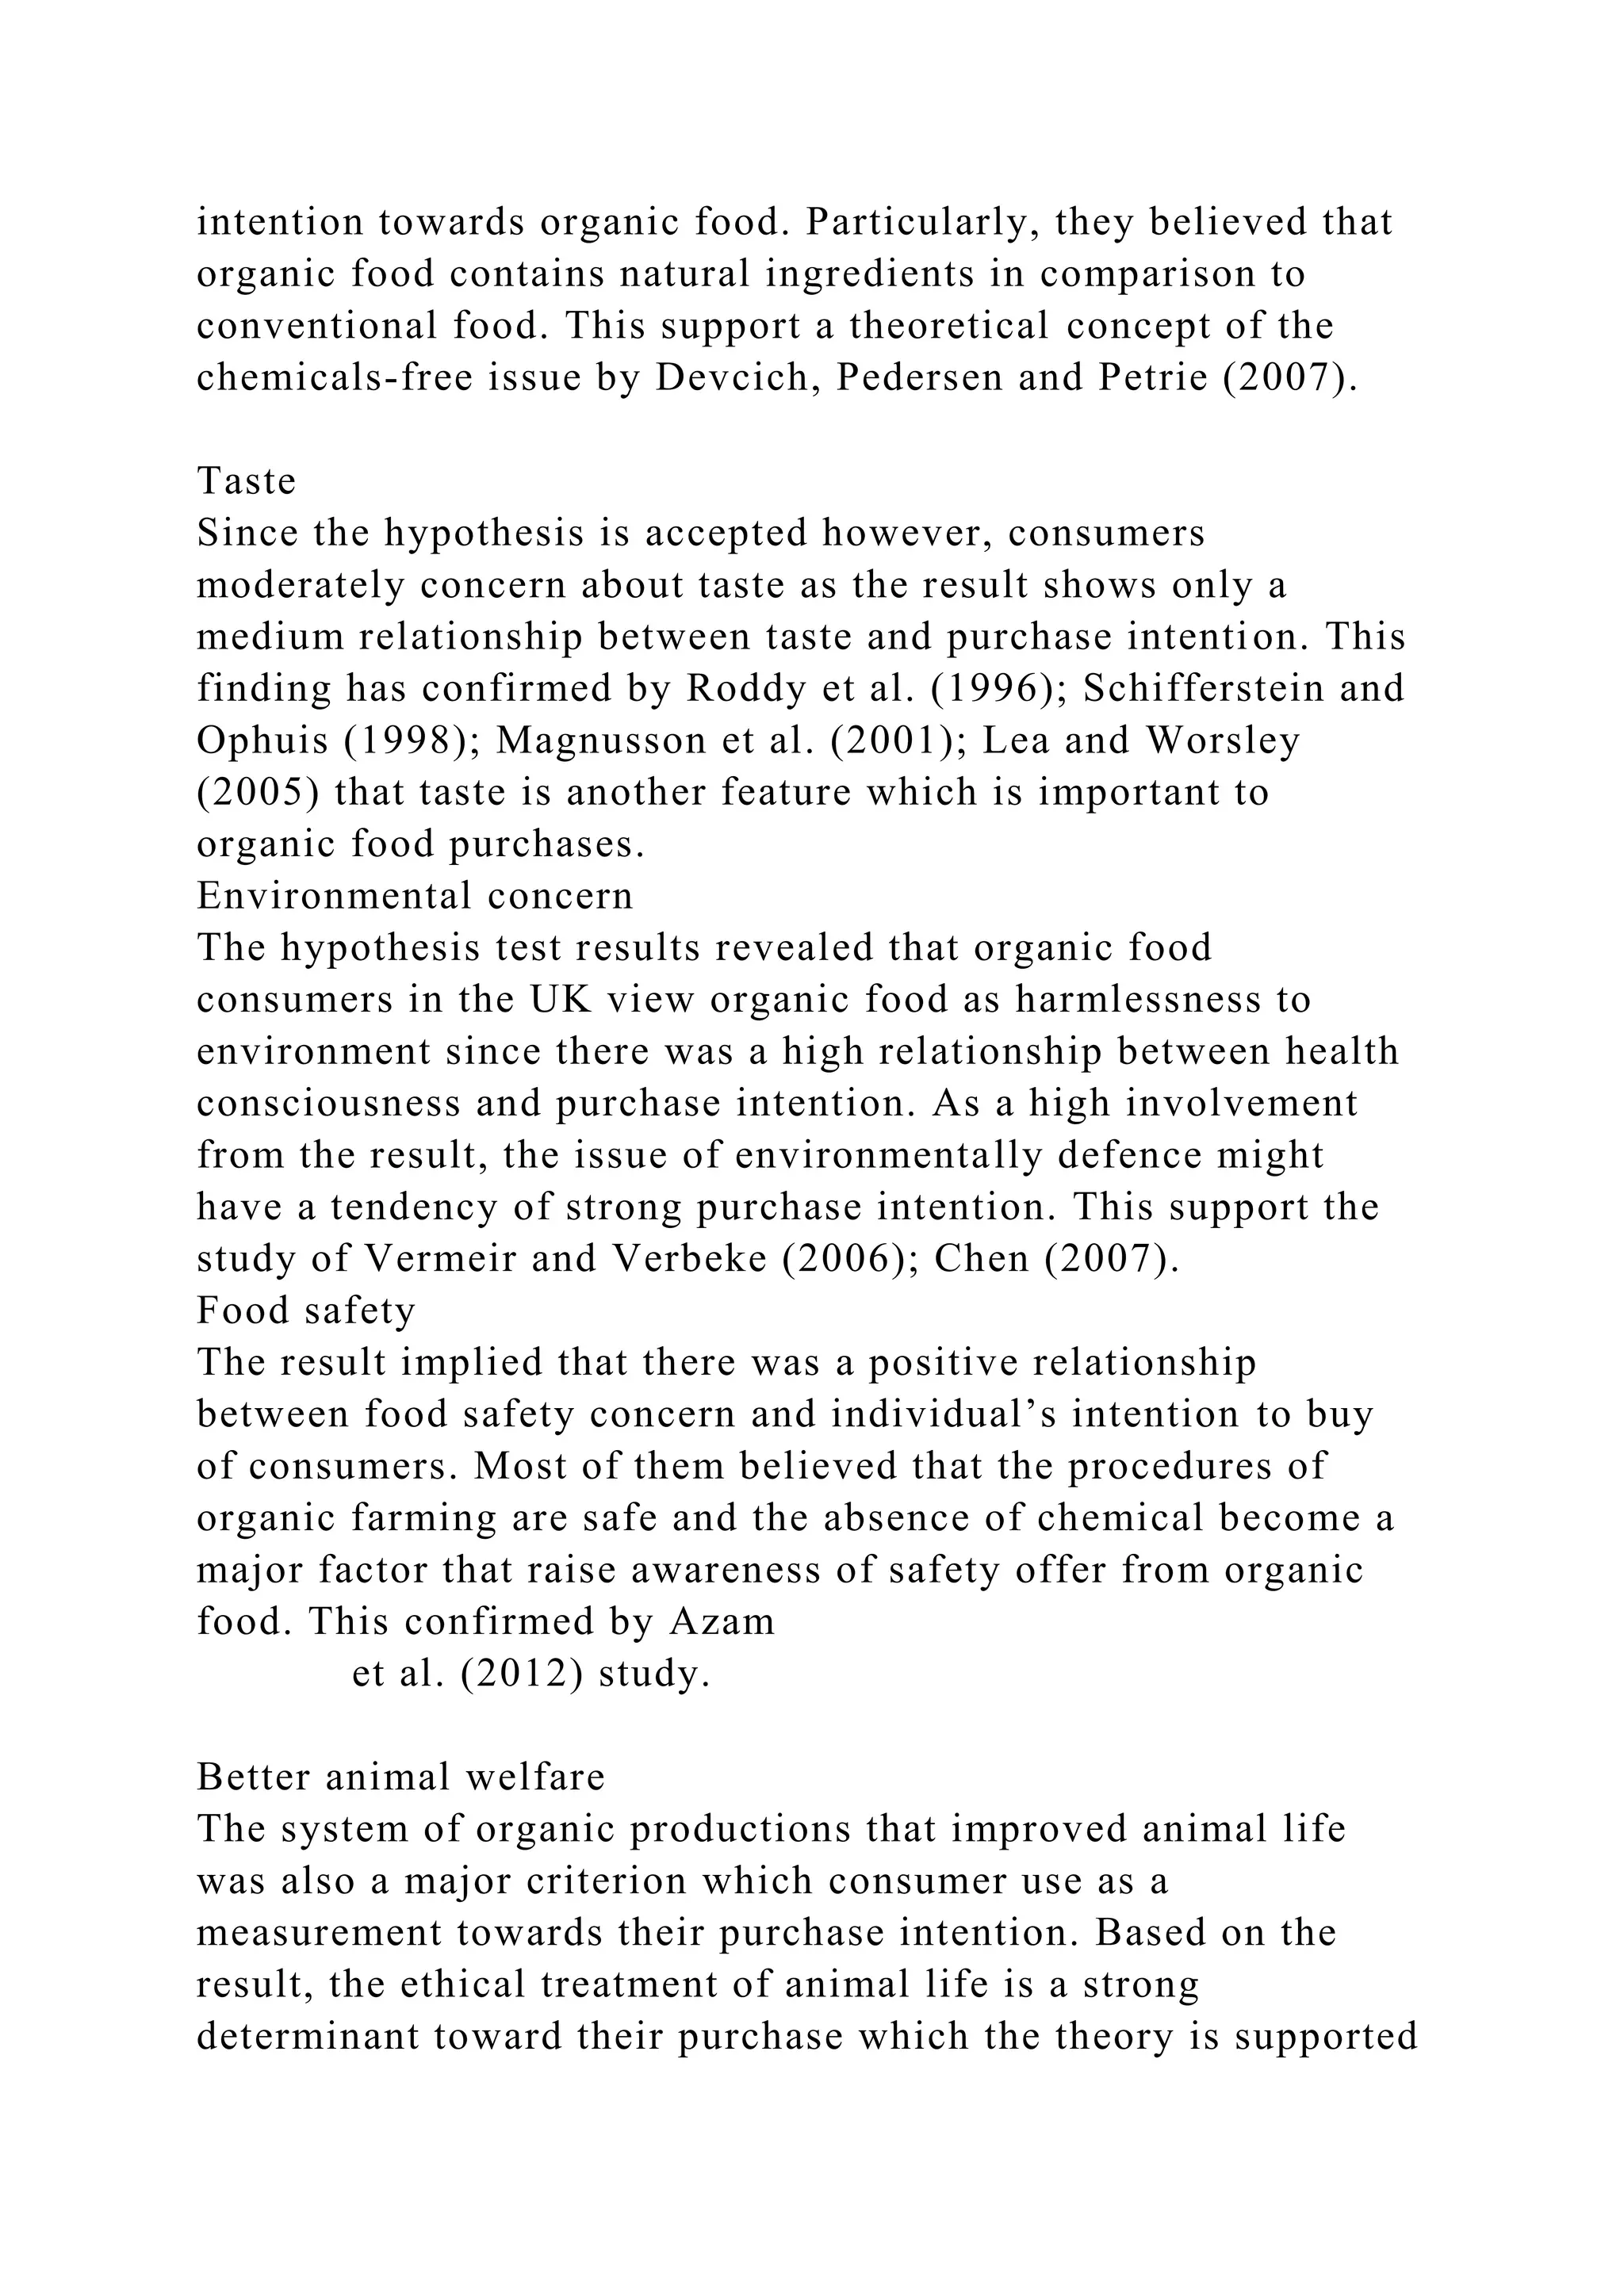

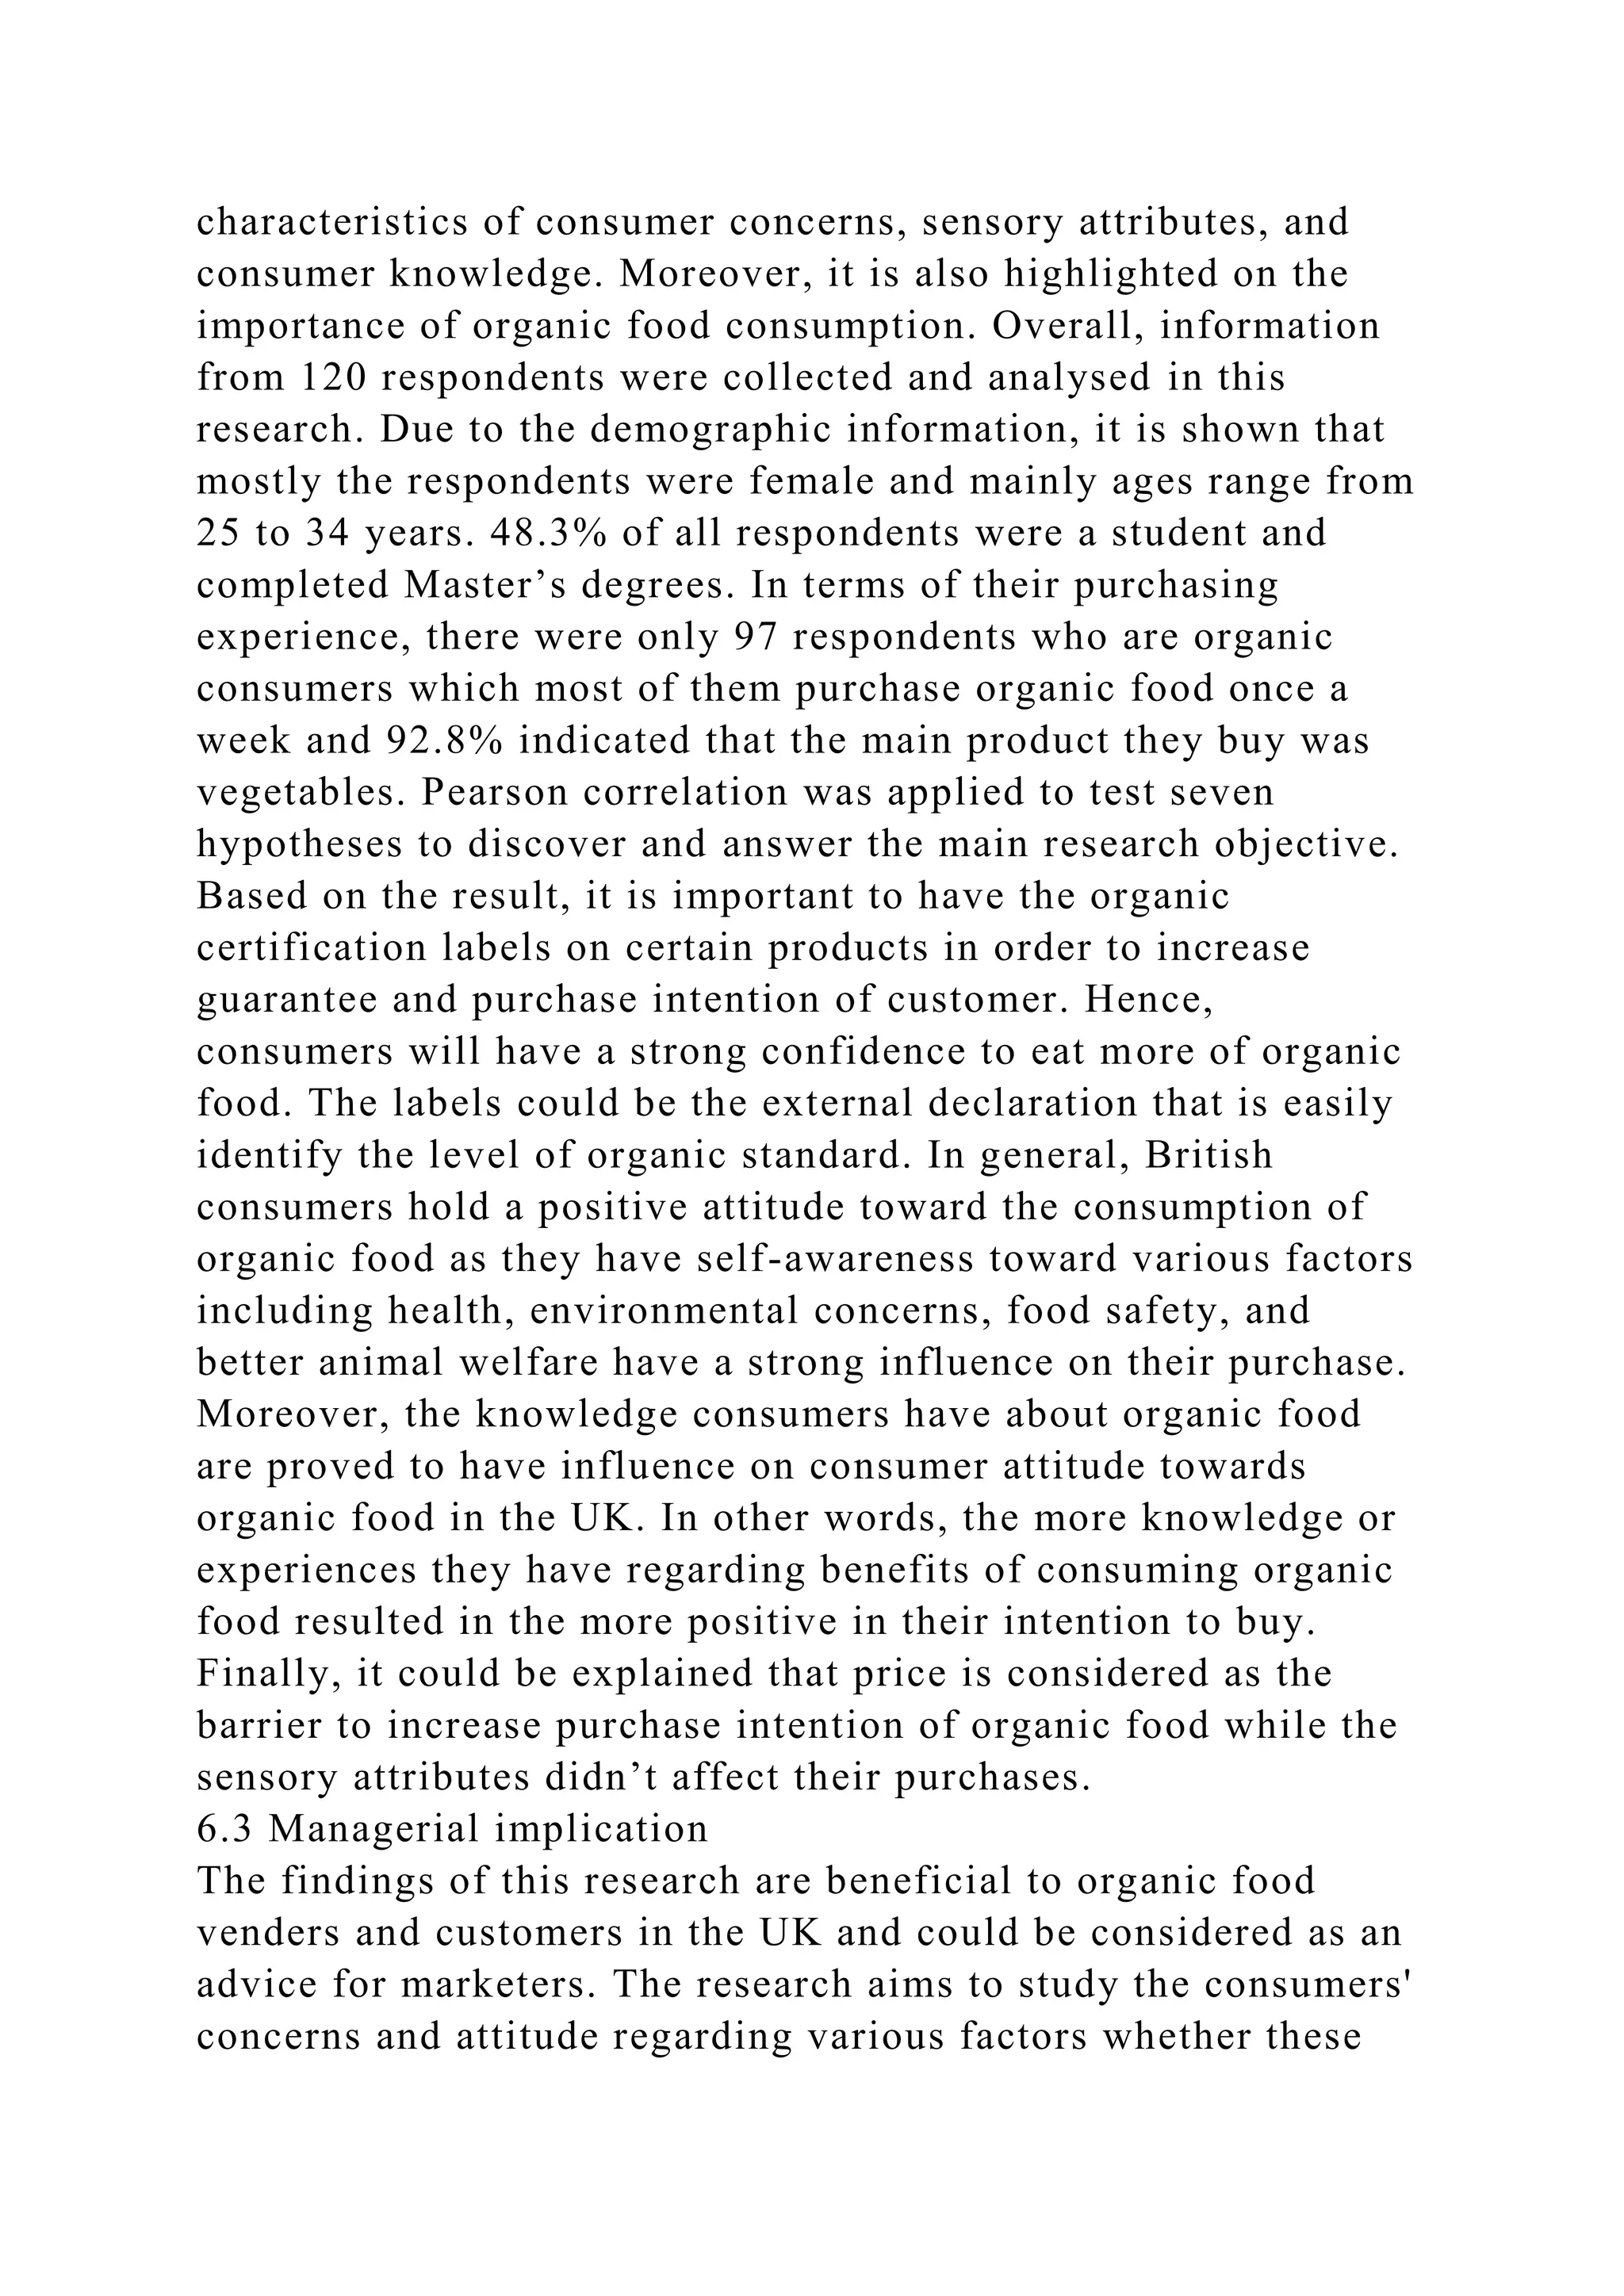
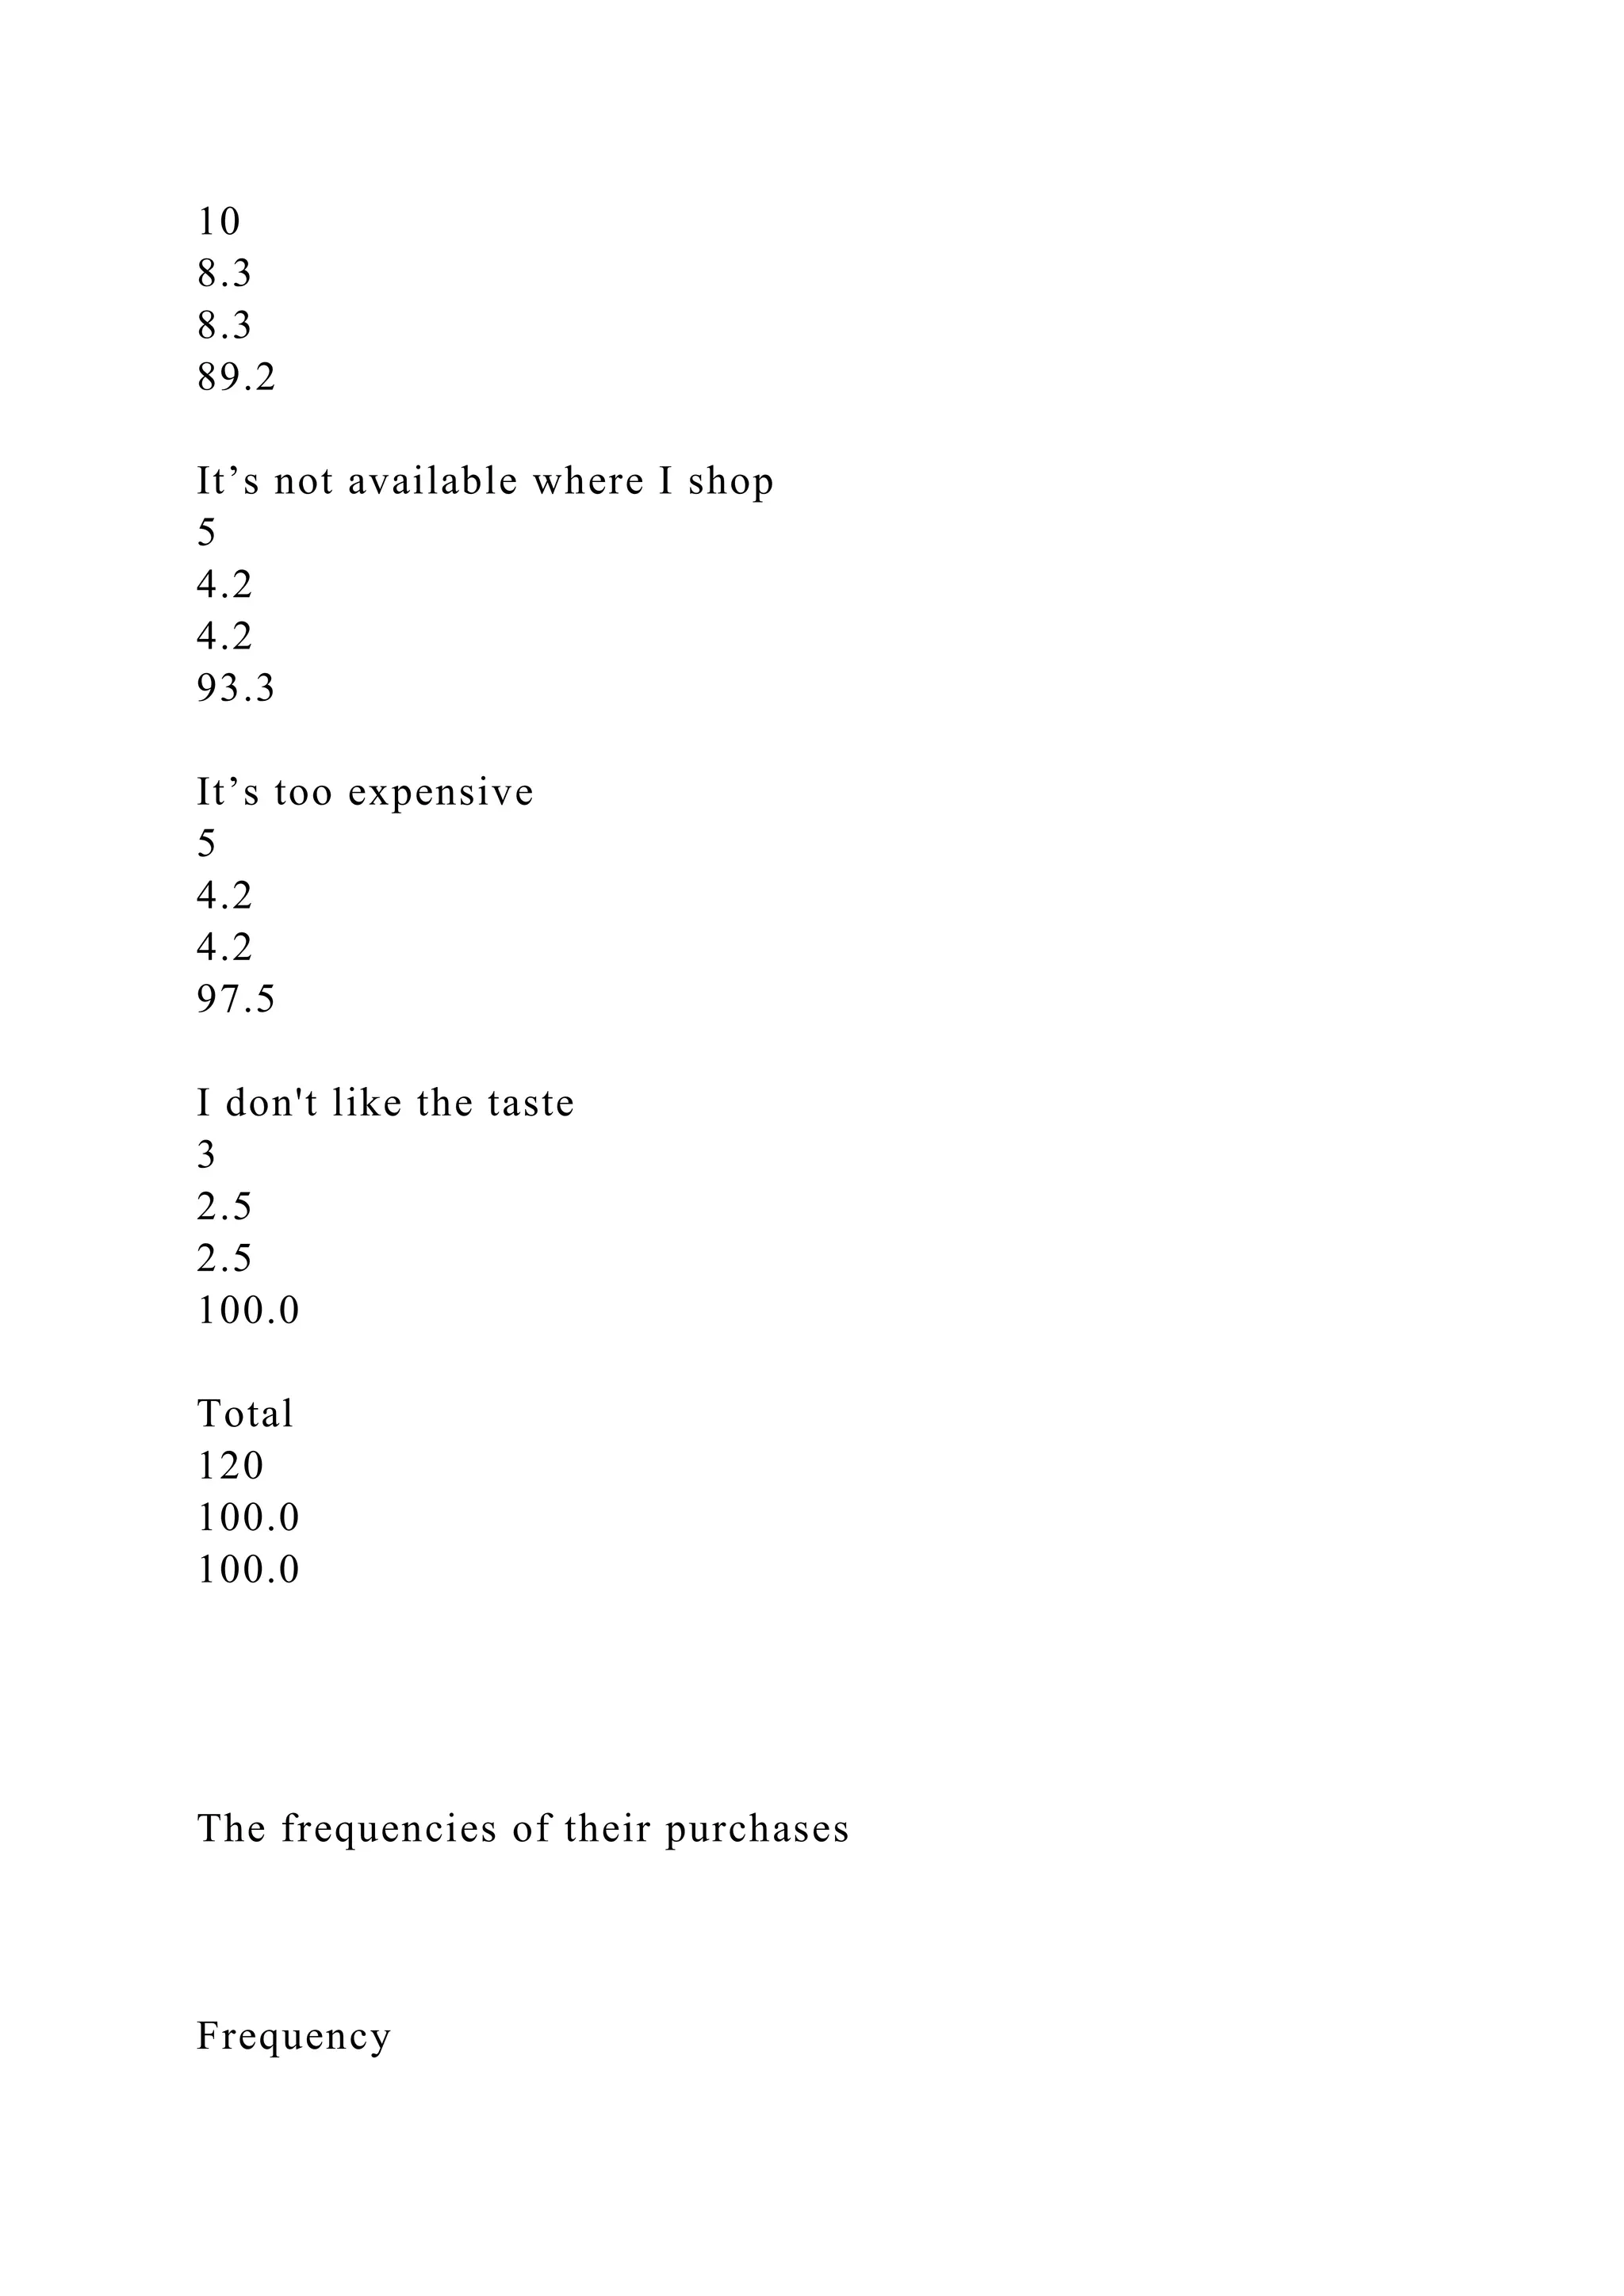
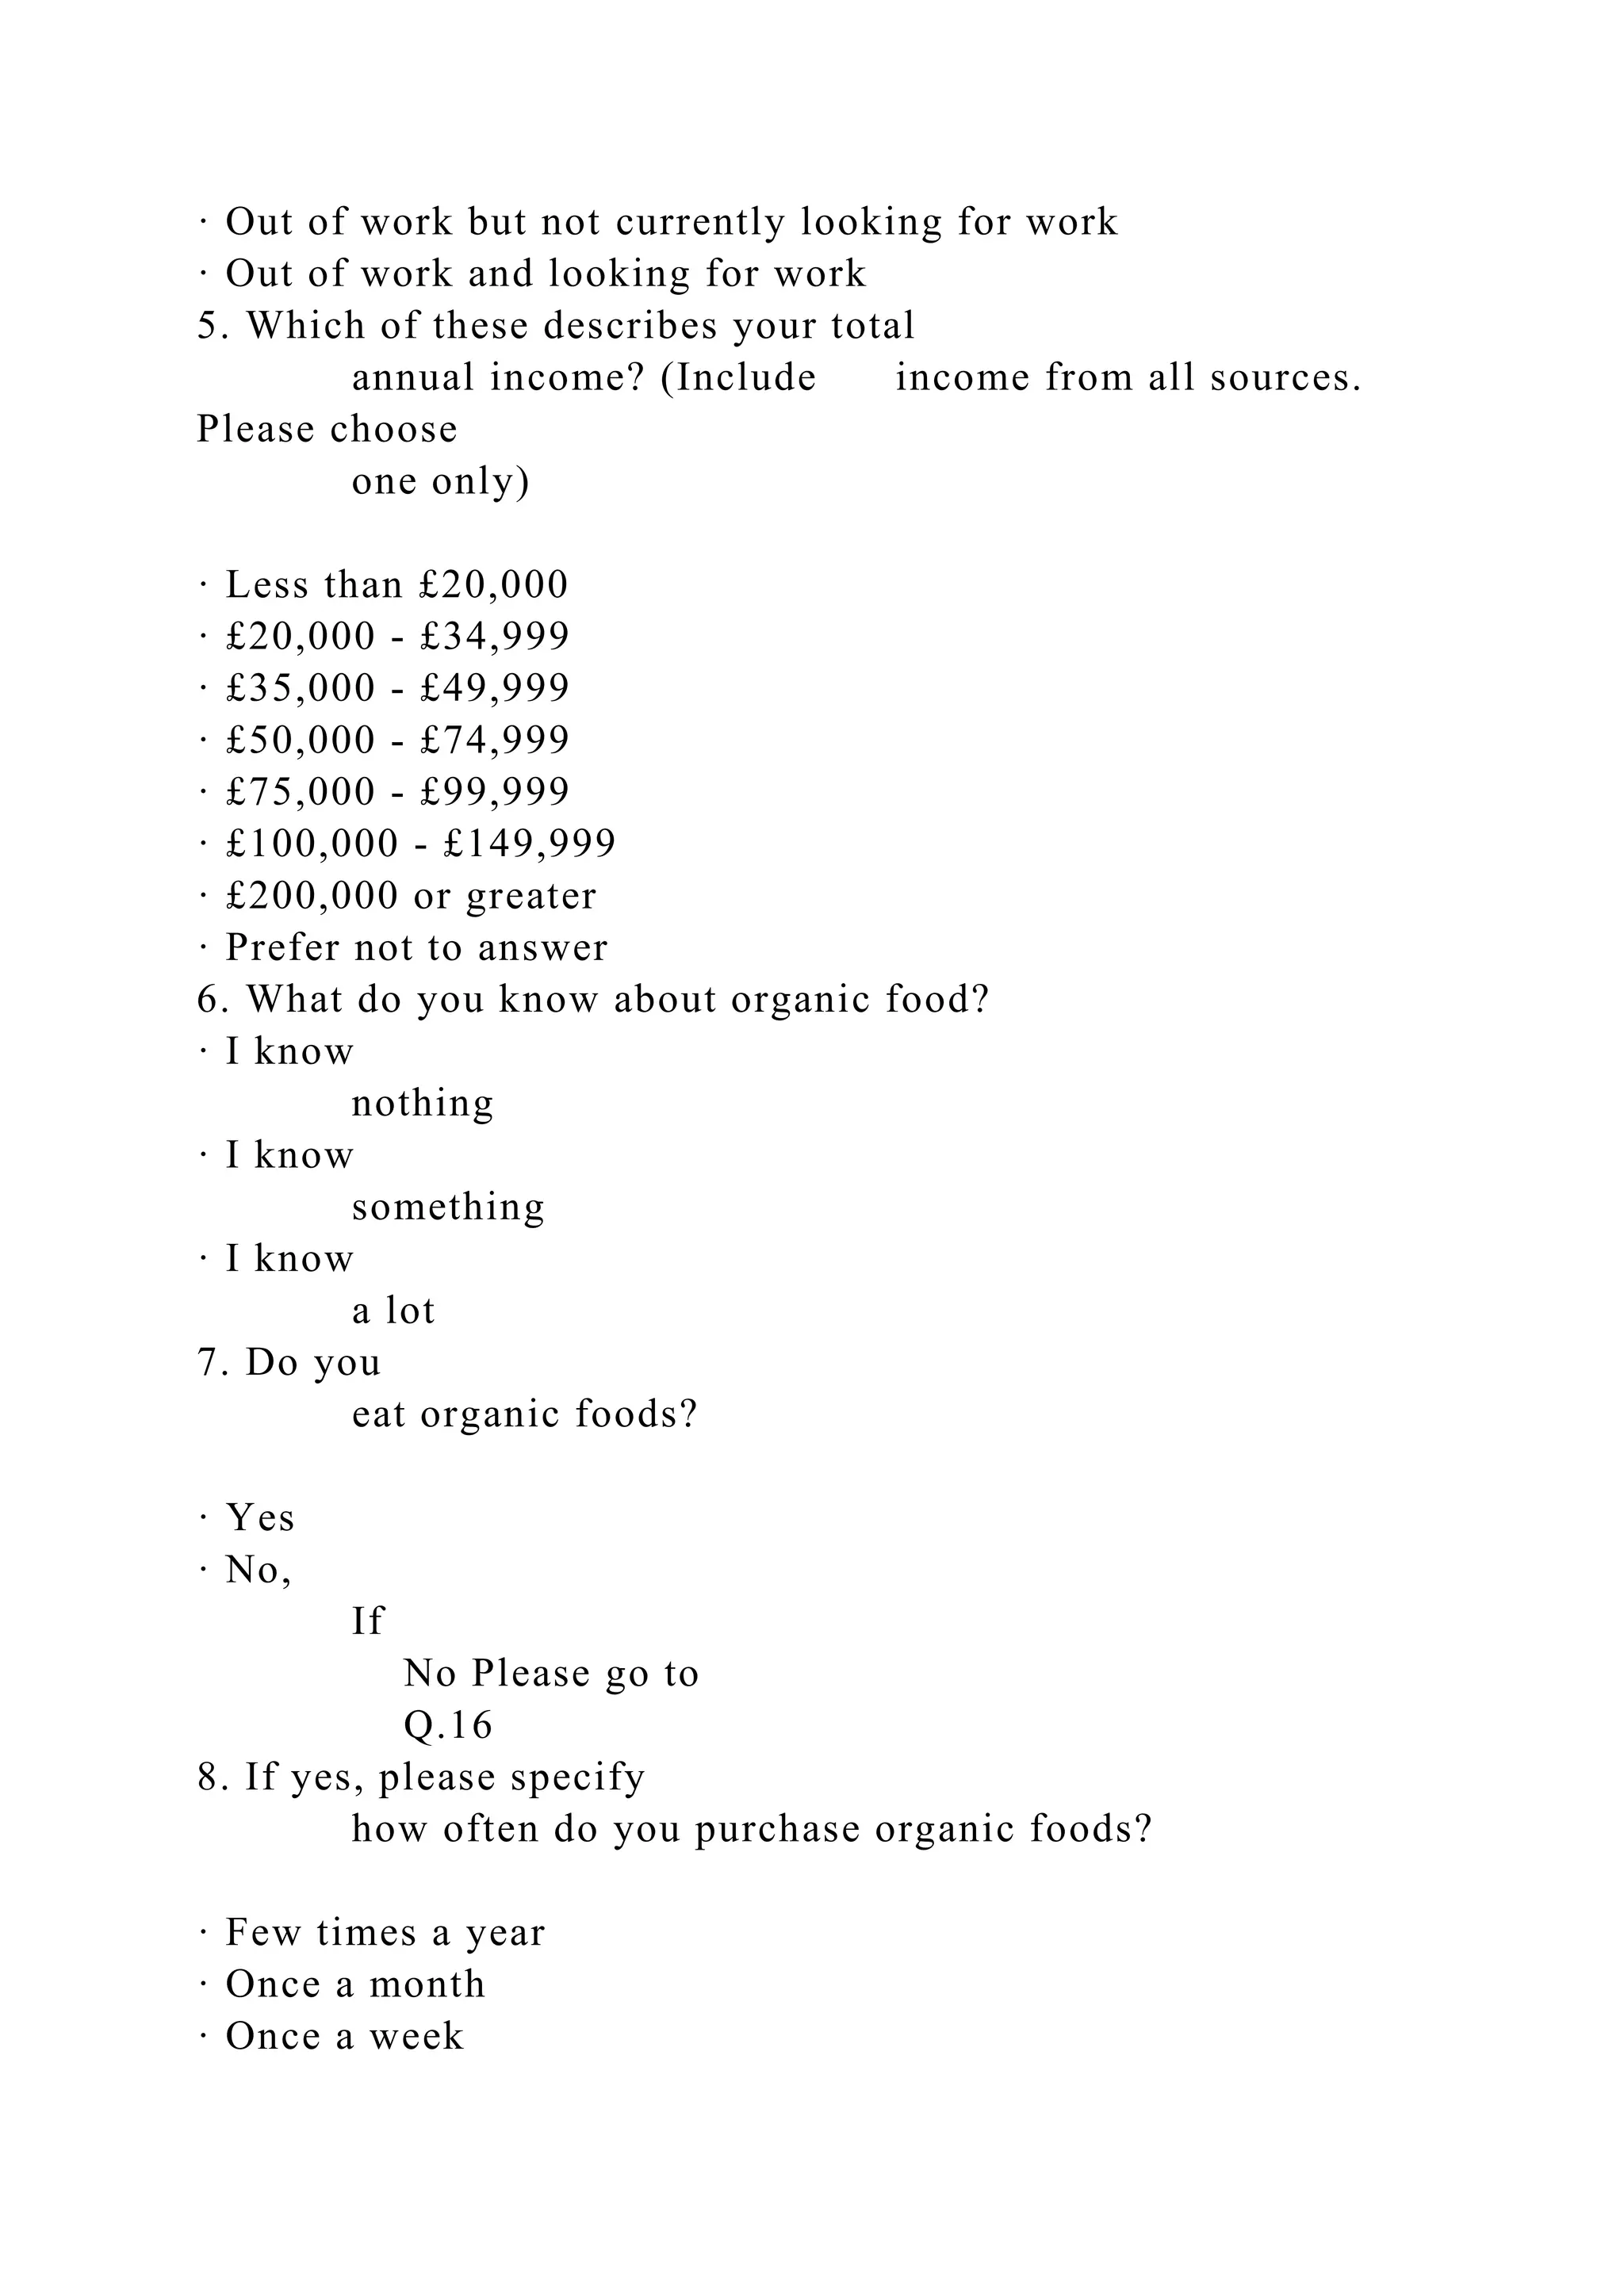
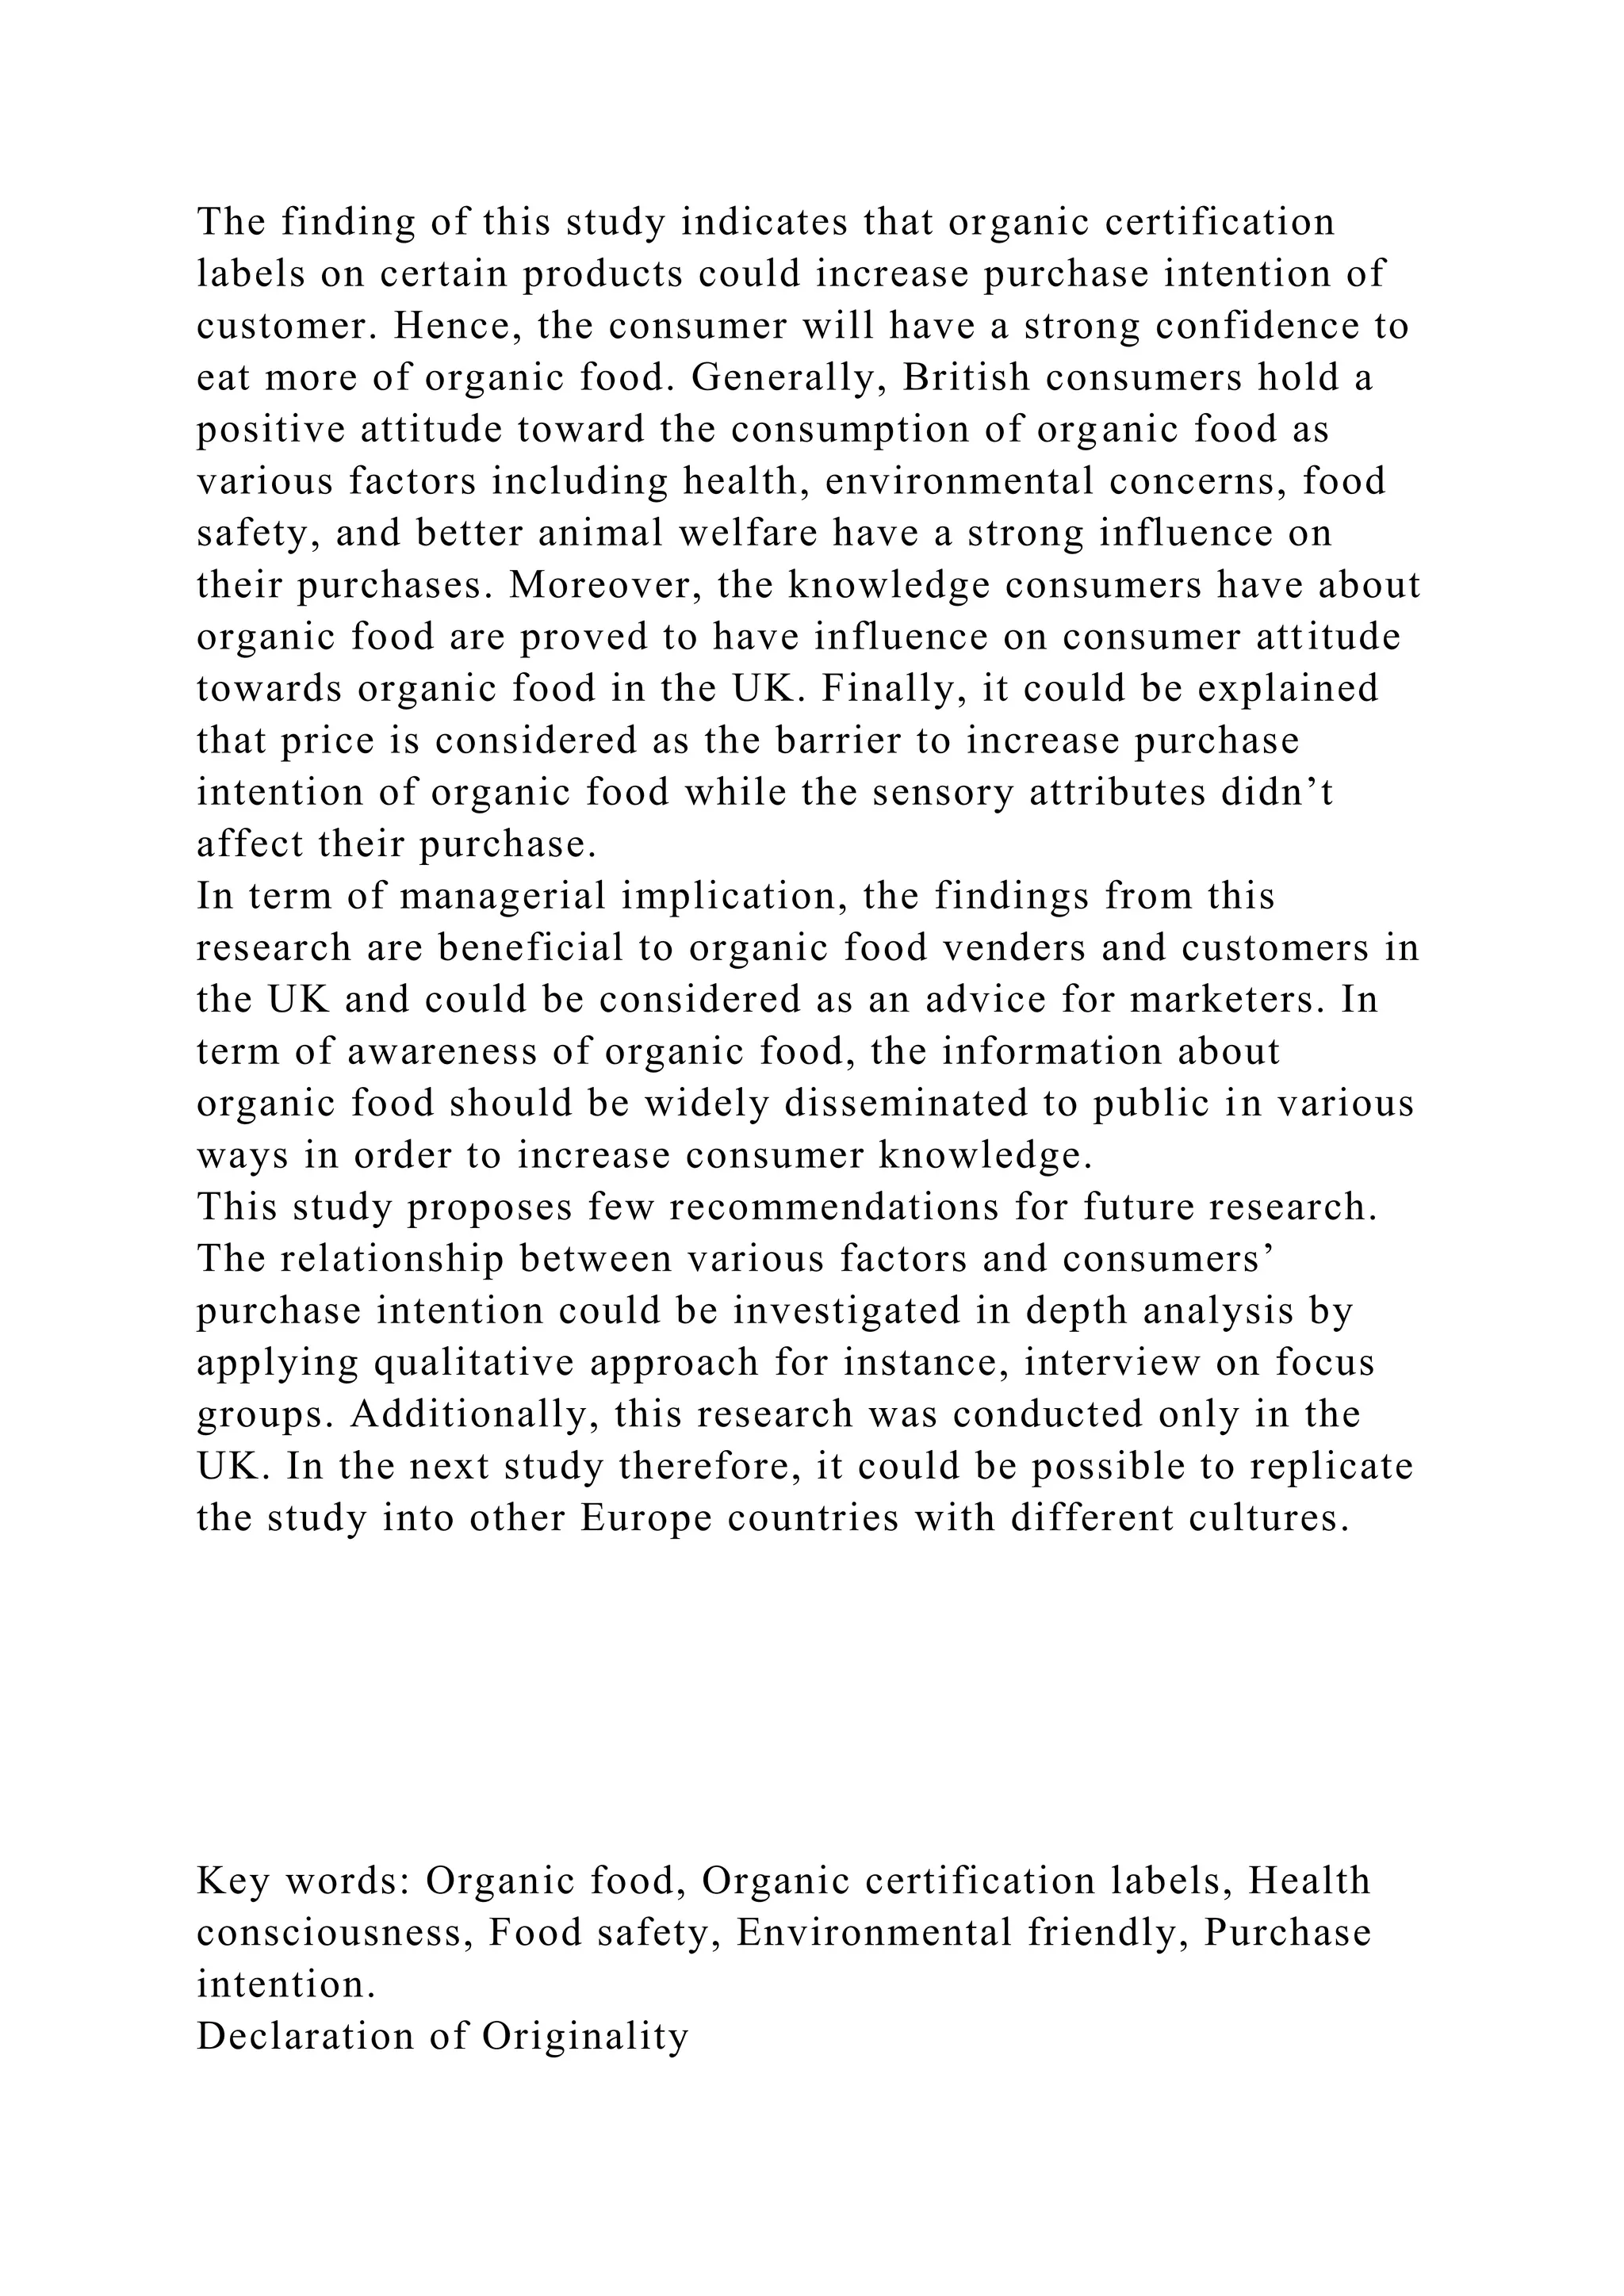
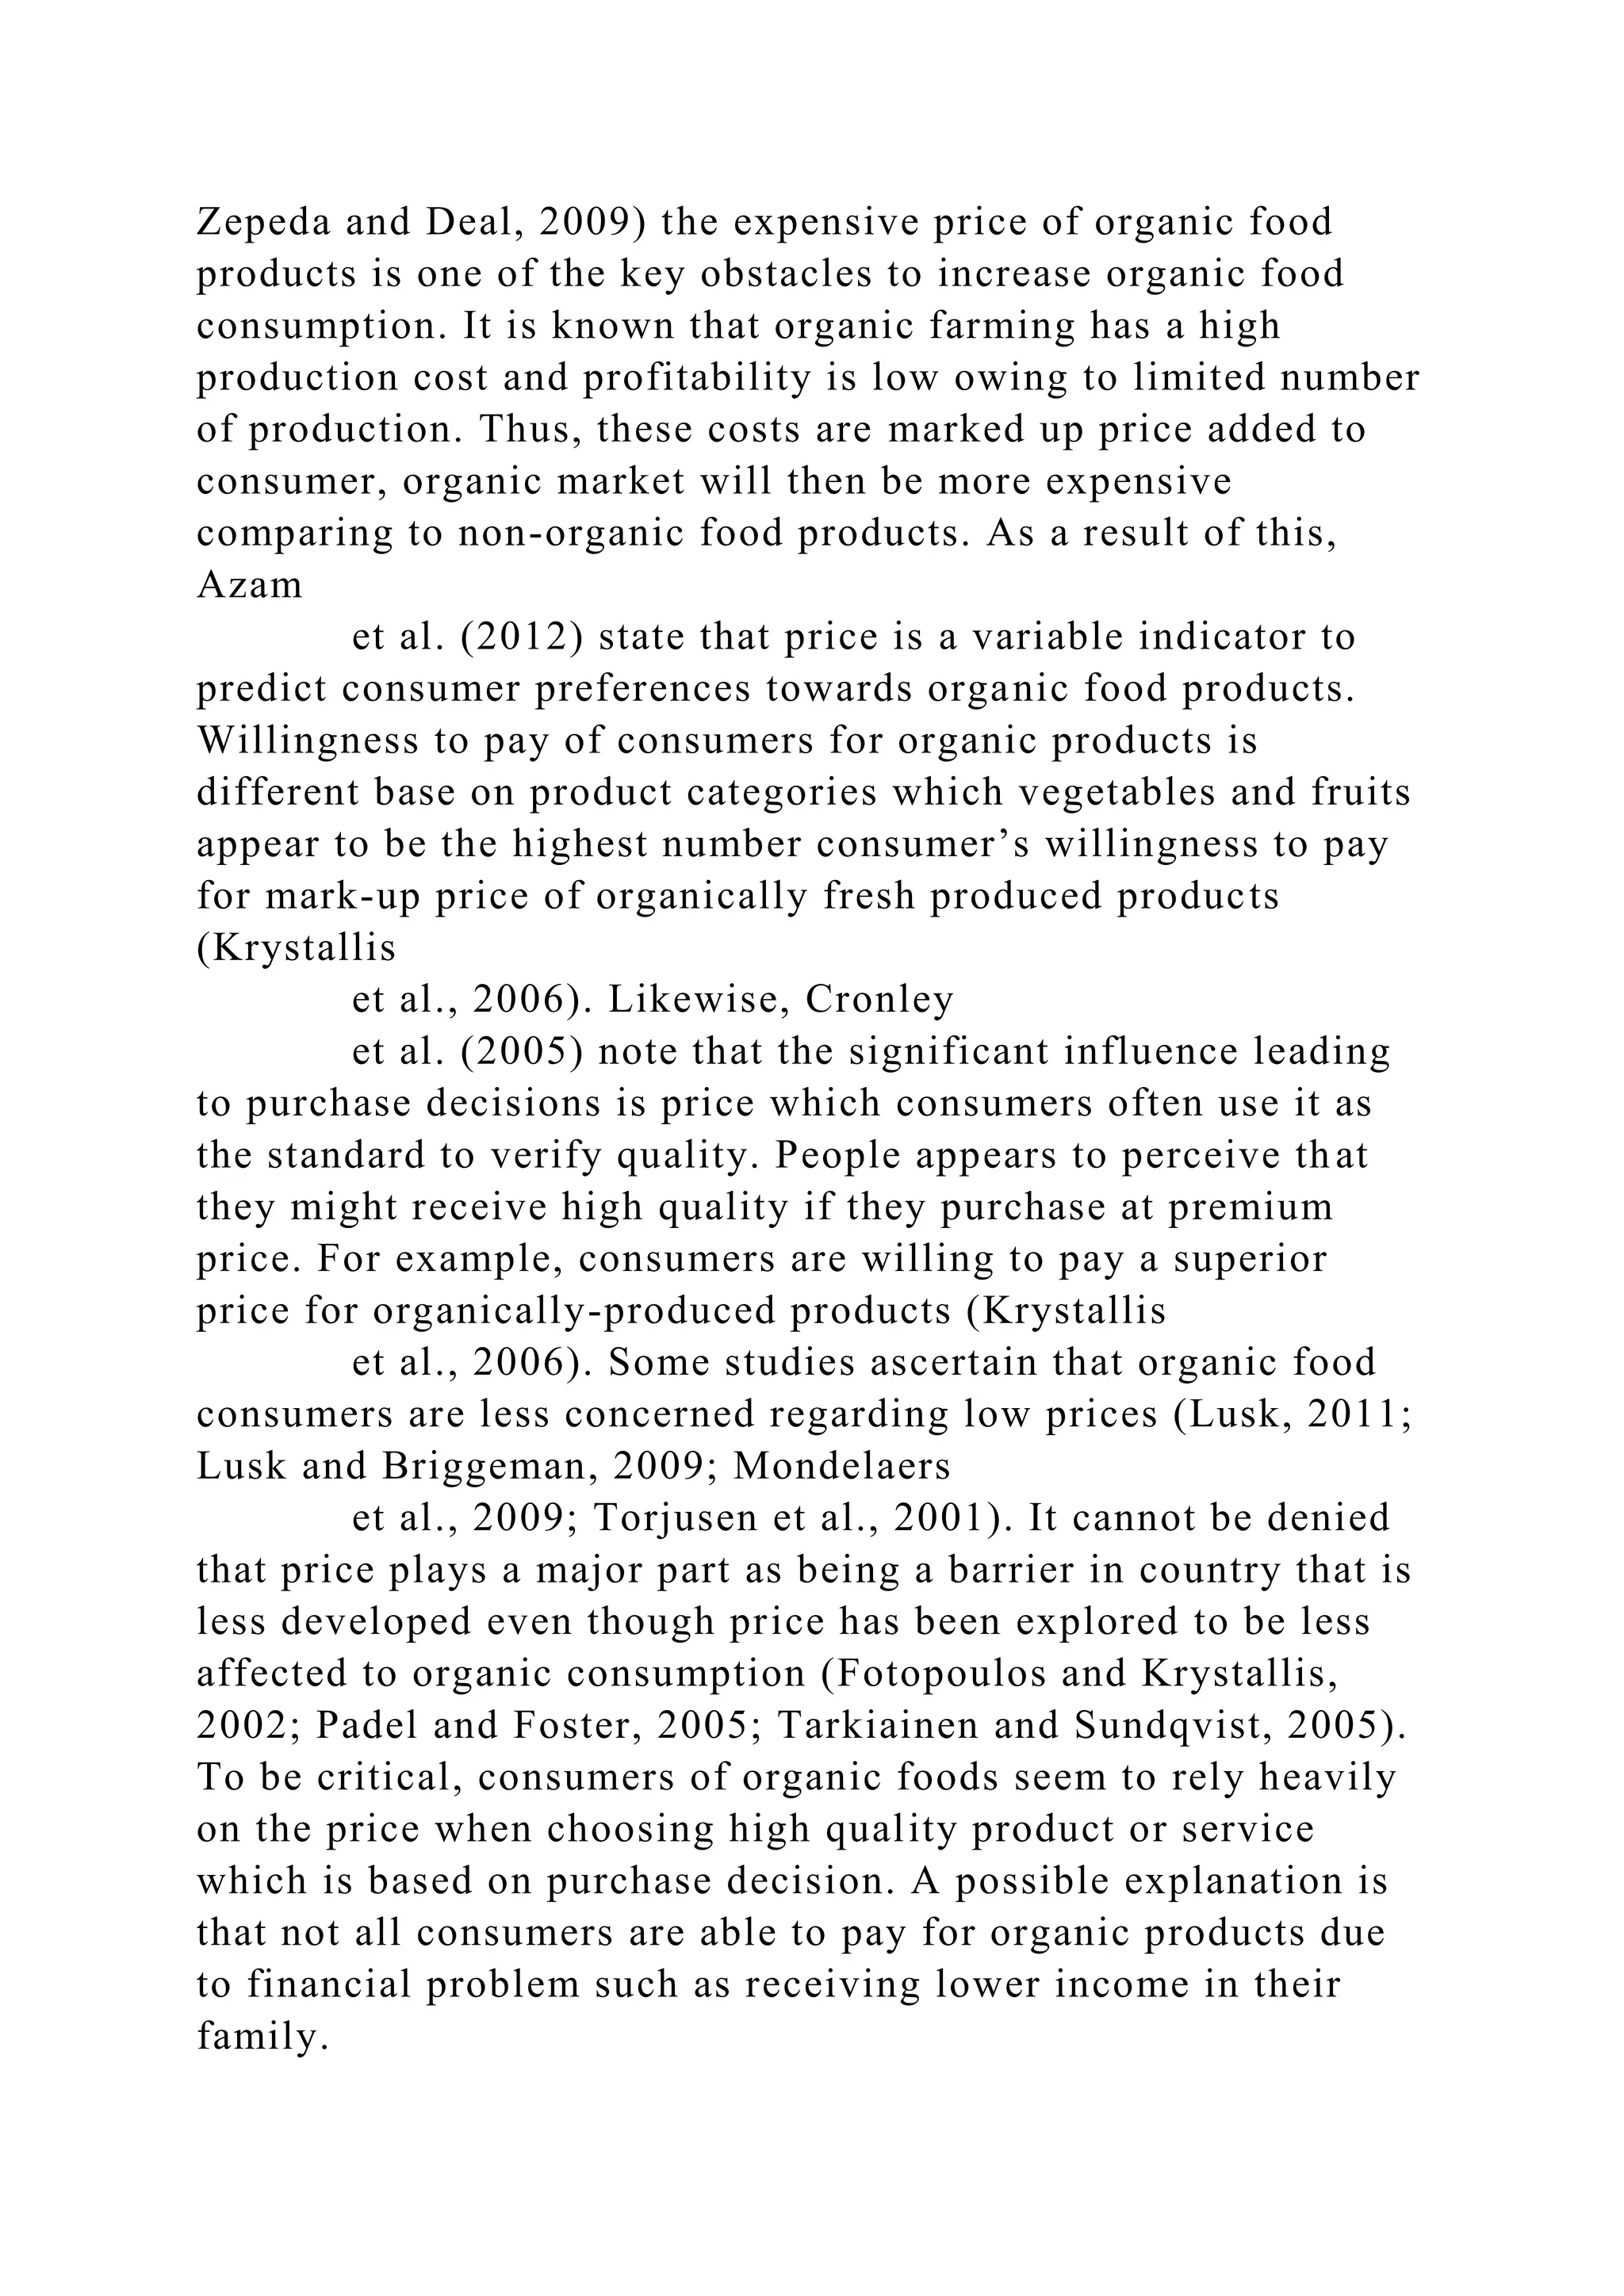
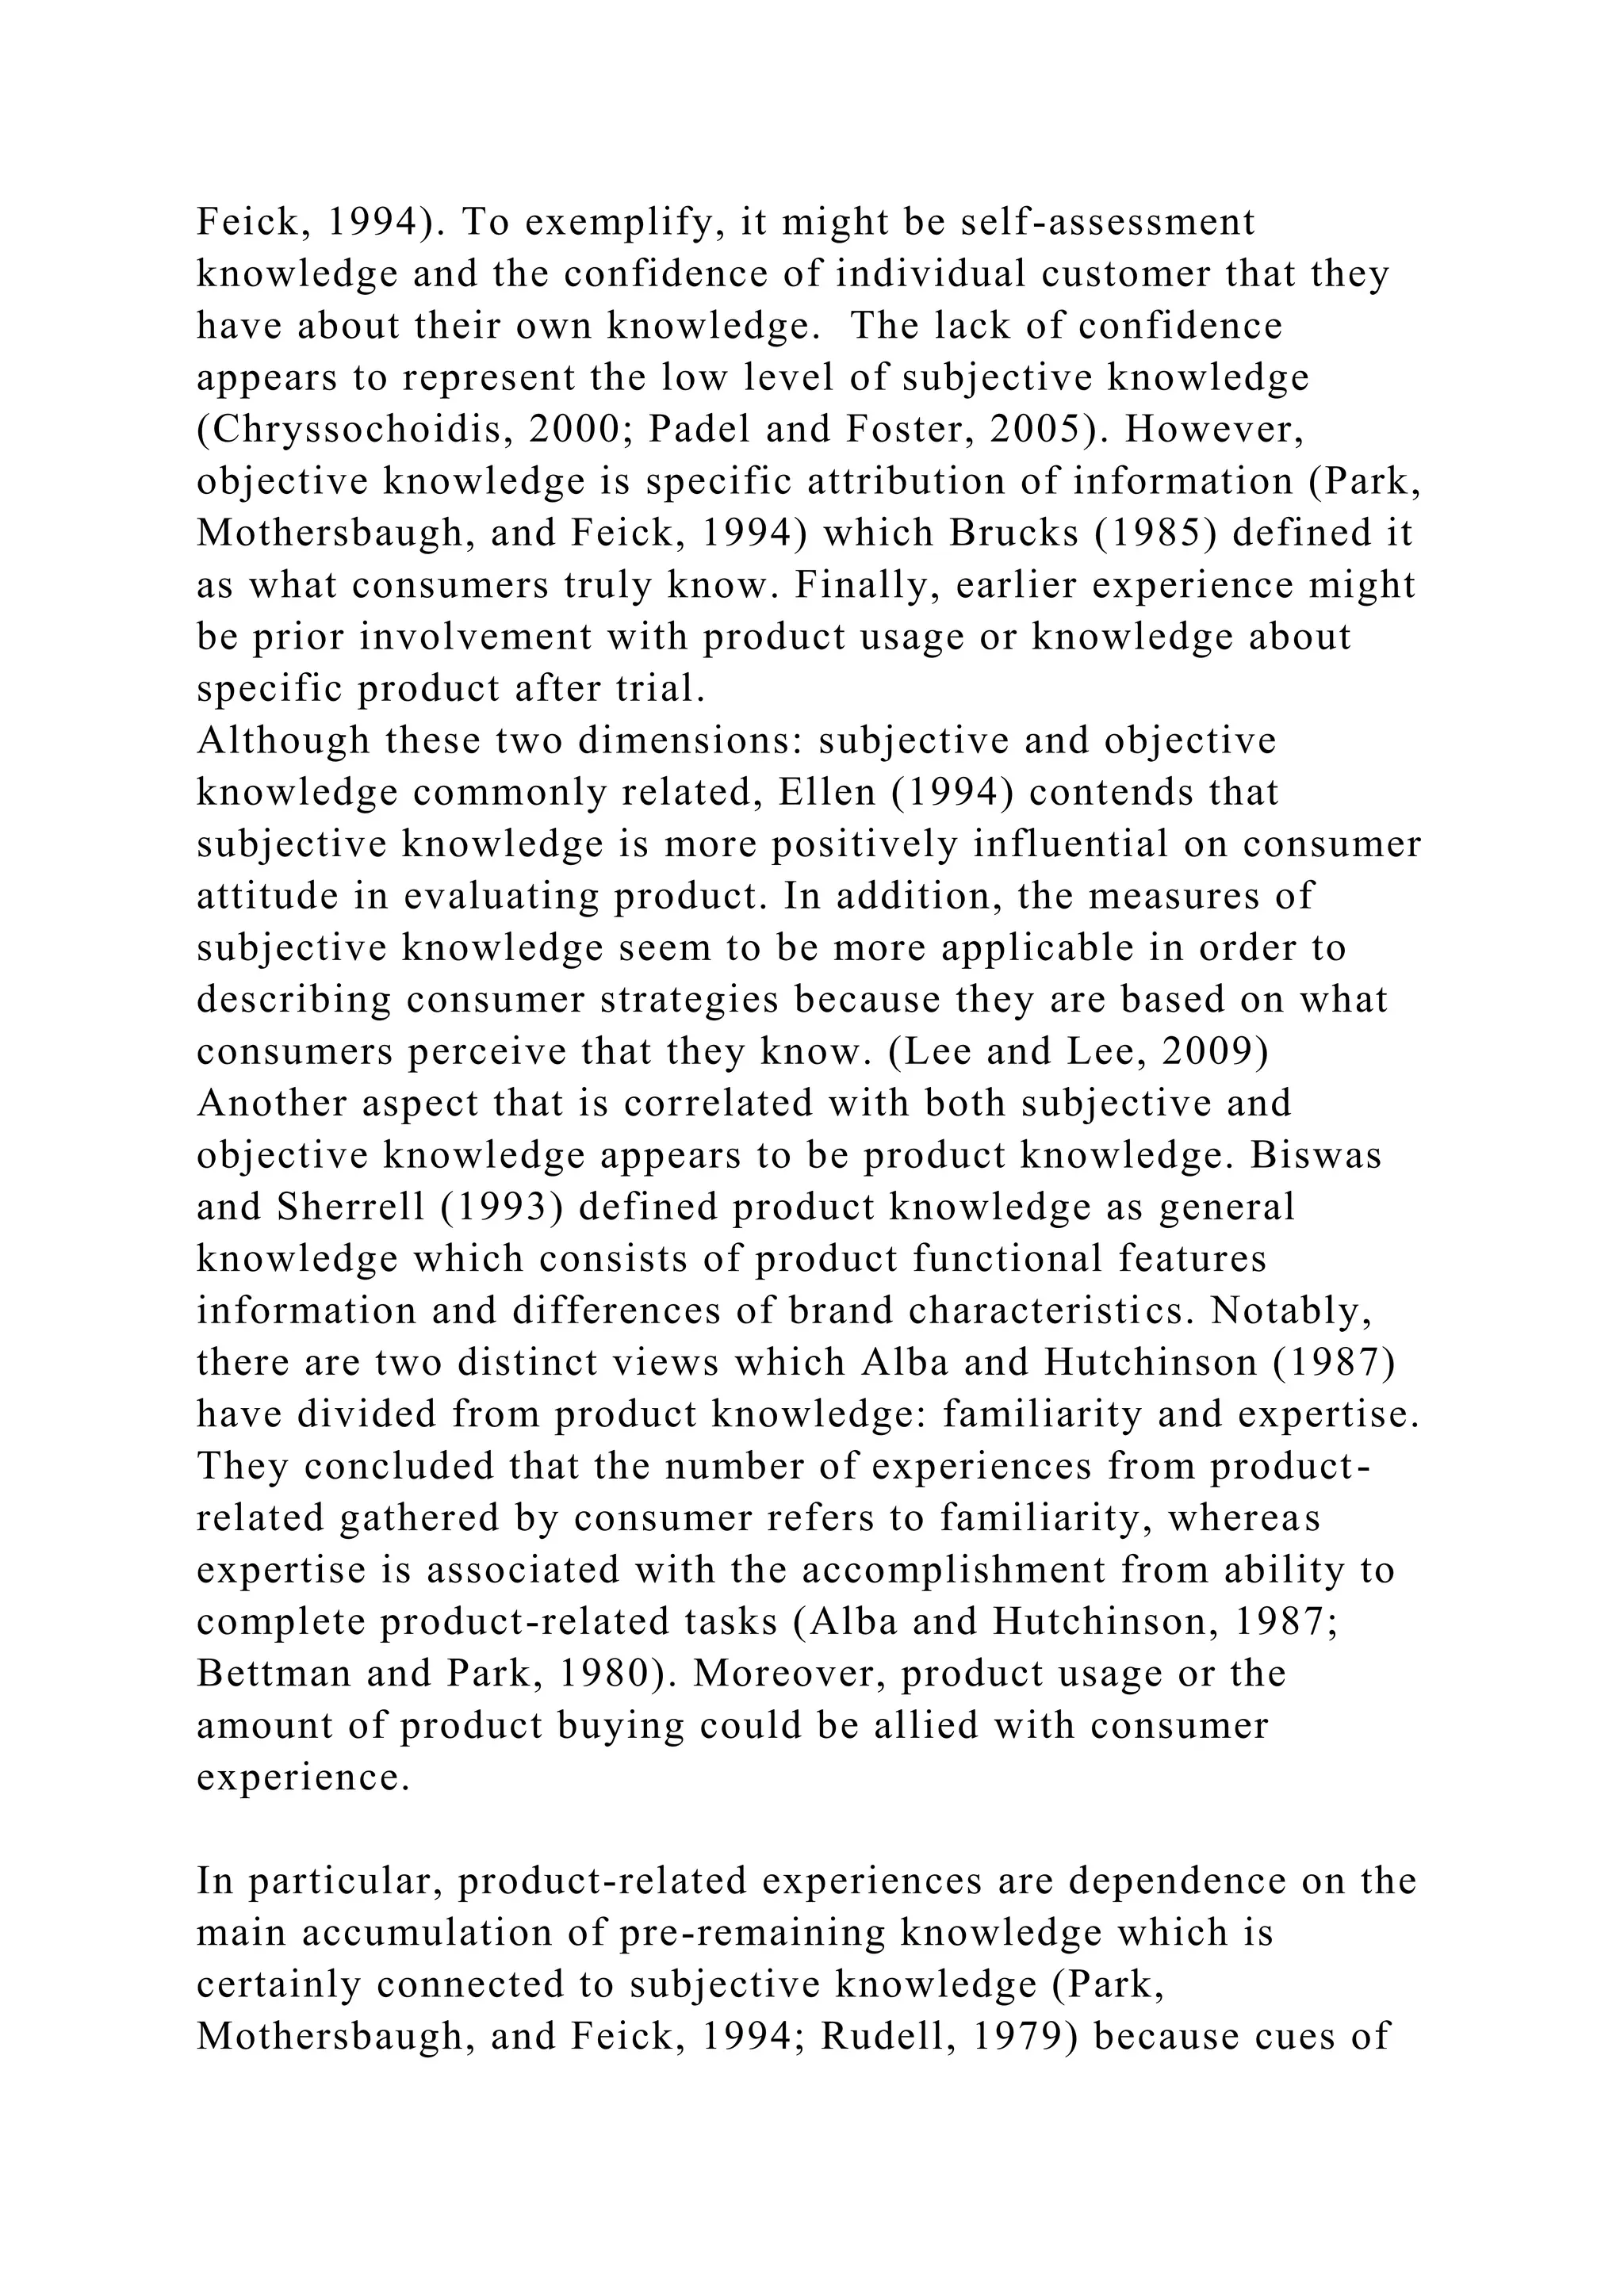
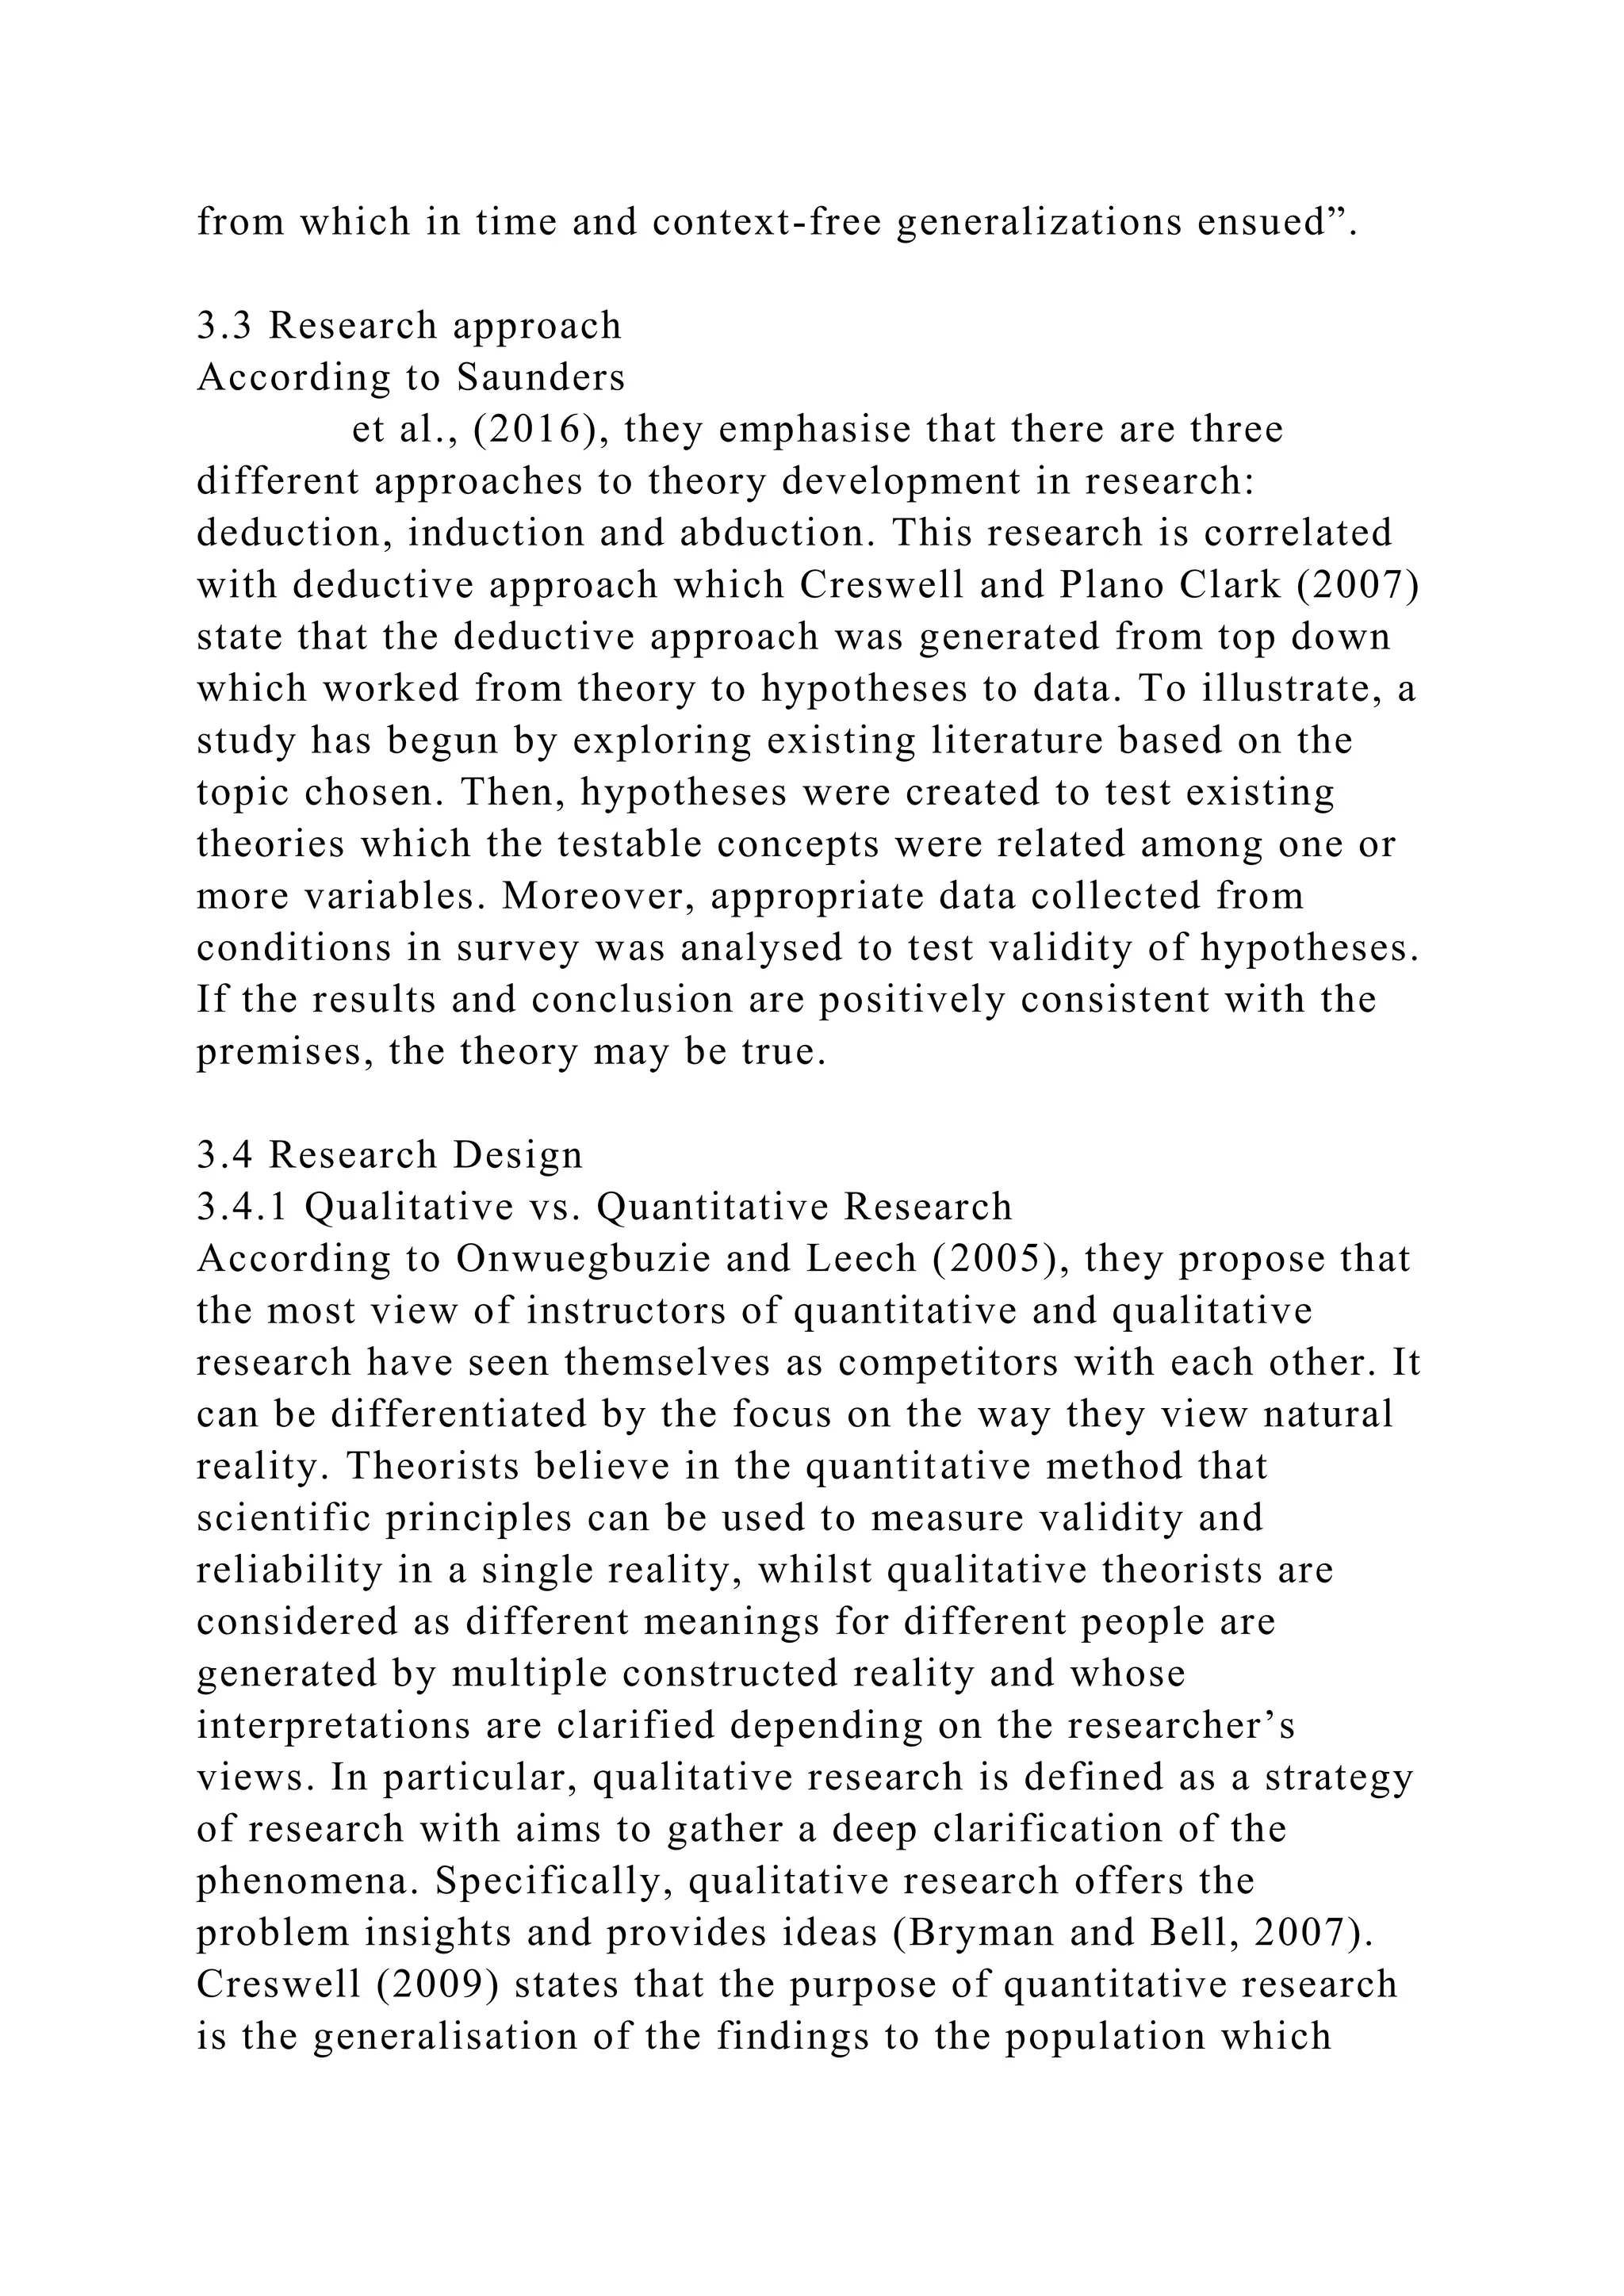
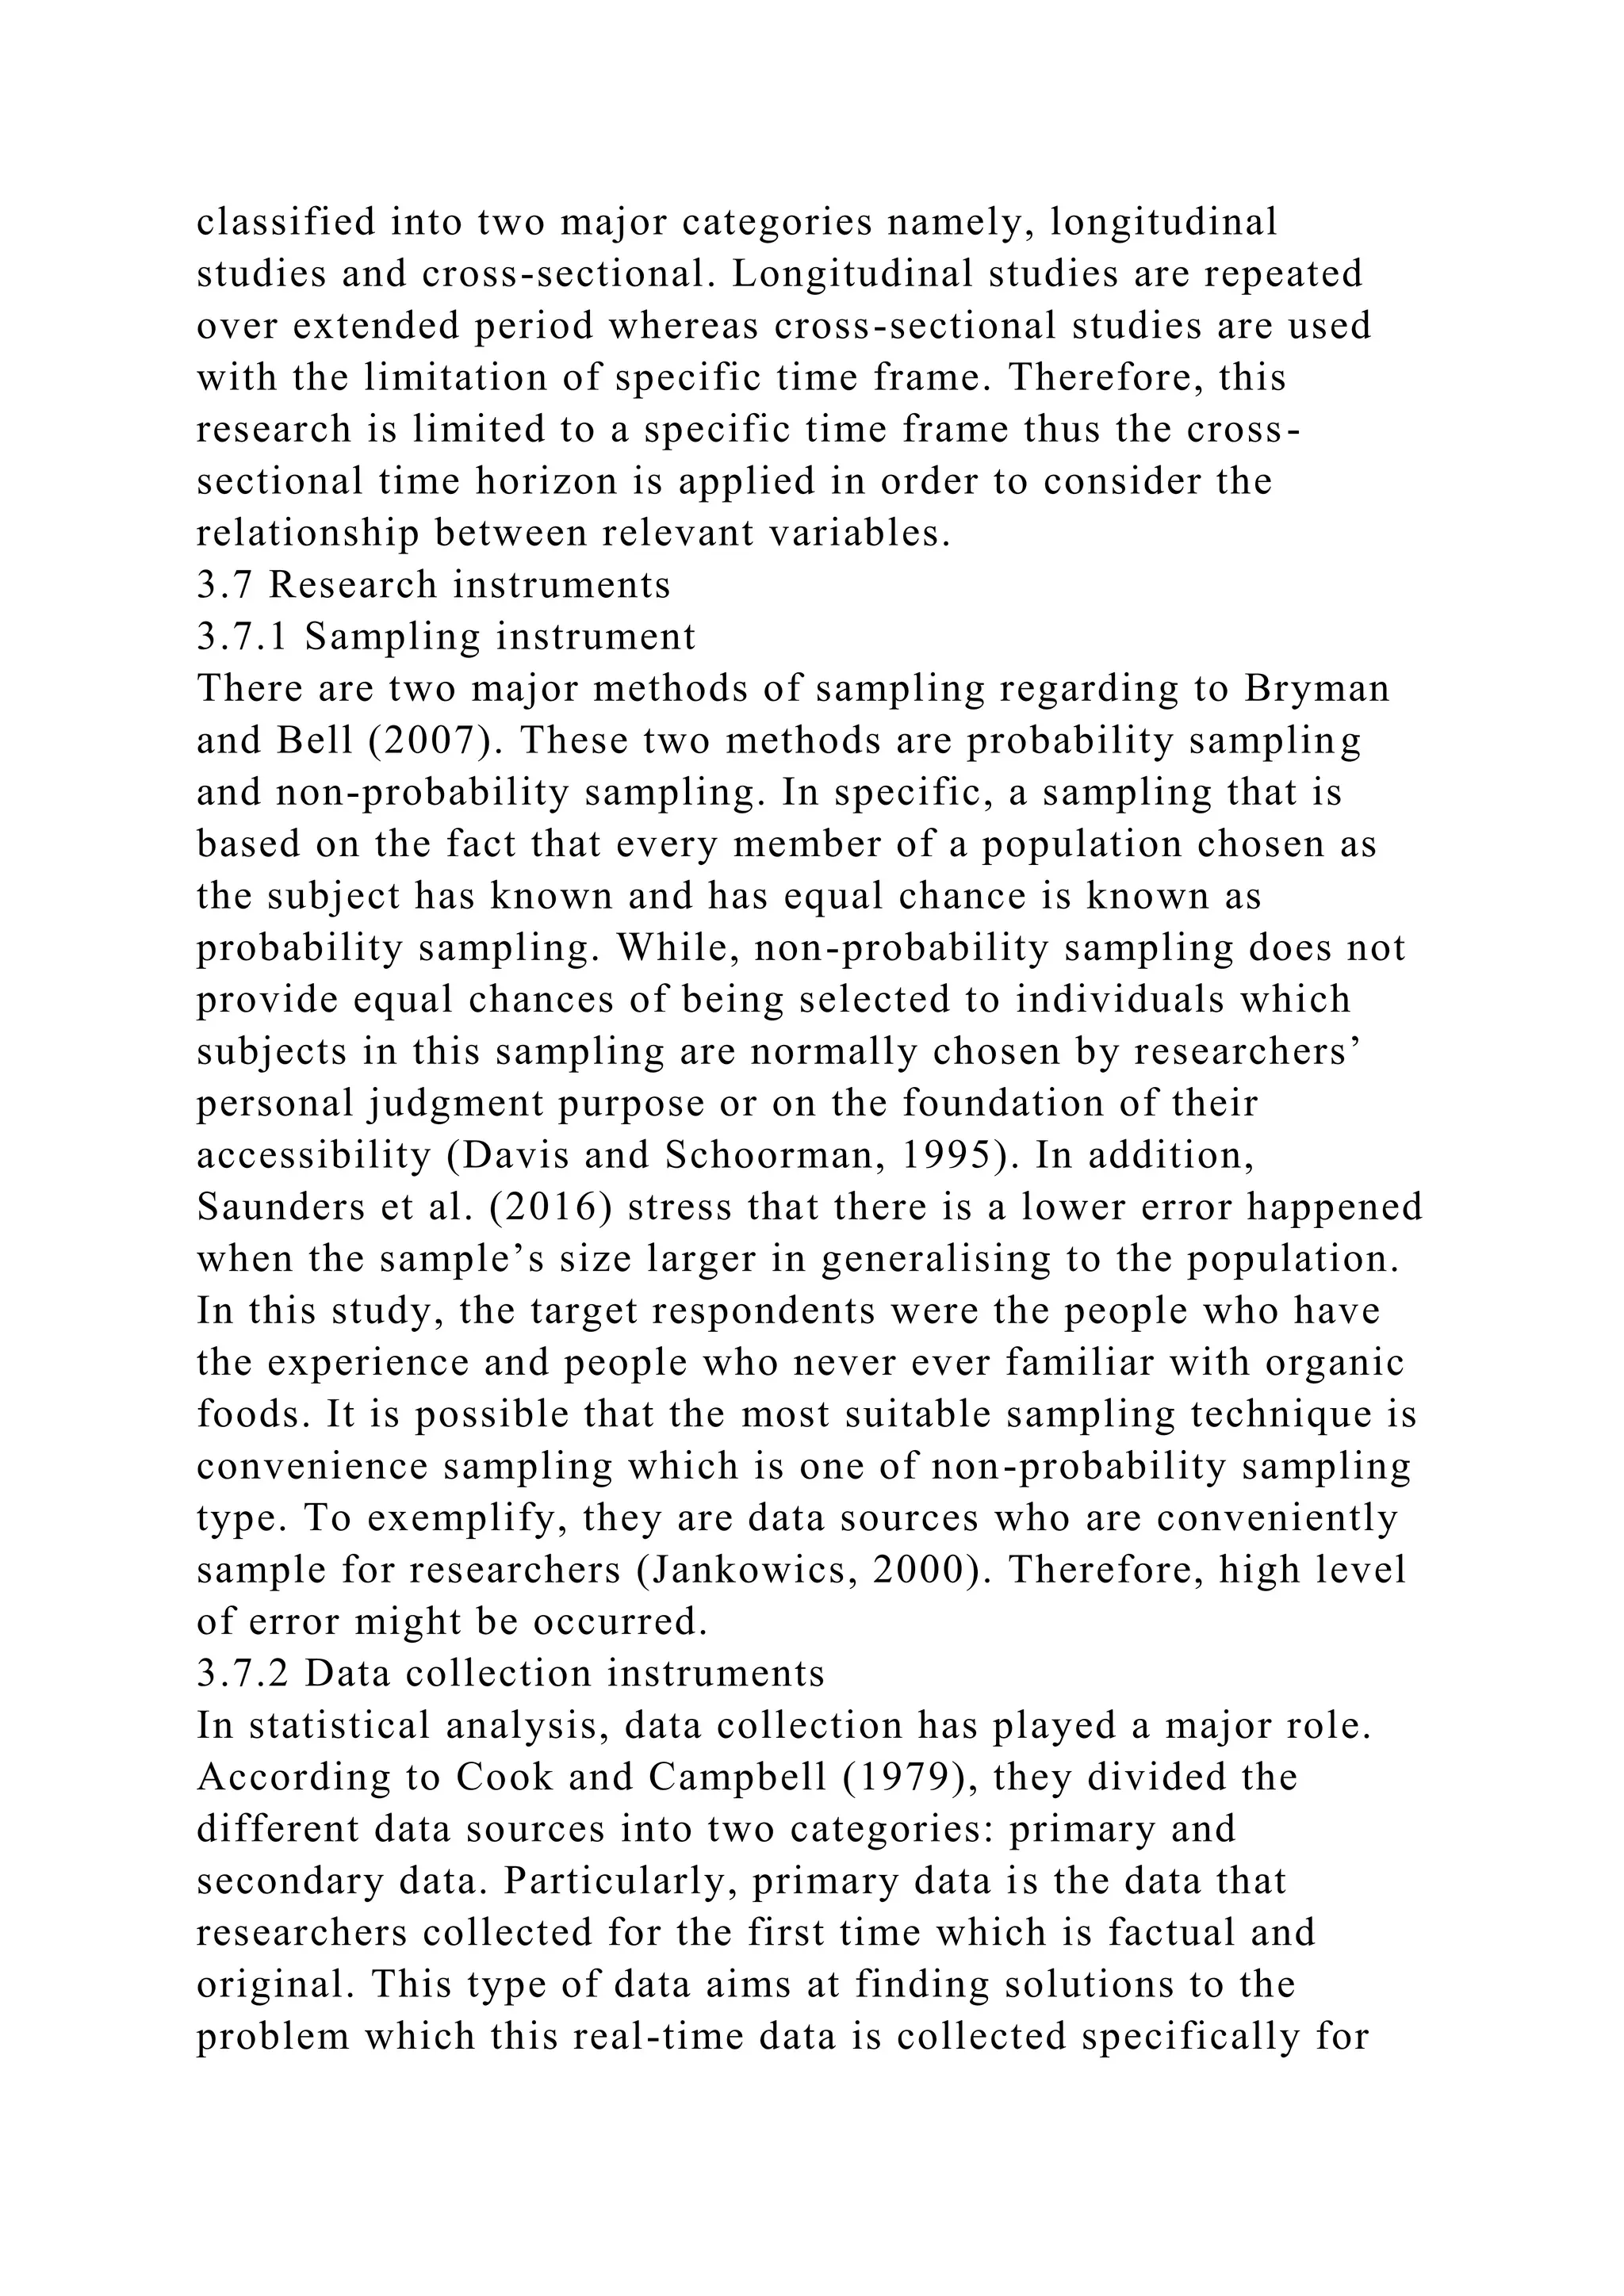
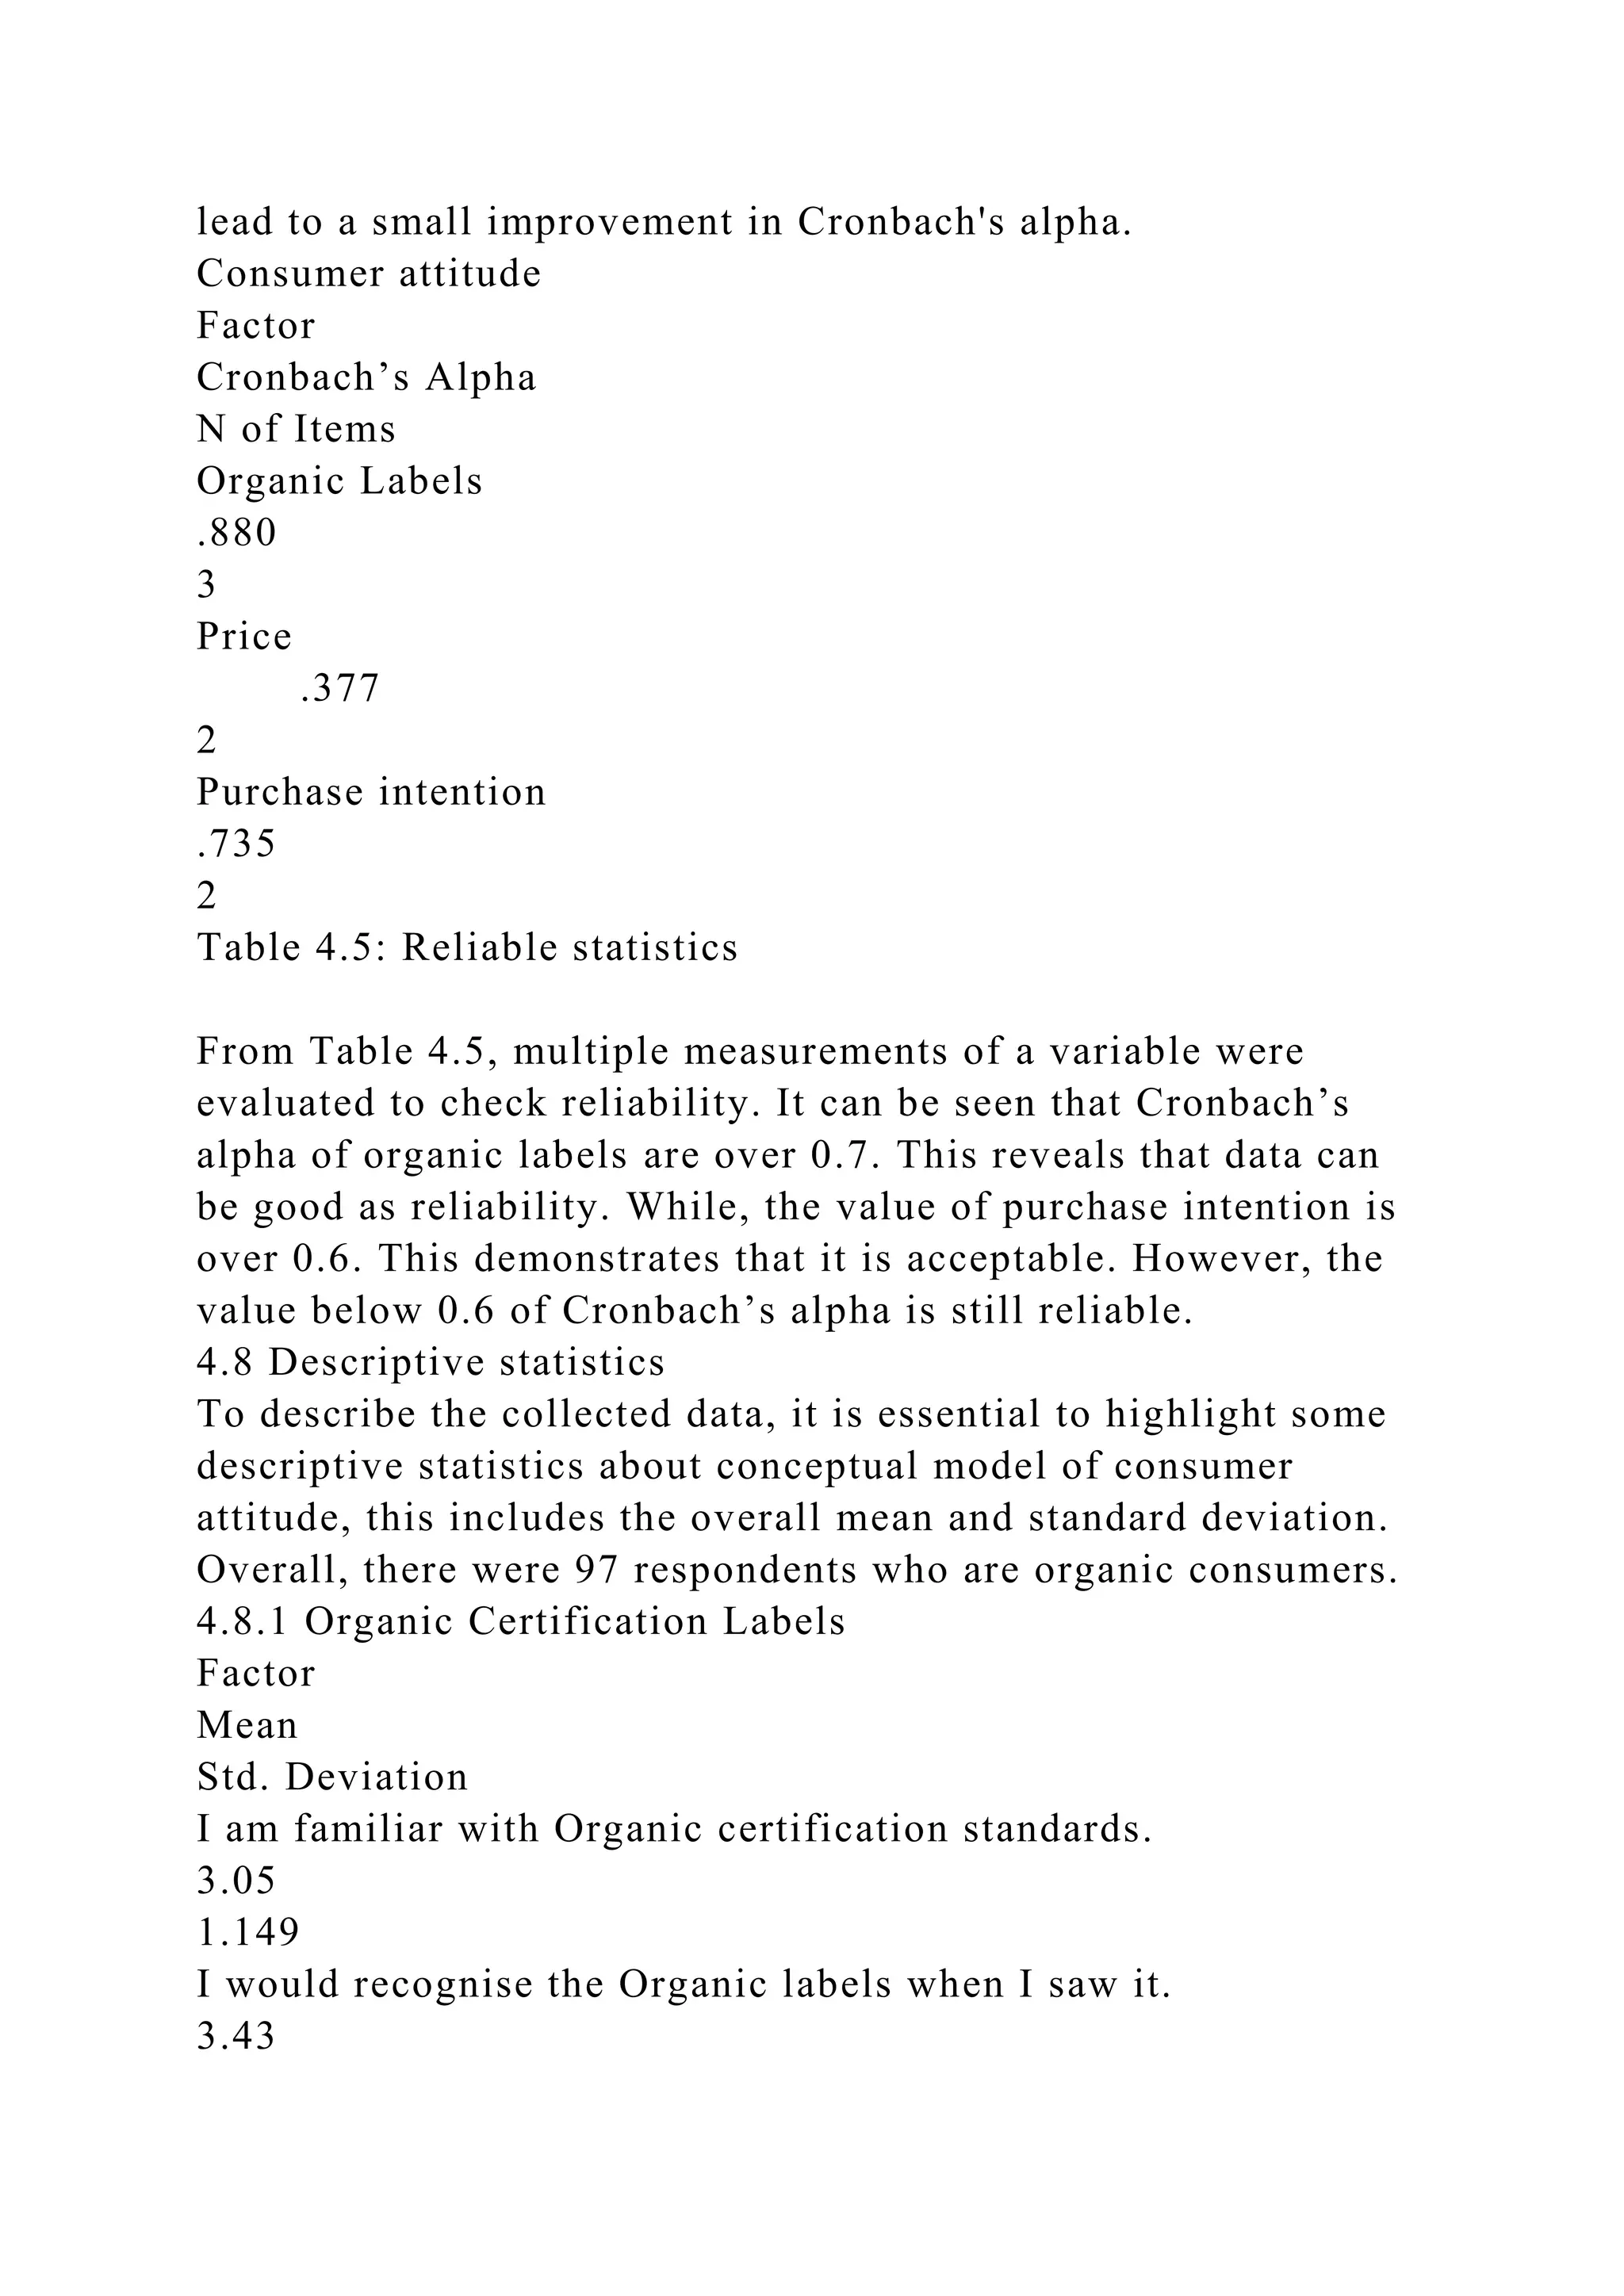
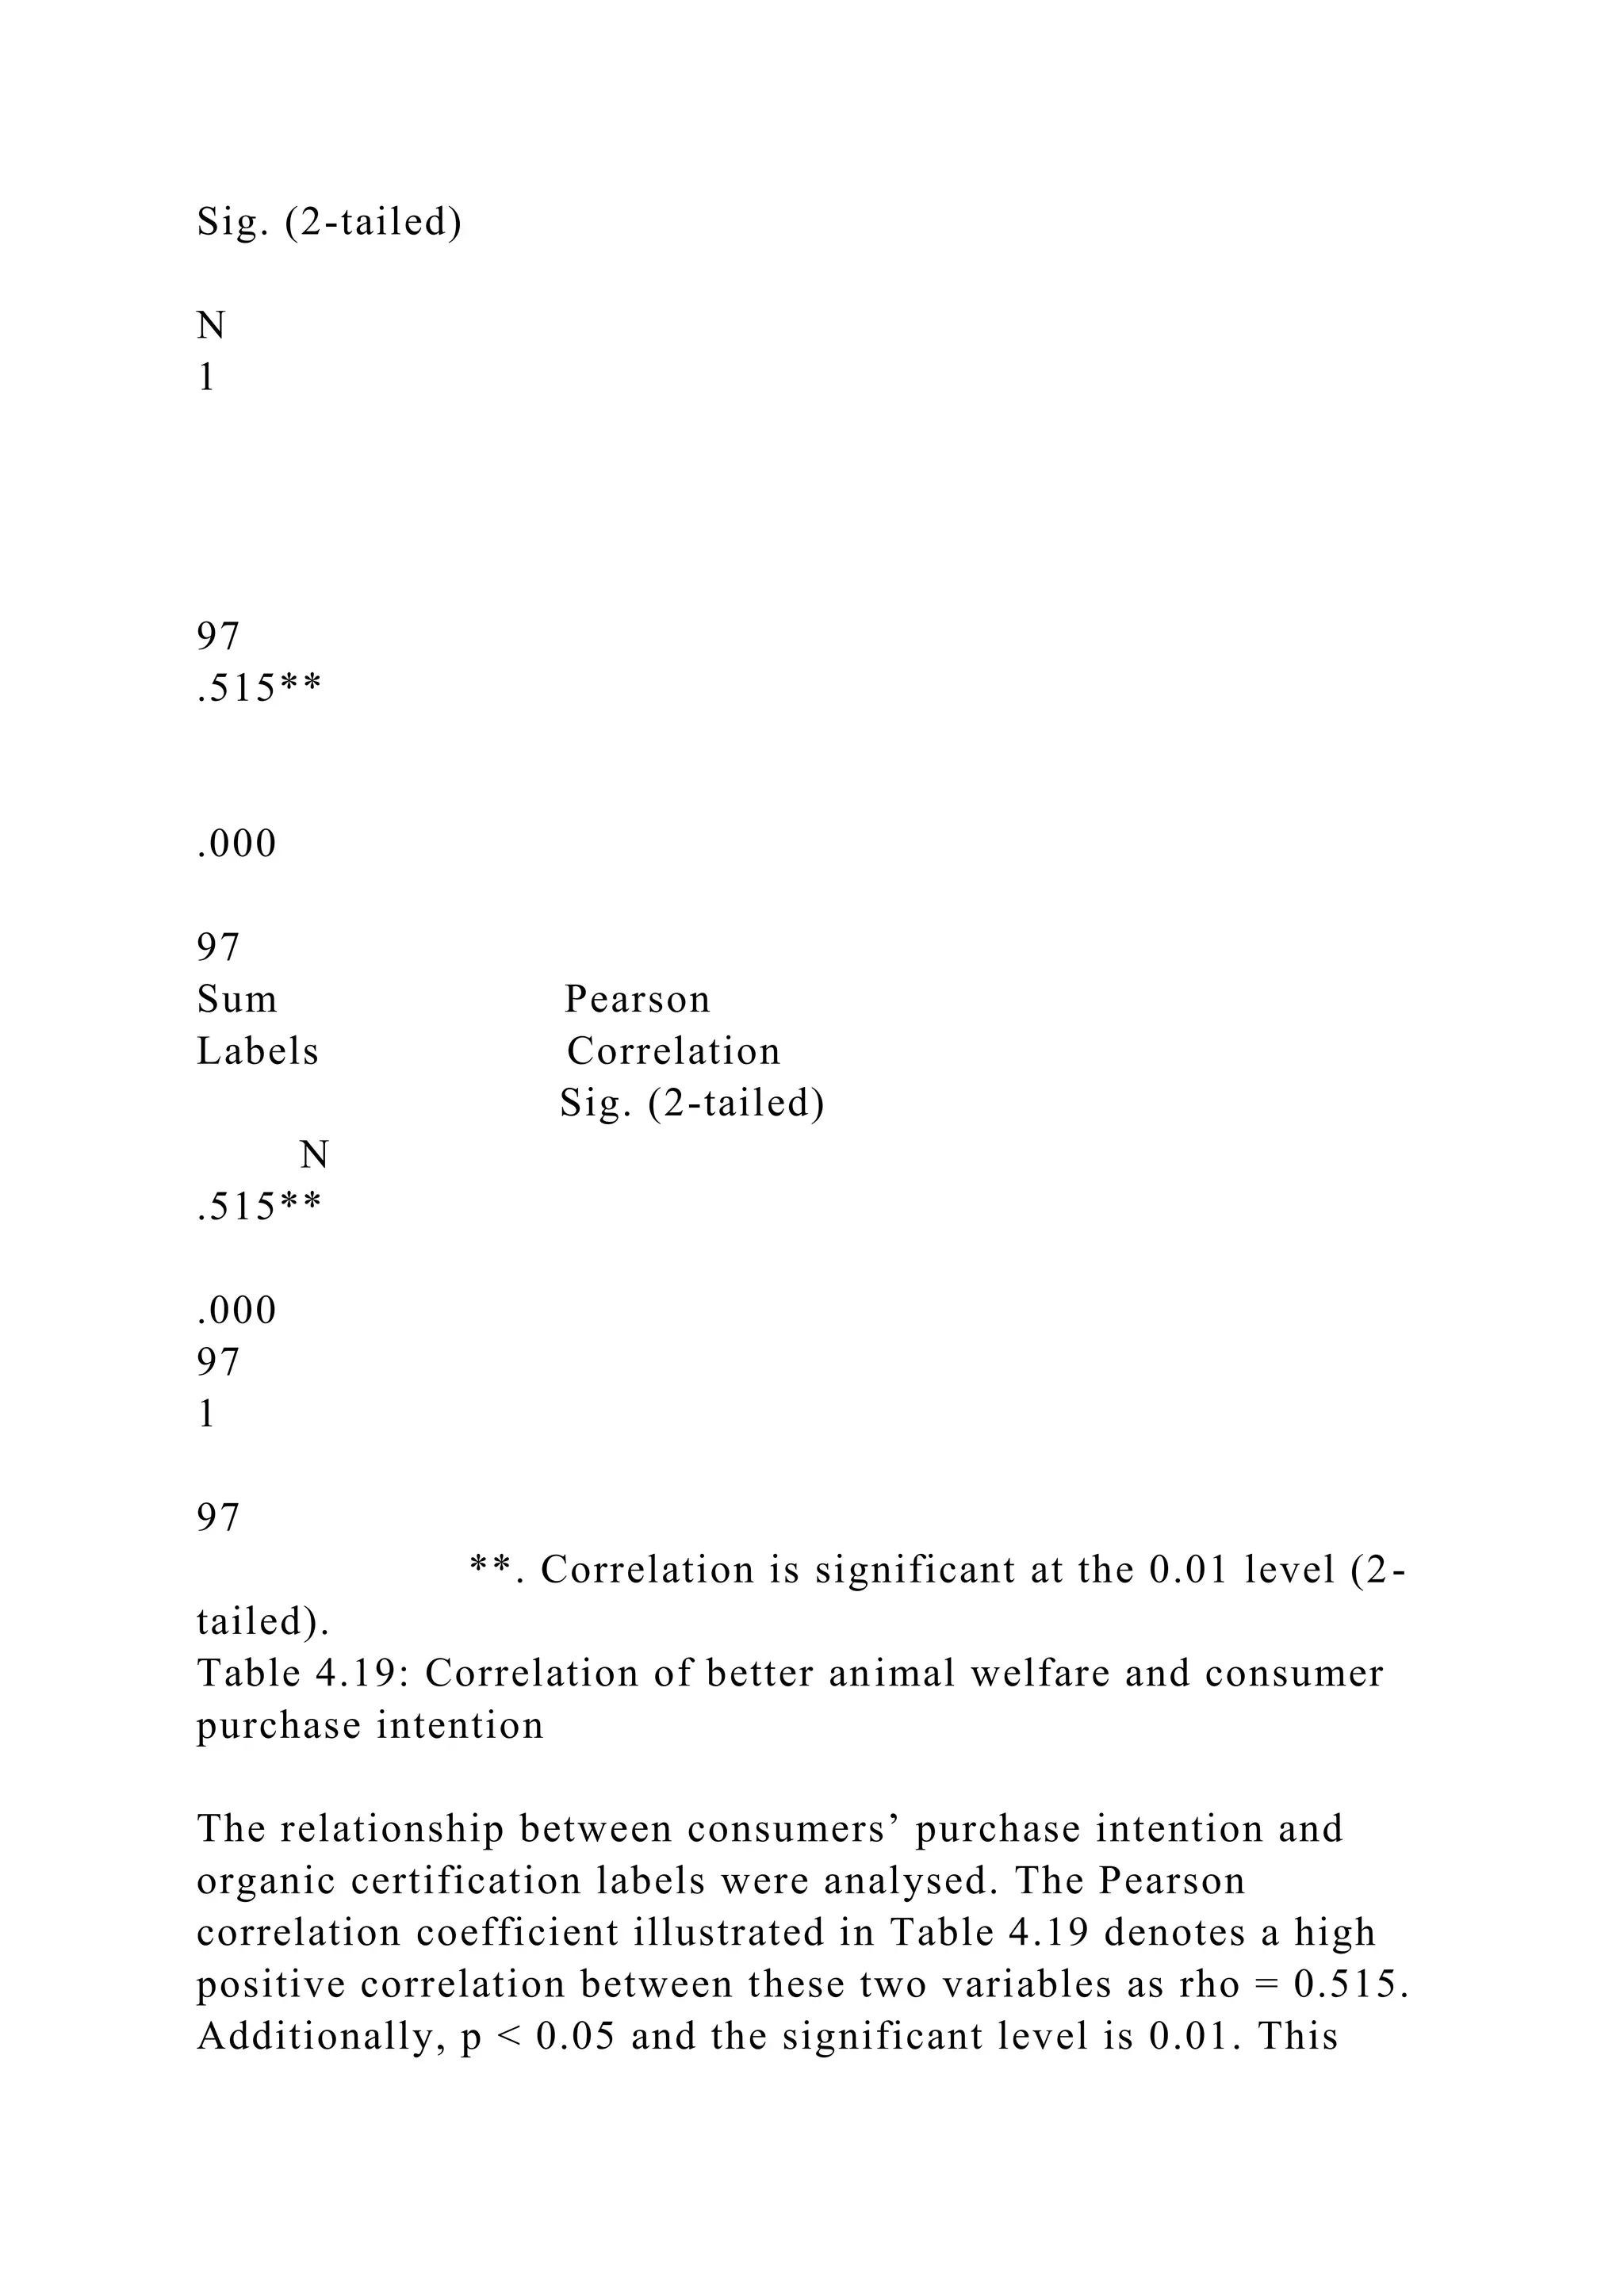
![Reasons for not eating organic food
Reasons for not eating organic foo d It's too expensive
It's not available where I shop I don't think it's different
from conventional food I don't like the taste 4.2 4.2 8.3
2.5
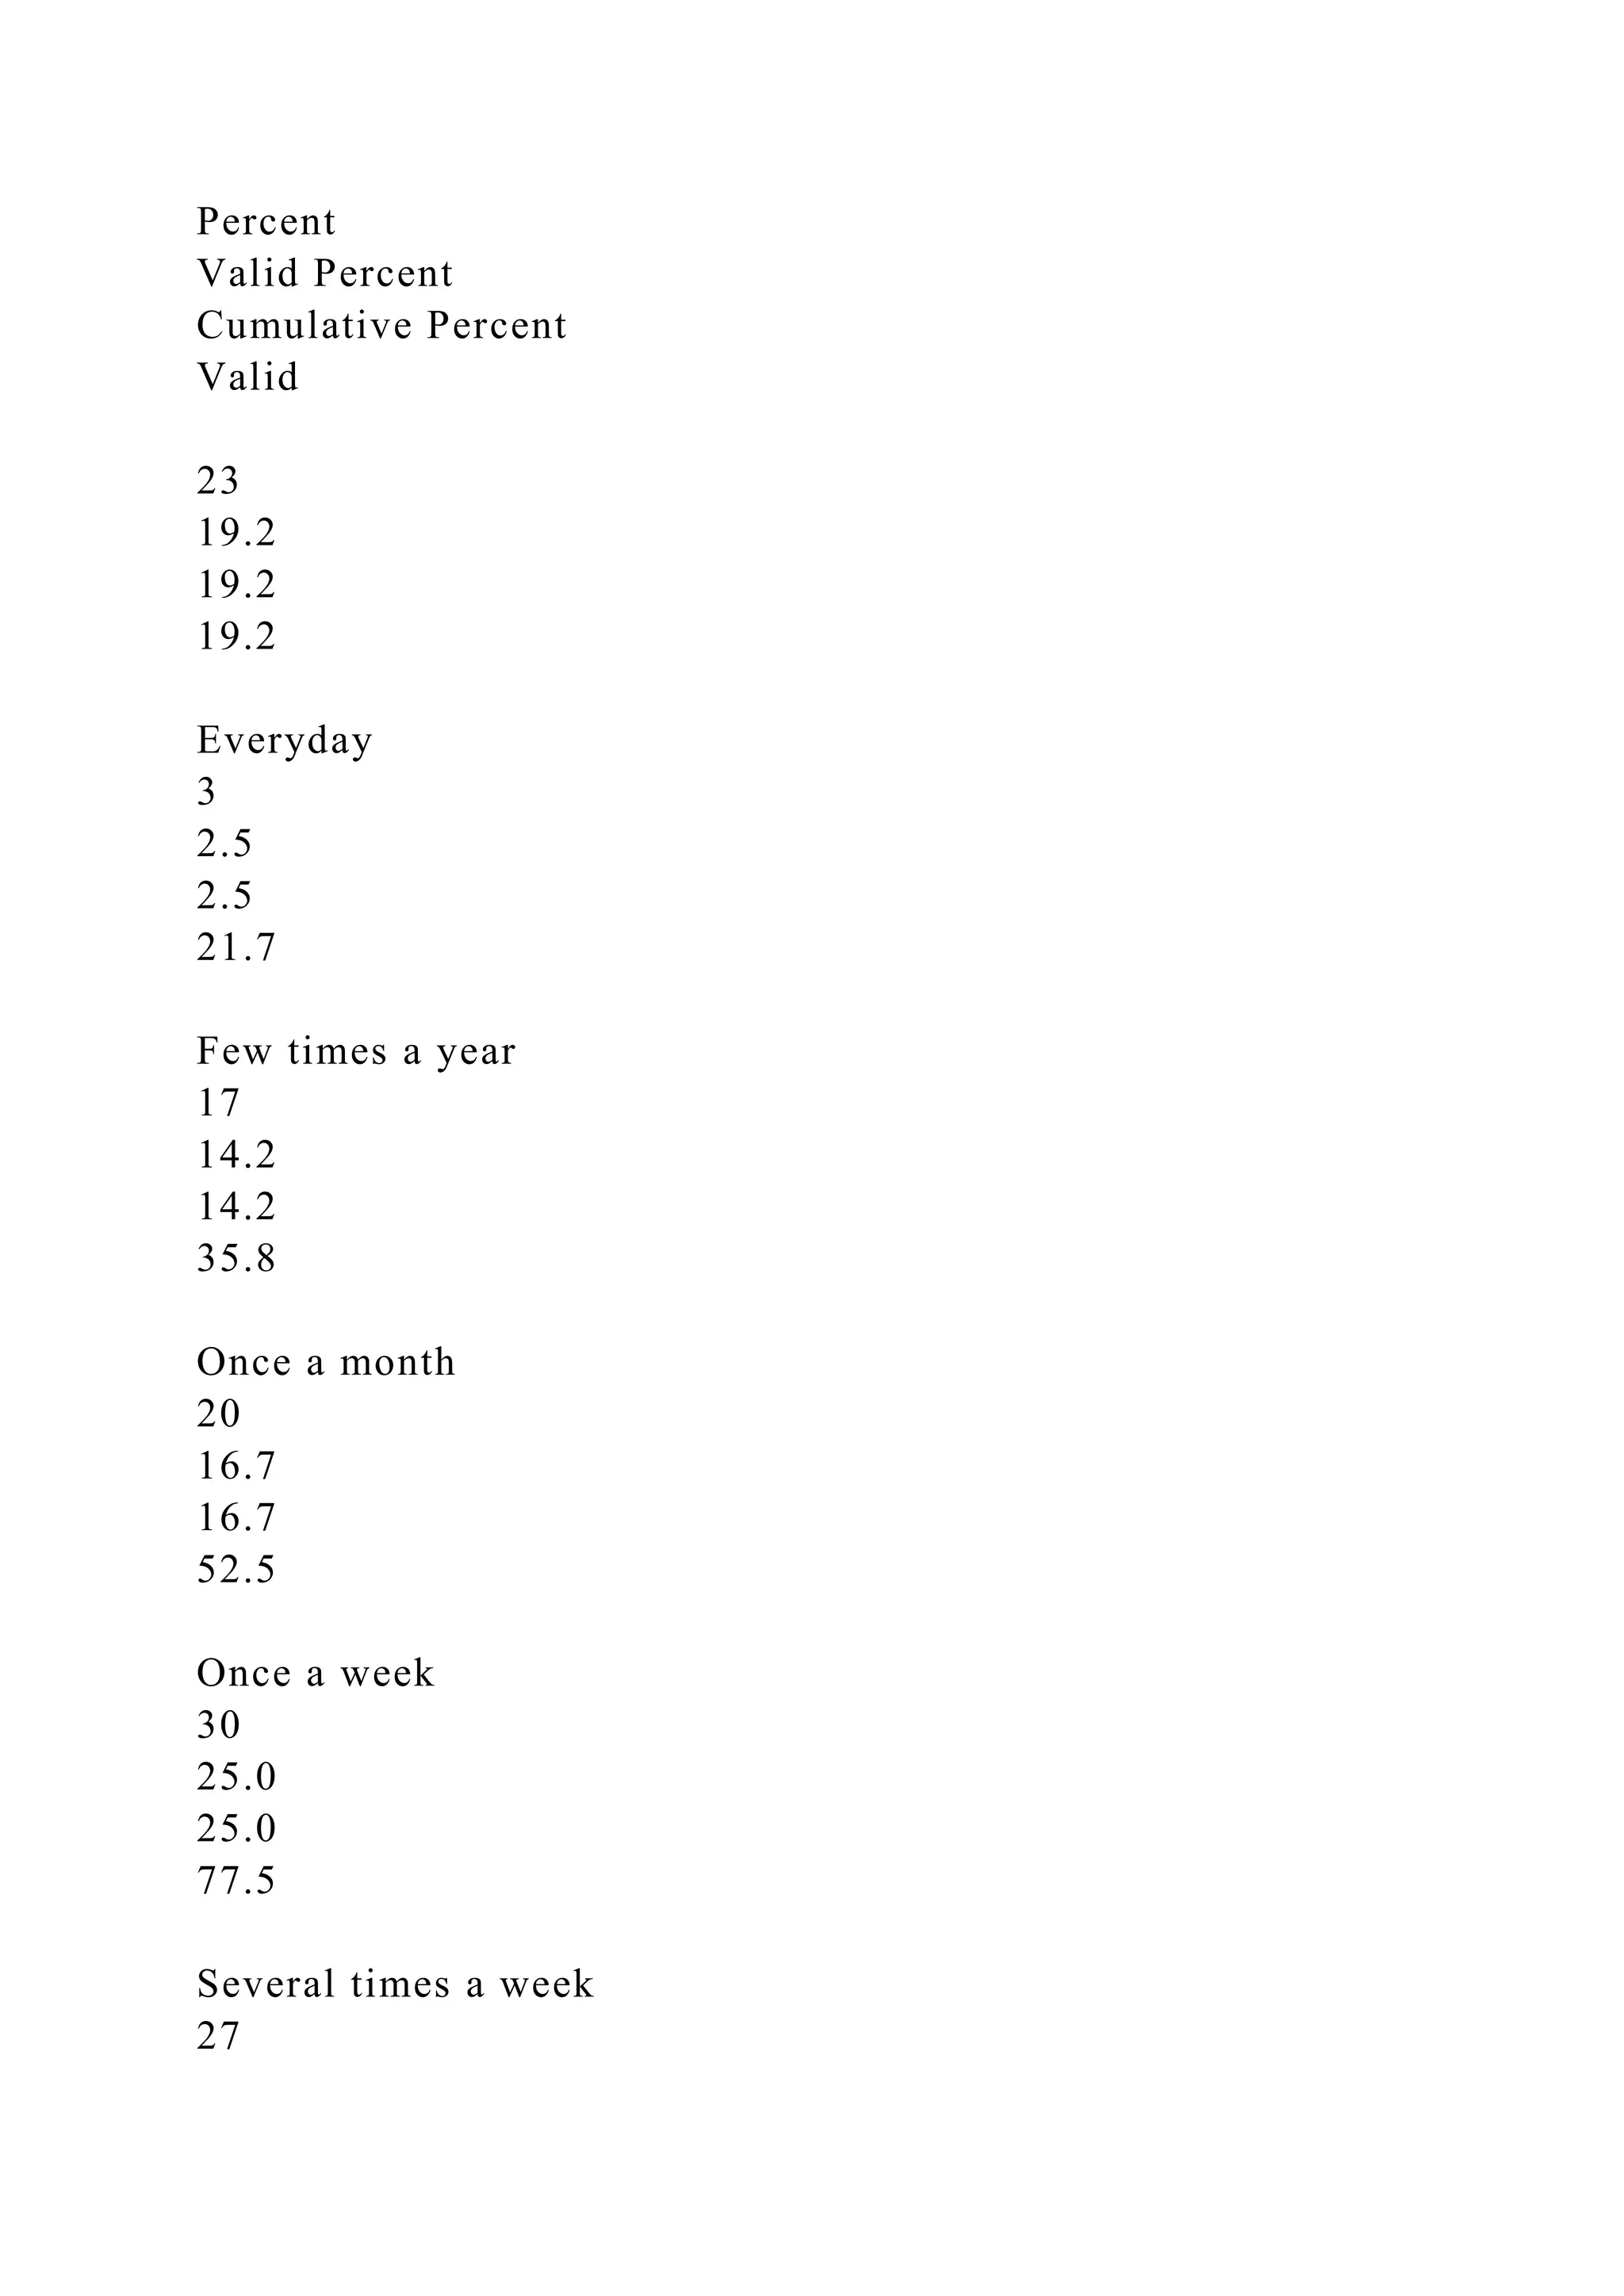
The frequency of organic consumers’ purchases
The frequenc y of organic consumers’ purchases Few times a
year Once a month Once a week Several times a week
Everyday 14.2 16.7 25.0 22.5 2.5
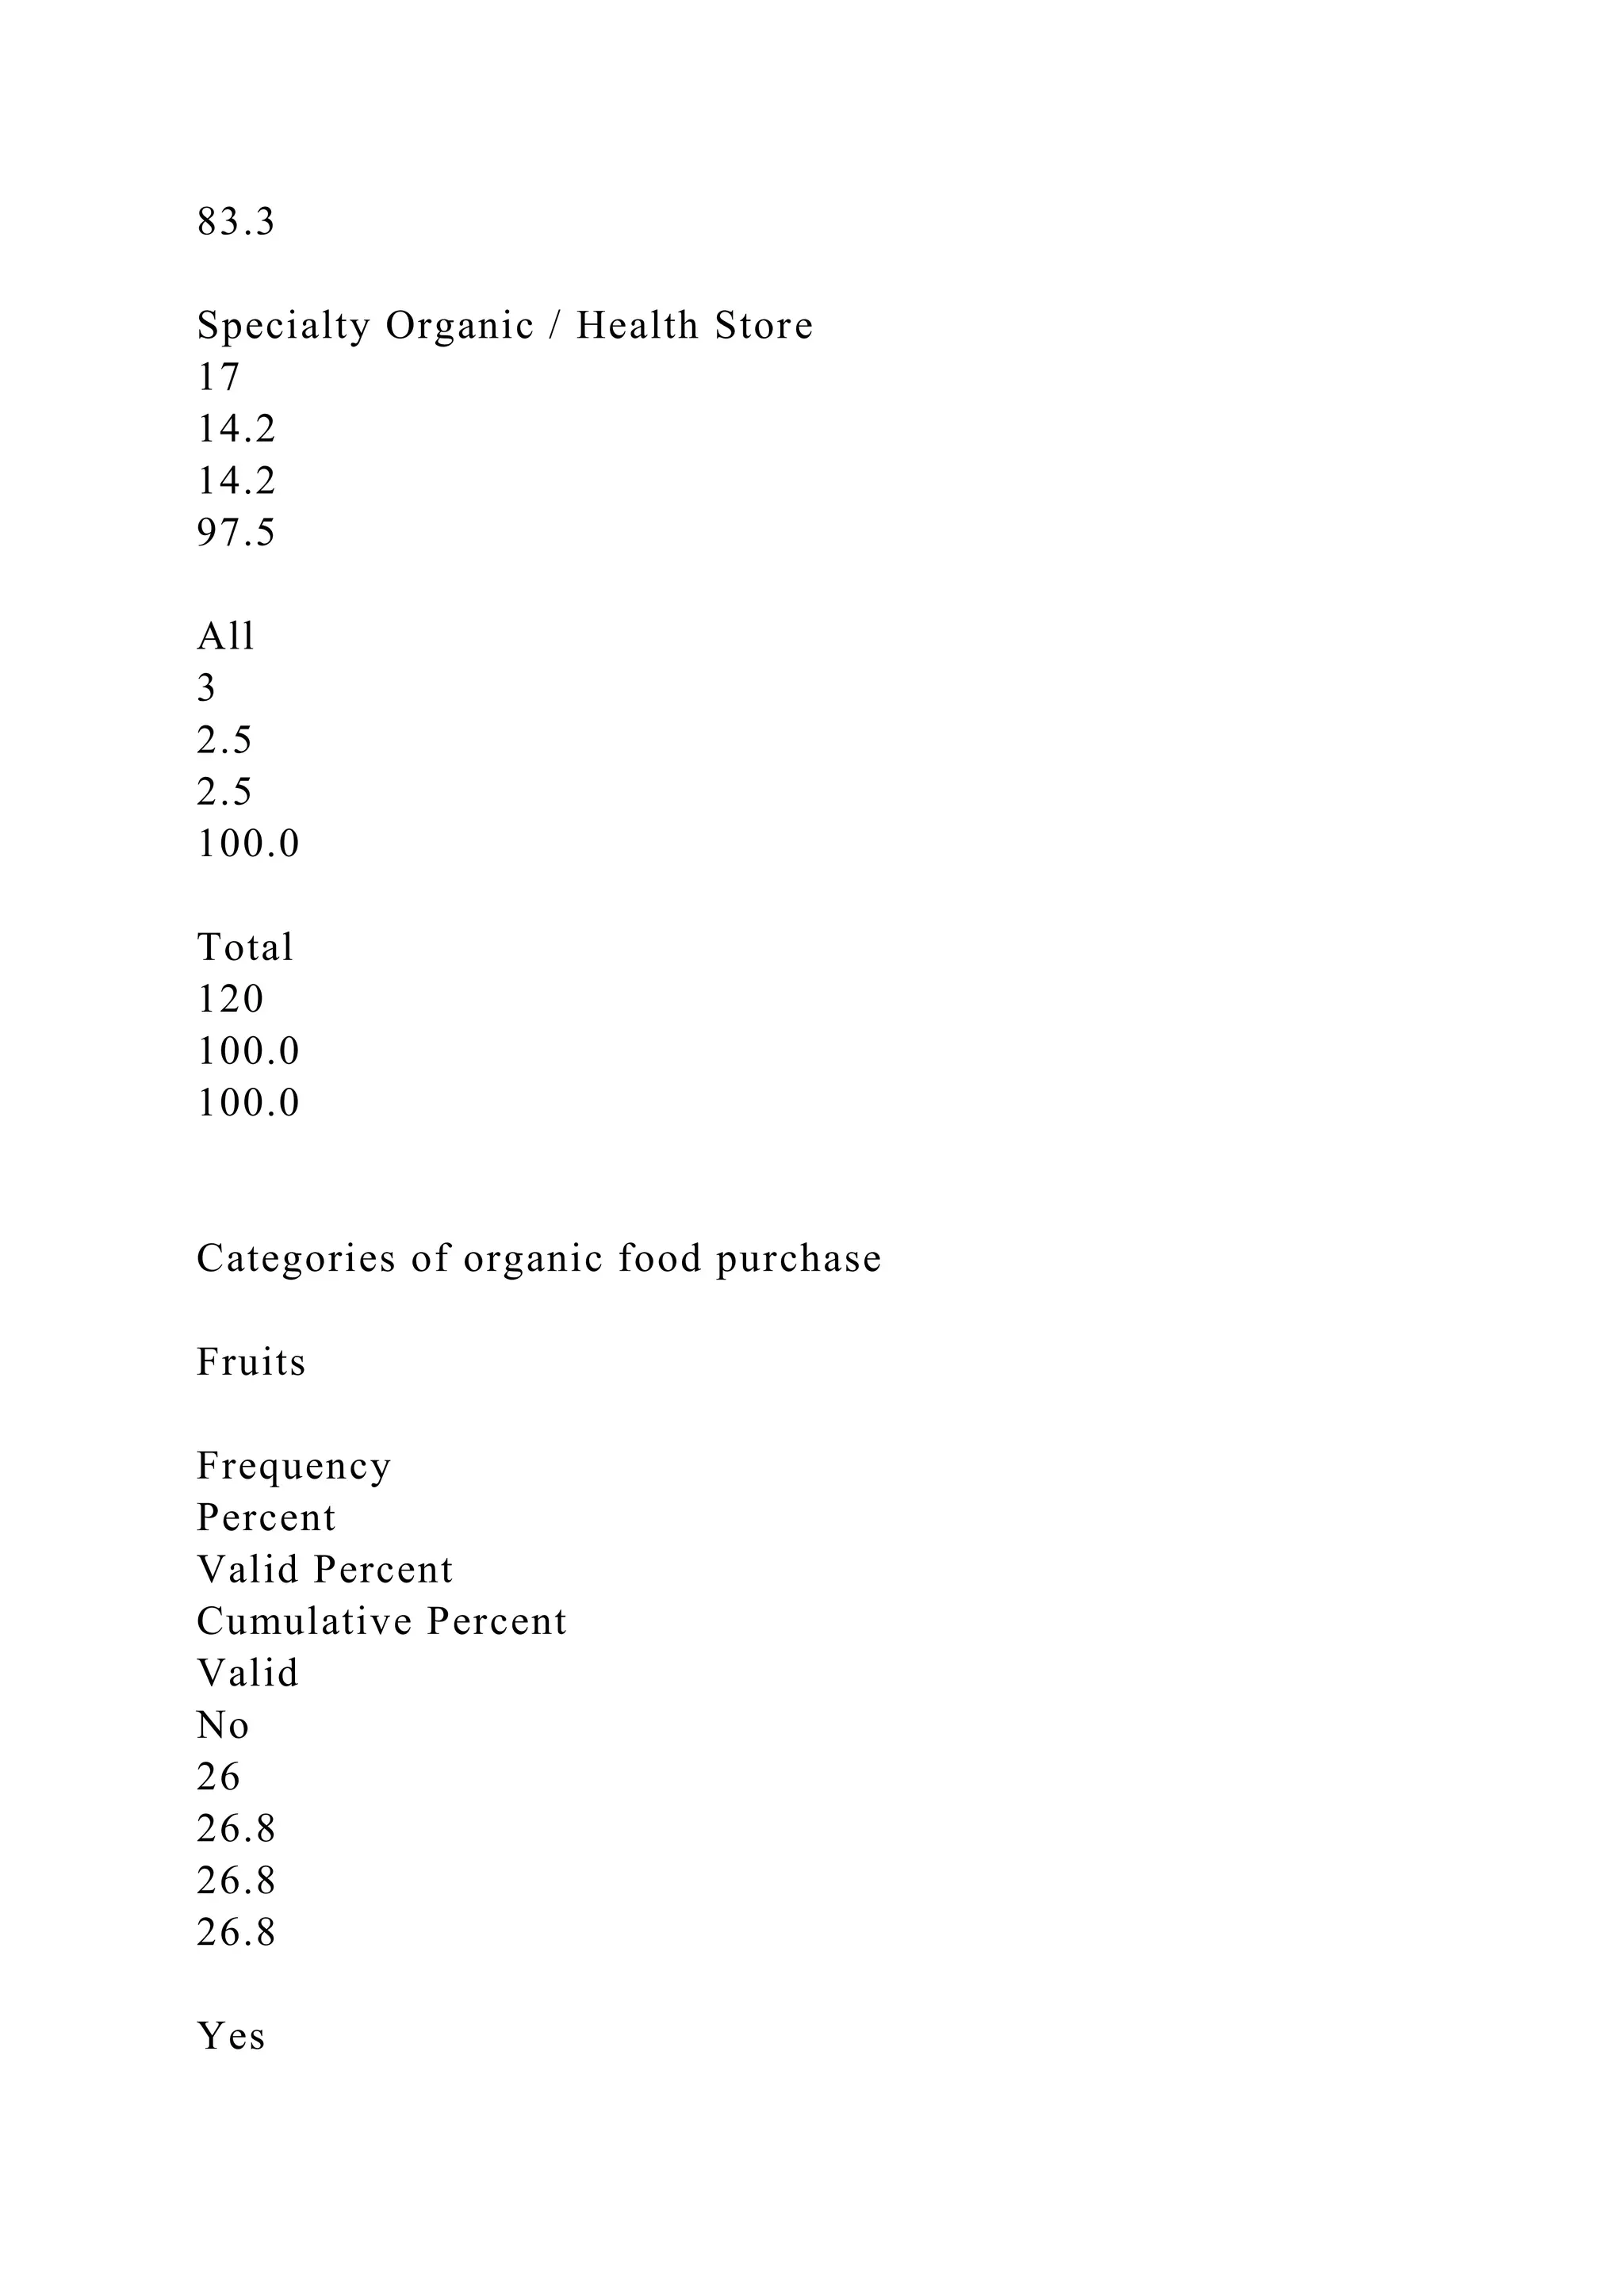
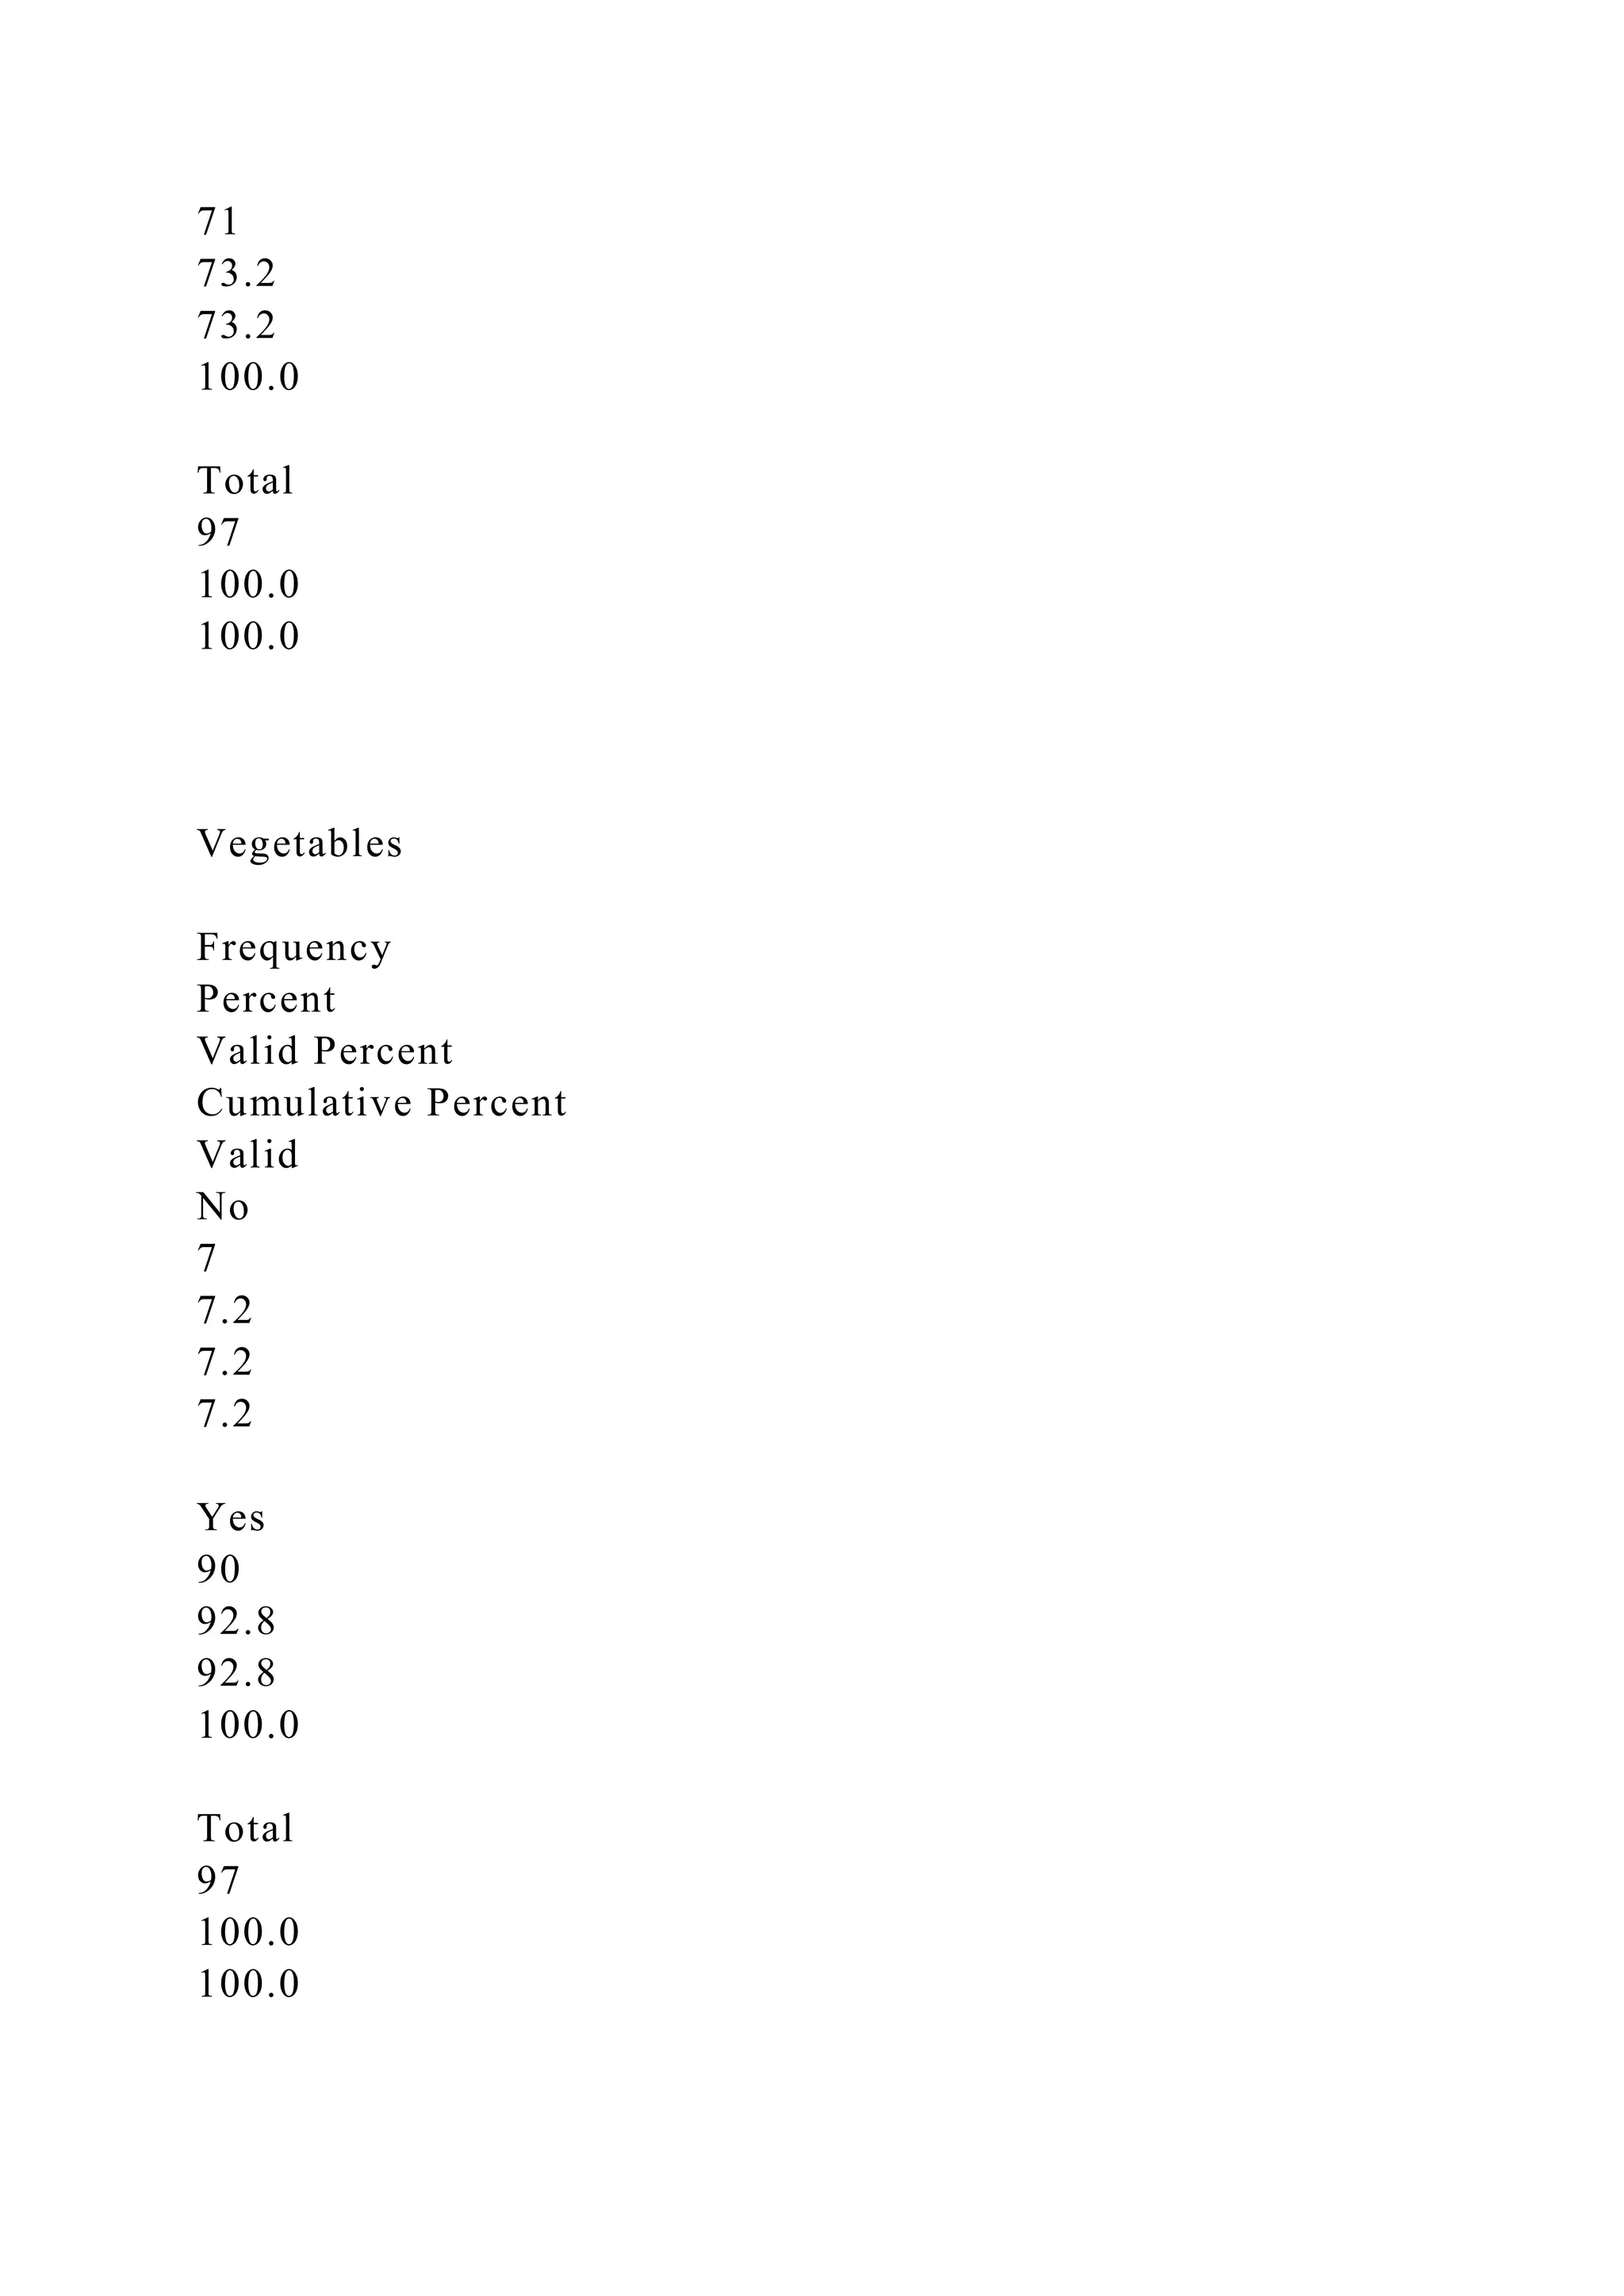
Categories
Categories
[CATEGORY NAME]
73.2%
[CATEGORY NAME]
92.8%
[CATEGORY NAME]
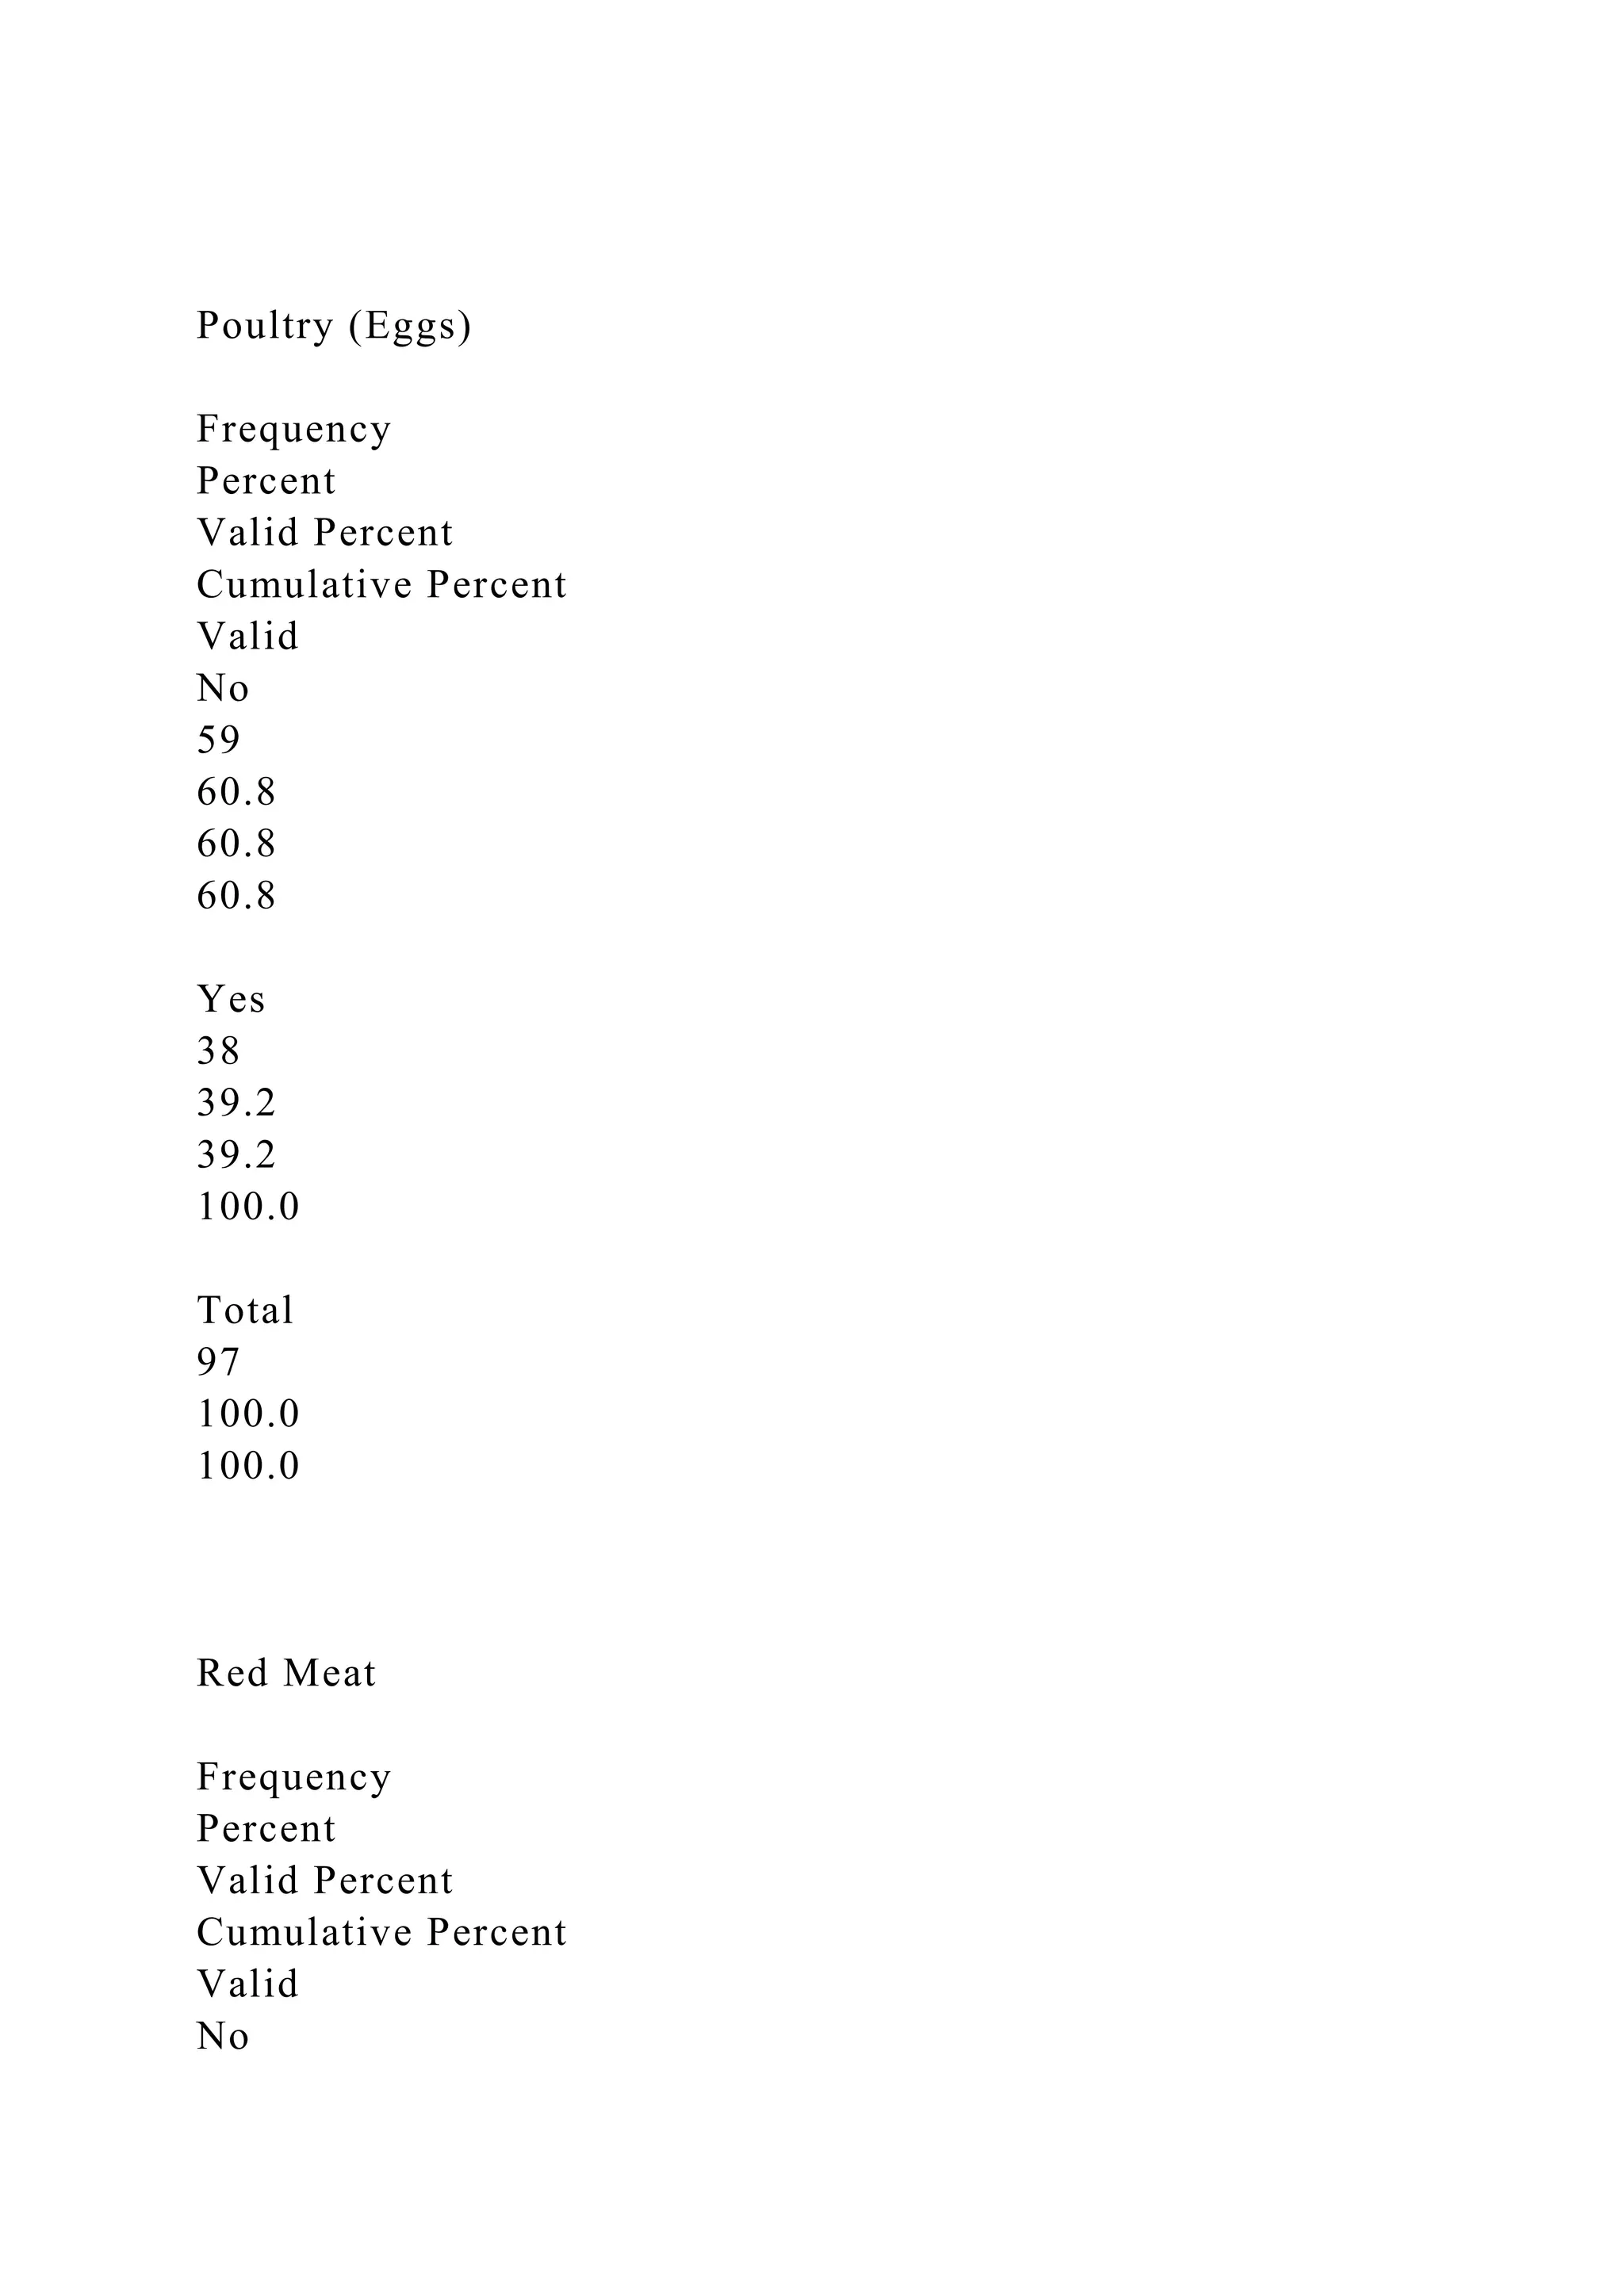
39.2%
Red meat
27.8%](https://image.slidesharecdn.com/submittedinpartfulfilmentoftherequirementsforthedegreeof-230119024927-31555ff9/75/Submitted-in-part-fulfilment-of-the-requirements-for-the-degree-of-docx-149-2048.jpg)
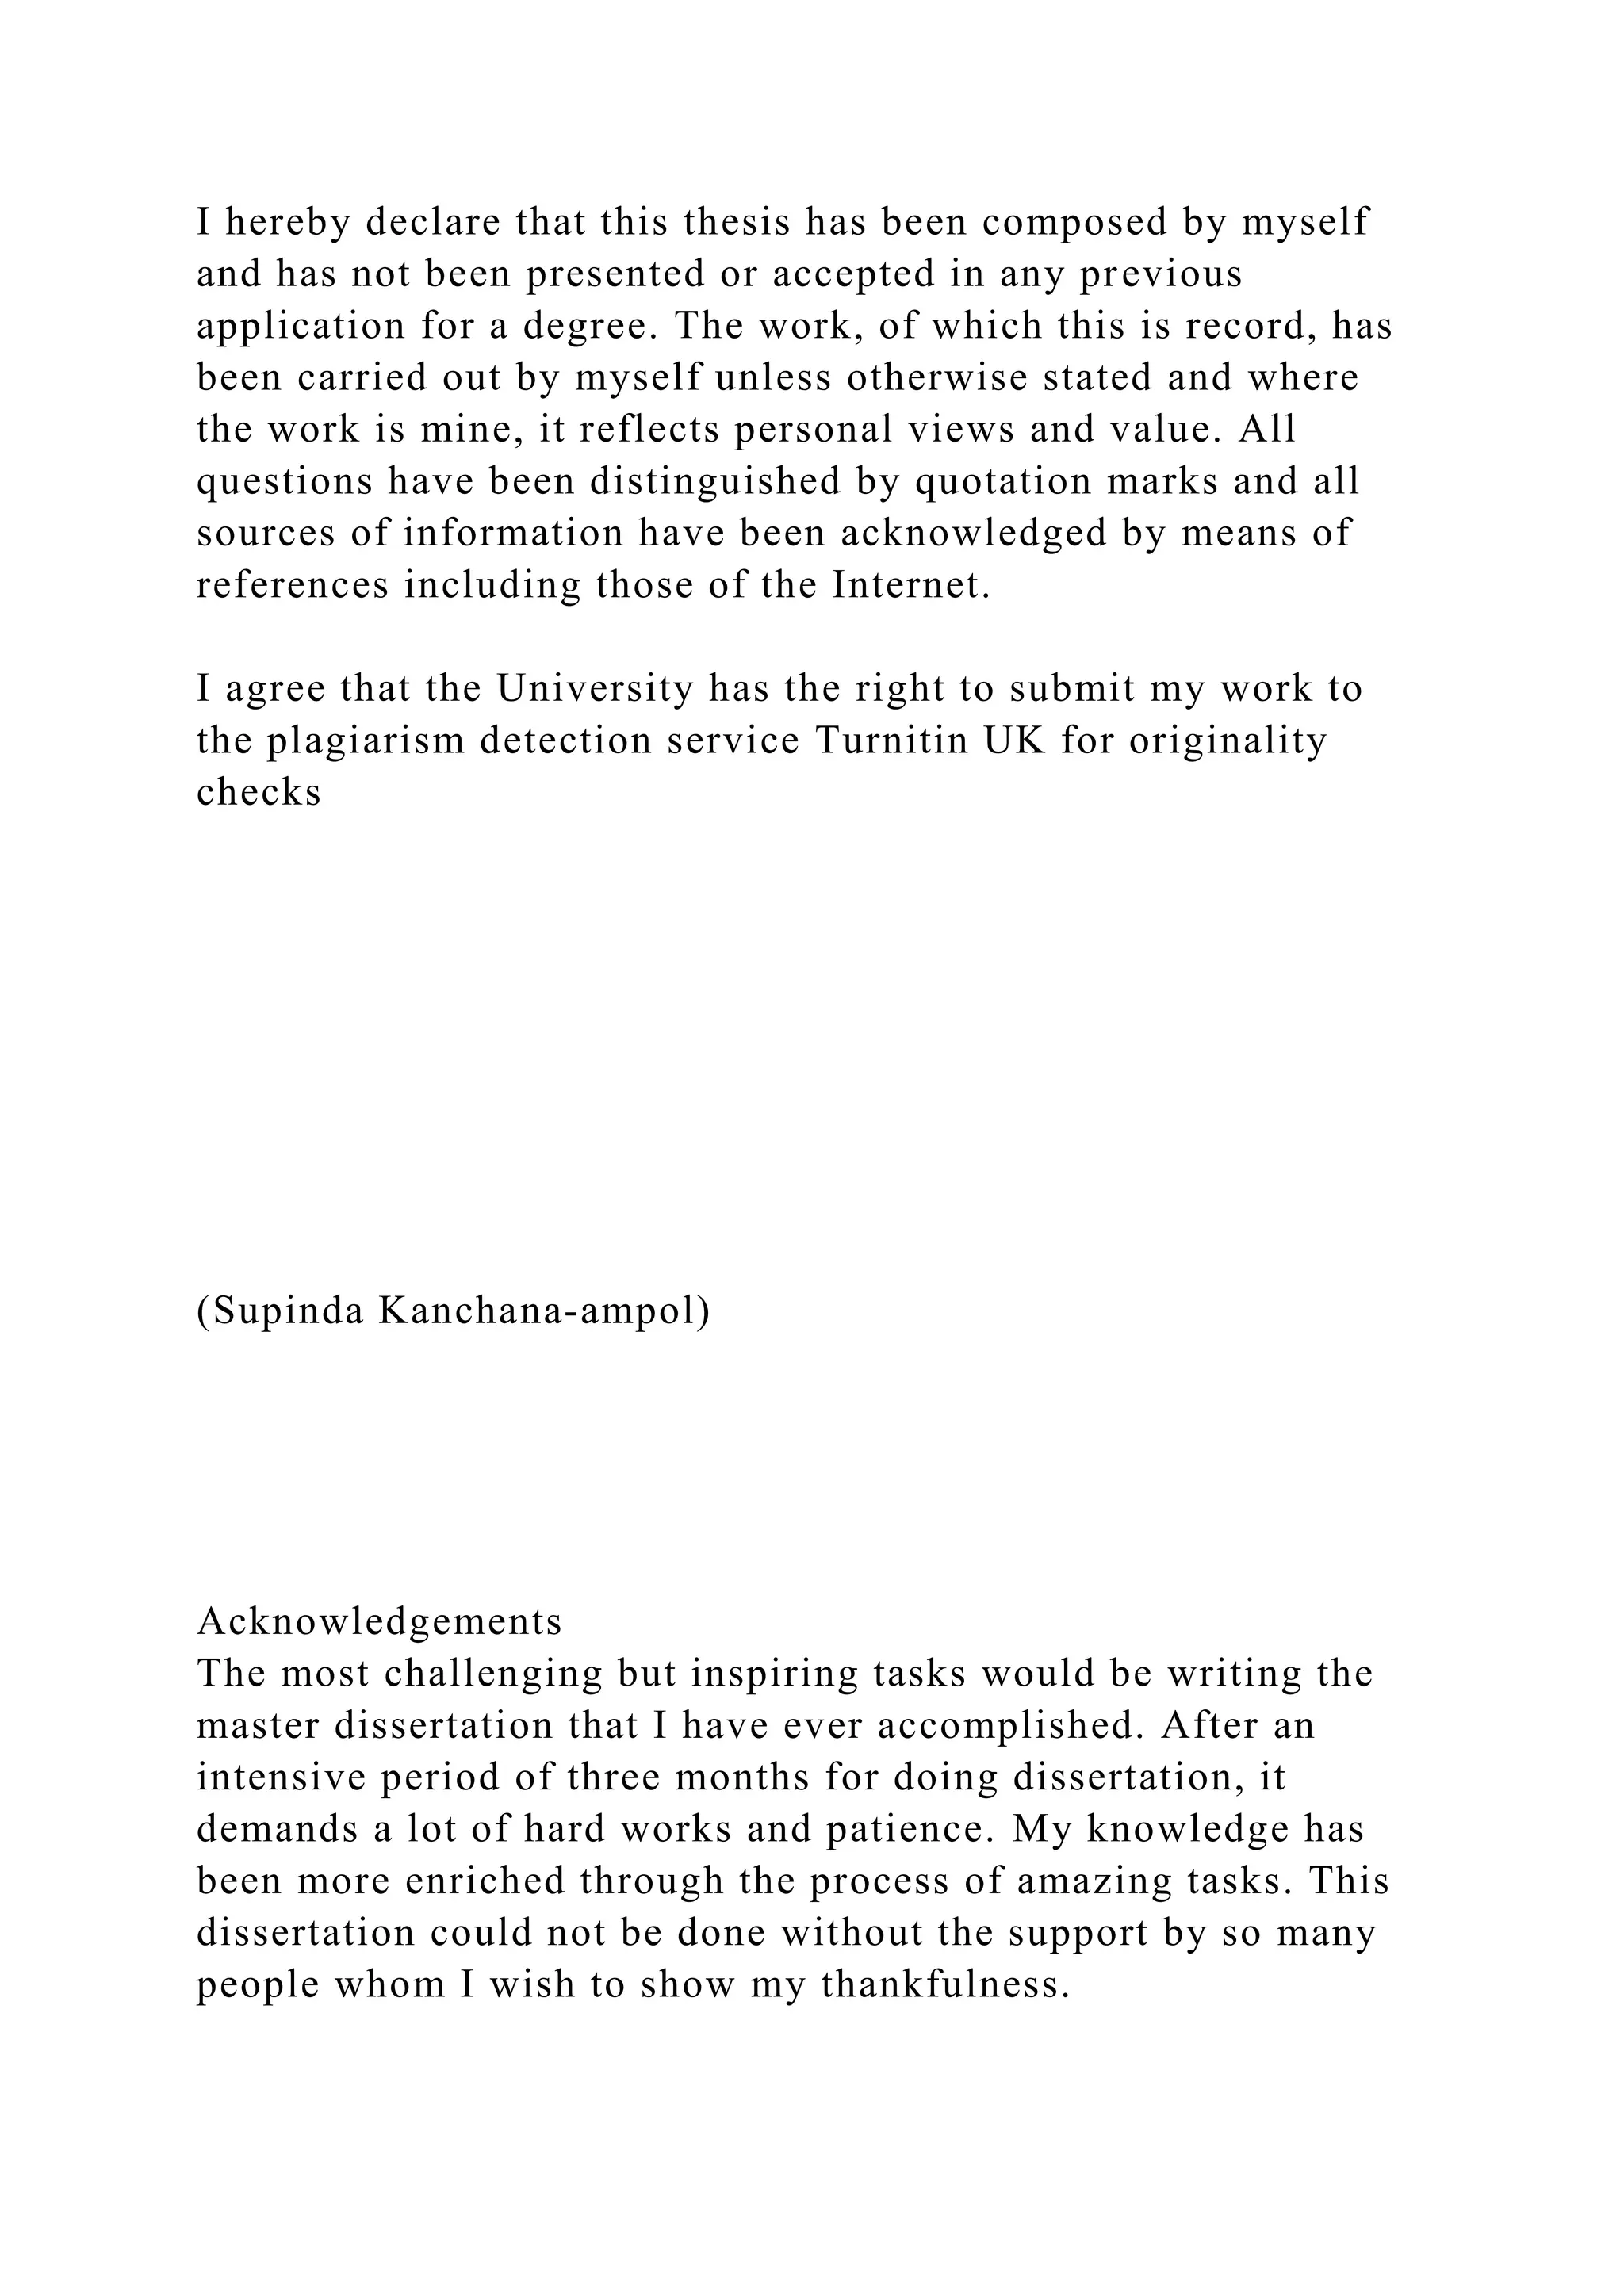
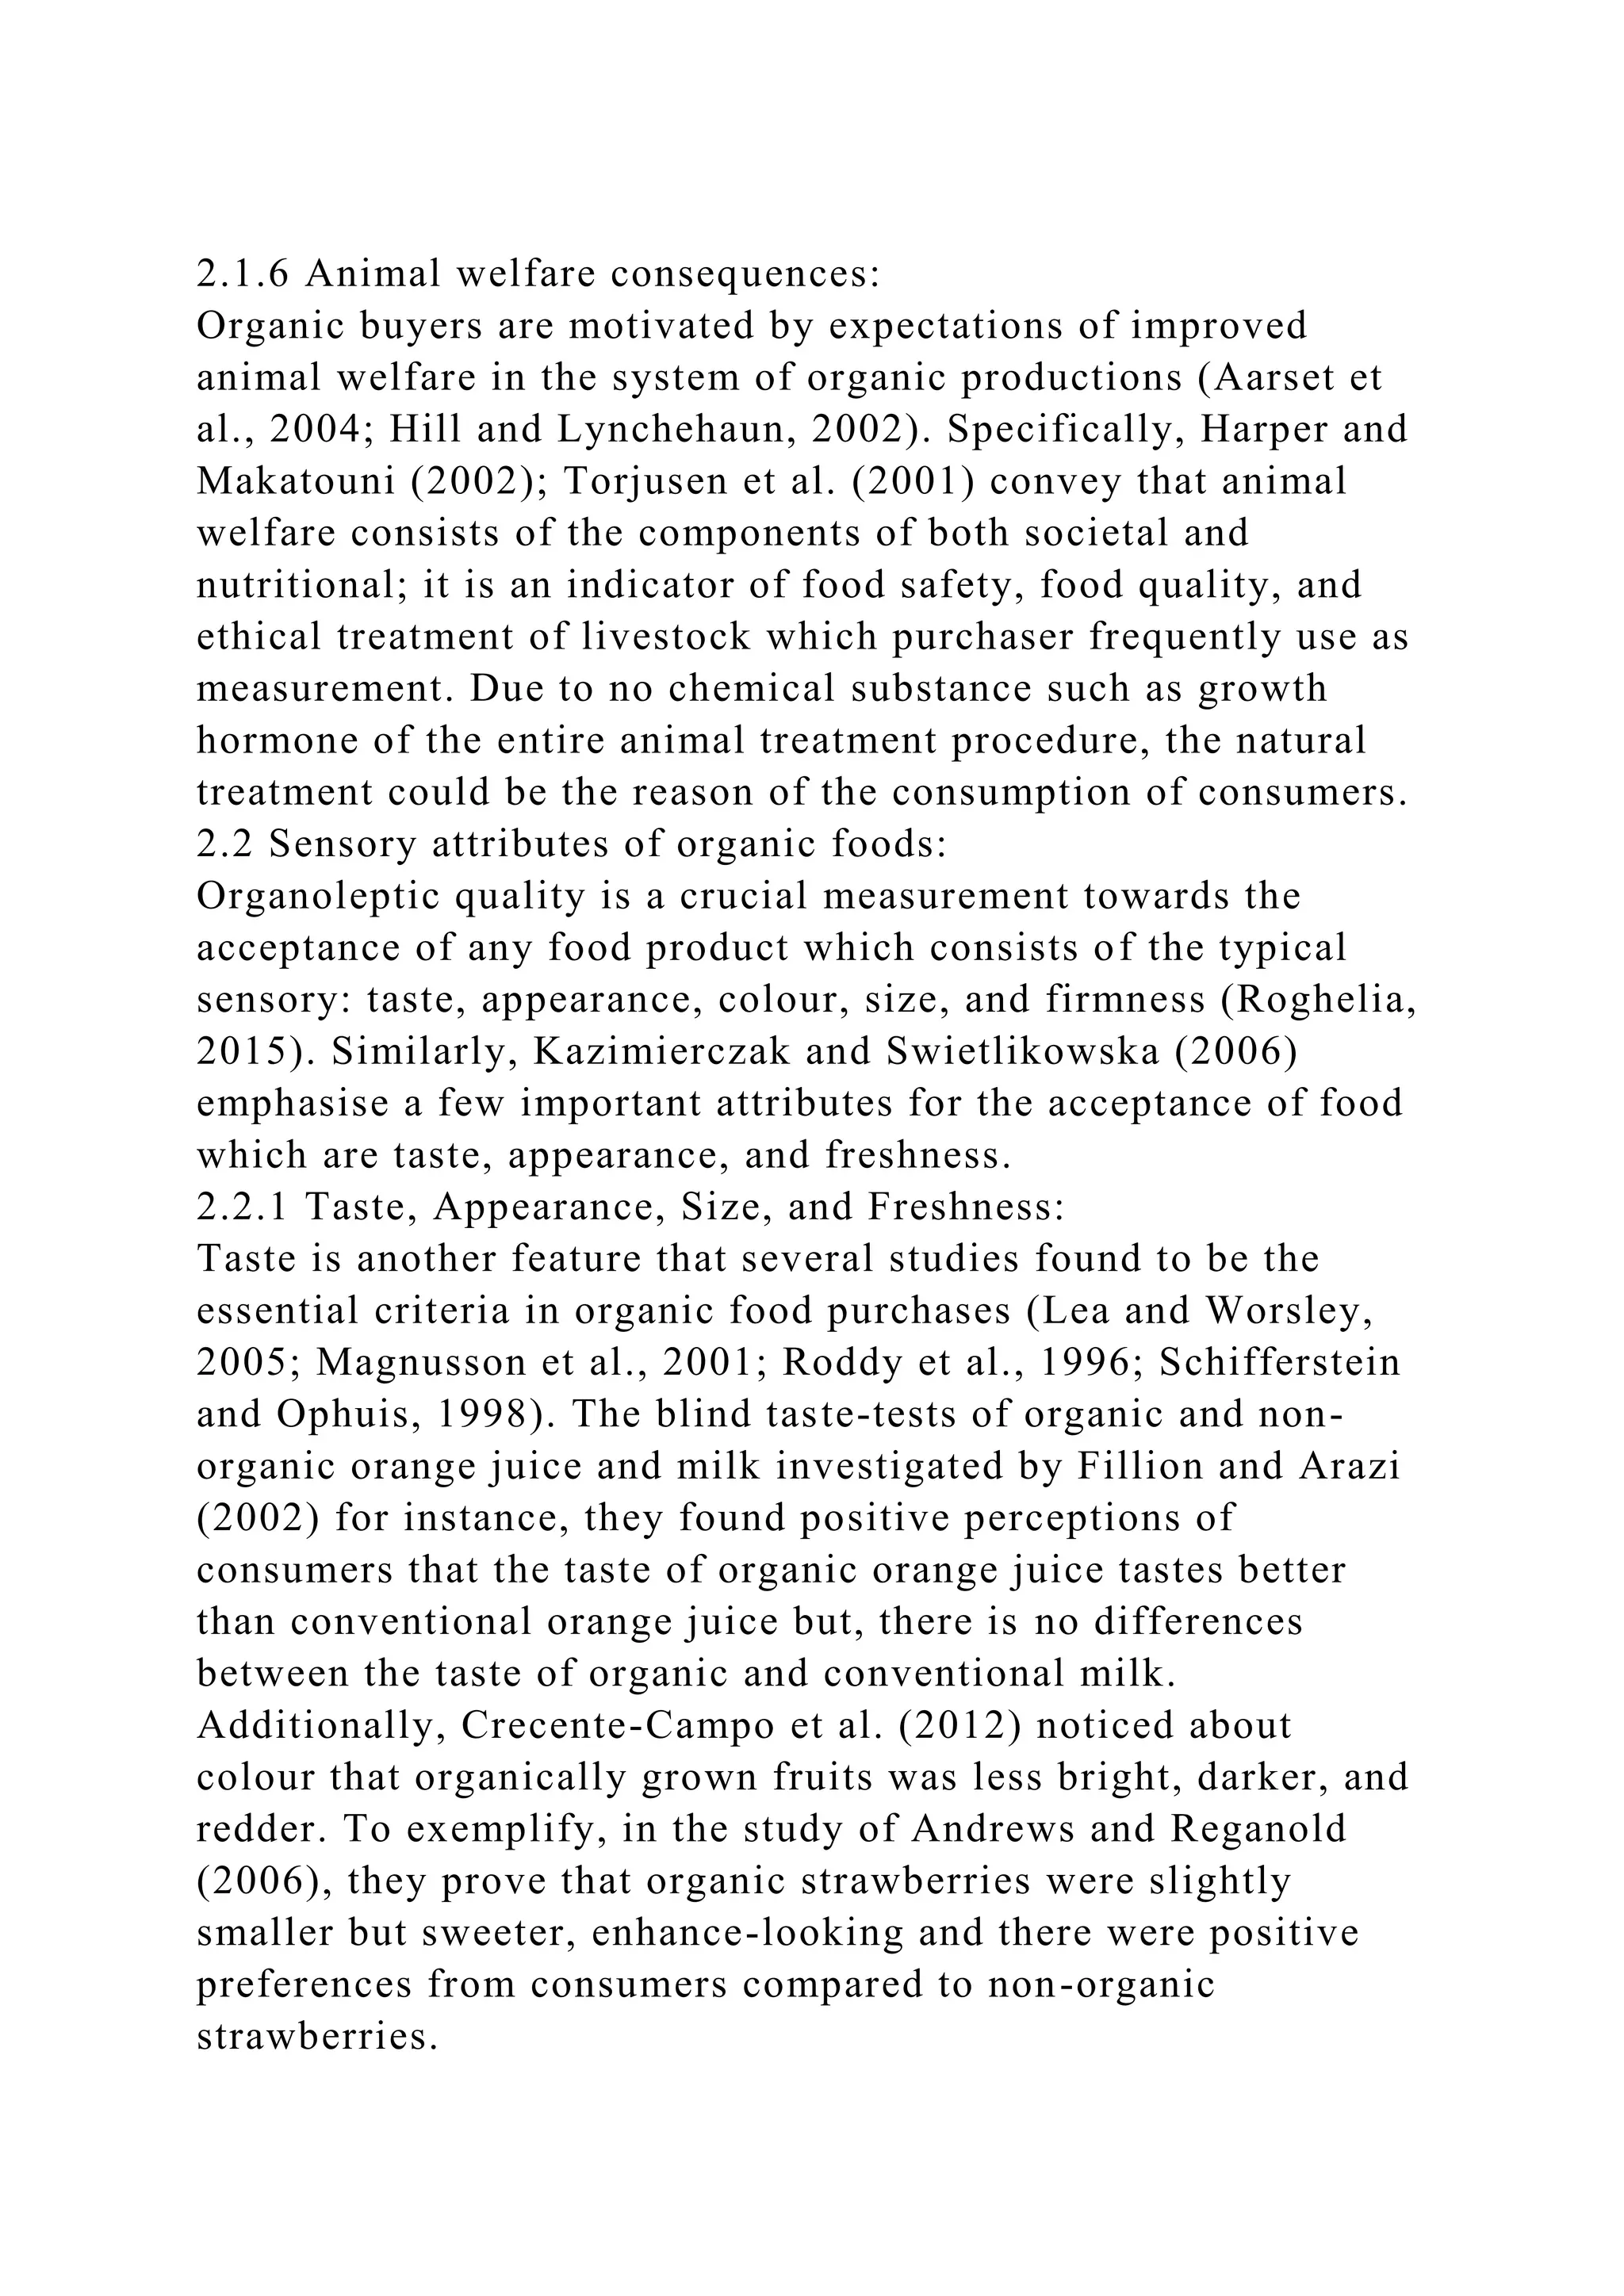
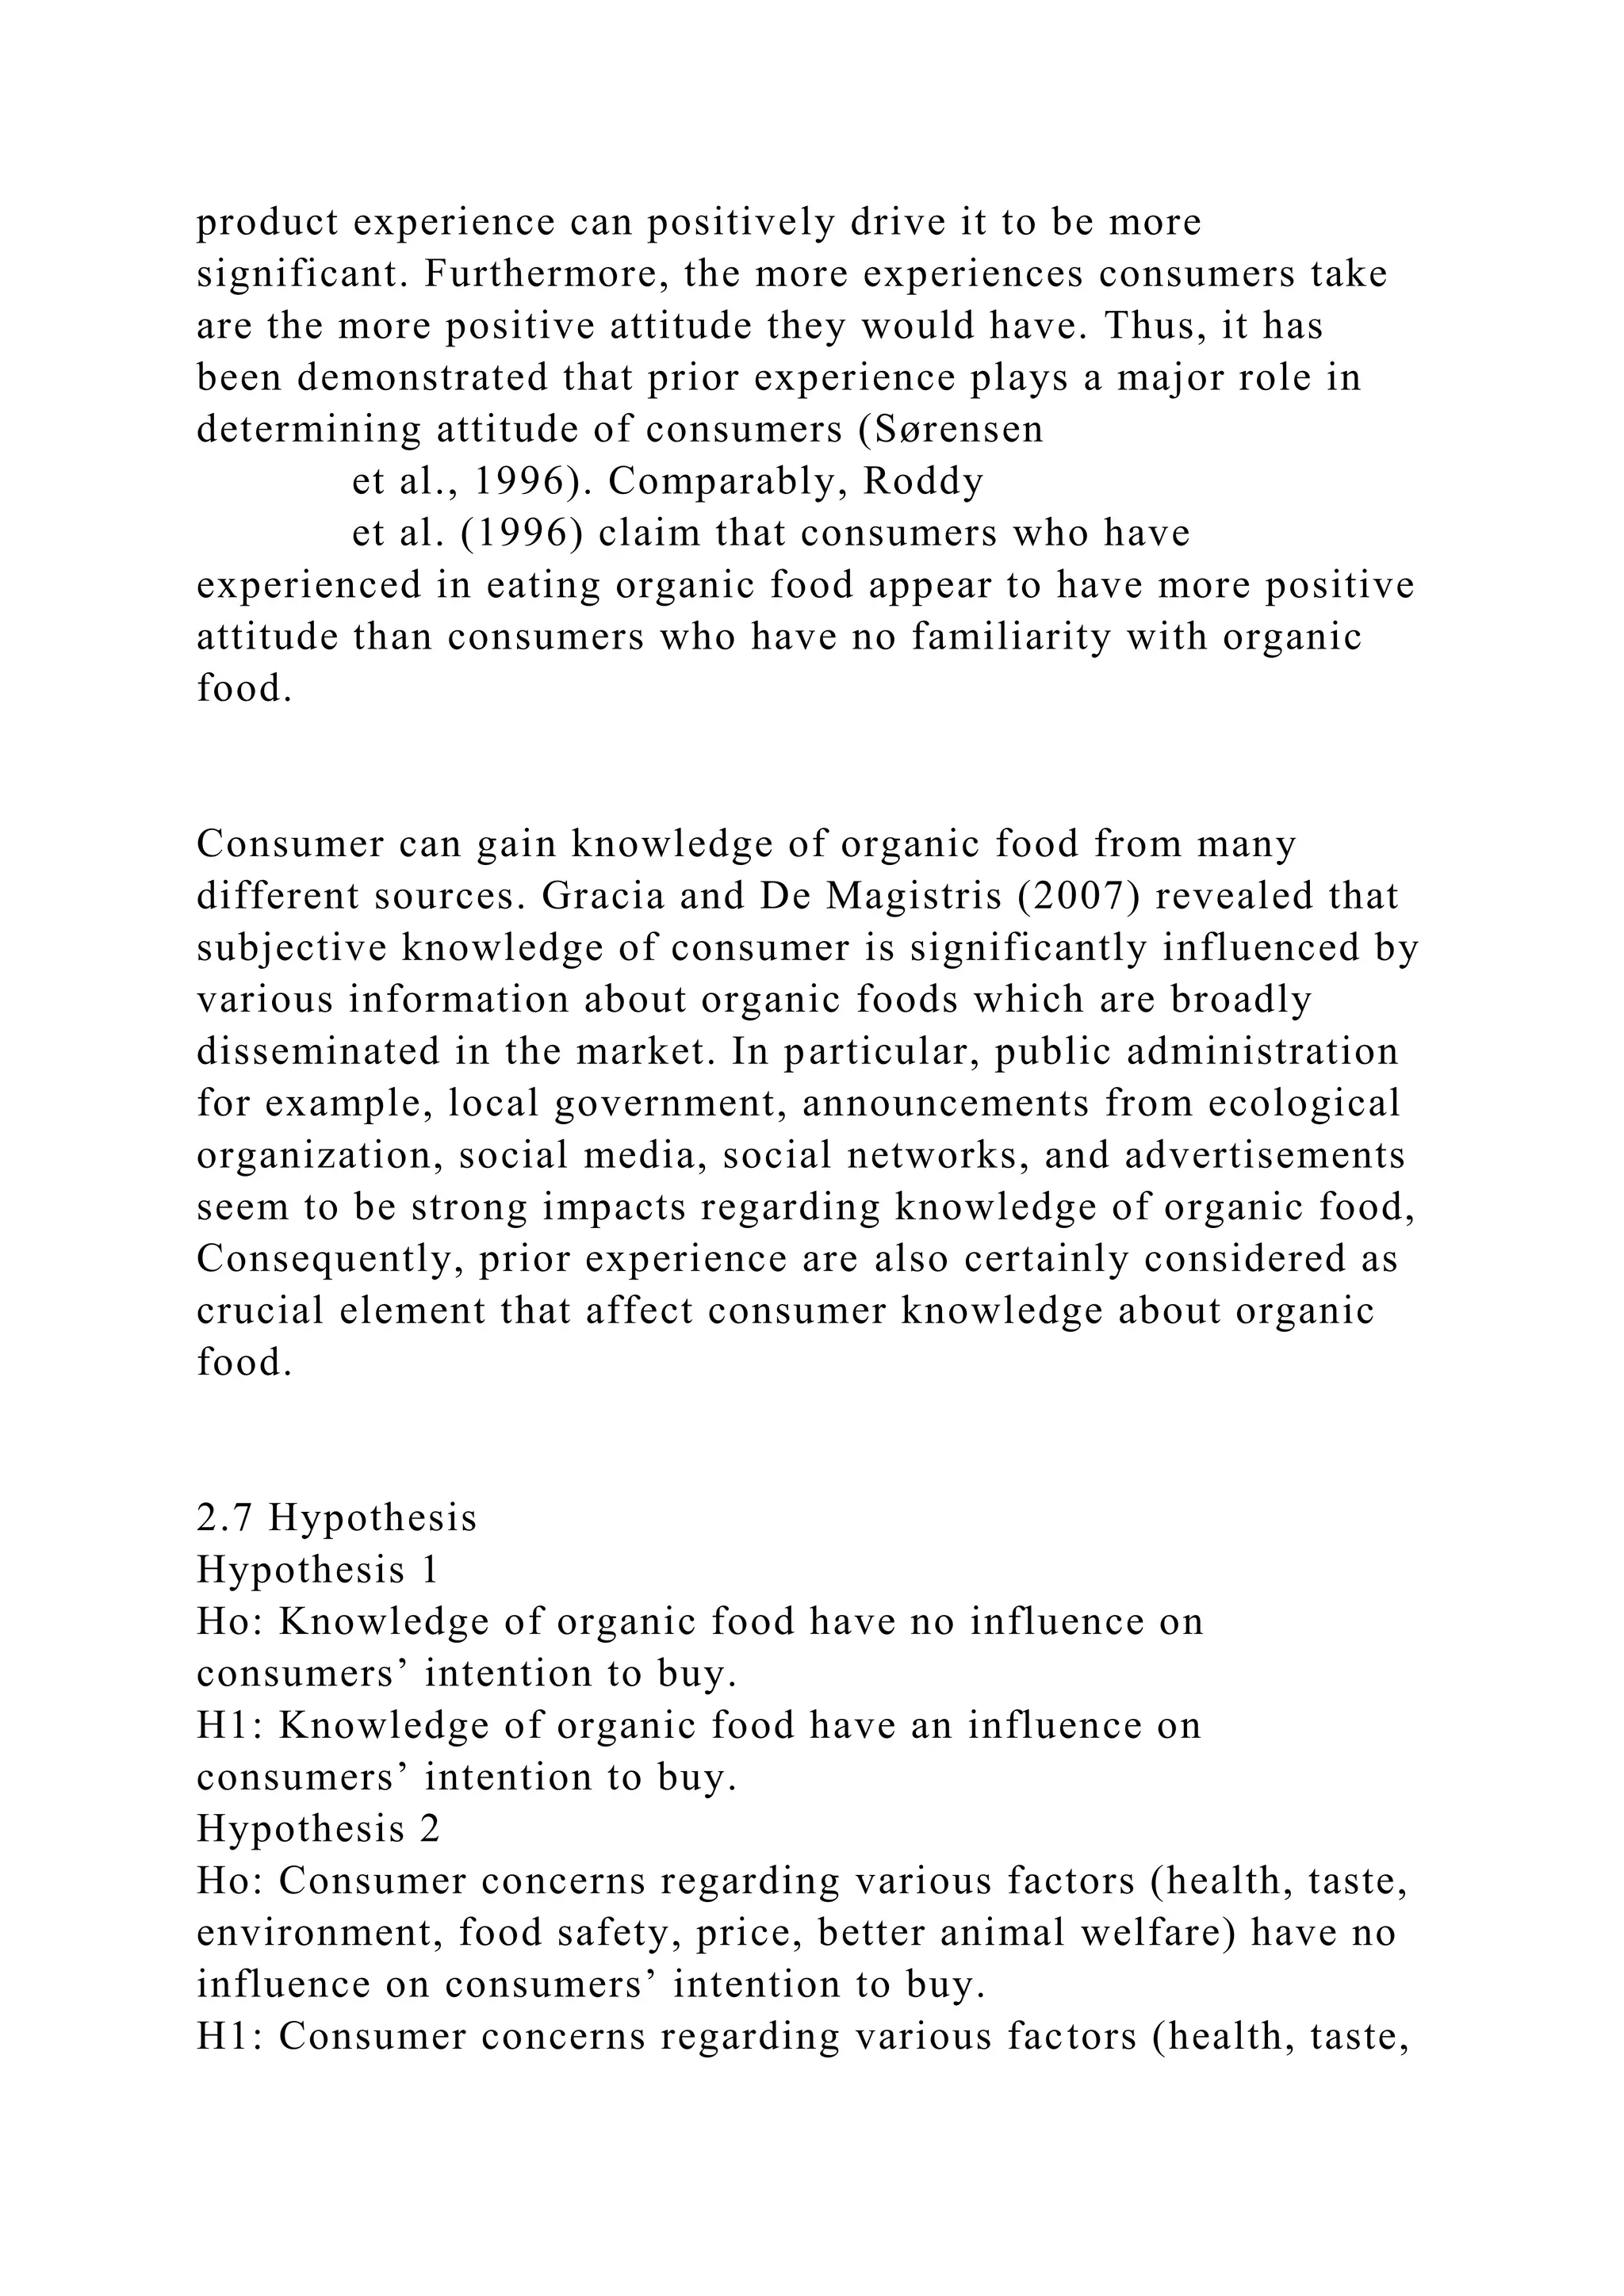
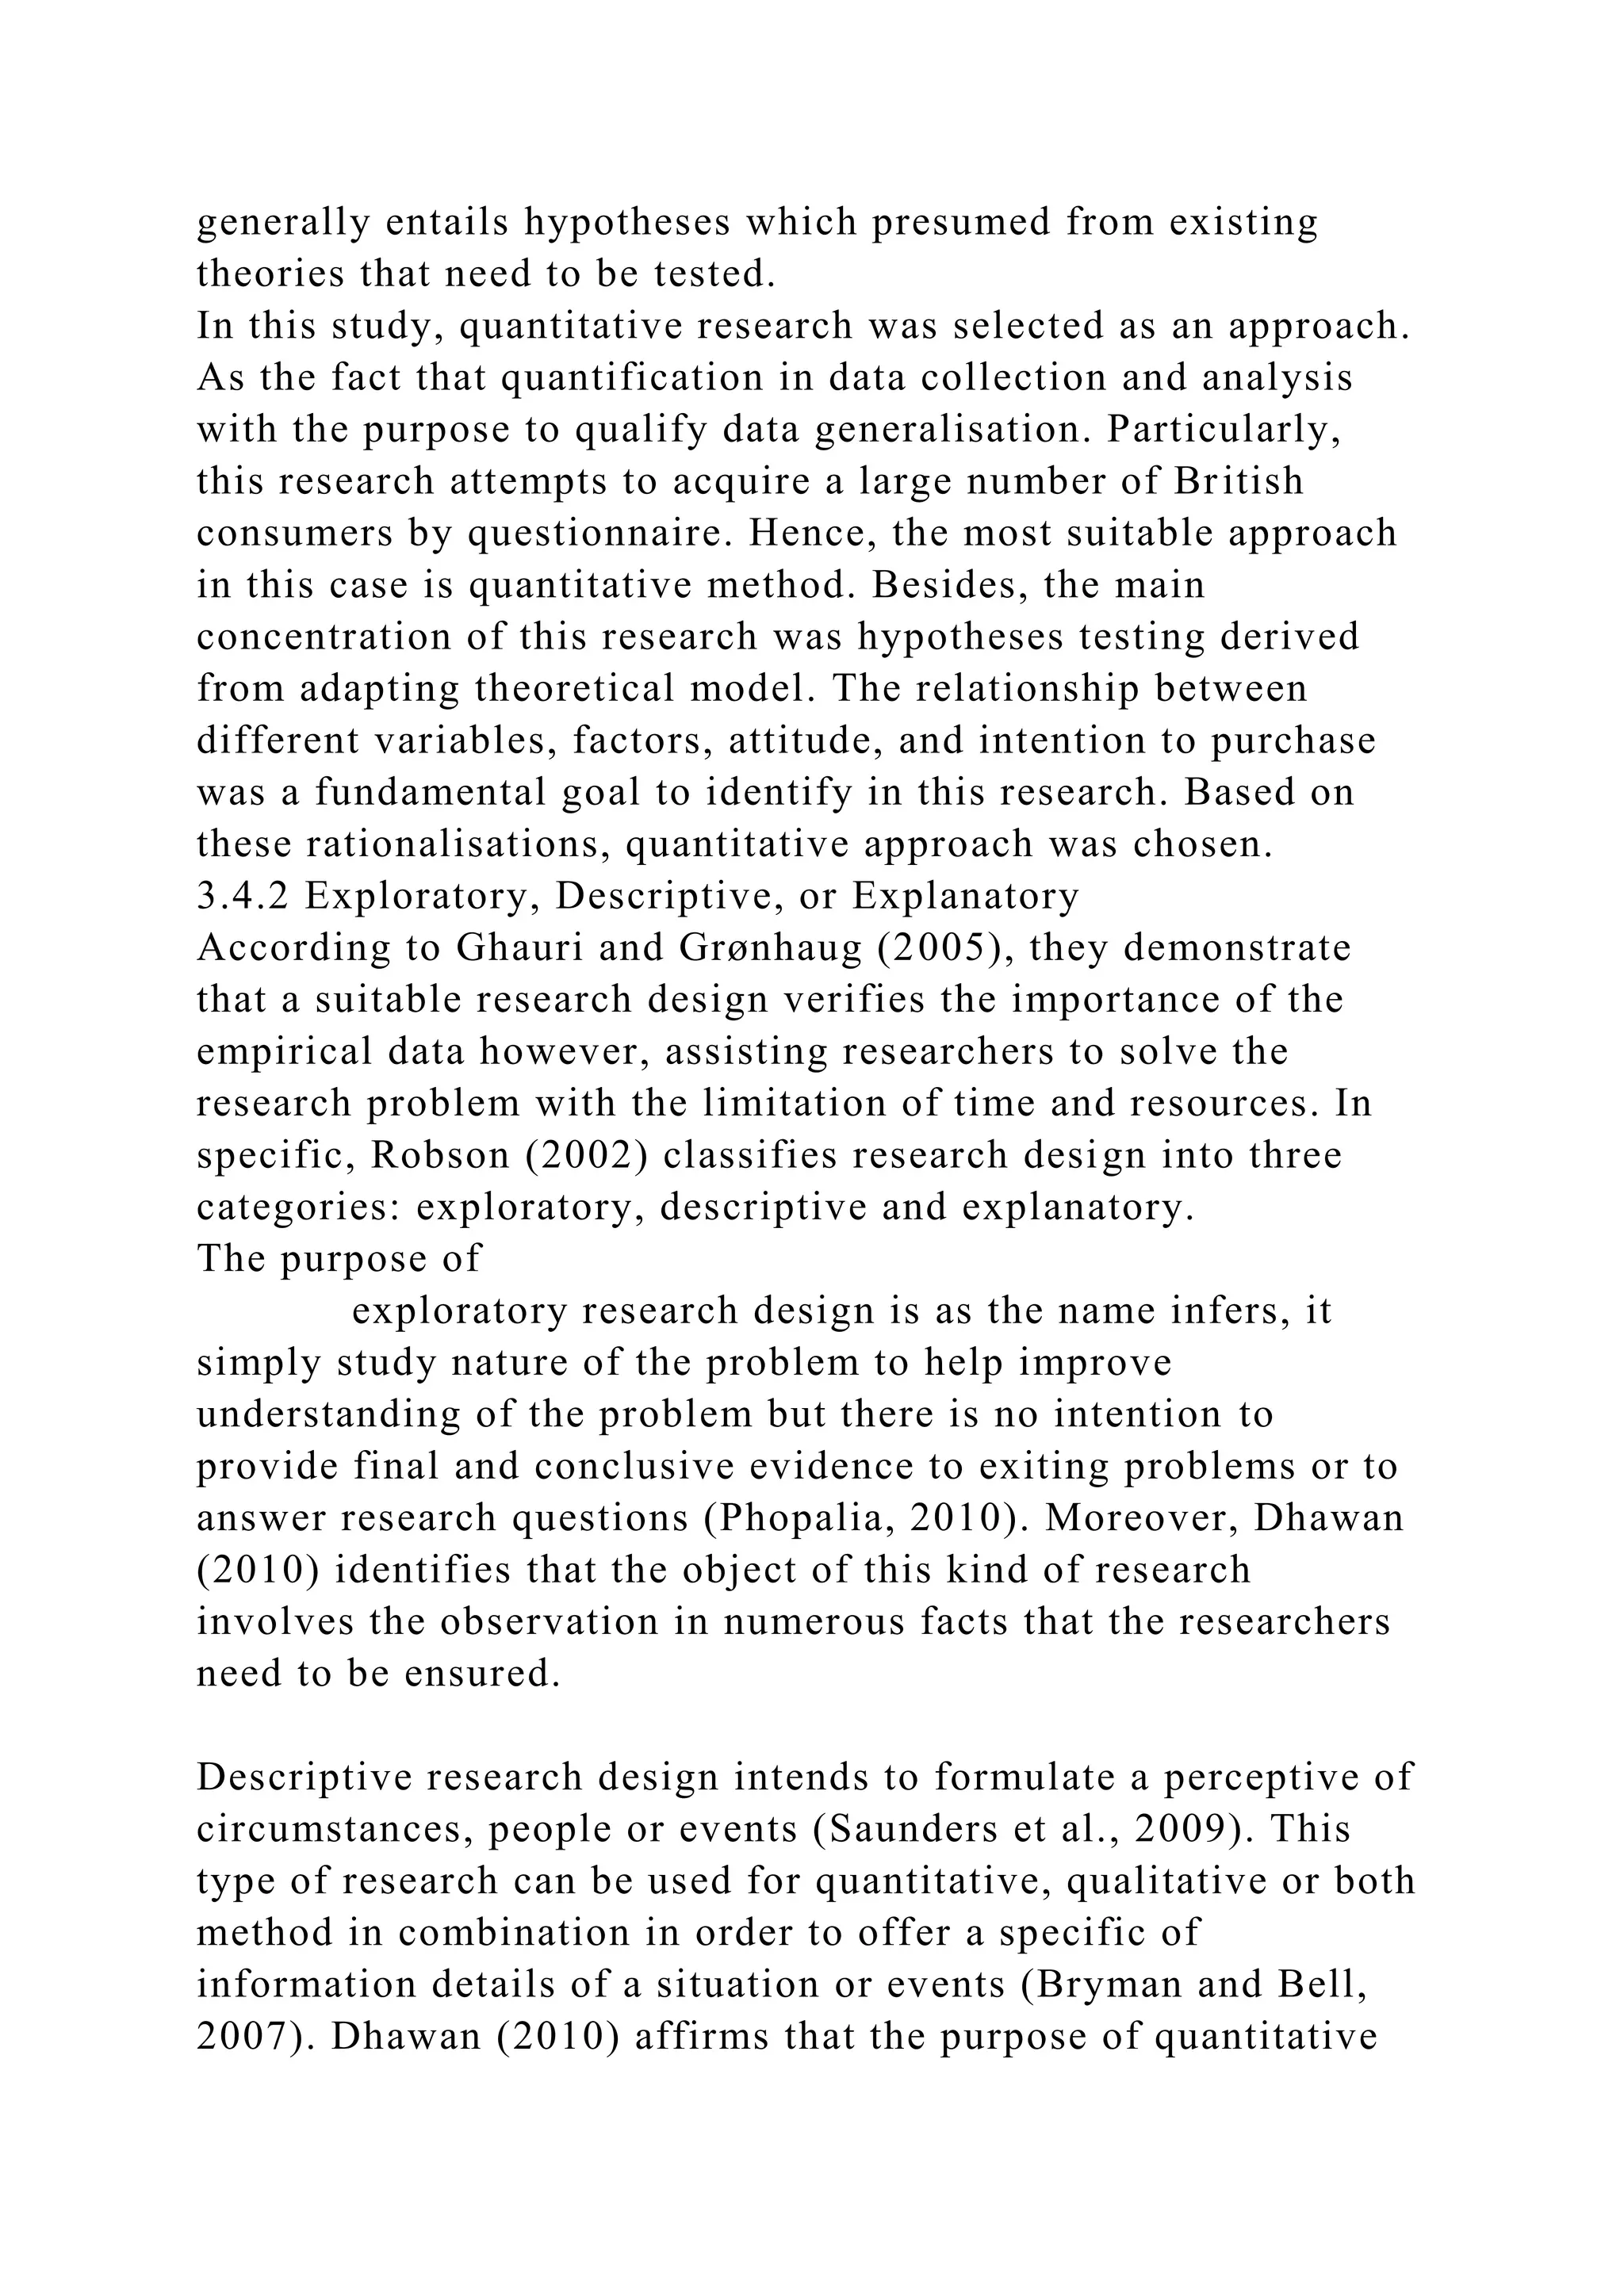
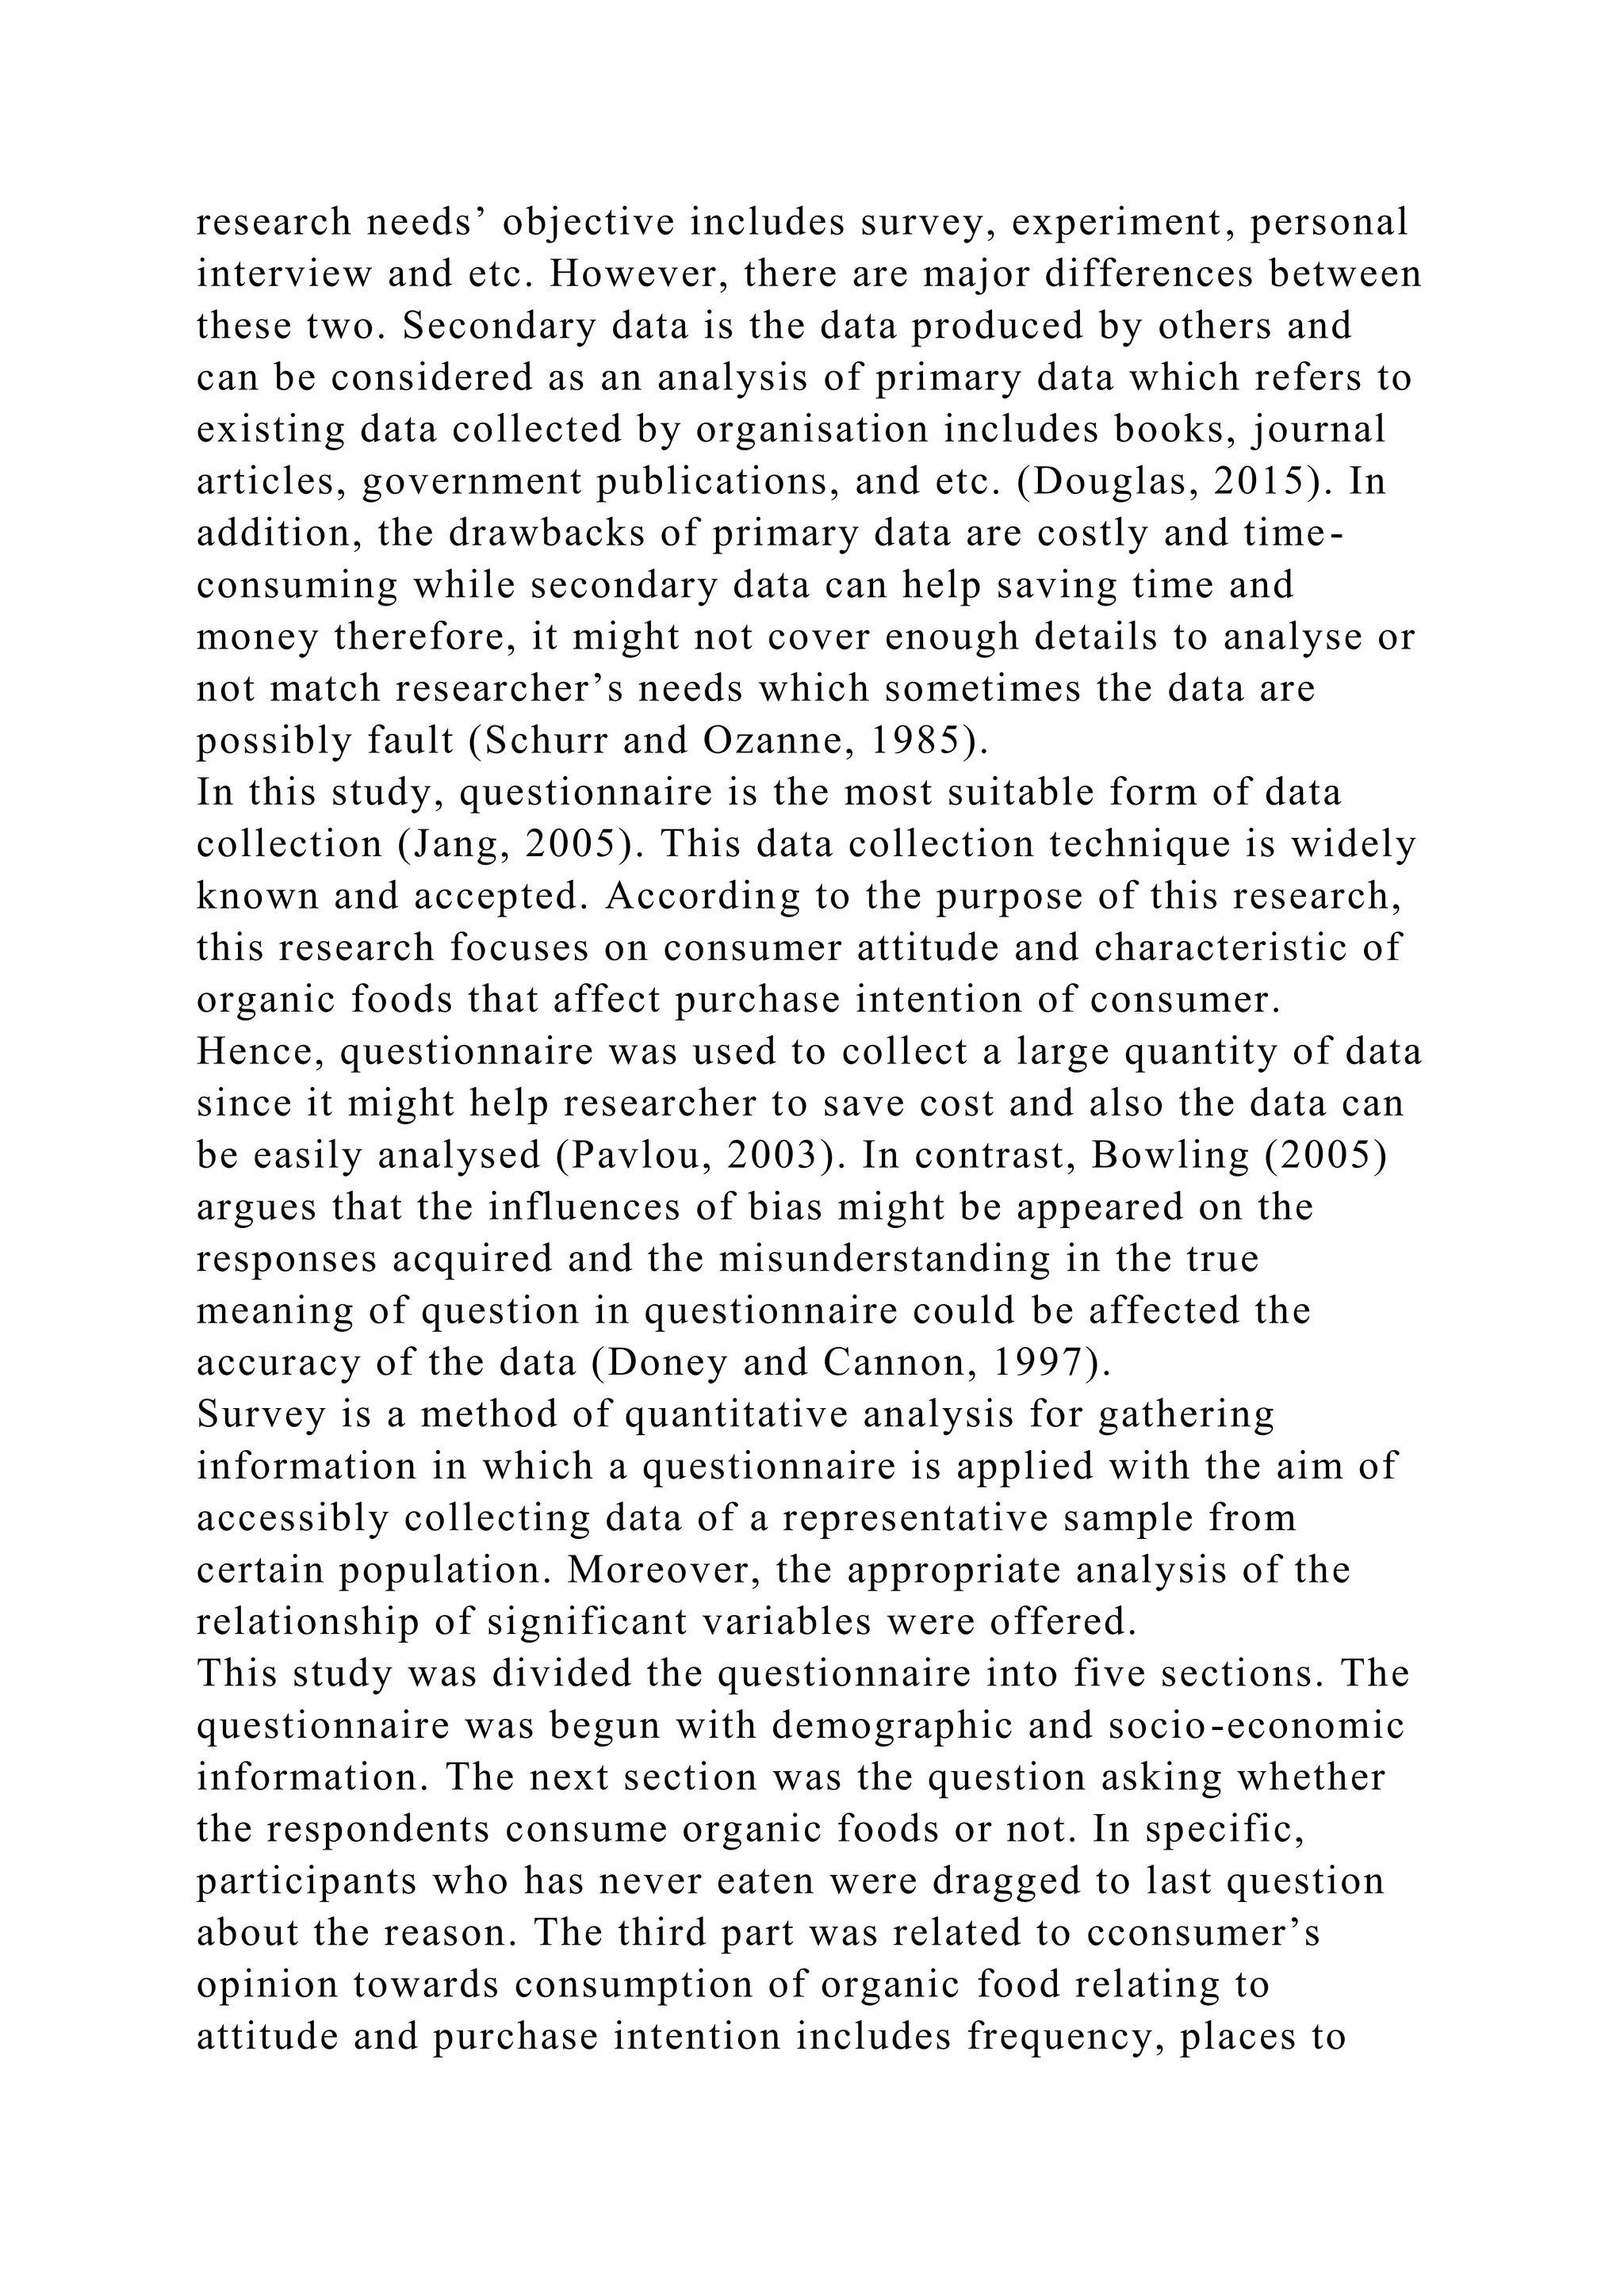
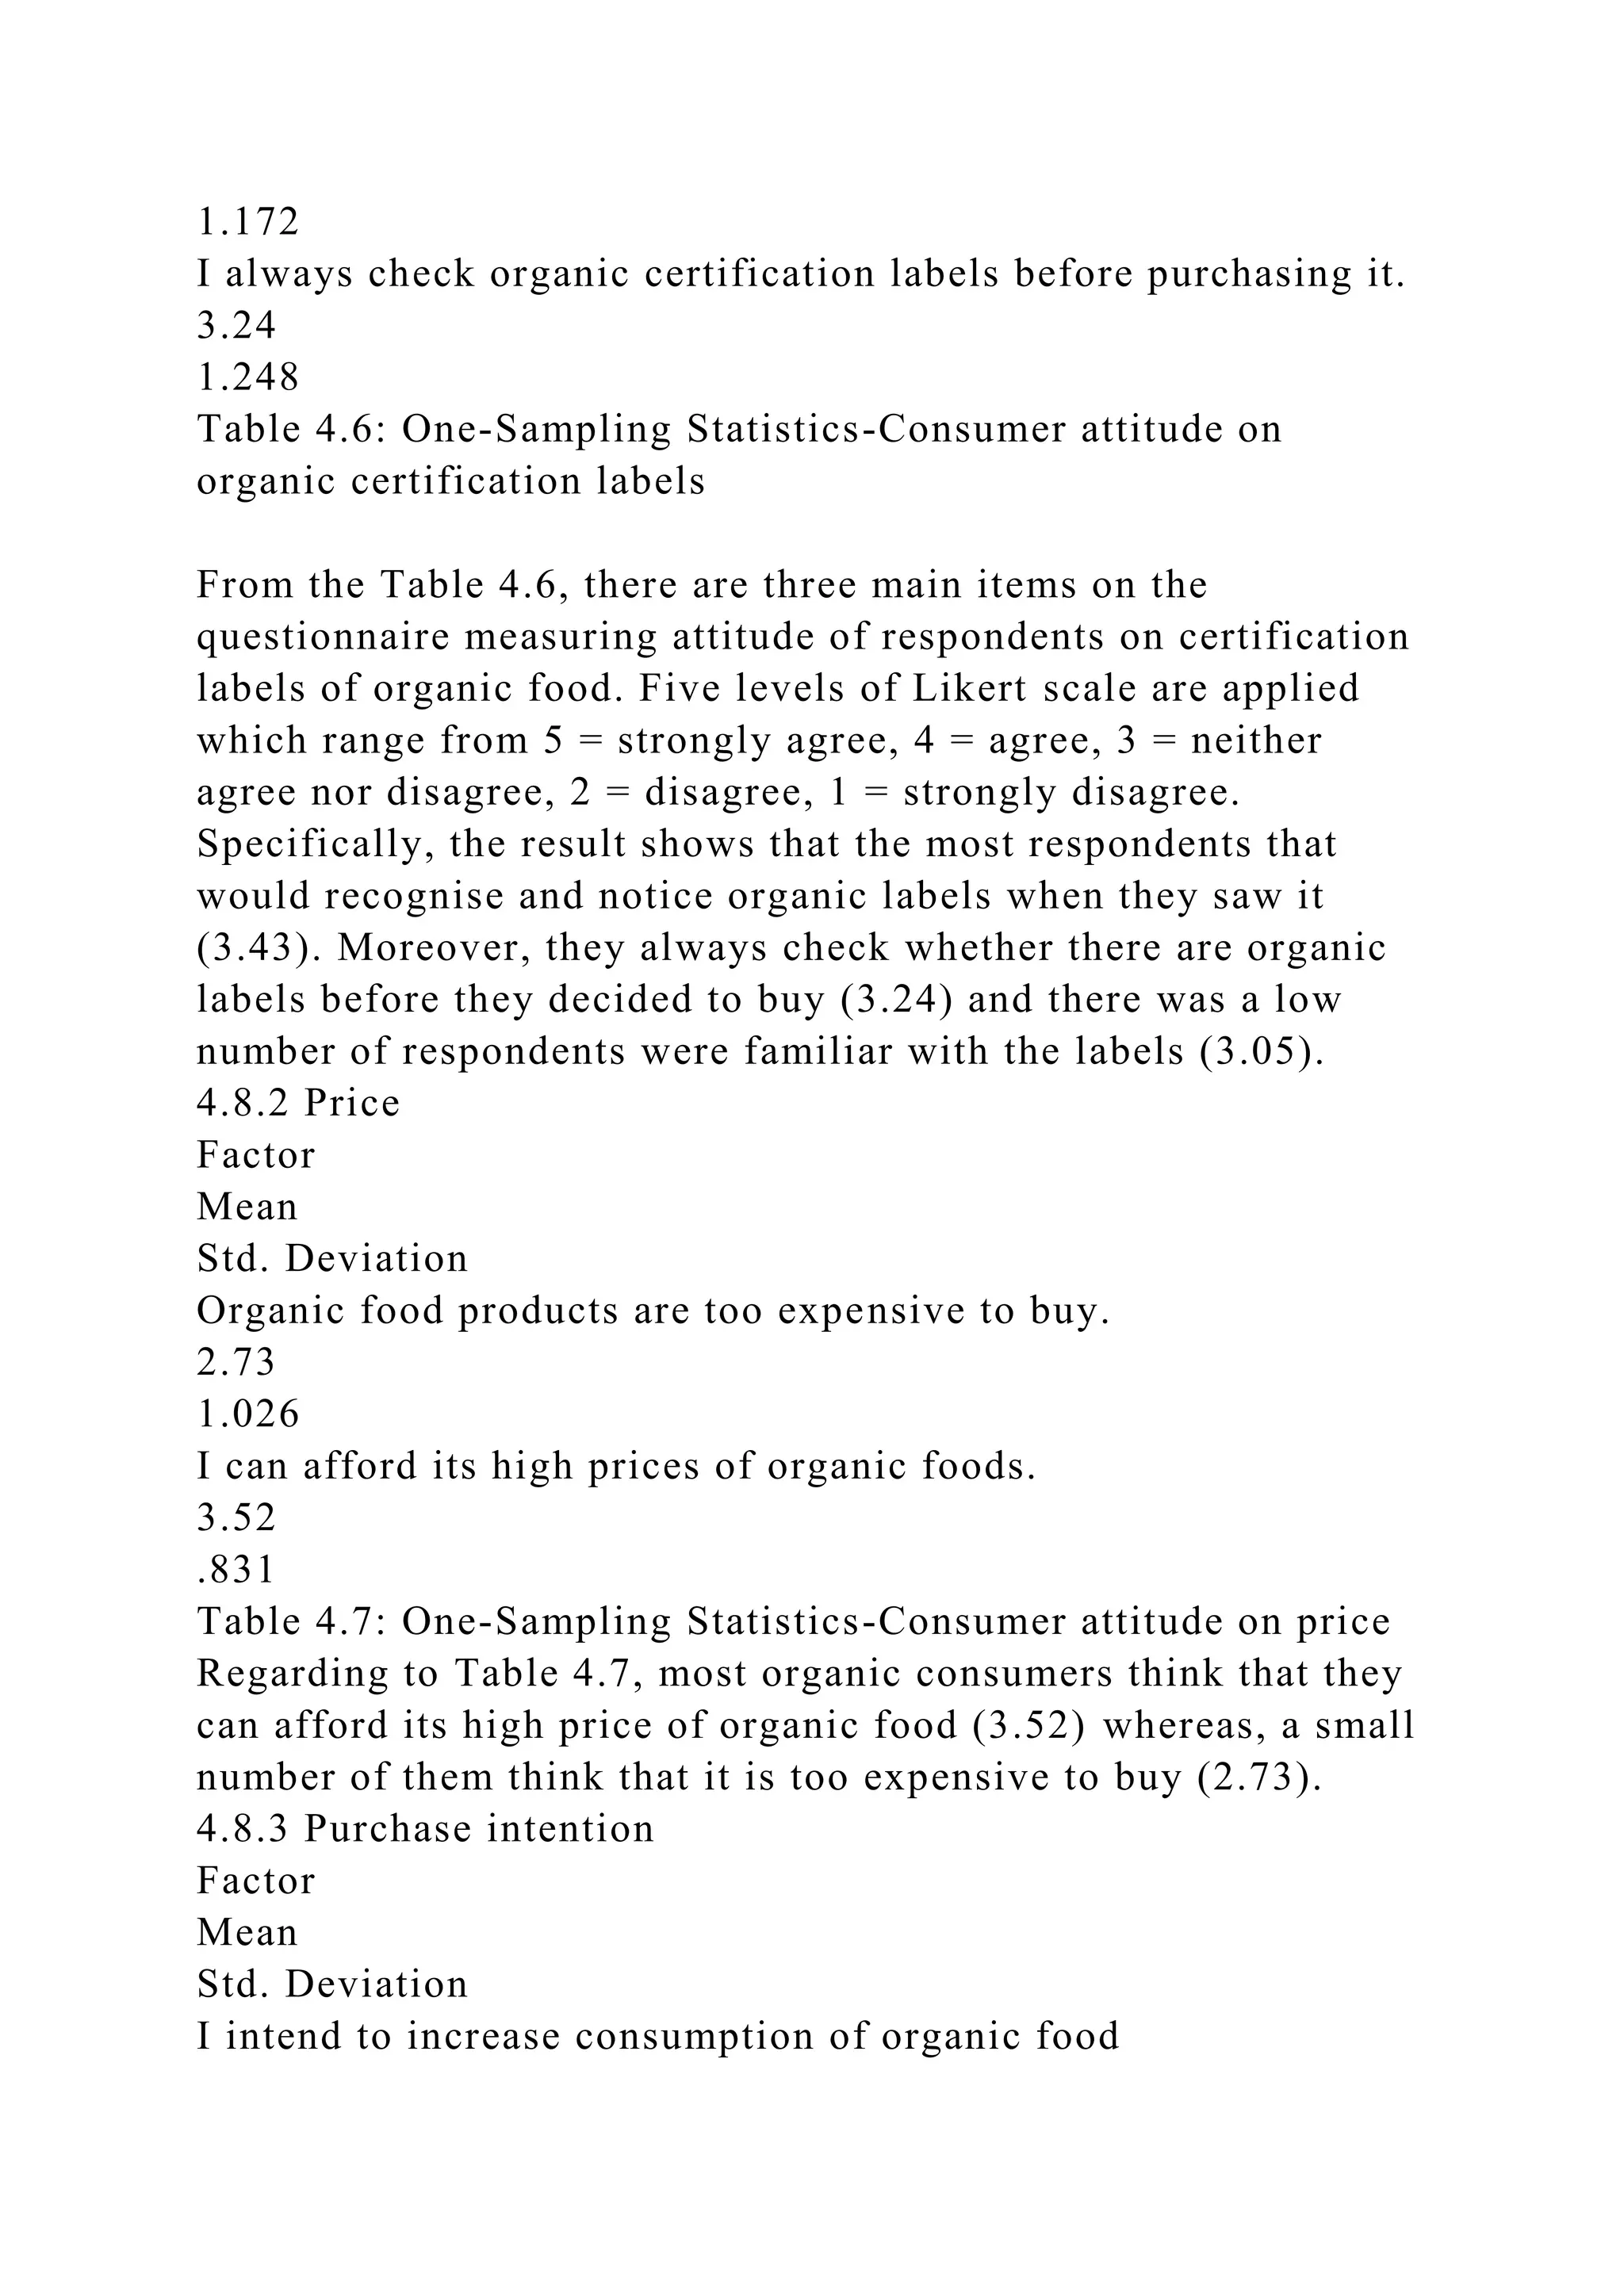
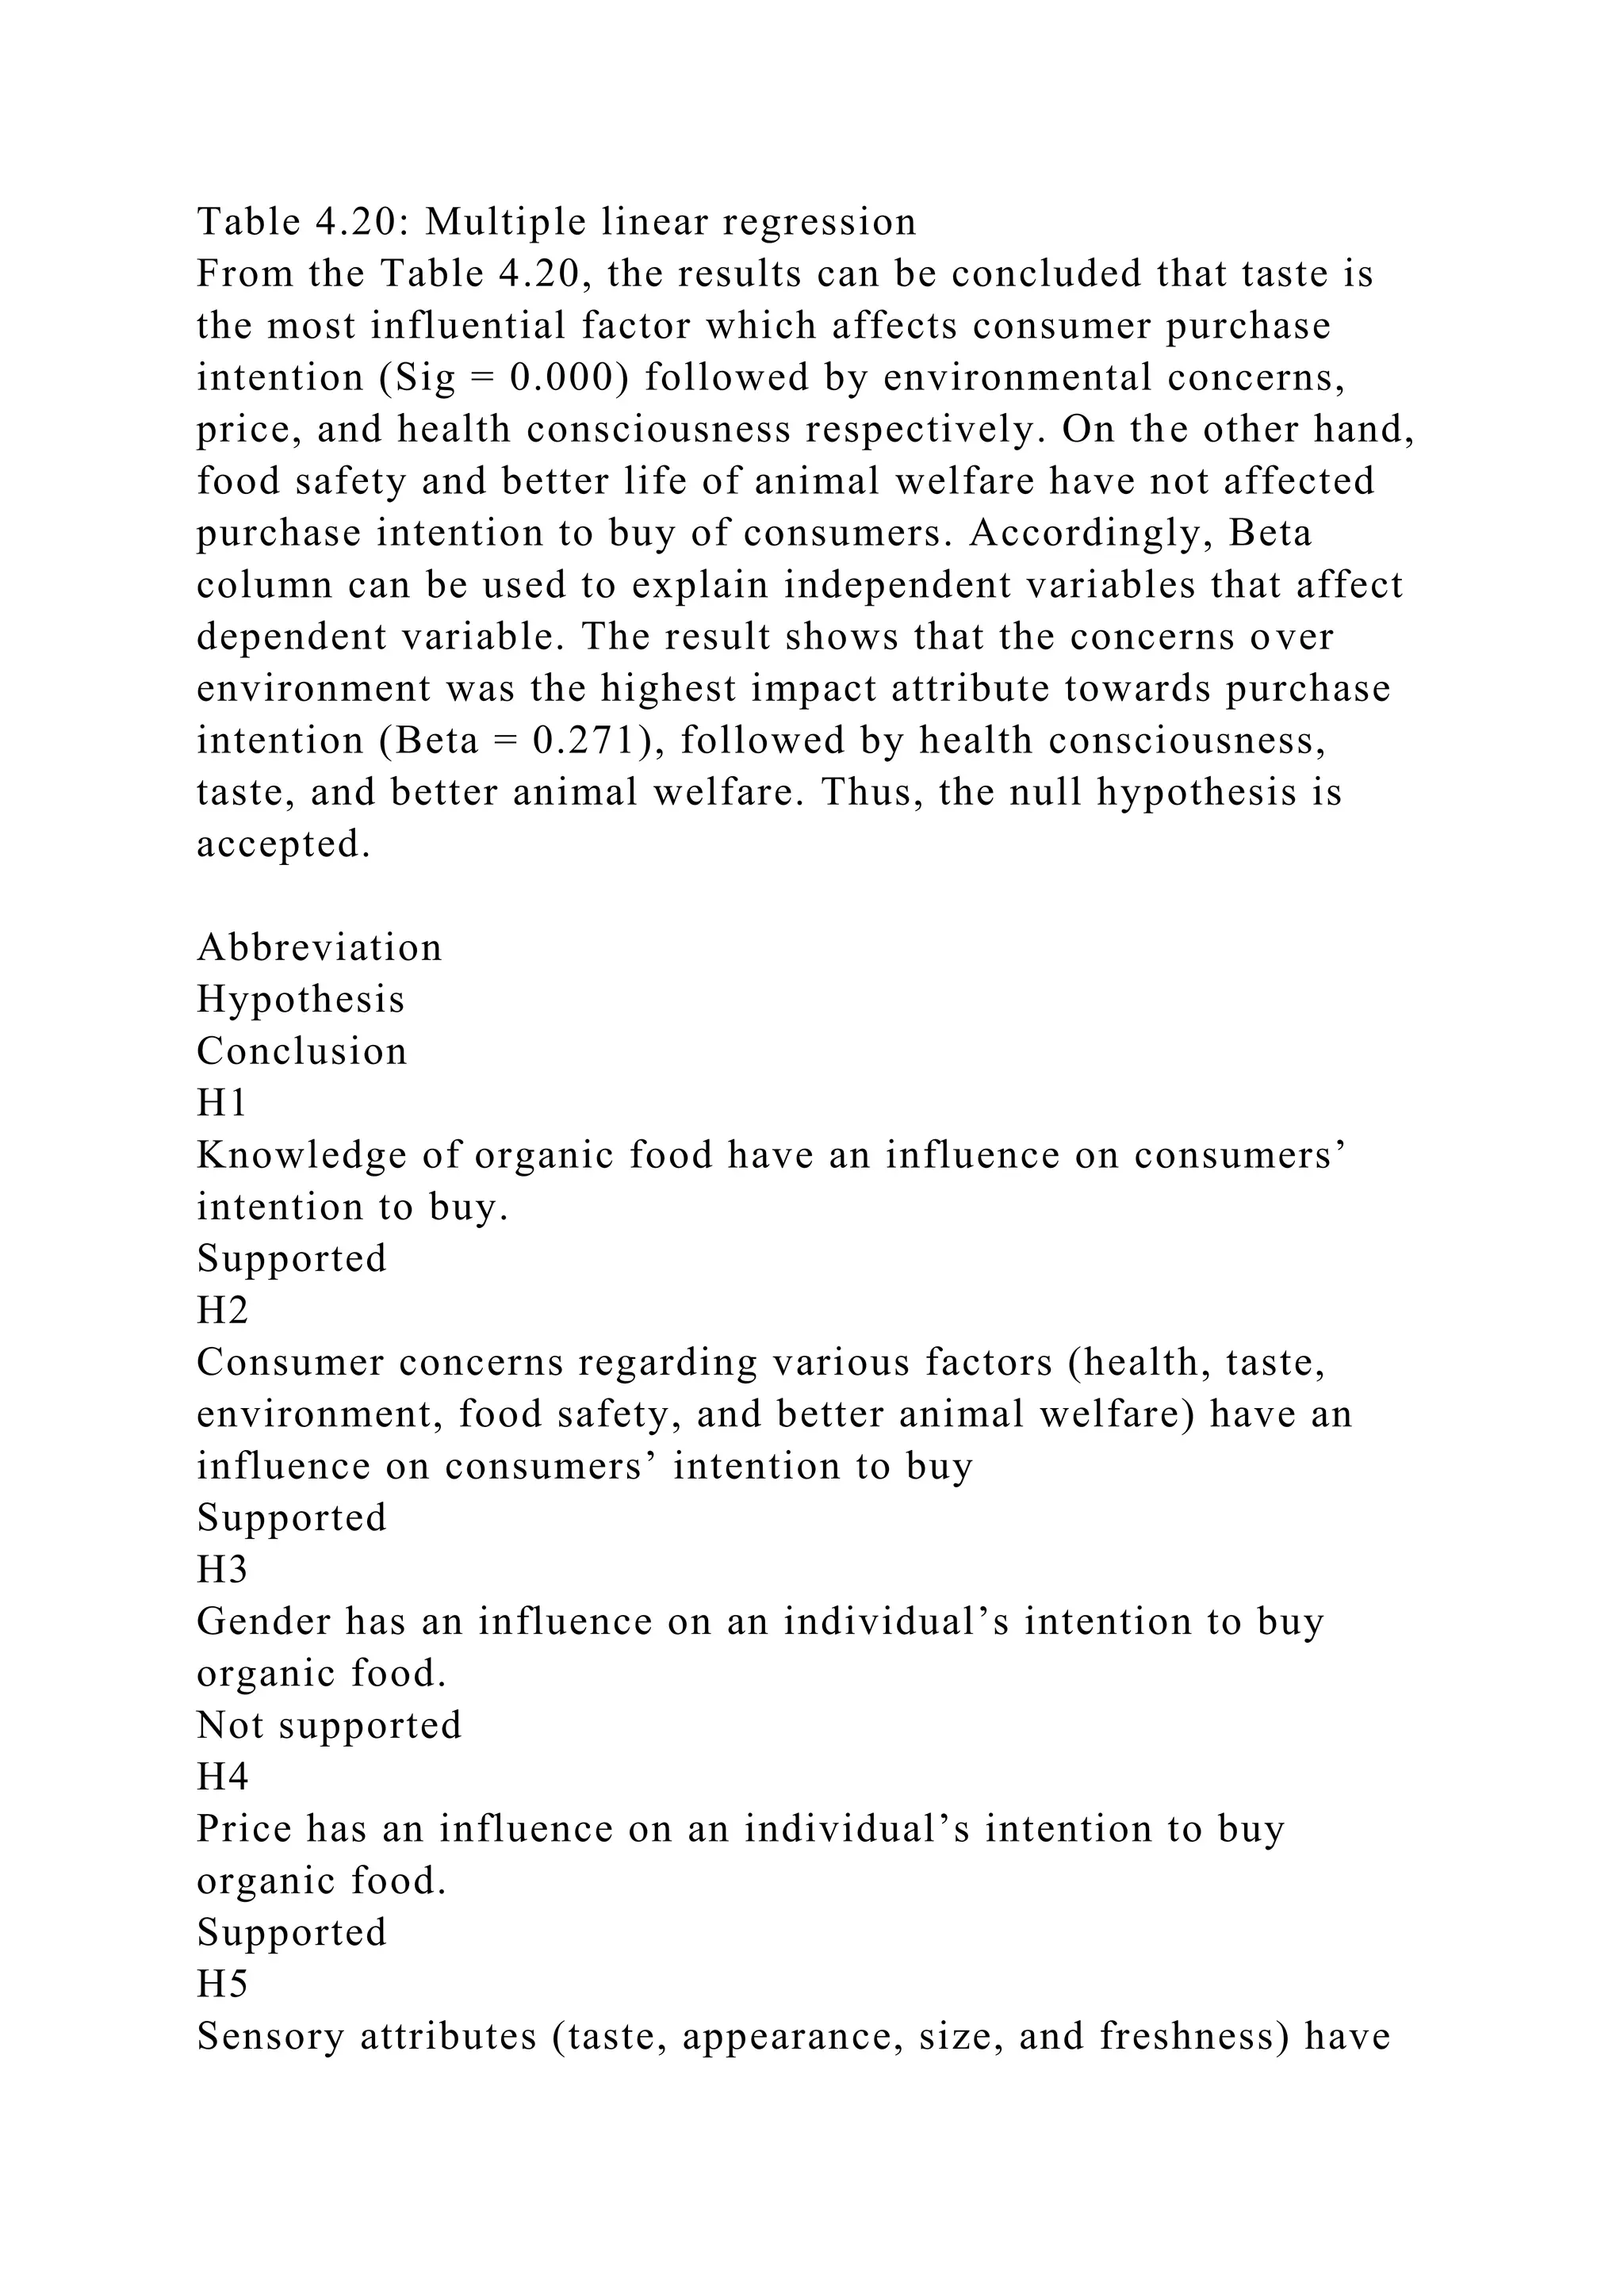
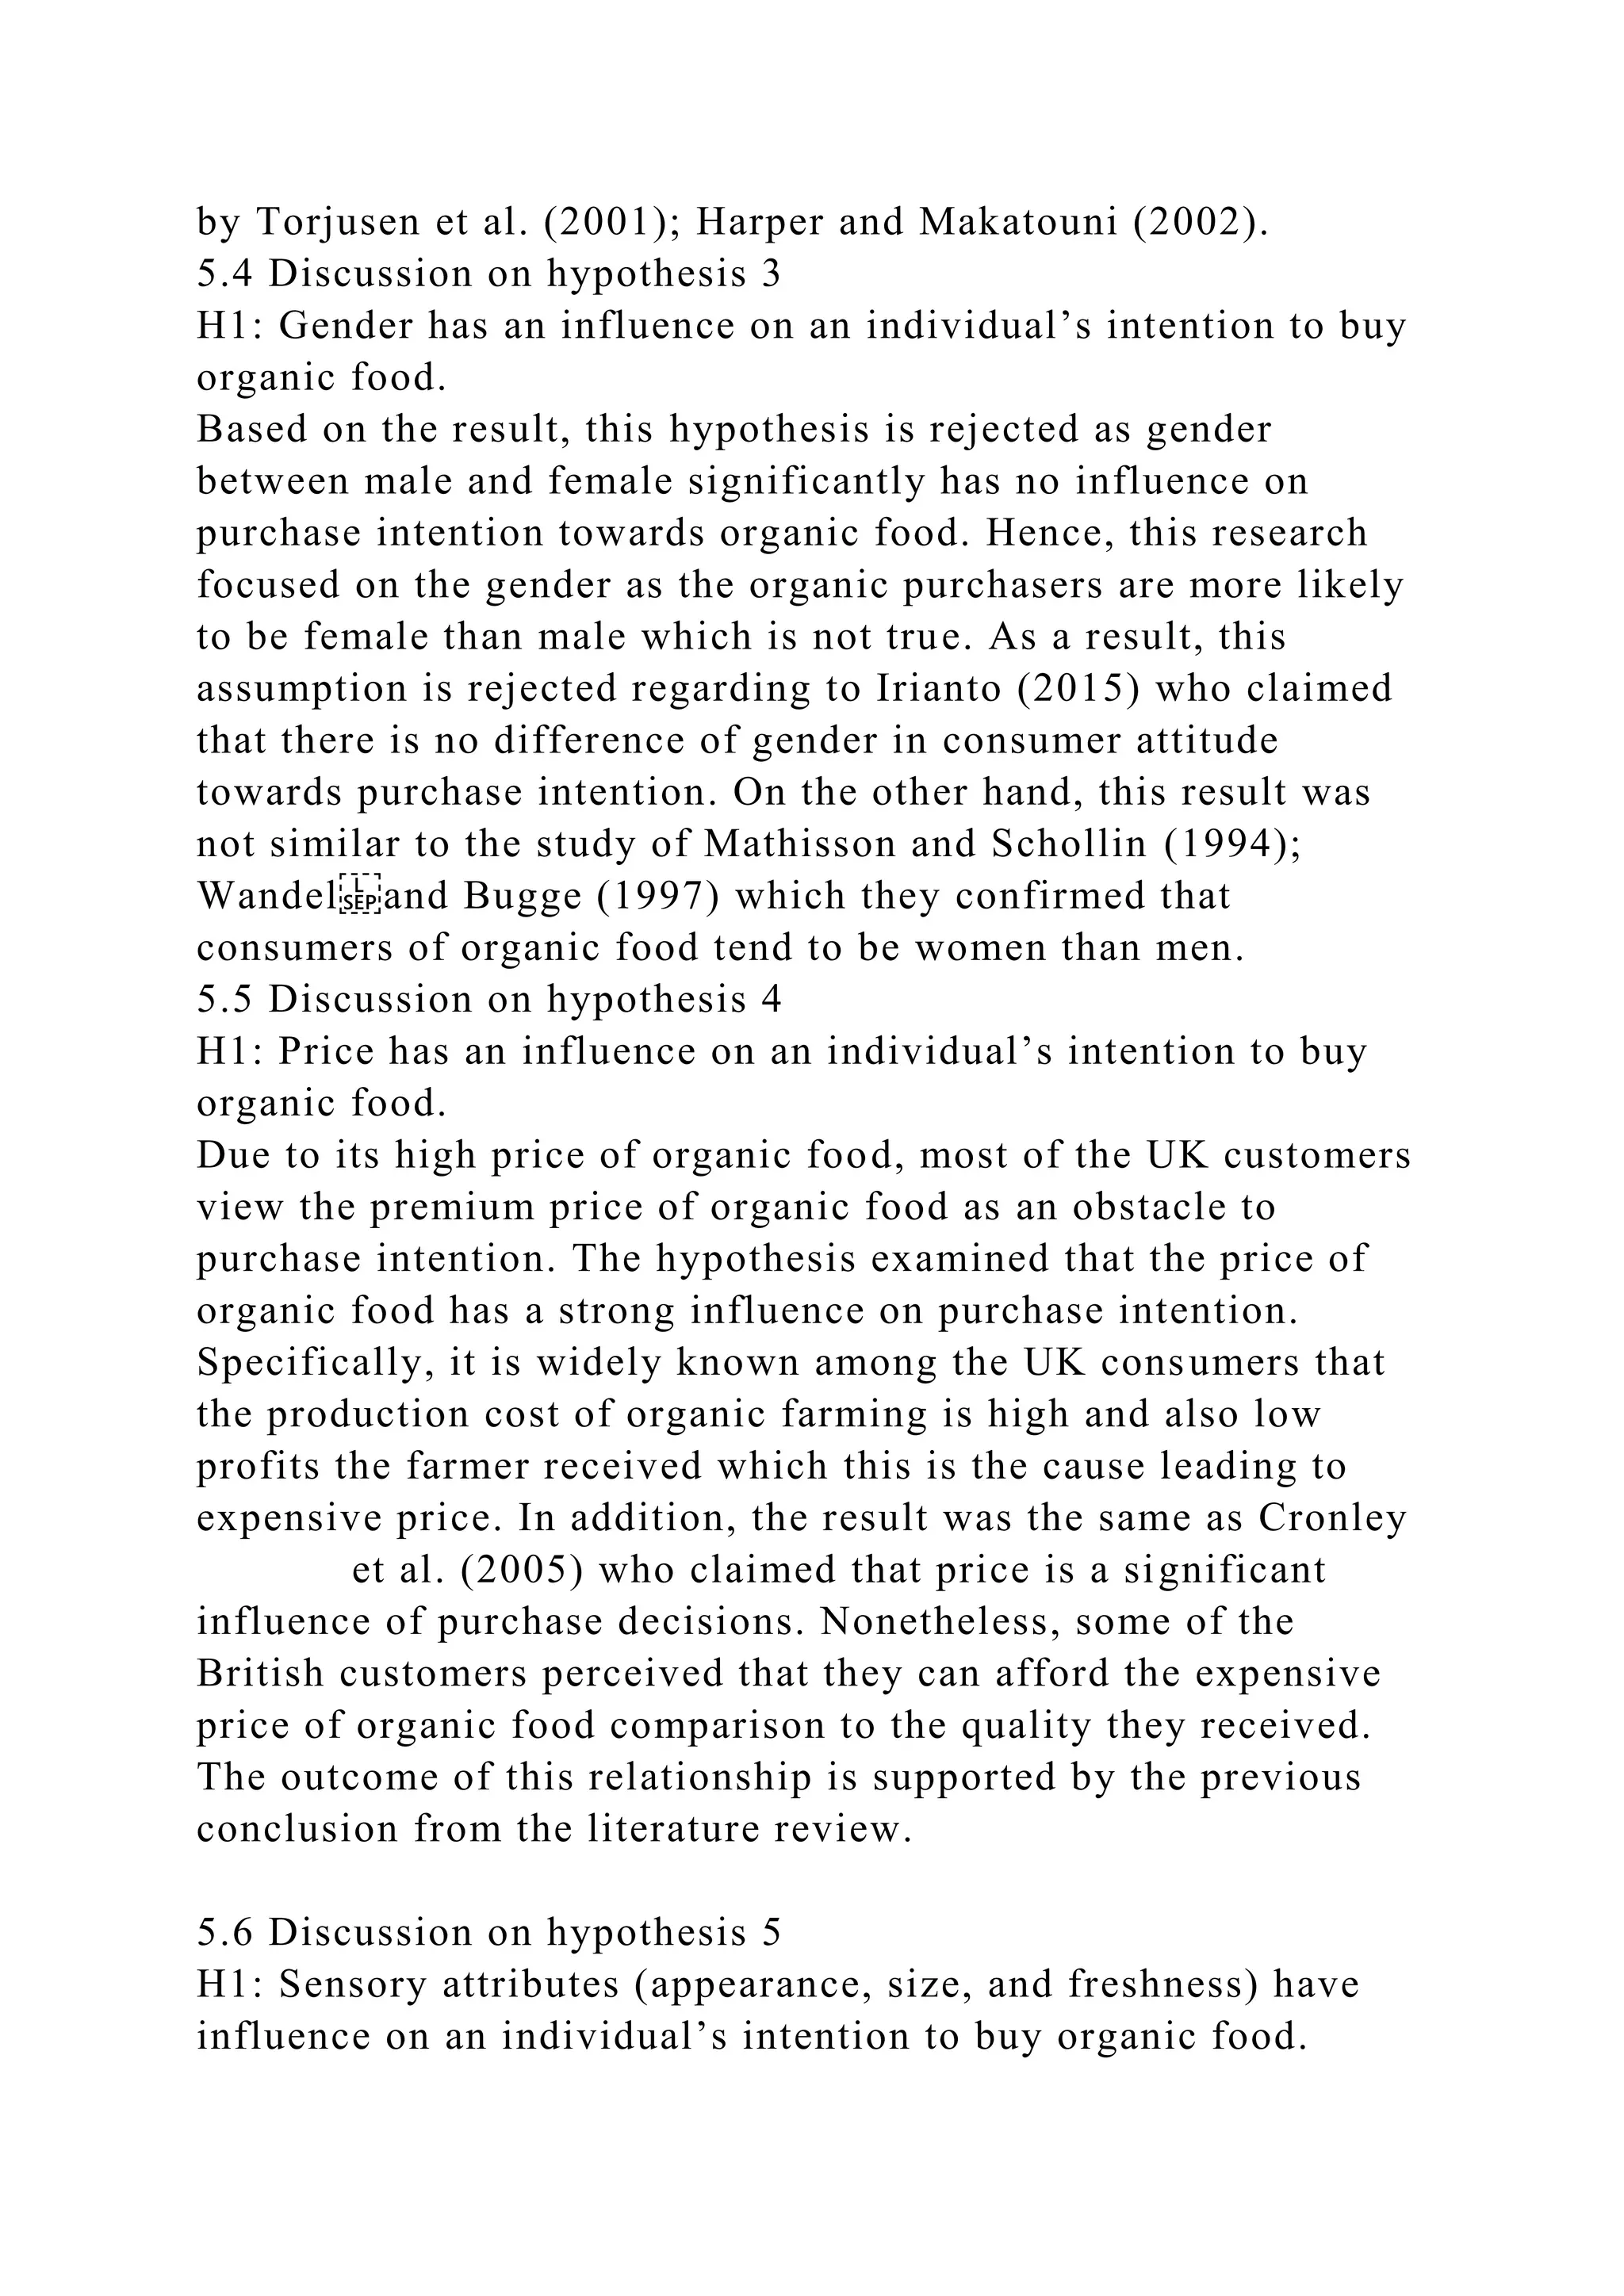
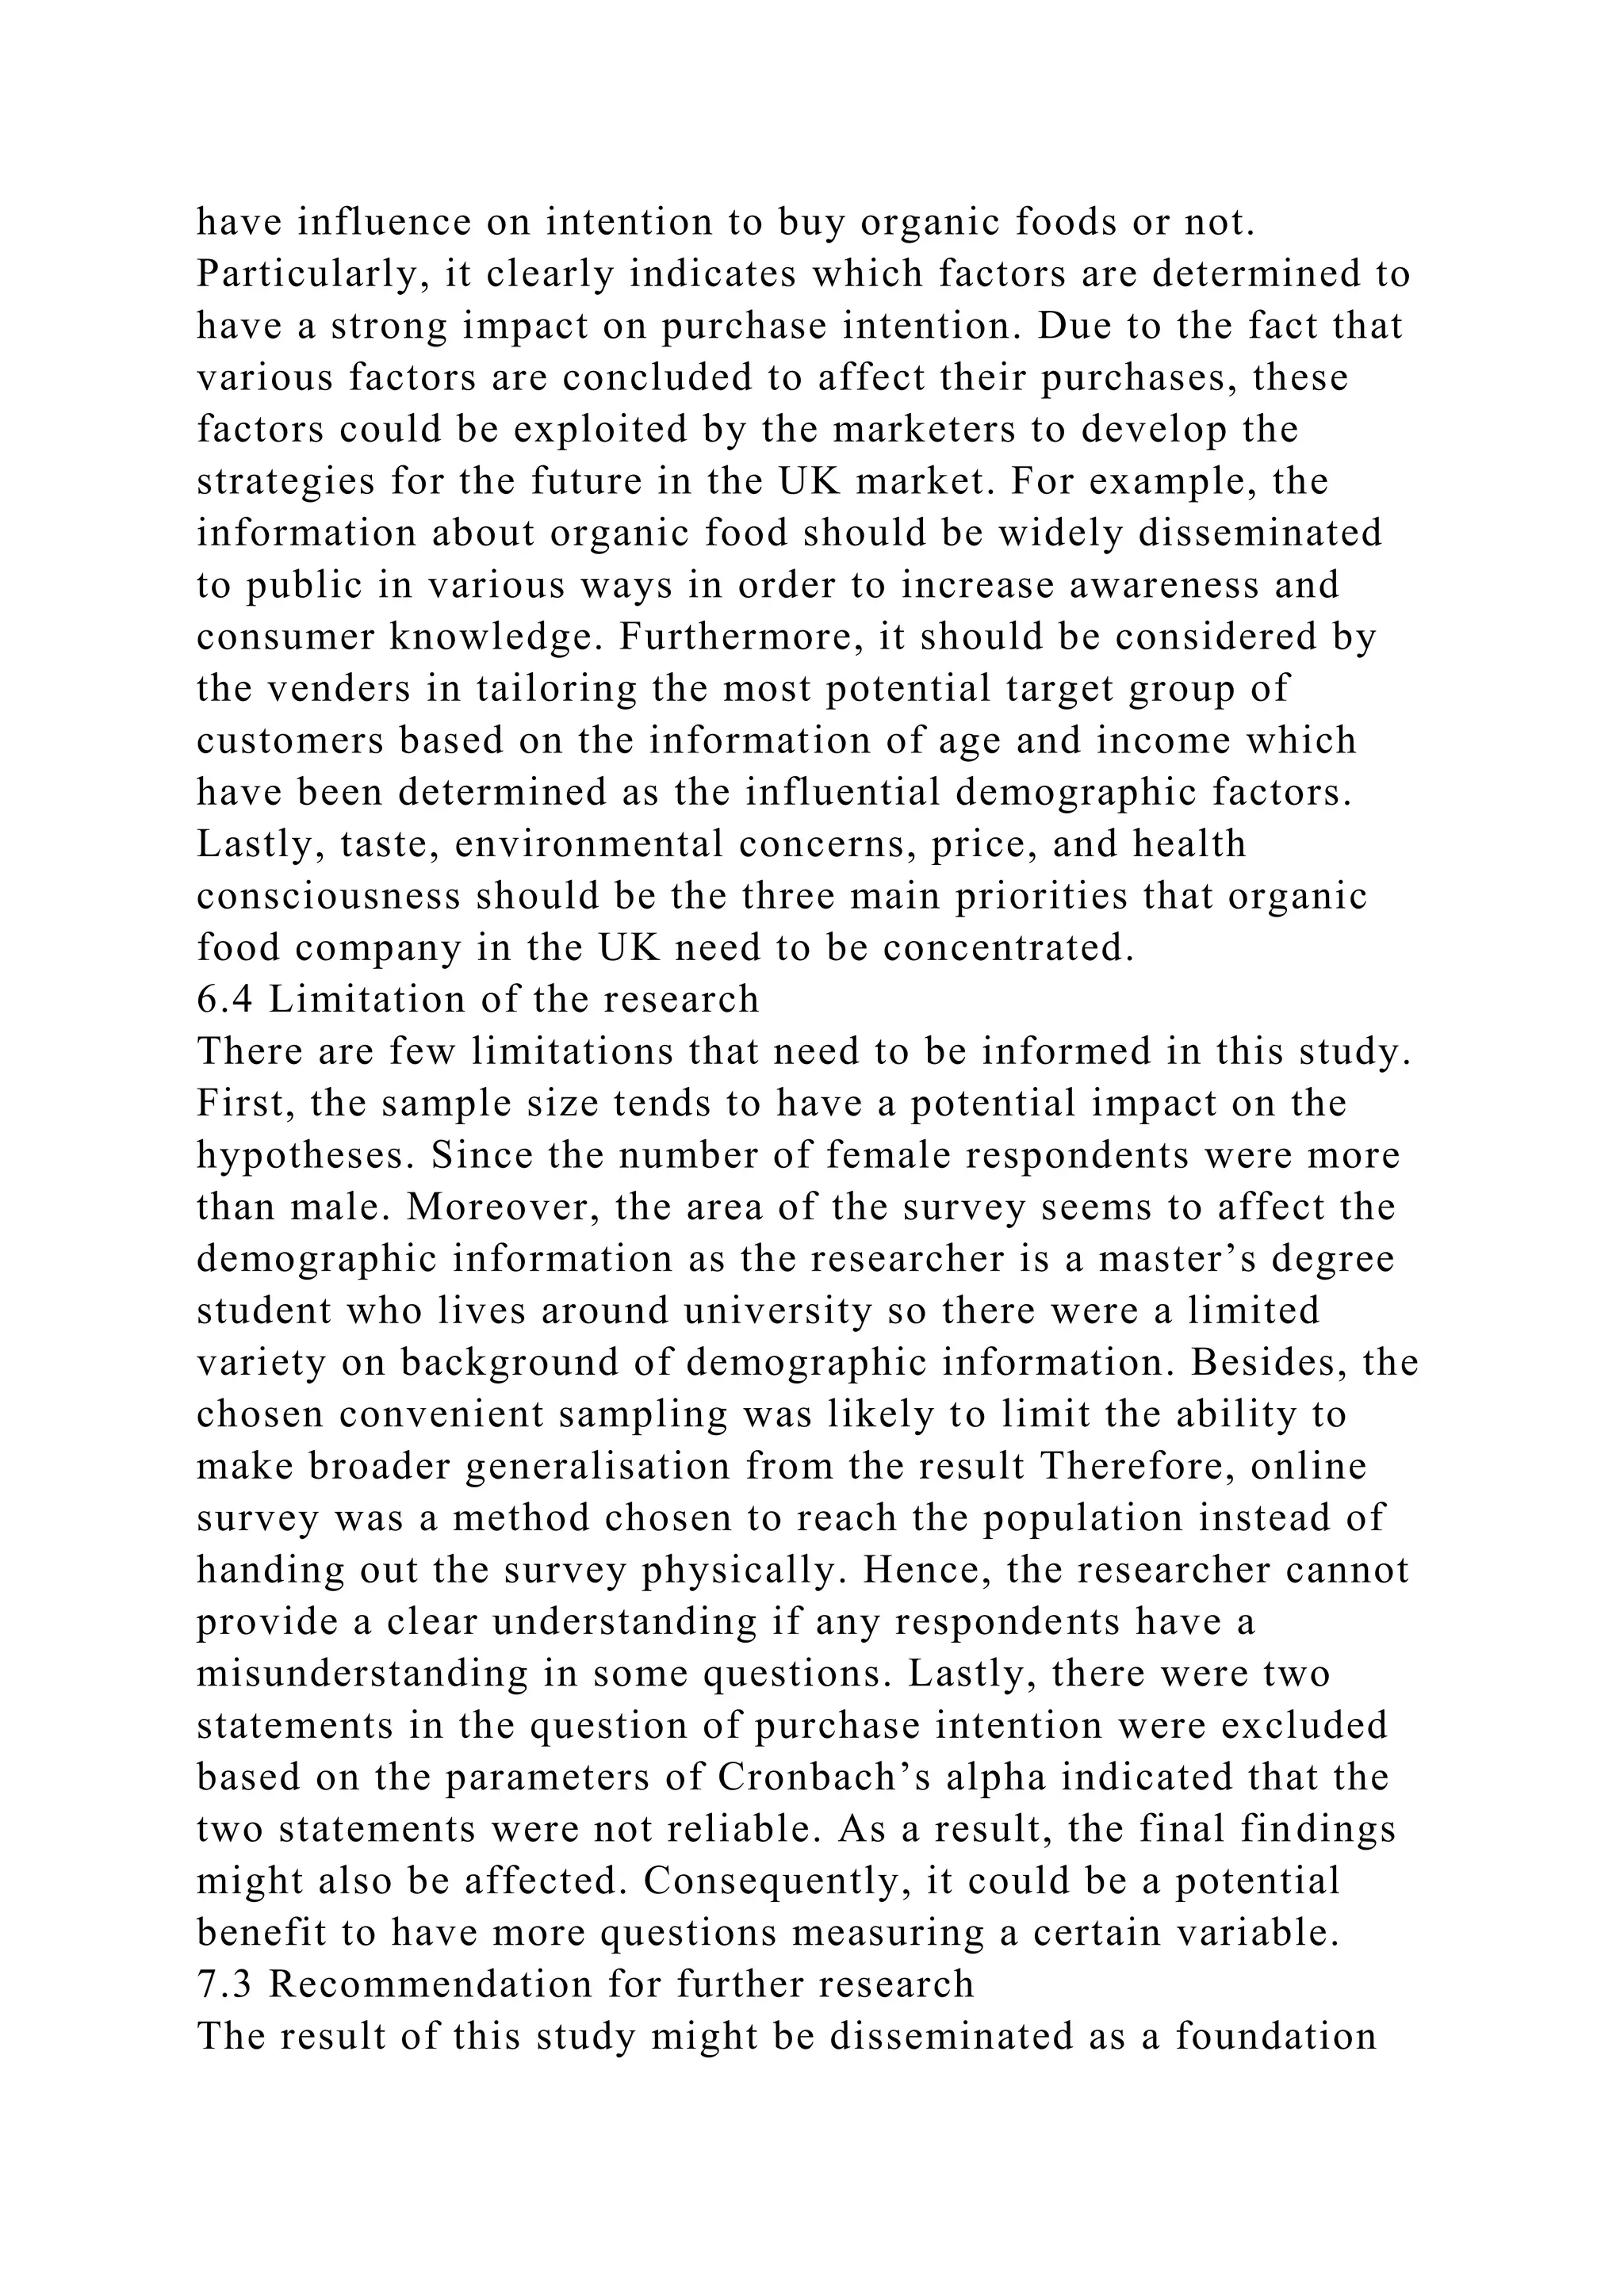
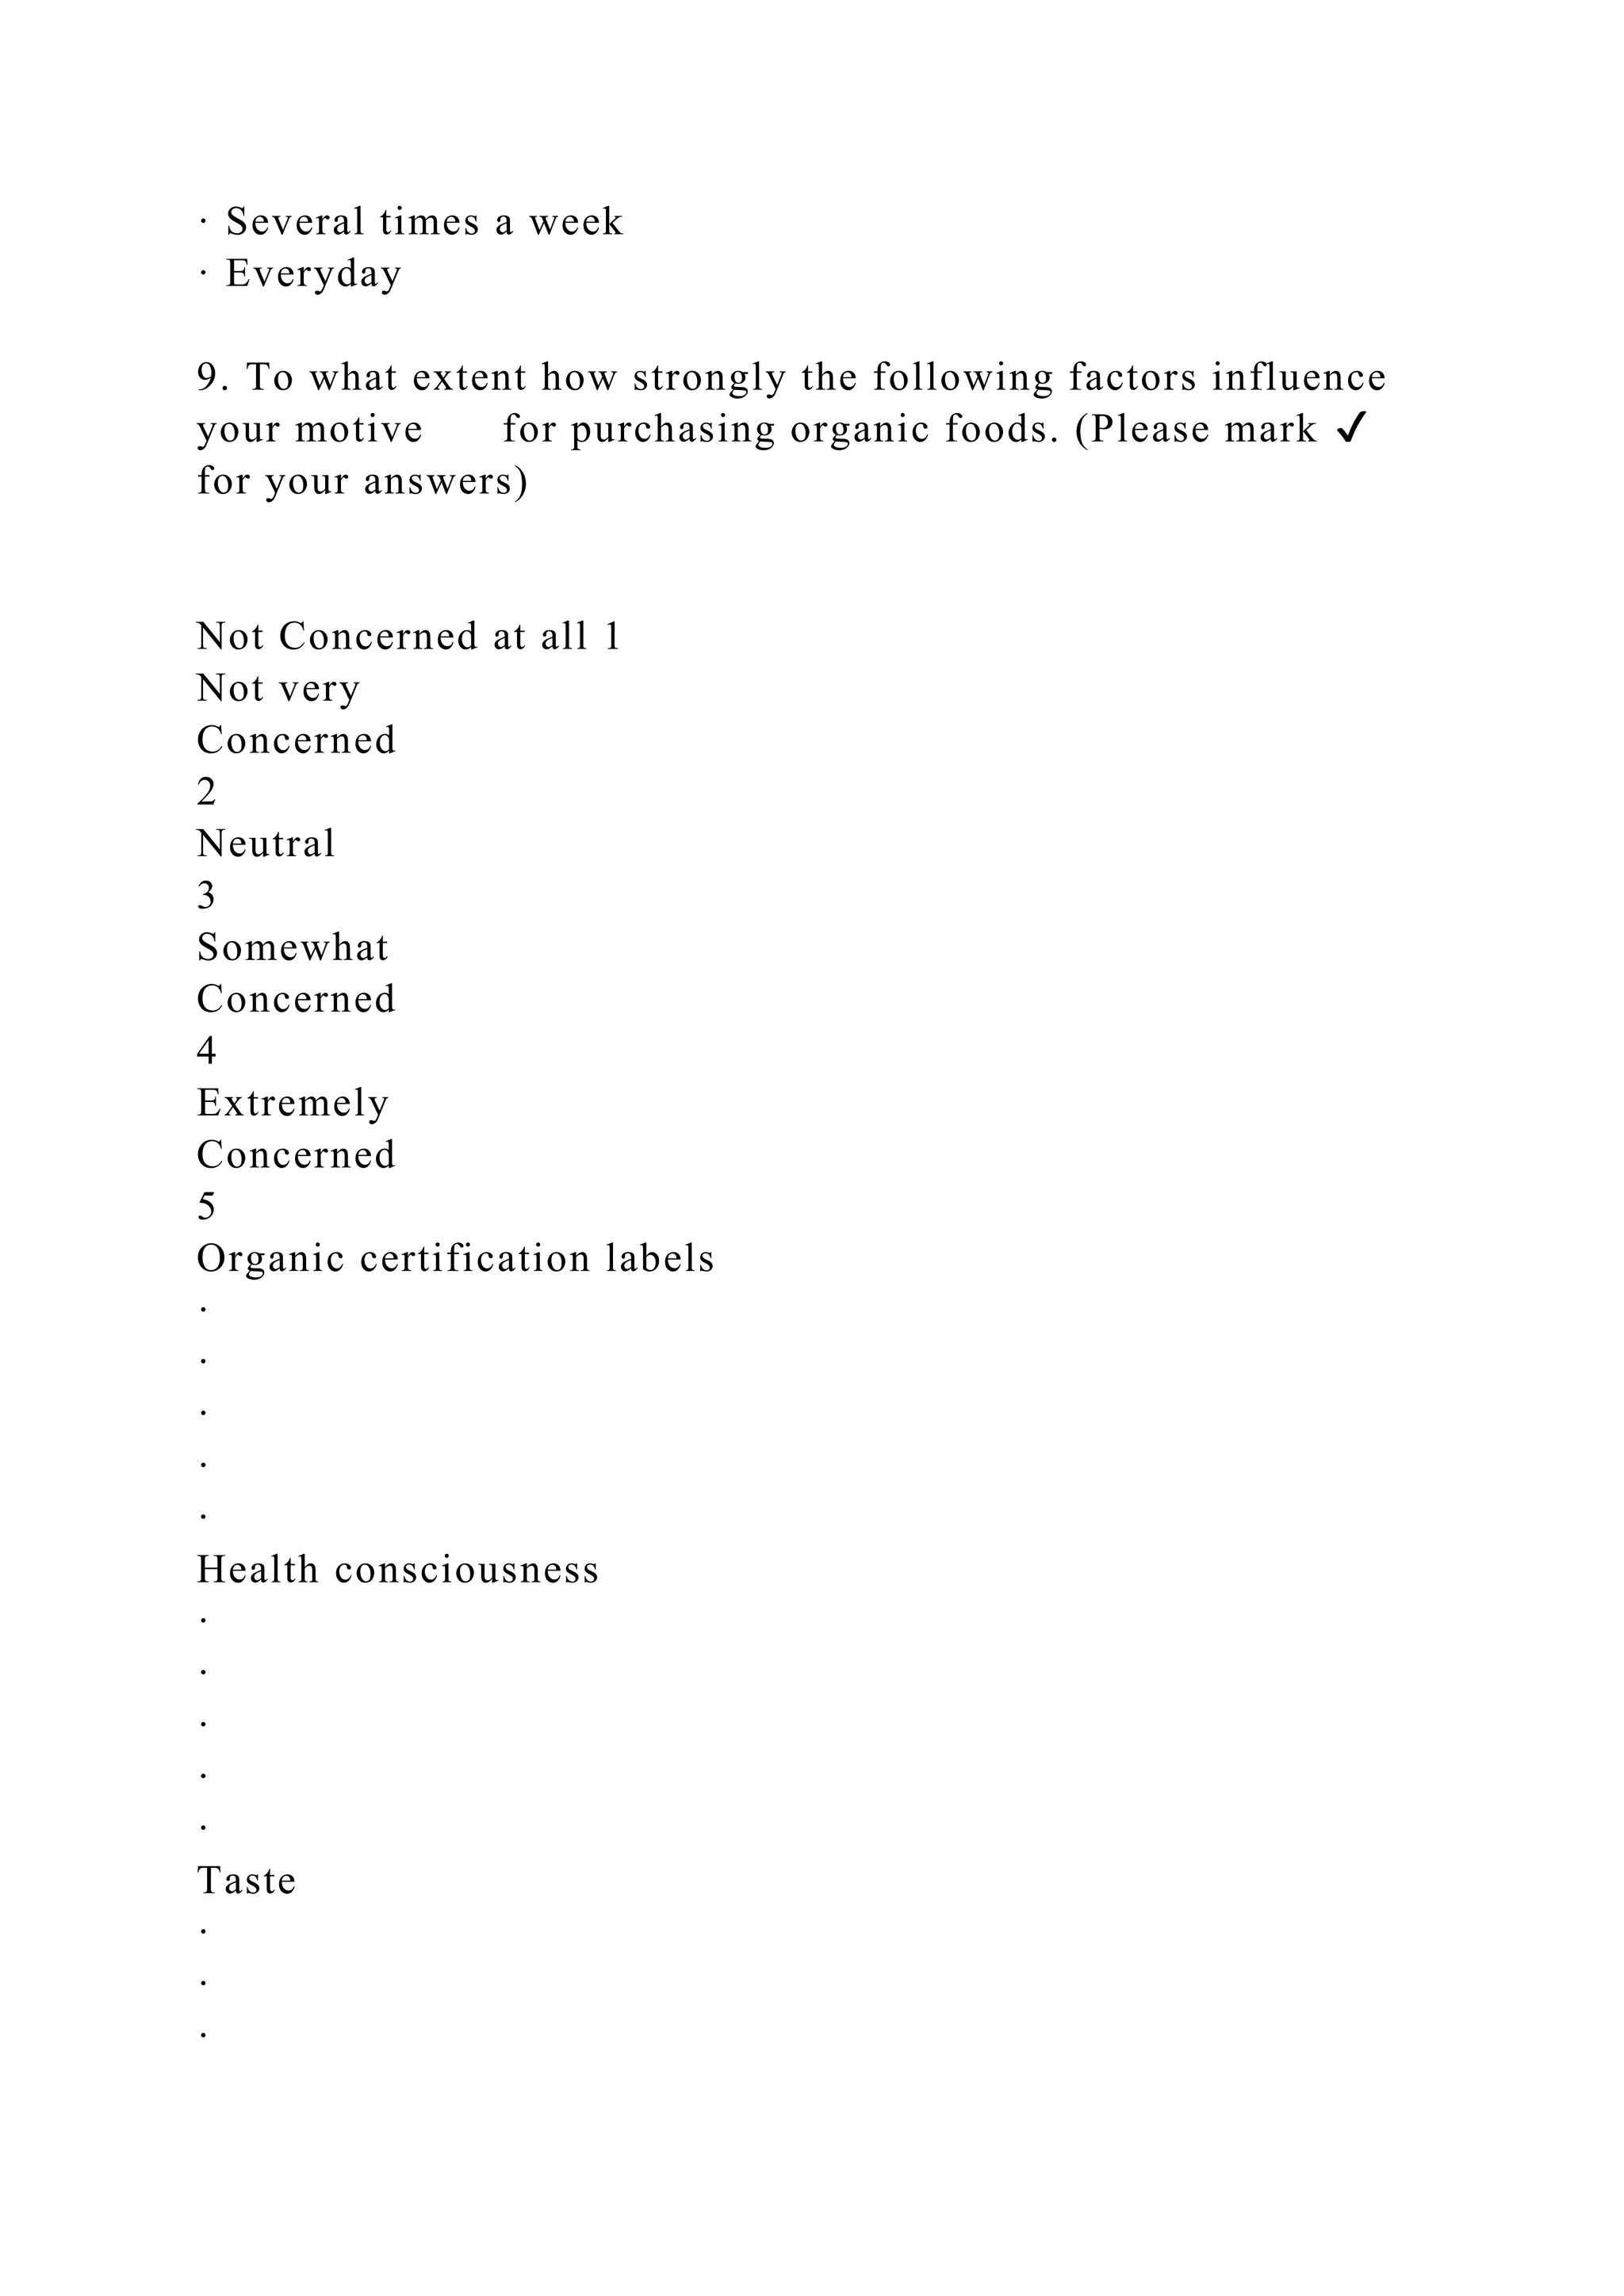
![Fruits Vegetables Poultry (Eggs) Red Meat 73.2 92.8
39.2 27.8
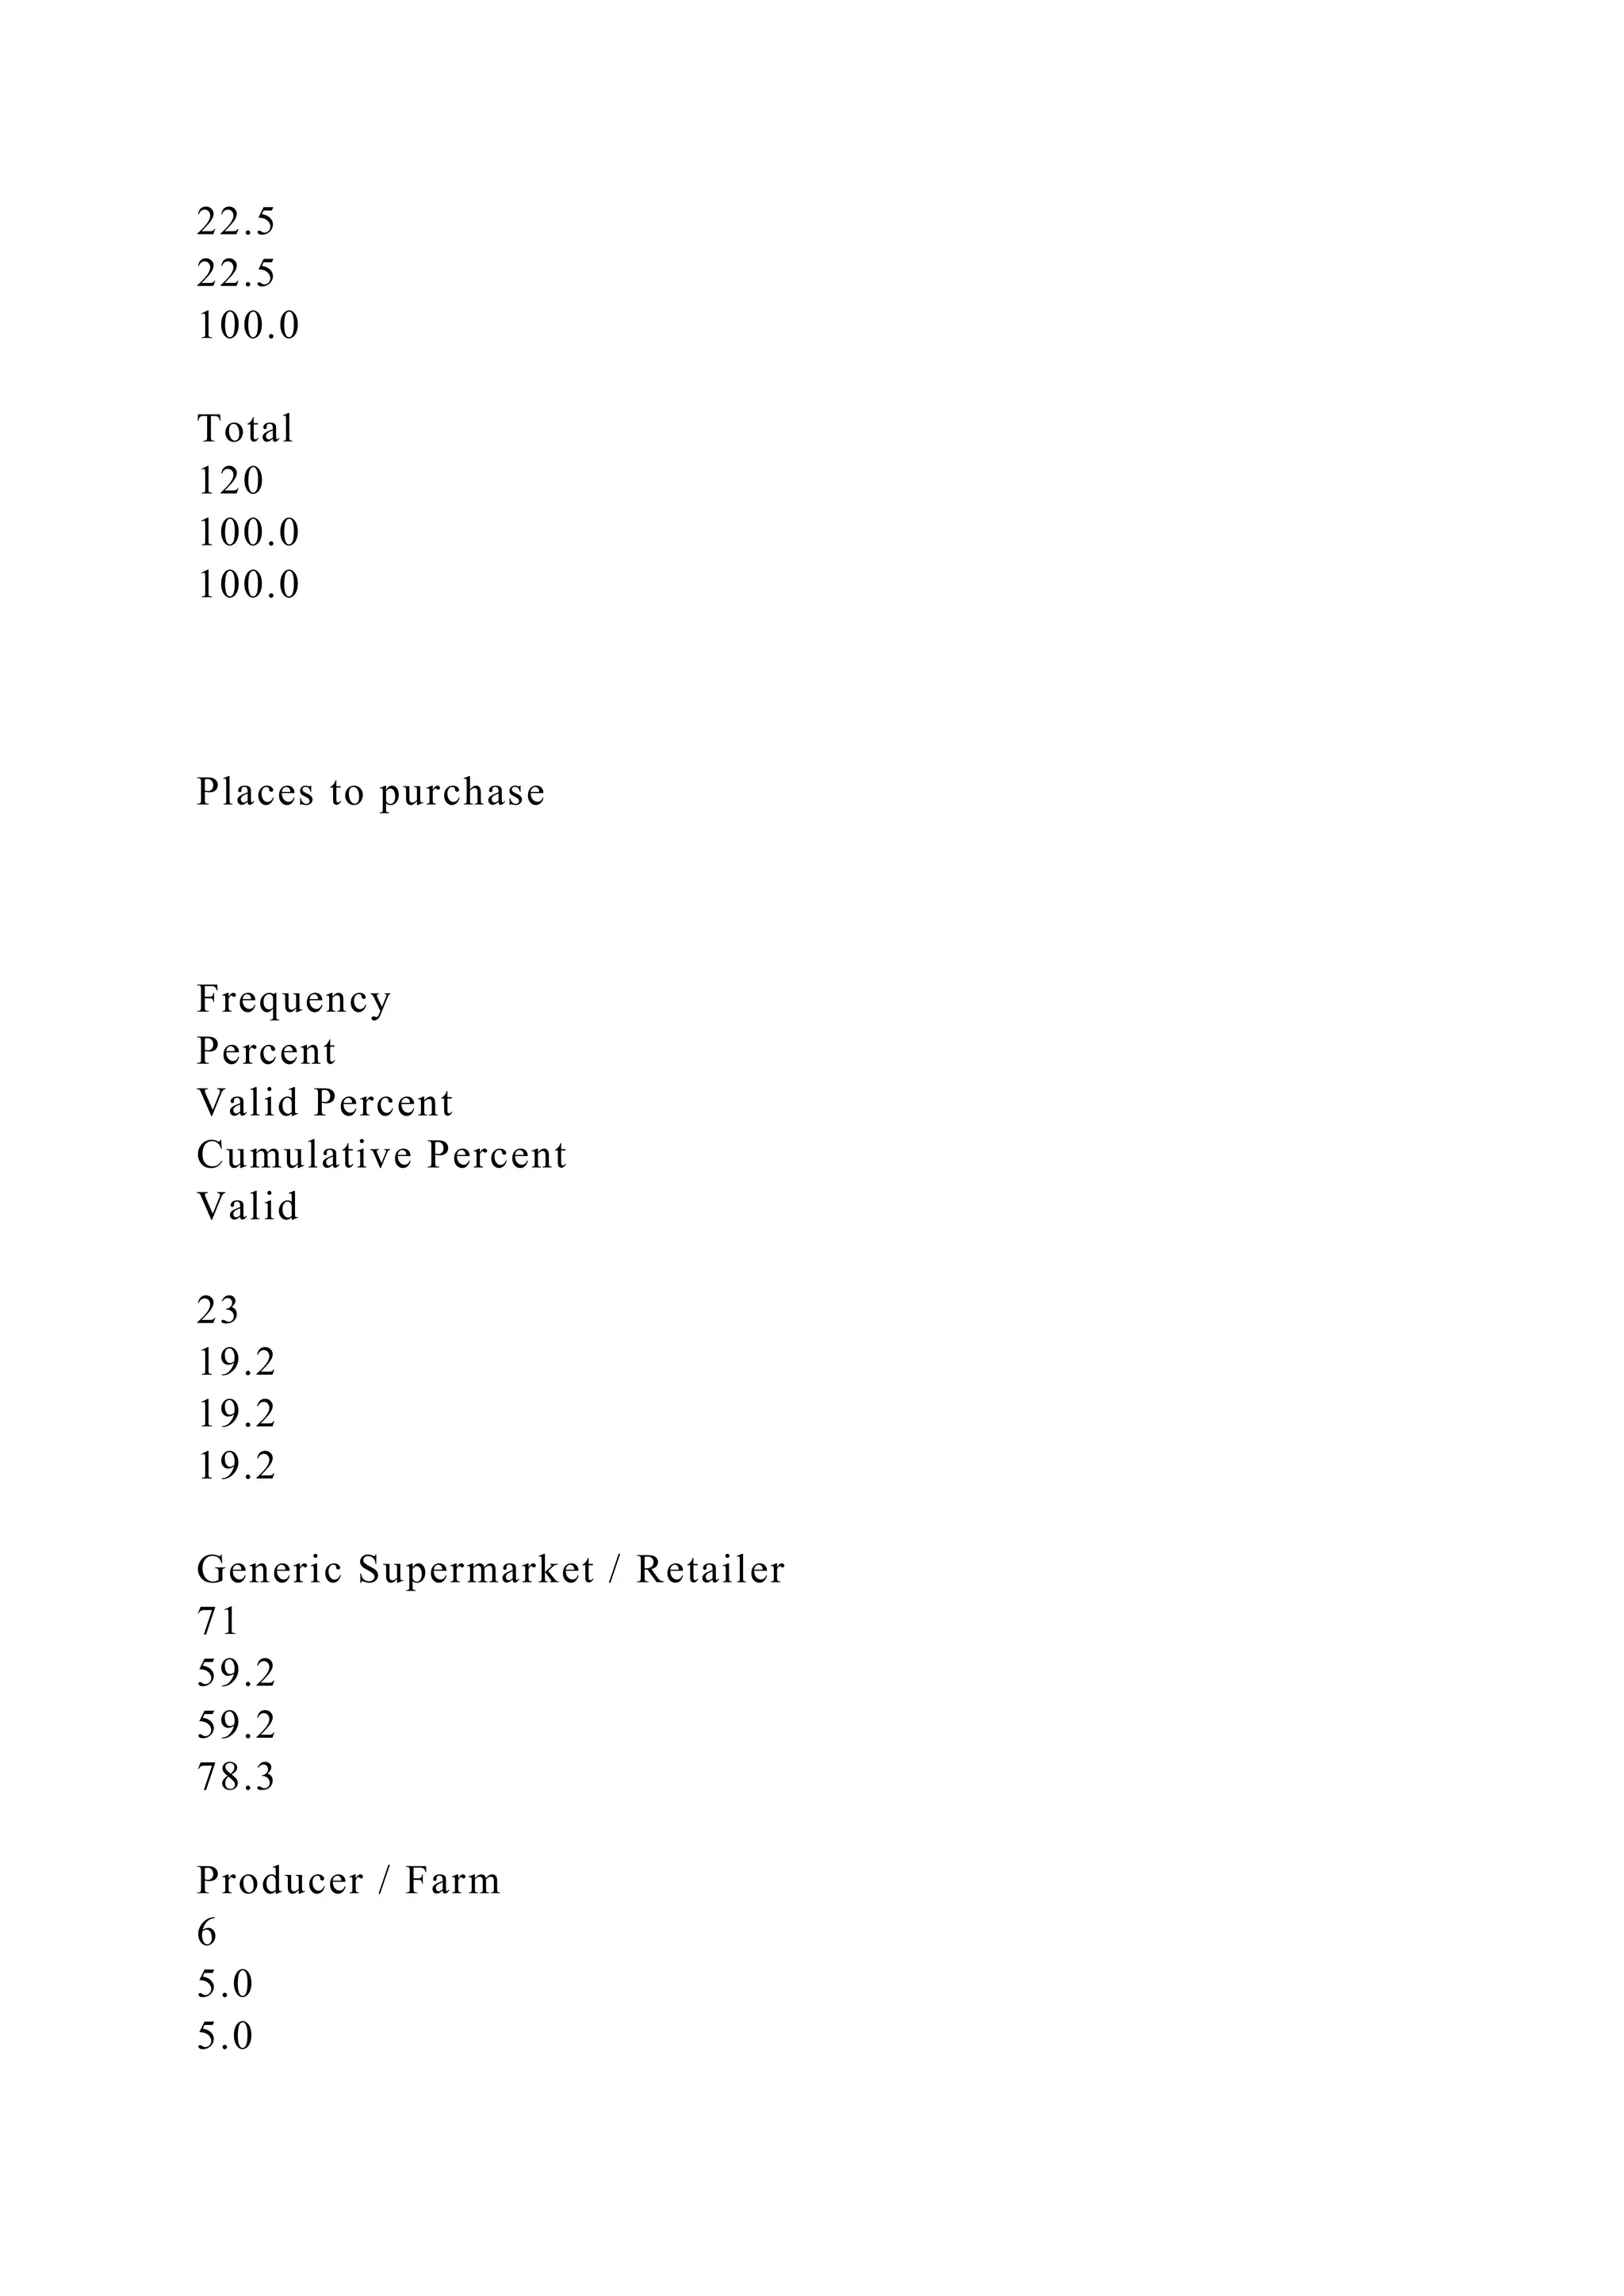
Where do you usually buy organic food? [VALUE]%
[VALUE]%
[VALUE]%
Generic Supermarket/ Retailer Producer/ FarmSpecialty
Organic/ Health store Others (all) 59.2 5.0 14.2 2.5
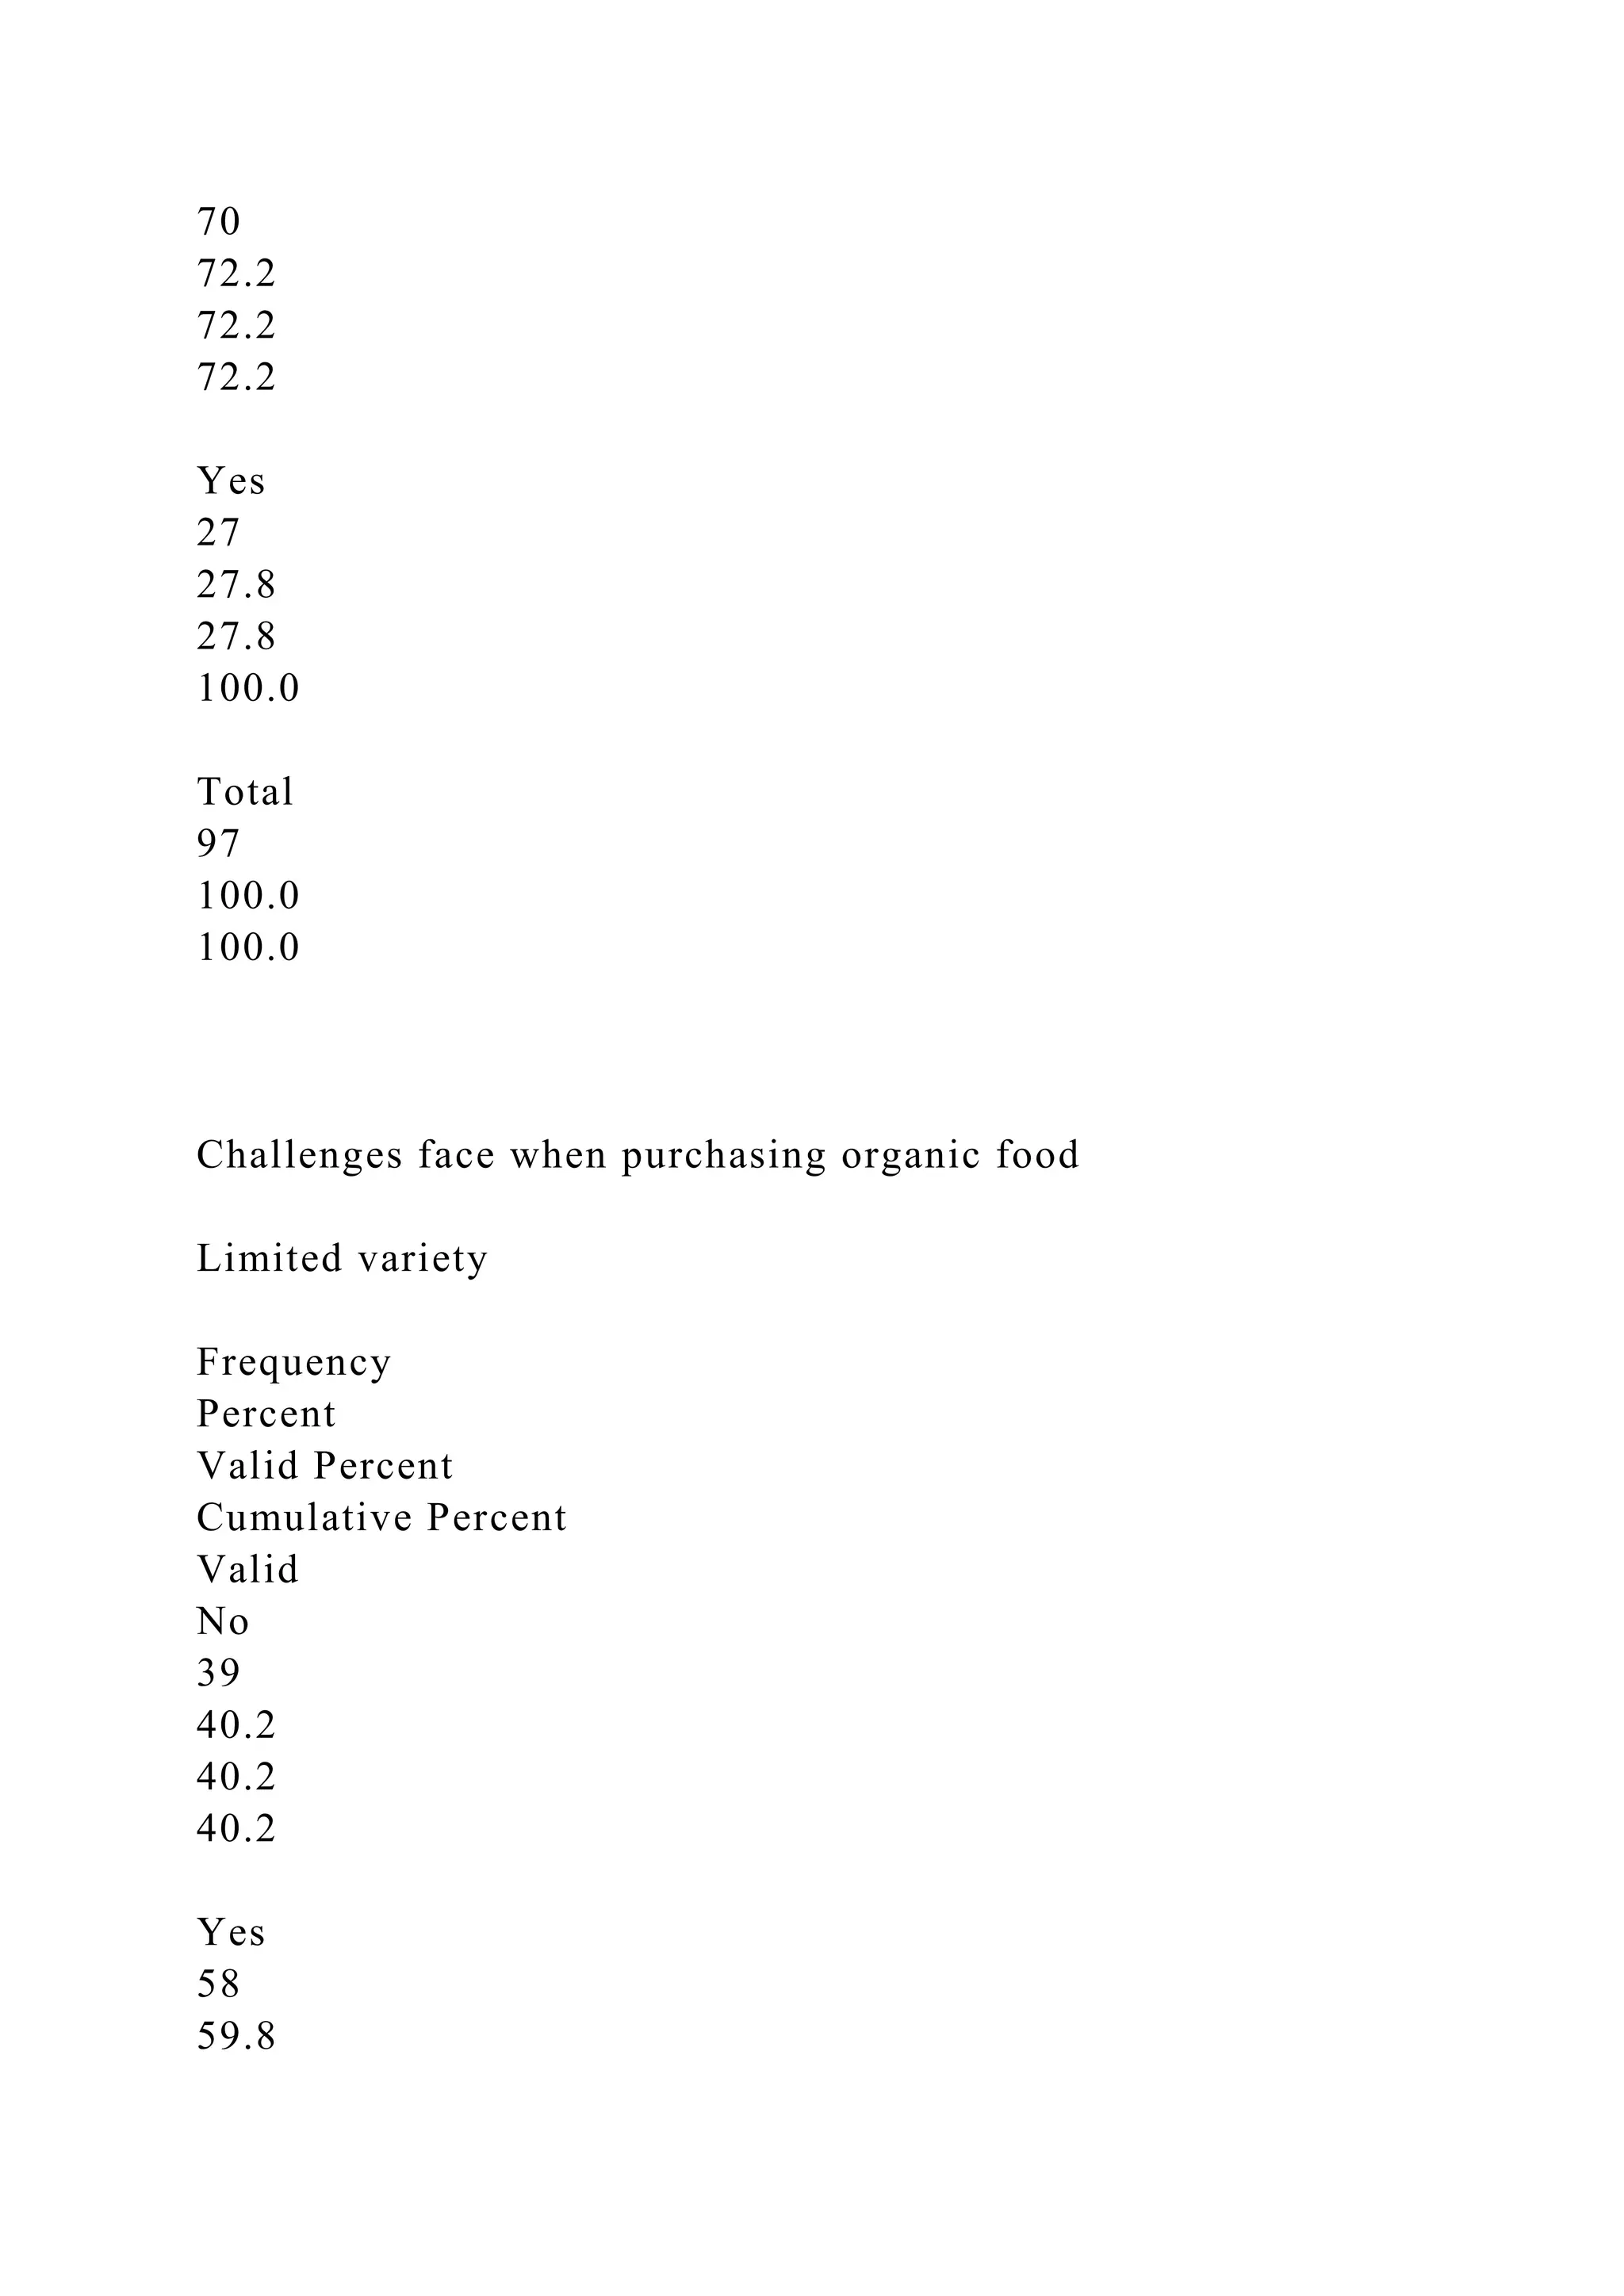
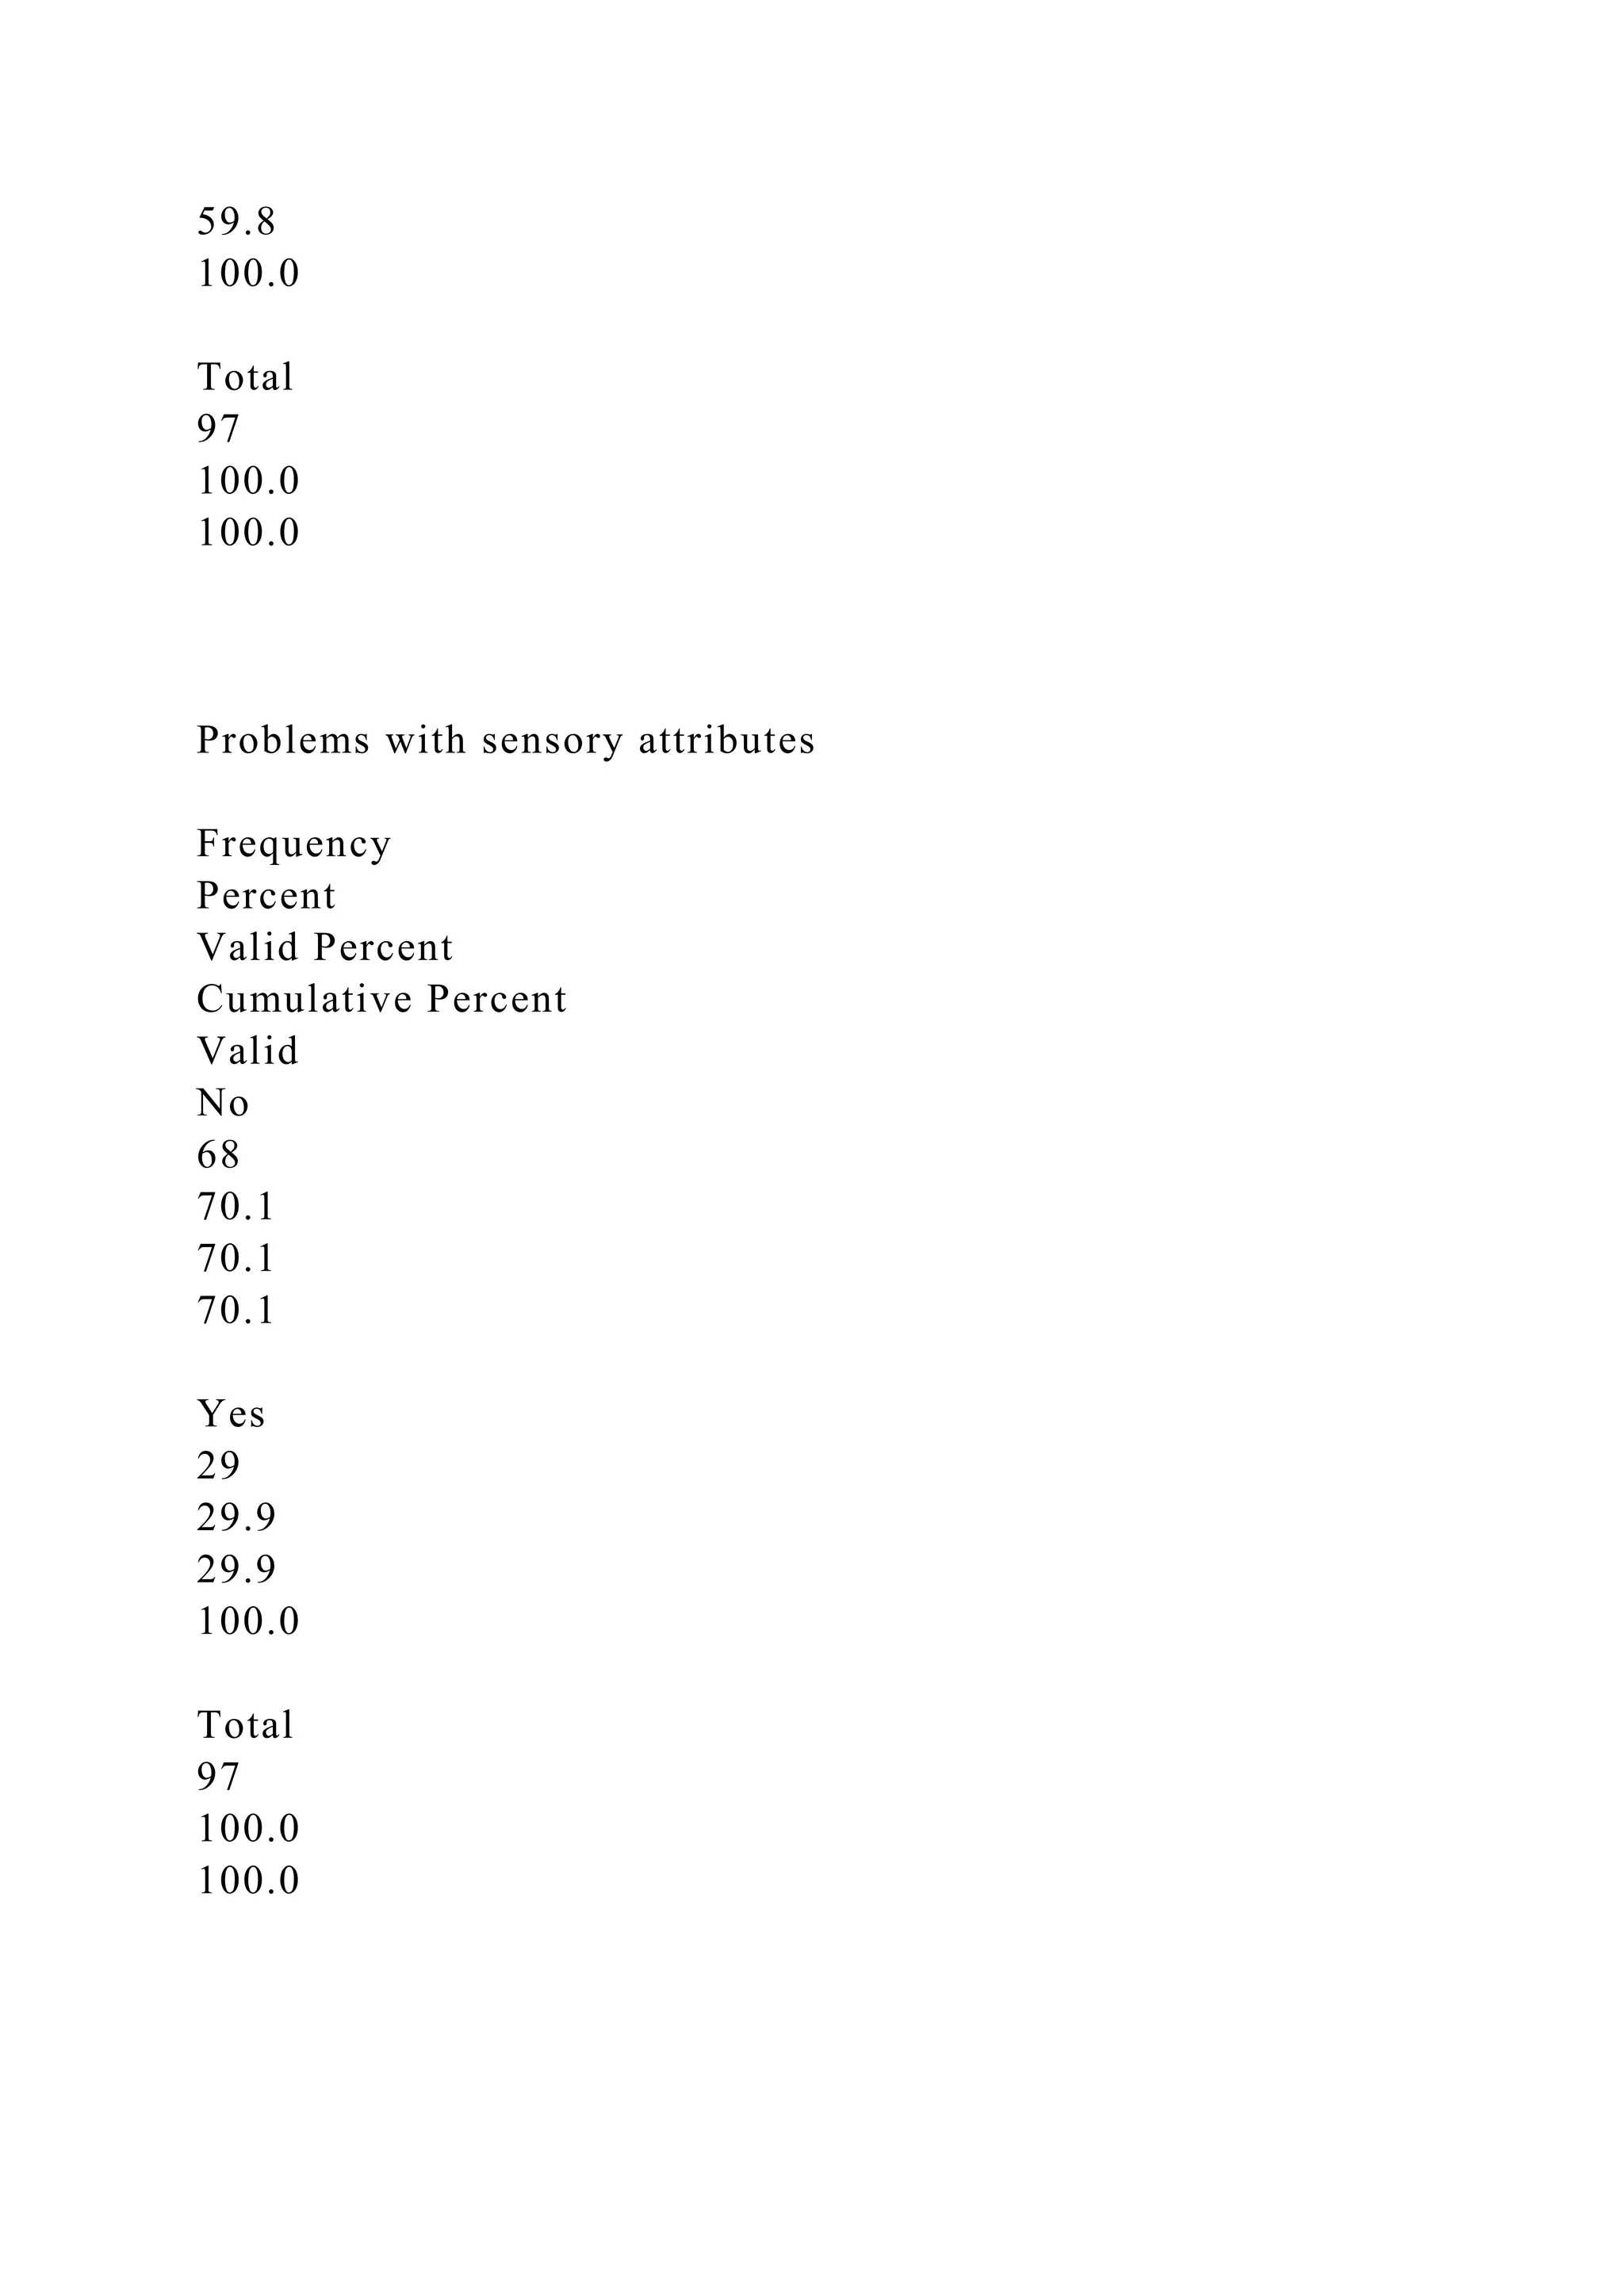
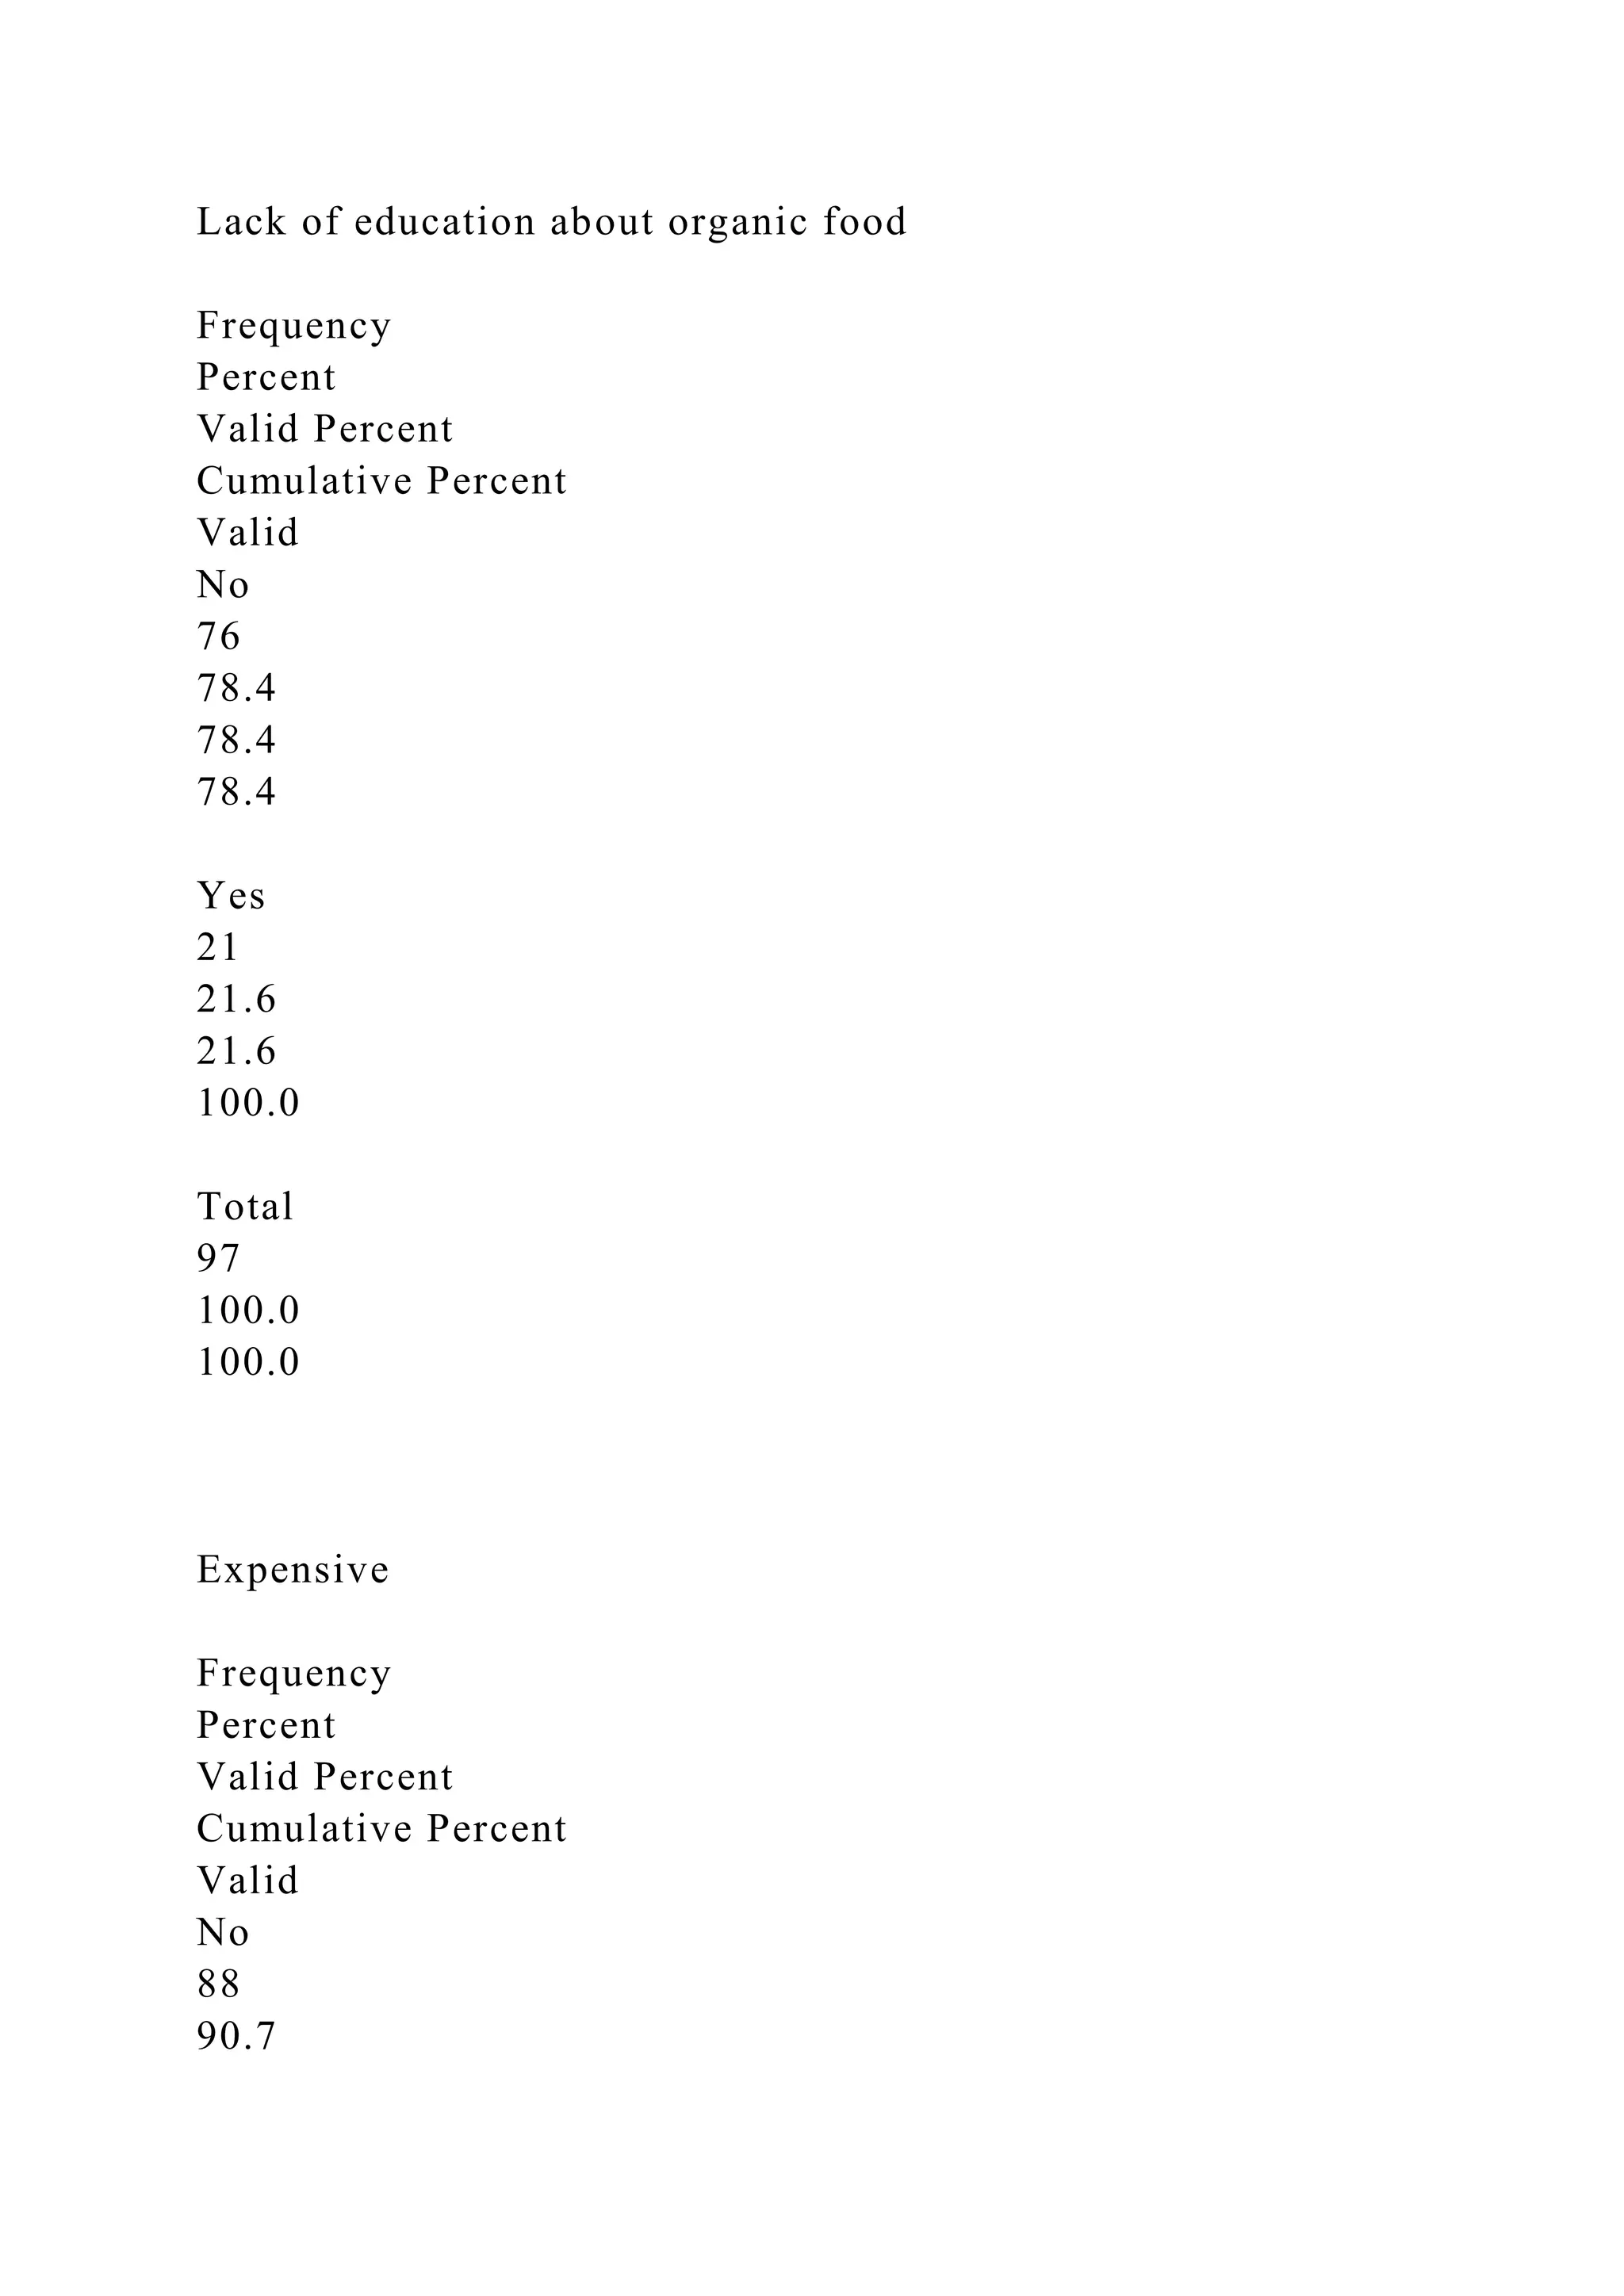
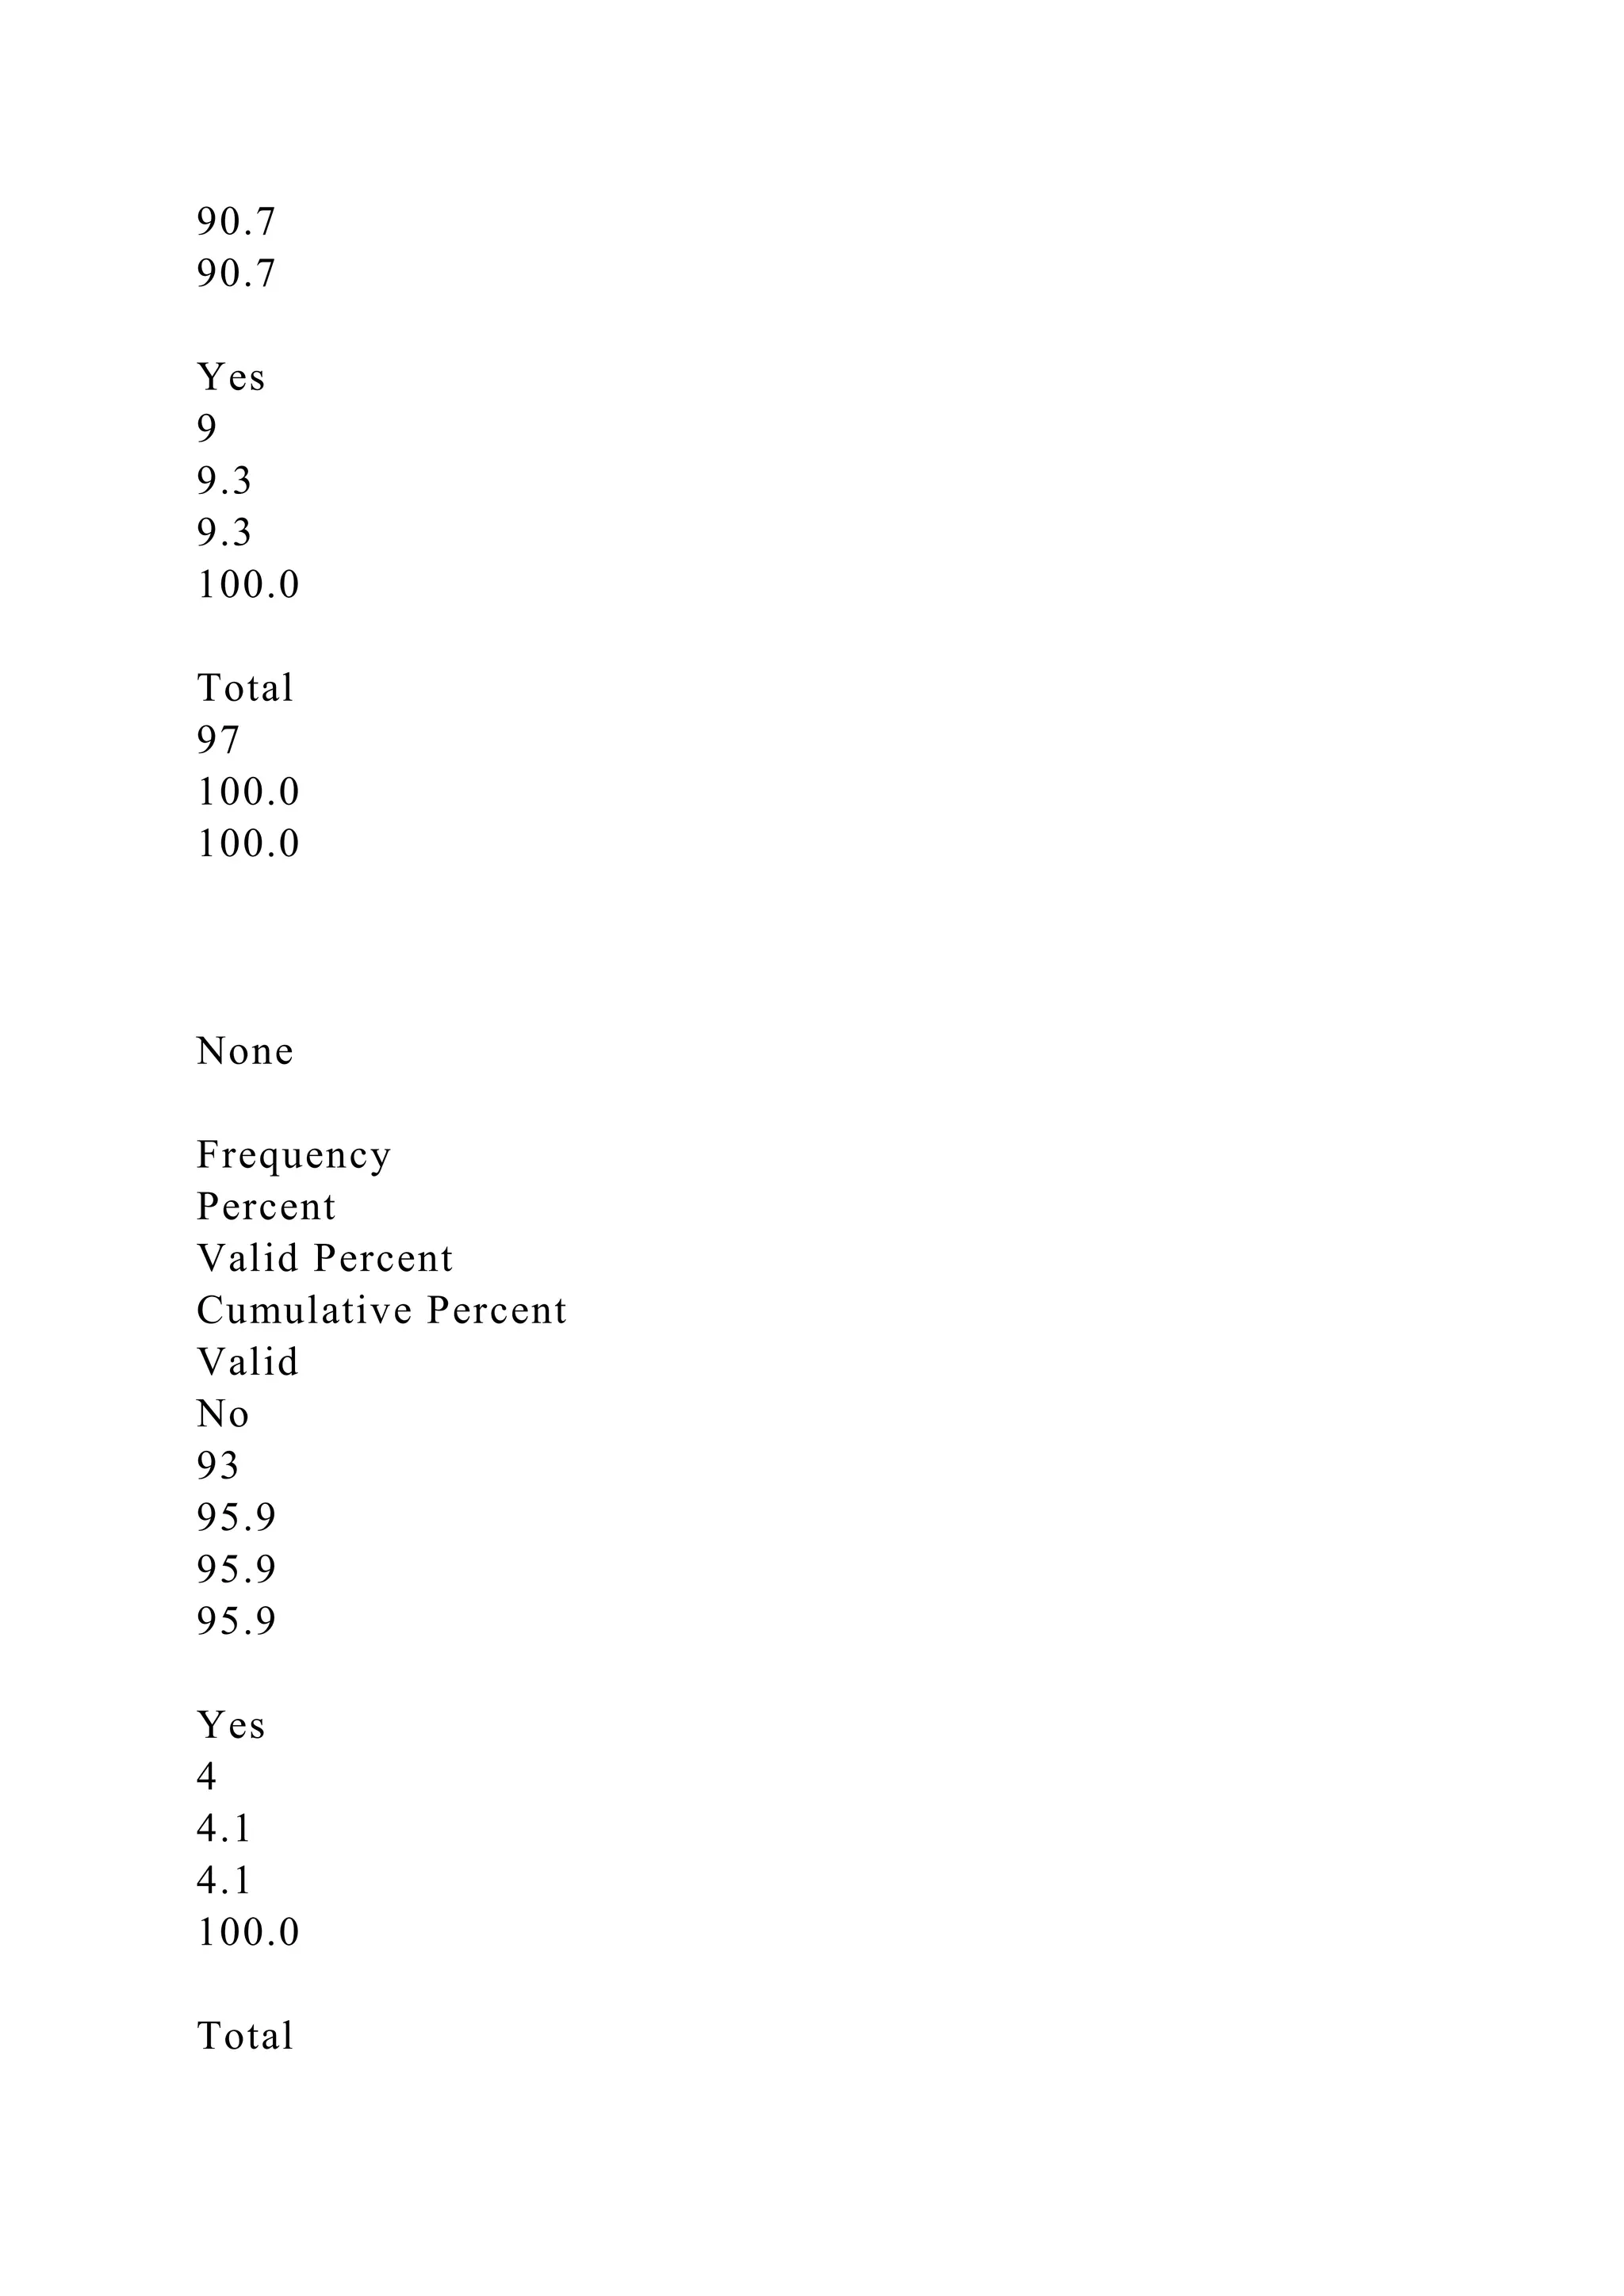
Challenges
Challenges
Limited variety Problems with sensory attributes Lack of
education about organic food Concerns about disease in
organic food Expensive Others (Never face any
challenges) 0.598 0.299 0.216 0.175 0.093
0.041
Consumer knowledge I know a lot I know something I
know nothing 15.0 63.3 2.5](https://image.slidesharecdn.com/submittedinpartfulfilmentoftherequirementsforthedegreeof-230119024927-31555ff9/75/Submitted-in-part-fulfilment-of-the-requirements-for-the-degree-of-docx-150-2048.jpg)
![image3.png
image4.png
image5.png
image6.png
image7.png
image8.png
image9.png
image10.png
image11.png
image12.png
image13.png
image14.png
image15.png
image16.png
image1.png
image2.png
MASTER OF BUSINESS ADMINISTRATION
DISSERTATION PROPOSAL FORM
Name : Amonwan Thongkamkhao
Student ID: 22427988
Contact Details (E-Mail/Telephone No.) : [email protected]
Main DiscipLINE of Dissertation (
Please tick one only as the most appropriate.):
Organizational Behavior
HRM
Financial Decision Making
Business Negotiation](https://image.slidesharecdn.com/submittedinpartfulfilmentoftherequirementsforthedegreeof-230119024927-31555ff9/75/Submitted-in-part-fulfilment-of-the-requirements-for-the-degree-of-docx-151-2048.jpg)