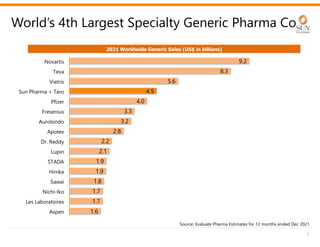
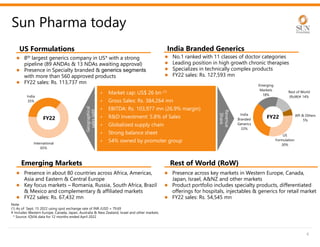
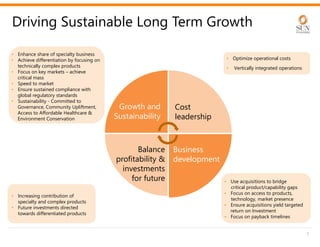
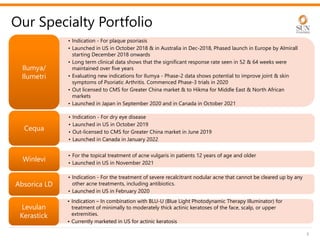
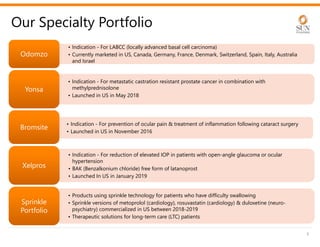
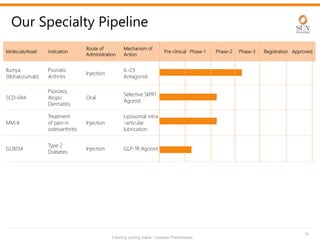
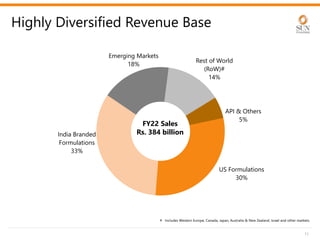
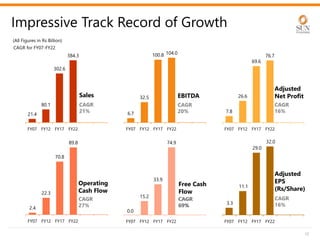
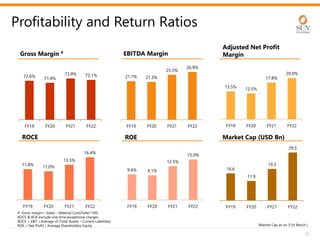
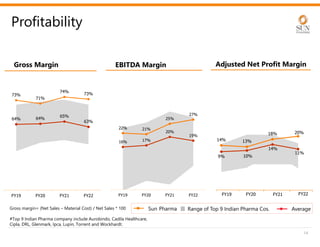
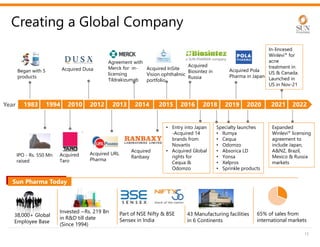
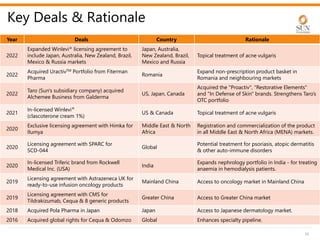
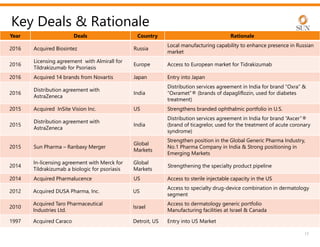
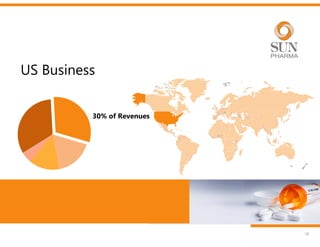
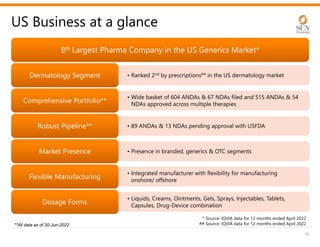
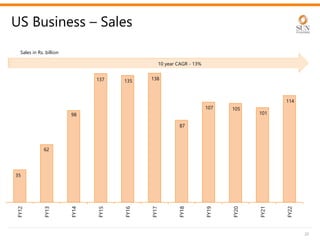
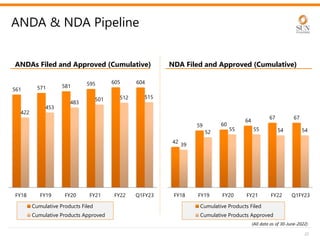
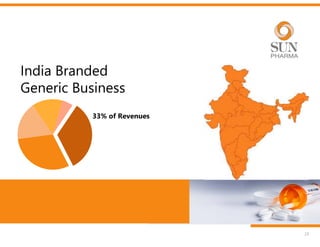
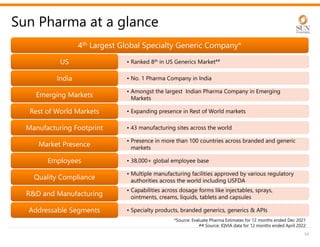
SlideShare a Scribd company logo
Creating Lasting Value
Investor Presentation – September 2022
NSE:SUNPHARMA | BSE:524715 |
Bloomberg:SUNP IN | Reuters:SUN.BO
WWW.SUNPHARMA.COM
Except for the historical information contained herein, statements in this presentation and
the subsequent discussions, which include words or phrases such as “will”, “aim”, “will likely
result”, “would”, “believe”, “may”, “expect”, “will continue”, “anticipate”, “estimate”, “intend”,
“plan”, “contemplate”, “seek to”, “future”, “objective”, “goal”, “likely”, “project”, “should”,
“potential”, “will pursue” and similar expressions or variations of such expressions may
constitute "forward-looking statements". These forward-looking statements involve a
number of risks, uncertainties and other factors that could cause actual results to differ
materially from those suggested by the forward-looking statements. These risks and
uncertainties include, but are not limited to our ability to successfully implement our
strategy, our growth and expansion plans, obtain regulatory approvals, our provisioning
policies, technological changes, investment and business income, cash flow projections, our
exposure to market risks as well as other risks. Sun Pharmaceutical Industries Limited does
not undertake any obligation to update forward-looking statements to reflect events or
circumstances after the date thereof.
Disclaimer
2
Contents
3
Sun Pharma at a glance
1
Long-term Strategy
2
Global Specialty Initiatives
3
Revenue Composition, History & Acquisition Track Record
4
Business Operations, R&D, Manufacturing
5
Corporate Governance
6
Financials – P&L, Balance Sheet, Cash Flows & Ratios
7
Key Milestones Targeted
8
4
Sun Pharma at a glance
4th Largest Global Specialty Generic Company*
• Ranked 8th in US Generics Market##
US
US
• No. 1 Pharma Company in India
India
India
• Amongst the largest Indian Pharma Company in Emerging
Markets
Emerging Markets
Emerging Markets
• Expanding presence in Rest of World markets
Rest of World Markets
• 43 manufacturing sites across the world
Manufacturing Footprint
• Presence in more than 100 countries across branded and generic
markets
Market Presence
Market Presence
• 38,000+ global employee base
Employees
Employees
• Multiple manufacturing facilities approved by various regulatory
authorities across the world including USFDA
Quality Compliance
Quality Compliance
• Capabilities across dosage forms like injectables, sprays,
ointments, creams, liquids, tablets and capsules
R&D and Manufacturing
• Specialty products, branded generics, generics & APIs
Addressable Segments
*Source: Evaluate Pharma Estimates for 12 months ended Dec 2021
## Source: IQVIA data for 12 months ended April 2022
World’s 4th Largest Specialty Generic Pharma Co
1.6
1.7
1.7
1.8
1.9
1.9
2.1
2.2
2.8
3.2
3.3
4.0
4.5
5.6
8.3
9.2
Aspen
Les Laboratoires
Nichi-Iko
Sawai
Himka
STADA
Lupin
Dr. Reddy
Apotex
Aurobindo
Fresenius
Pfizer
Sun Pharma + Taro
Viatris
Teva
Novartis
5
2021 Worldwide Generic Sales (US$ in billions)
Source: Evaluate Pharma Estimates for 12 months ended Dec 2021
US
Formulation
30%
India
Branded
Generics
33%
Emerging
Markets
18%
Rest of World
(RoW)# 14%
API & Others
5%
FY22
India
35%
International
65%
FY22
Rest of World (RoW)
 8th largest generics company in US* with a strong
pipeline (89 ANDAs & 13 NDAs awaiting approval)
 Presence in Specialty branded & generics segments
with more than 560 approved products
 FY22 sales: Rs. 113,737 mn
6
Sun Pharma today
• Market cap: US$ 26 bn (1)
• Gross Sales: Rs. 384,264 mn
• EBITDA: Rs. 103,977 mn (26.9% margin)
• R&D Investment: 5.8% of Sales
• Globalized supply chain
• Strong balance sheet
• 54% owned by promoter group
Note:
(1) As of Sept, 15 2022 using spot exchange rate of INR /USD = 79.69
# Includes Western Europe, Canada, Japan, Australia & New Zealand, Israel and other markets.
* Source: IQVIA data for 12 months ended April 2022
 Presence in about 80 countries across Africa, Americas,
Asia and Eastern & Central Europe
 Key focus markets – Romania, Russia, South Africa, Brazil
& Mexico and complementary & affiliated markets
 FY22 sales: Rs. 67,432 mn
 Presence across key markets in Western Europe, Canada,
Japan, Israel, A&NZ and other markets
 Product portfolio includes specialty products, differentiated
offerings for hospitals, injectables & generics for retail market
 FY22 sales: Rs. 54,545 mn
 No.1 ranked with 11 classes of doctor categories
 Leading position in high growth chronic therapies
 Specializes in technically complex products
 FY22 sales: Rs. 127,593 mn
Geographical
sales
split
Revenue
Share
India Branded Generics
US Formulations
Emerging Markets
• Enhance share of specialty business
• Achieve differentiation by focusing on
technically complex products
• Focus on key markets – achieve
critical mass
• Speed to market
• Ensure sustained compliance with
global regulatory standards
• Sustainability - Committed to
Governance, Community Upliftment,
Access to Affordable Healthcare &
Environment Conservation
• Increasing contribution of
specialty and complex products
• Future investments directed
towards differentiated products
Cost
leadership
Growth and
Sustainability
Driving Sustainable Long Term Growth
7
Business
development
• Optimize operational costs
• Vertically integrated operations
• Use acquisitions to bridge
critical product/capability gaps
• Focus on access to products,
technology, market presence
• Ensure acquisitions yield targeted
return on Investment
• Focus on payback timelines
Balance
profitability &
investments
for future
Our Specialty Portfolio
8
• Indication - For plaque psoriasis
• Launched in US in October 2018 & in Australia in Dec-2018, Phased launch in Europe by Almirall
starting December 2018 onwards
• Long term clinical data shows that the significant response rate seen in 52 & 64 weeks were
maintained over five years
• Evaluating new indications for Ilumya - Phase-2 data shows potential to improve joint & skin
symptoms of Psoriatic Arthritis. Commenced Phase-3 trials in 2020
• Out licensed to CMS for Greater China market & to Hikma for Middle East & North African
markets
• Launched in Japan in September 2020 and in Canada in October 2021
Ilumya/
Ilumetri
Ilumya/
Ilumetri
• Indication - For dry eye disease
• Launched in US in October 2019
• Out-licensed to CMS for Greater China market in June 2019
• Launched in Canada in January 2022
Cequa
Cequa
• For the topical treatment of acne vulgaris in patients 12 years of age and older
• Launched in US in November 2021
Winlevi
Winlevi
• Indication - For the treatment of severe recalcitrant nodular acne that cannot be cleared up by any
other acne treatments, including antibiotics.
• Launched in US in February 2020
Absorica LD
Absorica LD
• Indication – In combination with BLU-U (Blue Light Photodynamic Therapy Illuminator) for
treatment of minimally to moderately thick actinic keratoses of the face, scalp, or upper
extremities.
• Currently marketed in US for actinic keratosis
Levulan
Kerastick
Levulan
Kerastick
Our Specialty Portfolio
9
• Indication - For LABCC (locally advanced basal cell carcinoma)
• Currently marketed in US, Canada, Germany, France, Denmark, Switzerland, Spain, Italy, Australia
and Israel
Odomzo
Odomzo
• Indication - For metastatic castration resistant prostate cancer in combination with
methylprednisolone
• Launched in US in May 2018
Yonsa
Yonsa
• Indication - For prevention of ocular pain & treatment of inflammation following cataract surgery
• Launched in US in November 2016
Bromsite
Bromsite
• Indication - For reduction of elevated IOP in patients with open-angle glaucoma or ocular
hypertension
• BAK (Benzalkonium chloride) free form of latanoprost
• Launched In US in January 2019
Xelpros
Xelpros
• Products using sprinkle technology for patients who have difficulty swallowing
• Sprinkle versions of metoprolol (cardiology), rosuvastatin (cardiology) & duloxetine (neuro-
psychiatry) commercialized in US between 2018-2019
• Therapeutic solutions for long-term care (LTC) patients
Sprinkle
Portfolio
Sprinkle
Portfolio
Creating Lasting Value - Investor Presentation
Our Specialty Pipeline
Molecule/Asset Indication
Route of
Administration
Mechanism of
Action
Pre-clinical Phase-1 Phase-2 Phase-3 Registration Approved
Ilumya
(tildrakizumab)
Psoriatic
Arthritis
Injection
IL-23
Antagonist
SCD-044
Psoriasis,
Atopic
Dermatitis
Oral
Selective SIPR1
Agonist
MM-II
Treatment
of pain in
osteoarthritis
Injection
Liposomal intra
-articular
lubrication
GL0034
Type 2
Diabetes
Injection GLP-1R Agonist
10
11
Highly Diversified Revenue Base
US Formulations
30%
India Branded
Formulations
33%
Emerging Markets
18%
Rest of World
(RoW)#
14%
API & Others
5%
# Includes Western Europe, Canada, Japan, Australia & New Zealand, Israel and other markets.
FY22 Sales
Rs. 384 billion
0.0
15.2
33.9
74.9
FY07 FY12 FY17 FY22
2.4
22.3
70.8
89.8
FY07 FY12 FY17 FY22
21.4
80.1
302.6
384.3
FY07 FY12 FY17 FY22
3.3
11.1
29.0
32.0
FY07 FY12 FY17 FY22
12
Impressive Track Record of Growth
Sales
6.7
32.5
100.8 104.0
FY07 FY12 FY17 FY22
7.8
26.6
69.6
76.7
FY07 FY12 FY17 FY22
CAGR
21%
CAGR
16%
CAGR
20%
CAGR
27%
CAGR
16%
EBITDA
Adjusted
Net Profit
Operating
Cash Flow
Adjusted
EPS
(Rs/Share)
(All Figures in Rs Billion)
Free Cash
Flow
CAGR for FY07-FY22
CAGR
69%
CAGR
69%
16.6
11.9
19.3
29.5
FY19 FY20 FY21 FY22
9.4% 9.1%
12.5%
15.0%
FY19 FY20 FY21 FY22
11.8% 11.0%
13.5%
16.4%
FY19 FY20 FY21 FY22
72.6% 71.4%
73.9% 73.1%
FY19 FY20 FY21 FY22
13
Profitability and Return Ratios
21.7% 21.3%
25.3%
26.9%
FY19 FY20 FY21 FY22
13.5% 12.5%
17.8%
20.0%
FY19 FY20 FY21 FY22
Gross Margin # EBITDA Margin
Adjusted Net Profit
Margin
ROCE ROE Market Cap (USD Bn)
# Gross margin= (Sales - Material Cost)/Sales*100)
ROCE & ROE exclude one-time exceptional charges
ROCE = EBIT / Average of (Total Assets – Current Liabilities)
ROE = Net Profit / Average Shareholders Equity (Market Cap as on 31st March )
22% 21%
25%
27%
16% 17%
20%
19%
FY19 FY20 FY21 FY22
14% 13%
18% 20%
9% 10%
14%
11%
73%
71%
74%
73%
64% 64%
65%
63%
FY19 FY20 FY21 FY22
Gross margin= (Net Sales – Material Cost) / Net Sales * 100
#Top 9 Indian Pharma company include Aurobindo, Cadila Healthcare,
Cipla, DRL, Glenmark, Ipca, Lupin, Torrent and Wockhardt.
Profitability
Sun Pharma Range of Top 9 Indian Pharma Cos. Average
Adjusted Net Profit Margin
EBITDA Margin
FY19 FY20 FY21 FY22
Gross Margin
14
Began with 5
products
Acquired
Taro
Acquired Dusa
Acquired URL
Pharma
Creating a Global Company
15
IPO - Rs. 550 Mn
raised
Acquired
Ranbaxy
38,000+ Global
Employee Base
Sun Pharma Today
Invested ~Rs. 219 Bn
in R&D till date
(Since 1994)
Part of NSE Nifty & BSE
Sensex in India
43 Manufacturing facilities
in 6 Continents
65% of sales from
international markets
Year
Agreement with
Merck for in-
licensing
Tildrakizumab
Acquired InSite
Vision ophthalmic
portfolio
• Entry into Japan
-Acquired 14
brands from
Novartis
• Acquired Global
rights for
Cequa &
Odomzo
Acquired Pola
Pharma in Japan
Acquired
Biosintez in
Russia
Specialty launches
• Ilumya
• Cequa
• Odomzo
• Absorica LD
• Yonsa
• Xelpros
• Sprinkle products
In-lincesed
Winlevi® for
acne
treatment in
US & Canada.
Launched in
US in Nov-21
Expanded
Winlevi® licensing
agreement to
include Japan,
A&NZ, Brazil,
Mexico & Russia
markets
1983 1994 2010 2012 2013 2014 2015 2016 2018 2019 2020 2021 2022
Key Deals & Rationale
16
Year Deals Country Rationale
2022
Expanded Winlevi® licensing agreement to
include Japan, Australia, New Zealand, Brazil,
Mexico & Russia markets
Japan, Australia,
New Zealand, Brazil,
Mexico and Russia
Topical treatment of acne vulgaris
2022
Acquired UractivTM Portfolio from Fiterman
Pharma
Romania
Expand non-prescription product basket in
Romania and neighbouring markets
2022
Taro (Sun's subsidiary company) acquired
Alchemee Business from Galderma
US, Japan, Canada
Acquired the "Proactiv", "Restorative Elements"
and "In Defense of Skin" brands. Strengthens Taro’s
OTC portfolio
2021
In-licensed Winlevi®
(clascoterone cream 1%)
US & Canada Topical treatment of acne vulgaris
2020
Exclusive licensing agreement with Himka for
Ilumya
Middle East & North
Africa
Registration and commercialization of the product
in all Middle East & North Africa (MENA) markets.
2020
Licensing agreement with SPARC for
SCD-044
Global
Potential treatment for psoriasis, atopic dermatitis
& other auto-immune disorders
2020
In-licensed Triferic brand from Rockwell
Medical Inc. (USA)
India
Expands nephrology portfolio in India - for treating
anaemia in hemodialysis patients.
2019
Licensing agreement with Astrazeneca UK for
ready-to-use infusion oncology products
Mainland China Access to oncology market in Mainland China
2019
Licensing agreement with CMS for
Tildrakizumab, Cequa & 8 generic products
Greater China Access to Greater China market
2018 Acquired Pola Pharma in Japan Japan Access to Japanese dermatology market.
2016 Acquired global rights for Cequa & Odomzo Global Enhances specialty pipeline.
Key Deals & Rationale
17
Year Deals Country Rationale
2016 Acquired Biosintez Russia
Local manufacturing capability to enhance presence in Russian
market
2016
Licensing agreement with Almirall for
Tildrakizumab for Psoriasis
Europe Access to European market for Tidrakizumab
2016 Acquired 14 brands from Novartis Japan Entry into Japan
2016
Distribution agreement with
AstraZeneca
India
Distribution services agreement in India for brand “Oxra” &
“Oxramet”® (brands of dapagliflozin, used for diabetes
treatment)
2015 Acquired InSite Vision Inc. US Strengthens branded ophthalmic portfolio in U.S.
2015
Distribution agreement with
AstraZeneca
India
Distribution services agreement in India for brand “Axcer”®
(brand of ticagrelor, used for the treatment of acute coronary
syndrome)
2015 Sun Pharma – Ranbaxy Merger
Global
Markets
Strengthen position in the Global Generic Pharma Industry,
No.1 Pharma Company in India & Strong positioning in
Emerging Markets
2014
In-licensing agreement with Merck for
Tildrakizumab a biologic for psoriasis
Global
Markets
Strengthening the specialty product pipeline
2014 Acquired Pharmalucence US Access to sterile injectable capacity in the US
2012 Acquired DUSA Pharma, Inc. US
Access to specialty drug-device combination in dermatology
segment
2010
Acquired Taro Pharmaceutical
Industries Ltd.
Israel
Access to dermatology generic portfolio
Manufacturing facilities at Israel & Canada
1997 Acquired Caraco Detroit, US Entry into US Market
US Business
18
30% of Revenues
19
US Business at a glance
8th Largest Pharma Company in the US Generics Market*
• Ranked 2nd by prescriptions## in the US dermatology market
Dermatology Segment
Dermatology Segment
• Wide basket of 604 ANDAs & 67 NDAs filed and 515 ANDAs & 54
NDAs approved across multiple therapies
Comprehensive Portfolio**
• 89 ANDAs & 13 NDAs pending approval with USFDA
Robust Pipeline**
Robust Pipeline**
• Presence in branded, generics & OTC segments
Market Presence
Market Presence
• Integrated manufacturer with flexibility for manufacturing
onshore/ offshore
Flexible Manufacturing
• Liquids, Creams, Ointments, Gels, Sprays, Injectables, Tablets,
Capsules, Drug-Device combination
Dosage Forms
Dosage Forms
* Source: IQVIA data for 12 months ended April 2022
## Source: IQVIA data for 12 months ended April 2022
**All data as of 30-Jun-2022
US Business – Sales
20
35
62
98
137 135 138
87
107 105
101
114
FY12
FY13
FY14
FY15
FY16
FY17
FY18
FY19
FY20
FY21
FY22
Sales in Rs. billion
10 year CAGR - 13%
21
Key Milestones in US
• Launched Winlevi® (clascoterone cream 1%) for topical treatment of acne vulgaris
FY22
• Presented long term clinical data for Ilumya & other clinical insights for Odomzo & Levulan
at American Academy of Dermatology Conference
• Presented Pre-clinical data for GL0034 (GLP-1R agonist) at American Diabetes Association
Conference
FY21
• Launched Cequa in US
• Launched Absorica LD in US in Feb-2020
FY20
• Launched Ilumya & Yonsa in US
• Received USFDA approval for Cequa
• Launched Xelpros in US
• Launched Ready-to-Infuse INFUGEMTM
FY19
• Launched Odomzo in US
• US FDA approval for Ilumya
FY18
• Tildrakizumab filing in US & Europe
• Acquired Ocular Technologies giving access to Cequa, a product for dry eyes.
• Acquired Odomzo- branded oncology product from Novartis
FY17
• Acquired DUSA - Entry in branded specialty market
FY13
• Acquired Taro Pharma – Entry into US dermatology market
FY10
• Entry in US through Caraco acquisition
FY98
42
59 60
64
67 67
39
52
55 55 54 54
FY18 FY19 FY20 FY21 FY22 Q1FY23
Cumulative Products Filed
Cumulative Products Approved
ANDA & NDA Pipeline
561 571 581 595 605 604
422
453
483
501 512 515
FY18 FY19 FY20 FY21 FY22 Q1FY23
Cumulative Products Filed
Cumulative Products Approved
22
ANDAs Filed and Approved (Cumulative) NDA Filed and Approved (Cumulative)
(All data as of 30-June-2022)
India Branded
Generic Business
23
33% of Revenues
24
India Business at a glance
No. 1 in India
No. 1 in India
• No. 1 ranked with 8.5% market share
Market Position**
Market Position**
• No. 1 ranked by prescriptions with 11 different classes of doctors
Prescription Ranking##
• Market leader in the chronic segment
Chronic Segment
Chronic Segment
• Strong positioning in the acute segment
Acute Segment
Acute Segment
• Specializes in technically complex products and offers a complete
therapy basket
Product Offering
Product Offering
• 33 brands in the country’s top 300 pharmaceutical brands
Strong Brand Positioning**
• Top 10 Brands contribute approx. 18% of India revenues – low
product concentration
• Growth driven by a basket of brands
De-risked Growth**
De-risked Growth**
• 11,149 strong field force
Sales Strength
Sales Strength
** - As per AIOCD AWACS data for 12 months ended June’22
## - As per SMSRC data for Feb’22
49,570
49,570
53,140
55,010
56,780
58,620
62,030
66,610
80,410
82,210
105,120
144,960
Aristo 2.9%
Dr. Reddy 2.9%
Macleods 3.1%
Intas 3.2%
Torrent 3.3%
Alkem + Cachet + Indchemie 3.4%
Lupin 3.6%
Zydus 3.9%
Mankind 4.7%
Cipla 4.8%
Abbott + Abbott HC + Novo 6.2%
Sun Pharma 8.5%
Largest Pharma Company in India
25
Market Share Formulation Sales in India as of 12 Months ended June 2022 (Rs. mn)
Source: AIOCD AWACS MAT June 2022
Market Share
8.5%
Urology 3%
Cardiology
17%
Neuro-Psychiatry
16%
Gastroenterology
13%
Anti-Infectives
10%
Diabetology
8%
Pain / Analgesics
7%
Dermatology, 6%
Gynaecology, 4%
Vitamins /
Minerals /
Nutrients, 5%
Respiratory 5%
Opthalmology 2%
Others
4%
India Business – Sales ramp-up
26
29 30
37
67
71
77
80
73
97
103
128
FY12
FY13
FY14
FY15
FY16
FY17
FY18
FY19
FY20
FY21
FY22
** As per AIOCD AWACS – June‘22
Sales in Rs. Billion
10 year CAGR -16%
Therapeutic Break-up**
Impact of
Ranbaxy
Acquisition
One-time
impact of
change in
distribution
Creating Lasting Value - Investor Presentation
*Ranks based on prescription share
Source-Strategic Marketing Solutions and Research Centre (SMSRC) Prescription Data
Number 1 Ranking with 11 Doctor Categories*
Leadership in key therapeutic areas*
Prescription Ranking
Specialist Feb ‘18 Feb ’19 Feb ’20 Feb ’21 Feb ’22
Psychiatrists 1 1 1 1 1
Neurologists 1 1 1 1 1
Cardiologists 1 1 1 1 1
Gastroenterologists 1 1 1 1 1
Diabetologists 1 1 1 1 1
Dermatologists 1 1 1 1 1
Urologists 1 1 1 1 1
Consulting Physicians 1 1 1 1 1
Chest Physicians 1 2 2 1 1
ENT 2 2 1 2 1
General surgeons 2 2 2 2 1
Orthopaedic 1 1 1 1 2
Nephrologists 1 1 1 2 2
Ophthalmologists 1 1 2 2 2
27
8.6 8.8
10.0
9.4
11.4
FY18 FY19 FY20 FY21 FY22
No. of Medical Representatives
Sales Per Representative (Rs. Mn)
Best-in-class field force productivity
28
• Well trained and scientifically
oriented sales representatives
team with strong performance
track record
• Field force with highest
productivity amongst key players
in India
• Expanded sales force strength in
FY21 to enhance geographical &
doctor reach and improve brand
focus
Sales Per Medical Representative (Rs. Mn)
Impact of
sales force
expansion
9,291 9,550 9,707 10,963 11,149
Emerging Markets
29
18% of Revenues
30
Emerging Markets Business at a glance
Amongst the leading Indian Companies in Emerging Markets
• Presence in about 80 markets
Global footprint
Global footprint
• Romania, Russia, South Africa, Brazil, Mexico and complementary
& affiliated markets
Focus Markets
Focus Markets
• Extensive basket of branded products
Product Portfolio
Product Portfolio
• Strong relationships with doctors and medical practitioners
Customer Focus
Customer Focus
• Approximately 2,200 Sales Representatives
Sales Force
Sales Force
• Favourable macroeconomic parameters to drive pharmaceutical
consumption in the long-term
Opportunity
Opportunity
• Across 7 countries
Local Manufacturing
Local Manufacturing
Rest of World (Western Europe, Canada,
Japan, ANZ, Israel & Other Markets)
31
14% of Revenues
32
Rest of World Markets at a glance
Amongst the leading Indian Companies
• Across all major markets in Western Europe, Canada, A&NZ,
Japan, Israel and other markets
Market Presence
Market Presence
• Expanding basket of products including specialty brands,
injectable & hospital products as well as products for retail market
Product Portfolio
Product Portfolio
• Development and commercialization of complex generics and
differentiated products to drive sustainable and profitable growth
Focus
Focus
• Distribution led model
• Sales force for Specialty products
Sales Force
Sales Force
• At Canada, Japan, Australia, Israel and Hungary + supplies from
India facilities
Local Manufacturing
Local Manufacturing
• Acquired 14 established prescription brands from Novartis in
March 2016
• Acquired Pola Pharma in Japan in Jan 2019
• Launched Ilumya in Japan in September 2020
Japan Presence
Japan Presence
• Portfolio of generics and specialty products
• Specialty products - Launched Ilumya in October 2021 and Cequa
in January 2022
Canada Presence
Canada Presence
Global Consumer Healthcare Business
33
34
Global Consumer Healthcare Business
at a glance
An Attractive Opportunity
• Amongst the top 10 consumer healthcare companies
India
India
• Presence in about 20+ countries
Global Presence
Global Presence
• Romania, Russia, South Africa, Nigeria, Myanmar, Ukraine, Poland,
Thailand, Belarus, Kazakhstan, Nepal, Morocco, UAE and Oman
Focus Markets
Focus Markets
• Enjoys strong brand equity in 4 countries
Strong Brand Equity
Strong Brand Equity
• Promoted through dedicated sales force in each market
Sales Force
Sales Force
• Amongst top 10 consumer healthcare companies in India,
Romania, Nigeria & Myanmar
Strong Positioning
Strong Positioning
Active Pharmaceutical
Ingredients (API) Business
35
5% of Revenues
API Business
36
Backward Integration – Strategic Importance
• Backward integration provides cost competitiveness and supply
reliability
Strategic Importance
• Large generic and innovator companies
Customers
Customers
• Approximately 370 APIs
Product Portfolio
Product Portfolio
• Approx. 20-30 APIs scaled up annually
Pipeline Development
• 374 DMF/CEP approvals to date
• 488 DMF/CEP Filings to date
Regulatory approvals
• Across 14 facilities
Manufacturing
Manufacturing
Research & Development
37
38
Research & Development
Cumulative R&D Spend of ~Rs. 219 billion to date
• R&D spend at 5.8% of sales for FY22
• Strong cash flows & large scale to support R&D investments
R&D Spend
R&D Spend
• Capabilities in finished dosage development, biological support,
chemistry and new drug development
Capabilities
Capabilities
• Approx. 2,700 headcount globally with R&D capabilities across
dosage forms like orals, liquids, ointments, gels, sprays,
injectables
Organization
Organization
• Strong team of intellectual property experts supporting R&D
IPR Support
IPR Support
• Developing non infringing formulations and development of
specialty/complex products
Focus
Focus
22.5
19.8 19.8
21.5 22.2
FY18 FY19 FY20 FY21 FY22
R&D Investments (Rs Bn) R&D Investments (% of Sales)
Filed Approved
R&D Investments
39
(All data as of 30-June-2022)
5.8%
8.6% 6.9% 6.1% 6.5%
Filed Approved Filed Granted
ANDA DMF/CEP Patents**
R&D Investments Filings and Approvals
604
515
488
374
2,458
1,556
Filed Approved
NDA/BLA
67
54
** Excludes Expired/Abandoned Patents
Global Manufacturing
Presence
40
41
Global Manufacturing Presence
World Class Manufacturing Infrastructure
• 43 manufacturing facilities across India, the Americas, Asia, Africa,
Australia and Europe
Extensive Global Footprint
• Vertically integrated network across six continents enabling high
quality, low cost and a quick market entry across the geographies
Integrated Network
Integrated Network
• One of the few companies that has set up integrated
manufacturing capability for the production of oncology,
hormones, peptides and steroidal drugs
Capabilities
Capabilities
• High quality manufacturing facilities. Many facilities approved by
US FDA, UK MHRA, EMEA and other international regulatory
authorities
High Quality
High Quality
• Ability to manufacture a variety of dosage forms – Orals, Creams,
Ointments, Injectables, Sprays, Liquids
Dosage Forms
Dosage Forms
• Formulation
• India : 15, US : 3
• Canada, Japan, Hungary, Israel, Bangladesh, South Africa, Malaysia, Romania, Egypt,
Nigeria and Russia : 1 each
• Capacities available for a variety of finished dosages
• API
• India : 9, Australia : 2, Israel : 1, US : 1, Hungary : 1
42
Manufacturing Facilities
43 manufacturing sites
 Tablets / Capsules
 Semisolids
 Liquids
 Suppository
 Vials
 Ampoules
 Pre-filled Syringes
 Gels
 Lyophilized Units
 Dry powder
 Eye drops
 MDI
 Aerosols
 Creams
 Ointments
Injectables / Sterile
Orals Topicals
43
Corporate Governance
Our philosophy on corporate governance envisages
working towards high levels of transparency,
accountability and consistent value systems across
all facets of operations
Chairman
Israel Makov
Former President & CEO of Teva
Pharmaceutical Ind. Ltd.
(Retired from board of Sun Pharma
w.e.f. 29-Aug-2022)
Gautam B. Doshi
Independent Director
Professional with expertise
in M&A, Taxation,
Accounting & Corp. and
Commercial Laws.
Lead Independent Director Independent Director
Dr. Pawan Goenka
Former MD & CEO of
Mahindra & Mahindra
Ltd.
Rama Bijapurkar
Independent management
consultant & Professor of
Management Practice at IIM,
Ahmedabad
Financials
44
Financials
Market Capitalisation Rs. 2,098 billion / US$ 26 billion (as of 15th Sept 2022)
FY18 YoY FY19 YoY FY20 YoY FY21 YoY FY22 YoY
P&L Summary
Sales 260,659 -14% 286,863 10% 323,252 13% 332,331 3% 384,264 16%
Gross Profit 186,413 -16% 208,173 12% 230,947 11% 245,430 6% 280,749 14%
EBITDA 56,081 -36% 63,076 12% 69,898 11% 84,914 21% 103,977 22%
Net Profit 20,957 -70% 26,654 27% 37,649 41% 29,038 -23% 32,727 13%
Net Profit (Adjusted) 33,006 -53% 38,798 18% 40,256 4% 59,317 47% 76,671 29%
R&D Spend 22,489 -3% 19,847 -12% 19,739 -1% 21,499 9% 22,194 3%
BS Summary Mar'18 YoY Mar'19 YoY Mar'20 YoY Mar'21 YoY Mar'22 YoY
Shareholders Funds 383,141 5% 414,091 8% 452,645 9% 464,628 3% 480,112 3%
Loan Funds 97,518 21% 98,934 1% 75,783 -23% 35,235 -54% 9,307 -74%
Net Fixed Assets 157,110 5% 172,919 10% 175,858 2% 168,322 -4% 171,971 2%
Investments 71,430 499% 79,030 11% 101,431 28% 96,125 -5% 128,486 34%
Cash and Bank Balances 99,290 -34% 72,760 -27% 64,876 -11% 64,455 -1% 50,334 -22%
Inventory 68,810 1% 78,860 15% 78,750 0% 89,970 14% 89,968 0%
Sundry Debtors 78,150 9% 88,840 14% 94,212 6% 90,614 -4% 105,929 17%
Sundry Creditors 47,660 8% 41,480 -13% 35,836 -14% 39,737 11% 44,793 13%
45
# FY18 - Adjusted for Rs. 12.1 bn provision related to Modafinil settlement & deferred tax adjustment
# FY19 - Adjusted for Rs. 12 bn provision related to Modafinil settlement
**FY19 - Includes a one-time sales reduction of Rs. 10,850mn related to change in distribution for India business
# FY20 - Adjusted for Rs. 2.6 bn provision (related to Dusa US DoJ settlement of Rs. 1.6 bn and Indirect Tax provision of Rs. 1.0 bn in India)
# FY21 - Adjusted for Rs. 30.3 bn provision (related to Taro US – DOJ & MDL settlement Rs. 42.2 bn, Rs. 0.9 bn provision related to UK Citalopram case, Rs. 4.1 bn related to deferred tax gain. Taro
provisions are adjusted for minority interest)
# FY22 - Adjusted for Rs. 43.9 bn provision (for US litigation related to Ranbaxy Meijer & Others Rs. 39,357 mn, Japan (plant) loss Rs. 382 mn, Dexasite impairment Rs. 1,503 mn., US MDL (Taro) Rs.
3,465 mn (after adjusting for Taro minority of Rs 960 mn) & Deferred Tax gain = Rs. 5,178 mn offset by MAT Credit reversal of Rs.4,410 mn).
# #
( All Figures in Rs. Mn )
#
#
**
#
46
Sales Break-up
80 73
97 103
128
87 107
105 101
114
48
54
55 58
67
30
35
45 49
55
15
18
20
21
21
FY18 FY19 FY20 FY21 FY22
India Formulations US Formulations Emerging Markets Rest of World API+Others
384
Sales
In Rs Billion
332
323
287
261
47
EBITDA Trend
21.2% 21.7% 21.3% 25.3% 26.9%
31.0% 30.8% 31.8%
28.5% 28.0%
20.6% 20.8% 19.7% 20.6% 19.0%
28.5% 27.4% 28.6% 26.1% 26.9%
FY18 FY19 FY20 FY21 FY22
EBITDA Other Expenditure Personnel Costs Material Costs
% of Sales
261 287 323 332 384
Sales
In Rs Billion
Net Cash (Excluding Debt) (Rs. Bn)
Net Cash From Operating Activities (Rs. Bn)
48
Cash Flow & Debt
39.1
22.0
65.5 61.7
89.8
FY18 FY19 FY20 FY21 FY22
19.5
-10.2
50.1 50.0
74.9
FY18 FY19 FY20 FY21 FY22
Free Cash Flow (Rs. Bn)
103.6 104.8
82.2
35.2
9.3
FY18 FY19 FY20 FY21 FY22
Gross Debt (Rs. Bn)
45.0
34.7
69.5
103.0
149.2
FY18 FY19 FY20 FY21 FY22
Growth (%)
Sales (13.9) 10.1 12.7 2.8 15.6
Gross Profit (15.8) 11.7 10.9 6.3 14.4
EBITDA (44.4) 12.5 10.8 21.5 22.5
Net Profit (69.9) 27.2 41.3 (22.9) 12.7
Net Profit (Adjusted) (52.6) 17.5 3.8 47.4 29.3
Margins (%)
Gross Margin 71.5 72.6 71.4 73.9 73.1
EBITDA Margin (%) 21.2 21.7 21.3 25.3 26.9
Net Margin 8.0 9.3 11.6 8.7 8.5
Net Margin (Adjusted) 12.7 13.5 12.5 17.8 20.0
Return (%)
ROCE 11.1 11.8 11.0 13.5 16.4
ROE 8.7 9.4 9.1 12.5 15.0
Others
Debt / Equity 0.25 0.24 0.17 0.08 0.02
Fully Diluted EPS 8.7 11.1 15.7 12.1 13.6
Fully Diluted EPS (Adjusted) 13.8 16.2 16.8 24.7 32.0
R&D Spend % of Net Sales 8.6 6.9 6.1 6.5 5.8
Revenue 7.9 6.6 6.0 6.4 5.6
Capital 0.7 0.3 0.1 0.1 0.2
49
Financial Ratios
#
#
# # #
# #
# #
#
#
#
**
# FY18 - Adjusted for Rs. 12.1 bn provision related to Modafinil settlement & deferred tax adjustment
# FY19 - Adjusted for Rs. 12 bn provision related to Modafinil settlement
**FY19 - Includes a one-time sales reduction of Rs. 10,850mn related to change in distribution for India business
# FY20 - Adjusted for Rs. 2.6 bn provision (related to Dusa US DoJ settlement of Rs. 1.6 bn and Indirect Tax provision of Rs. 1.0 bn in India)
# FY21 - Adjusted for Rs. 30.3 bn provision (related to Taro US – DOJ & MDL settlement Rs. 42.2, Rs. 0.9 bn provision related to UK Citalopram case, Rs. 4.1 bn related to deferred tax gain. Taro
provisions are adjusted for minority interest)
# FY22 - Adjusted for Rs. 43.9 bn provision (for US litigation related to Ranbaxy Meijer & Others Rs. 39,357 mn, Japan (plant) loss Rs. 382 mn, Dexasite impairment Rs. 1,503 mn., US MDL (Taro) Rs.
3,465 mn (after adjusting for Taro minority of Rs 960 mn) & Deferred Tax gain = Rs. 5,178 mn offset by MAT Credit reversal of Rs.4,410 mn)
#
#
#
Q1 FY23 Q1 FY22 CHANGE FY22 FY21 CHANGE
Gross Sales 106,440 96,694 10.1% 384,264 332,331 15.6%
Gross Profit 77,438 70,200 10.3% 280,749 245,430 14.4%
Gross Margin 72.8% 72.6% 73.1% 73.9%
EBITDA 28,844 28,211 2.2% 103,977 84,914 22.5%
EBITDA Margin 26.8% 29.0% 26.9% 25.3%
Net Profit 20,609 14,442 42.7% 32,727 29,038 12.7%
Net margin 19.4% 14.9% 8.5% 8.7%
Net Profit (Adjusted) 20,609 19,792 4.1% 76,671 59,317 29.3%
Net margin (Adjusted) 19.4% 20.5% 20.0% 17.8%
R&D 4,608 5,926 -22.2% 22,194 21,499 3.2%
R&D as % of Net Sales 4.3% 6.1% 5.8% 6.5%
EPS (Diluted) INR 8.6 6.0 42.7% 13.6 12.1 12.7%
EPS (Diluted) INR (Adjusted) 8.6 8.2 4.1% 32.0 24.7 29.3%
50
Key Financials Q1 FY23
( All Figures in Rs. Mn )
# Q1FY22- Adjusted for Rs. 5.3 bn provision (related to (i) US MDL (Taro) =Rs. 4,425 mn (ii) Japan (plant)=Rs. 382 mn (iii) Dexasite impairment=Rs. 1,503 mn. (after
adjusting for Taro minority of Rs 960 mn)
# FY21 - Adjusted for Rs. 30.3 bn provision (related to Taro US – DOJ & MDL settlement Rs. 42.2, Rs. 0.9 bn provision related to UK Citalopram case, Rs. 4.1 bn related
to deferred tax gain. Taro provisions are adjusted for minority interest)
# FY22 - Adjusted for Rs. 43.9 bn provision (for US litigation related to Ranbaxy Meijer & Others Rs. 39,357 mn, Japan (plant) loss Rs. 382 mn, Dexasite impairment Rs.
1,503 mn., US MDL (Taro) Rs. 3,465 mn (after adjusting for Taro minority of Rs 960 mn) & Deferred Tax gain = Rs. 5,178 mn offset by MAT Credit reversal of Rs.4,410
mn)
#
#
#
#
#
#
Q1 FY23 Q1 FY22 CHANGE FY22 FY21 CHANGE
Formulation
India 33,871 33,084 2.4% 127,593 103,432 23.4%
US 32,437 28,000 15.8% 113,737 100,921 12.7%
Emerging Markets 18,911 16,053 17.8% 67,432 57,840 16.6%
ROW 14,678 13,680 7.3% 54,545 48,956 11.4%
Sub-total 99,897 90,816 10.0% 363,306 311,149 16.8%
ÀPI 5,987 5,149 16.3% 18,354 19,504 -5.9%
Others 556 729 -23.8% 2,604 1,679 55.1%
Gross Sales 106,440 96,694 10.1% 384,264 332,331 15.6%
30%
32% 18%
14%
6%
51
Sales Breakup Q1FY23
( All Figures in Rs. Mn )
US Formulations
India Branded Generics
Emerging Markets
Rest of World
API & Others
29%
34% 17%
14%
6%
Q1
FY23
Q1
FY22
# ROW includes Western Europe, Canada, Japan, Australia, New Zealand, Israel and other markets
#
Key Milestones targeted for future
52
• Enhance share of specialty/branded business
• Continue to focus on complex generics and high entry barrier segments
• Ensure broad product offering to customers across multiple dosage forms
US Business
US Business
• Focus on productivity enhancement
• Maintain leadership position in a fiercely competitive market
• Continuously innovate to ensure high brand equity with doctors
• Continue to evaluate in-licensing opportunities for latest generation patented products
India
Business
India
Business
• Gain critical mass in key markets
• Enhance product basket in emerging markets
• Focus on profitable growth
EM & RoW
Business
EM & RoW
Business
• Maintain leadership in existing markets through focus on innovative solutions
• Enhance presence in high growth markets
Global
Consumer
Healthcare
Global
Consumer
Healthcare
Key Milestones targeted for future
53
• Unwavering focus on Sustainability, built on a legacy rooted in caring for people,
communities and the planet.
• Committed to Governance, Community Upliftment, Access to Affordable Healthcare
& Environment Conservation
Sustainability
Sustainability
• Focus on developing complex products across multiple dosage forms
• Invest to further build the specialty pipeline
R&D
R&D
• Ensuring 24x7 compliance to cGMP
• Continuously enhance systems, processes, human capabilities to ensure compliance
with global regulatory standards
Regulatory/
Quality
Regulatory/
Quality
• Target high-single digit to low double-digit consolidated topline growth for FY23
• Focus on sustainable and profitable growth
• Focus on improving overall return ratios
Financial
Financial
54
Sun Pharma at a glance
4th Largest Global Specialty Generic Company*
• Ranked 8th in US Generics Market##
US
US
• No. 1 Pharma Company in India
India
India
• Amongst the largest Indian Pharma Company in Emerging
Markets
Emerging Markets
Emerging Markets
• Expanding presence in Rest of World markets
Rest of World Markets
• 43 manufacturing sites across the world
Manufacturing Footprint
• Presence in more than 100 countries across branded and generic
markets
Market Presence
Market Presence
• 38,000+ global employee base
Employees
Employees
• Multiple manufacturing facilities approved by various regulatory
authorities across the world including USFDA
Quality Compliance
Quality Compliance
• Capabilities across dosage forms like injectables, sprays,
ointments, creams, liquids, tablets and capsules
R&D and Manufacturing
• Specialty products, branded generics, generics & APIs
Addressable Segments
*Source: Evaluate Pharma Estimates for 12 months ended Dec 2021
## Source: IQVIA data for 12 months ended April 2022
Thank You
Investors:
Nimish Desai
Tel : +91 22 4324 4324, Ext 2778
Tel Direct +91 22 4324 2778
nimish.desai@sunpharma.com
Thank You!
For more information please contact:
55
© 2017 Sun Pharmaceutical Industries Limited., All Rights Reserved.
“SUN Pharma”, The Sun Pharmaceutical Industries Logo are trademarks of Sun Pharmaceutical Industries Limited.
This material was used during an oral presentation; it is not a complete record of the discussion. This work may
not be used, sold, transferred, adapted, abridged, copied or reproduced in whole on or in part in any manner or
form or in any media without the prior written consent. All product names and company names and logos
mentioned herein are the trademarks or registered trademarks of their respective owners.
Corporate Address:
SUN HOUSE, CTS No. 201 B/1, Western Express Highway, Goregaon (E), Mumbai 400063
NSE:SUNPHARMA, BSE: 524715, Reuters: SUN.BO, Bloomberg: SUNP IN
CIN: L24230GJ1993PLC019050
www.sunpharma.com

More Related Content

Similar to SPIL-IR-Presentation-September-2022-INR.pdf

Intelgenx presentation november 2017 final
Intelgenx presentation november 2017 finalIntelgenx presentation november 2017 final
Intelgenx presentation november 2017 final
ItelGenx
 
Snwv corporate investor presentation - june 2014 - final
Snwv   corporate investor presentation - june 2014 - finalSnwv   corporate investor presentation - june 2014 - final
Snwv corporate investor presentation - june 2014 - final
RedChip Companies, Inc.
 
2022-04-novartis-new-organizational-model-presentation.pdf
2022-04-novartis-new-organizational-model-presentation.pdf2022-04-novartis-new-organizational-model-presentation.pdf
2022-04-novartis-new-organizational-model-presentation.pdf
MOHAMMED YASER HUSSAIN
 
Igxt feb 1, 2017 investor presentation
Igxt feb 1, 2017 investor presentationIgxt feb 1, 2017 investor presentation
Igxt feb 1, 2017 investor presentation
ItelGenx
 
Biocon Press Conference FY13 Results - April 26, 2013
Biocon Press Conference FY13 Results - April 26, 2013 Biocon Press Conference FY13 Results - April 26, 2013
Biocon Press Conference FY13 Results - April 26, 2013
Biocon
 
Nemaura Medical Presentation July 2020
Nemaura Medical Presentation July 2020Nemaura Medical Presentation July 2020
Nemaura Medical Presentation July 2020
RedChip Companies, Inc.
 
IGXT Jan 20 2017 Investor Presentation
IGXT Jan 20 2017 Investor PresentationIGXT Jan 20 2017 Investor Presentation
IGXT Jan 20 2017 Investor Presentation
ItelGenx
 
Intelgenx presentation september 2017 final
Intelgenx presentation september 2017 finalIntelgenx presentation september 2017 final
Intelgenx presentation september 2017 final
ItelGenx
 
Asia-Pacific Probiotic Supplements Market Research Report: Forecast (2023-2028)
Asia-Pacific Probiotic Supplements Market Research Report: Forecast (2023-2028)Asia-Pacific Probiotic Supplements Market Research Report: Forecast (2023-2028)
Asia-Pacific Probiotic Supplements Market Research Report: Forecast (2023-2028)
sonukumar765969
 
Asia-Pacific Probiotic Supplements Market Research Report: Forecast (2023-2028)
Asia-Pacific Probiotic Supplements Market Research Report: Forecast (2023-2028)Asia-Pacific Probiotic Supplements Market Research Report: Forecast (2023-2028)
Asia-Pacific Probiotic Supplements Market Research Report: Forecast (2023-2028)
sonukumar765969
 
DuPont Presents at Jefferies 10th Annual Global Industrials Conference
DuPont Presents at Jefferies 10th Annual Global Industrials ConferenceDuPont Presents at Jefferies 10th Annual Global Industrials Conference
DuPont Presents at Jefferies 10th Annual Global Industrials Conference
DupontInv
 
Caustic Potash Market: Industry Overview, Growth, Trends, Opportunities and F...
Caustic Potash Market: Industry Overview, Growth, Trends, Opportunities and F...Caustic Potash Market: Industry Overview, Growth, Trends, Opportunities and F...
Caustic Potash Market: Industry Overview, Growth, Trends, Opportunities and F...
IMARC Group
 
Wearable Injectors Market
Wearable Injectors MarketWearable Injectors Market
Wearable Injectors Market
RenukaAvasti
 
Nasal Polyps Market 2023: Epidemiology, Industry Trends, Size, Share And Fore...
Nasal Polyps Market 2023: Epidemiology, Industry Trends, Size, Share And Fore...Nasal Polyps Market 2023: Epidemiology, Industry Trends, Size, Share And Fore...
Nasal Polyps Market 2023: Epidemiology, Industry Trends, Size, Share And Fore...
frankmorgan27
 
Sanofi Q4 and full year 2022 results
Sanofi Q4 and full year 2022 resultsSanofi Q4 and full year 2022 results
Sanofi Q4 and full year 2022 results
Sanofi
 
Sunpharma present13
Sunpharma present13Sunpharma present13
Sunpharma present13
Company Spotlight
 
Asia pacific wound care market global trends, market share, industry size, gr...
Asia pacific wound care market global trends, market share, industry size, gr...Asia pacific wound care market global trends, market share, industry size, gr...
Asia pacific wound care market global trends, market share, industry size, gr...
Shubham Bhosale
 
Public Device & Biopharma Ophthalmology Company Showcase - pSivida
Public Device & Biopharma Ophthalmology Company Showcase - pSividaPublic Device & Biopharma Ophthalmology Company Showcase - pSivida
Public Device & Biopharma Ophthalmology Company Showcase - pSivida
Healthegy
 
Wearable Injectors Market
Wearable Injectors MarketWearable Injectors Market
Wearable Injectors Market
RenukaAvasti
 
Acne Treatment Gel Manufacturing Process, Machinery Requirements and Project ...
Acne Treatment Gel Manufacturing Process, Machinery Requirements and Project ...Acne Treatment Gel Manufacturing Process, Machinery Requirements and Project ...
Acne Treatment Gel Manufacturing Process, Machinery Requirements and Project ...
IMARC Group
 

Similar to SPIL-IR-Presentation-September-2022-INR.pdf (20)

Intelgenx presentation november 2017 final
Intelgenx presentation november 2017 finalIntelgenx presentation november 2017 final
Intelgenx presentation november 2017 final
 
Snwv corporate investor presentation - june 2014 - final
Snwv   corporate investor presentation - june 2014 - finalSnwv   corporate investor presentation - june 2014 - final
Snwv corporate investor presentation - june 2014 - final
 
2022-04-novartis-new-organizational-model-presentation.pdf
2022-04-novartis-new-organizational-model-presentation.pdf2022-04-novartis-new-organizational-model-presentation.pdf
2022-04-novartis-new-organizational-model-presentation.pdf
 
Igxt feb 1, 2017 investor presentation
Igxt feb 1, 2017 investor presentationIgxt feb 1, 2017 investor presentation
Igxt feb 1, 2017 investor presentation
 
Biocon Press Conference FY13 Results - April 26, 2013
Biocon Press Conference FY13 Results - April 26, 2013 Biocon Press Conference FY13 Results - April 26, 2013
Biocon Press Conference FY13 Results - April 26, 2013
 
Nemaura Medical Presentation July 2020
Nemaura Medical Presentation July 2020Nemaura Medical Presentation July 2020
Nemaura Medical Presentation July 2020
 
IGXT Jan 20 2017 Investor Presentation
IGXT Jan 20 2017 Investor PresentationIGXT Jan 20 2017 Investor Presentation
IGXT Jan 20 2017 Investor Presentation
 
Intelgenx presentation september 2017 final
Intelgenx presentation september 2017 finalIntelgenx presentation september 2017 final
Intelgenx presentation september 2017 final
 
Asia-Pacific Probiotic Supplements Market Research Report: Forecast (2023-2028)
Asia-Pacific Probiotic Supplements Market Research Report: Forecast (2023-2028)Asia-Pacific Probiotic Supplements Market Research Report: Forecast (2023-2028)
Asia-Pacific Probiotic Supplements Market Research Report: Forecast (2023-2028)
 
Asia-Pacific Probiotic Supplements Market Research Report: Forecast (2023-2028)
Asia-Pacific Probiotic Supplements Market Research Report: Forecast (2023-2028)Asia-Pacific Probiotic Supplements Market Research Report: Forecast (2023-2028)
Asia-Pacific Probiotic Supplements Market Research Report: Forecast (2023-2028)
 
DuPont Presents at Jefferies 10th Annual Global Industrials Conference
DuPont Presents at Jefferies 10th Annual Global Industrials ConferenceDuPont Presents at Jefferies 10th Annual Global Industrials Conference
DuPont Presents at Jefferies 10th Annual Global Industrials Conference
 
Caustic Potash Market: Industry Overview, Growth, Trends, Opportunities and F...
Caustic Potash Market: Industry Overview, Growth, Trends, Opportunities and F...Caustic Potash Market: Industry Overview, Growth, Trends, Opportunities and F...
Caustic Potash Market: Industry Overview, Growth, Trends, Opportunities and F...
 
Wearable Injectors Market
Wearable Injectors MarketWearable Injectors Market
Wearable Injectors Market
 
Nasal Polyps Market 2023: Epidemiology, Industry Trends, Size, Share And Fore...
Nasal Polyps Market 2023: Epidemiology, Industry Trends, Size, Share And Fore...Nasal Polyps Market 2023: Epidemiology, Industry Trends, Size, Share And Fore...
Nasal Polyps Market 2023: Epidemiology, Industry Trends, Size, Share And Fore...
 
Sanofi Q4 and full year 2022 results
Sanofi Q4 and full year 2022 resultsSanofi Q4 and full year 2022 results
Sanofi Q4 and full year 2022 results
 
Sunpharma present13
Sunpharma present13Sunpharma present13
Sunpharma present13
 
Asia pacific wound care market global trends, market share, industry size, gr...
Asia pacific wound care market global trends, market share, industry size, gr...Asia pacific wound care market global trends, market share, industry size, gr...
Asia pacific wound care market global trends, market share, industry size, gr...
 
Public Device & Biopharma Ophthalmology Company Showcase - pSivida
Public Device & Biopharma Ophthalmology Company Showcase - pSividaPublic Device & Biopharma Ophthalmology Company Showcase - pSivida
Public Device & Biopharma Ophthalmology Company Showcase - pSivida
 
Wearable Injectors Market
Wearable Injectors MarketWearable Injectors Market
Wearable Injectors Market
 
Acne Treatment Gel Manufacturing Process, Machinery Requirements and Project ...
Acne Treatment Gel Manufacturing Process, Machinery Requirements and Project ...Acne Treatment Gel Manufacturing Process, Machinery Requirements and Project ...
Acne Treatment Gel Manufacturing Process, Machinery Requirements and Project ...
 

More from MOHAMMED YASER HUSSAIN

Antares_Investor_Presentation_March_2022.pdf
Antares_Investor_Presentation_March_2022.pdfAntares_Investor_Presentation_March_2022.pdf
Antares_Investor_Presentation_March_2022.pdf
MOHAMMED YASER HUSSAIN
 
Pharma RD Webinar 2022.pdf
Pharma RD Webinar 2022.pdfPharma RD Webinar 2022.pdf
Pharma RD Webinar 2022.pdf
MOHAMMED YASER HUSSAIN
 
Investor-Presentation-Q1-1.pdf
Investor-Presentation-Q1-1.pdfInvestor-Presentation-Q1-1.pdf
Investor-Presentation-Q1-1.pdf
MOHAMMED YASER HUSSAIN
 
Roche_Genentech_Company_Presentation_2022.pdf
Roche_Genentech_Company_Presentation_2022.pdfRoche_Genentech_Company_Presentation_2022.pdf
Roche_Genentech_Company_Presentation_2022.pdf
MOHAMMED YASER HUSSAIN
 
2022-Full-Year-Investor-Presentation.pdf
2022-Full-Year-Investor-Presentation.pdf2022-Full-Year-Investor-Presentation.pdf
2022-Full-Year-Investor-Presentation.pdf
MOHAMMED YASER HUSSAIN
 
MHS-2022-IHCP-Roadshow-Presentation.pdf
MHS-2022-IHCP-Roadshow-Presentation.pdfMHS-2022-IHCP-Roadshow-Presentation.pdf
MHS-2022-IHCP-Roadshow-Presentation.pdf
MOHAMMED YASER HUSSAIN
 
AMN-Investor-Presentation-May-2022-FINAL.pdf
AMN-Investor-Presentation-May-2022-FINAL.pdfAMN-Investor-Presentation-May-2022-FINAL.pdf
AMN-Investor-Presentation-May-2022-FINAL.pdf
MOHAMMED YASER HUSSAIN
 
ASCO-2022-IR-Presentation.pdf
ASCO-2022-IR-Presentation.pdfASCO-2022-IR-Presentation.pdf
ASCO-2022-IR-Presentation.pdf
MOHAMMED YASER HUSSAIN
 
DHA Industry Day Slides 2022 v5.pdf
DHA Industry Day Slides 2022 v5.pdfDHA Industry Day Slides 2022 v5.pdf
DHA Industry Day Slides 2022 v5.pdf
MOHAMMED YASER HUSSAIN
 
asx_20220223_2345299.pdf
asx_20220223_2345299.pdfasx_20220223_2345299.pdf
asx_20220223_2345299.pdf
MOHAMMED YASER HUSSAIN
 
Tenet-2022-JPM-Presentation.pdf
Tenet-2022-JPM-Presentation.pdfTenet-2022-JPM-Presentation.pdf
Tenet-2022-JPM-Presentation.pdf
MOHAMMED YASER HUSSAIN
 
AHEL-Investor-Presentation-June-22-INR.pdf
AHEL-Investor-Presentation-June-22-INR.pdfAHEL-Investor-Presentation-June-22-INR.pdf
AHEL-Investor-Presentation-June-22-INR.pdf
MOHAMMED YASER HUSSAIN
 
q2-2022-investor-presentation.pdf
q2-2022-investor-presentation.pdfq2-2022-investor-presentation.pdf
q2-2022-investor-presentation.pdf
MOHAMMED YASER HUSSAIN
 
5.CRCRole_Documentation.pdf
5.CRCRole_Documentation.pdf5.CRCRole_Documentation.pdf
5.CRCRole_Documentation.pdf
MOHAMMED YASER HUSSAIN
 
Handout-Structure-of-med-res-paper-RG-checklists_FINAL.pdf
Handout-Structure-of-med-res-paper-RG-checklists_FINAL.pdfHandout-Structure-of-med-res-paper-RG-checklists_FINAL.pdf
Handout-Structure-of-med-res-paper-RG-checklists_FINAL.pdf
MOHAMMED YASER HUSSAIN
 
Elsevier.How to write a world-class paper.pdf
Elsevier.How to write a world-class paper.pdfElsevier.How to write a world-class paper.pdf
Elsevier.How to write a world-class paper.pdf
MOHAMMED YASER HUSSAIN
 
omega-healthcare-new-investor-presentation-4q21-april-2022.pdf
omega-healthcare-new-investor-presentation-4q21-april-2022.pdfomega-healthcare-new-investor-presentation-4q21-april-2022.pdf
omega-healthcare-new-investor-presentation-4q21-april-2022.pdf
MOHAMMED YASER HUSSAIN
 
HealthCare-Global-HCG-Q2FY18-Investor-Presentation.pdf
HealthCare-Global-HCG-Q2FY18-Investor-Presentation.pdfHealthCare-Global-HCG-Q2FY18-Investor-Presentation.pdf
HealthCare-Global-HCG-Q2FY18-Investor-Presentation.pdf
MOHAMMED YASER HUSSAIN
 
gehc_2022_morgan_stanley_healthcare_conference_slides.pdf
gehc_2022_morgan_stanley_healthcare_conference_slides.pdfgehc_2022_morgan_stanley_healthcare_conference_slides.pdf
gehc_2022_morgan_stanley_healthcare_conference_slides.pdf
MOHAMMED YASER HUSSAIN
 
tnxweheytmspfdj5awpn-signature-e69ae7cc94bae1fca95c5b04e1efe8fbccff124fa2526e...
tnxweheytmspfdj5awpn-signature-e69ae7cc94bae1fca95c5b04e1efe8fbccff124fa2526e...tnxweheytmspfdj5awpn-signature-e69ae7cc94bae1fca95c5b04e1efe8fbccff124fa2526e...
tnxweheytmspfdj5awpn-signature-e69ae7cc94bae1fca95c5b04e1efe8fbccff124fa2526e...
MOHAMMED YASER HUSSAIN
 

More from MOHAMMED YASER HUSSAIN (20)

Antares_Investor_Presentation_March_2022.pdf
Antares_Investor_Presentation_March_2022.pdfAntares_Investor_Presentation_March_2022.pdf
Antares_Investor_Presentation_March_2022.pdf
 
Pharma RD Webinar 2022.pdf
Pharma RD Webinar 2022.pdfPharma RD Webinar 2022.pdf
Pharma RD Webinar 2022.pdf
 
Investor-Presentation-Q1-1.pdf
Investor-Presentation-Q1-1.pdfInvestor-Presentation-Q1-1.pdf
Investor-Presentation-Q1-1.pdf
 
Roche_Genentech_Company_Presentation_2022.pdf
Roche_Genentech_Company_Presentation_2022.pdfRoche_Genentech_Company_Presentation_2022.pdf
Roche_Genentech_Company_Presentation_2022.pdf
 
2022-Full-Year-Investor-Presentation.pdf
2022-Full-Year-Investor-Presentation.pdf2022-Full-Year-Investor-Presentation.pdf
2022-Full-Year-Investor-Presentation.pdf
 
MHS-2022-IHCP-Roadshow-Presentation.pdf
MHS-2022-IHCP-Roadshow-Presentation.pdfMHS-2022-IHCP-Roadshow-Presentation.pdf
MHS-2022-IHCP-Roadshow-Presentation.pdf
 
AMN-Investor-Presentation-May-2022-FINAL.pdf
AMN-Investor-Presentation-May-2022-FINAL.pdfAMN-Investor-Presentation-May-2022-FINAL.pdf
AMN-Investor-Presentation-May-2022-FINAL.pdf
 
ASCO-2022-IR-Presentation.pdf
ASCO-2022-IR-Presentation.pdfASCO-2022-IR-Presentation.pdf
ASCO-2022-IR-Presentation.pdf
 
DHA Industry Day Slides 2022 v5.pdf
DHA Industry Day Slides 2022 v5.pdfDHA Industry Day Slides 2022 v5.pdf
DHA Industry Day Slides 2022 v5.pdf
 
asx_20220223_2345299.pdf
asx_20220223_2345299.pdfasx_20220223_2345299.pdf
asx_20220223_2345299.pdf
 
Tenet-2022-JPM-Presentation.pdf
Tenet-2022-JPM-Presentation.pdfTenet-2022-JPM-Presentation.pdf
Tenet-2022-JPM-Presentation.pdf
 
AHEL-Investor-Presentation-June-22-INR.pdf
AHEL-Investor-Presentation-June-22-INR.pdfAHEL-Investor-Presentation-June-22-INR.pdf
AHEL-Investor-Presentation-June-22-INR.pdf
 
q2-2022-investor-presentation.pdf
q2-2022-investor-presentation.pdfq2-2022-investor-presentation.pdf
q2-2022-investor-presentation.pdf
 
5.CRCRole_Documentation.pdf
5.CRCRole_Documentation.pdf5.CRCRole_Documentation.pdf
5.CRCRole_Documentation.pdf
 
Handout-Structure-of-med-res-paper-RG-checklists_FINAL.pdf
Handout-Structure-of-med-res-paper-RG-checklists_FINAL.pdfHandout-Structure-of-med-res-paper-RG-checklists_FINAL.pdf
Handout-Structure-of-med-res-paper-RG-checklists_FINAL.pdf
 
Elsevier.How to write a world-class paper.pdf
Elsevier.How to write a world-class paper.pdfElsevier.How to write a world-class paper.pdf
Elsevier.How to write a world-class paper.pdf
 
omega-healthcare-new-investor-presentation-4q21-april-2022.pdf
omega-healthcare-new-investor-presentation-4q21-april-2022.pdfomega-healthcare-new-investor-presentation-4q21-april-2022.pdf
omega-healthcare-new-investor-presentation-4q21-april-2022.pdf
 
HealthCare-Global-HCG-Q2FY18-Investor-Presentation.pdf
HealthCare-Global-HCG-Q2FY18-Investor-Presentation.pdfHealthCare-Global-HCG-Q2FY18-Investor-Presentation.pdf
HealthCare-Global-HCG-Q2FY18-Investor-Presentation.pdf
 
gehc_2022_morgan_stanley_healthcare_conference_slides.pdf
gehc_2022_morgan_stanley_healthcare_conference_slides.pdfgehc_2022_morgan_stanley_healthcare_conference_slides.pdf
gehc_2022_morgan_stanley_healthcare_conference_slides.pdf
 
tnxweheytmspfdj5awpn-signature-e69ae7cc94bae1fca95c5b04e1efe8fbccff124fa2526e...
tnxweheytmspfdj5awpn-signature-e69ae7cc94bae1fca95c5b04e1efe8fbccff124fa2526e...tnxweheytmspfdj5awpn-signature-e69ae7cc94bae1fca95c5b04e1efe8fbccff124fa2526e...
tnxweheytmspfdj5awpn-signature-e69ae7cc94bae1fca95c5b04e1efe8fbccff124fa2526e...
 

Recently uploaded

FACIAL NERVE
FACIAL NERVEFACIAL NERVE
FACIAL NERVE
aditigupta1117
 
HUMAN BRAIN.pptx.PRIYA BHOJWANI@GAMIL.COM
HUMAN BRAIN.pptx.PRIYA BHOJWANI@GAMIL.COMHUMAN BRAIN.pptx.PRIYA BHOJWANI@GAMIL.COM
HUMAN BRAIN.pptx.PRIYA BHOJWANI@GAMIL.COM
priyabhojwani1200
 
Top Rated Massage Center In Ajman Chandrima Spa
Top Rated Massage Center In Ajman Chandrima SpaTop Rated Massage Center In Ajman Chandrima Spa
Top Rated Massage Center In Ajman Chandrima Spa
Chandrima Spa Ajman
 
Pediatric Emergency Care for Children | Apollo Hospital
Pediatric Emergency Care for Children | Apollo HospitalPediatric Emergency Care for Children | Apollo Hospital
Pediatric Emergency Care for Children | Apollo Hospital
Apollo 24/7 Adult & Paediatric Emergency Services
 
Can Allopathy and Homeopathy Be Used Together in India.pdf
Can Allopathy and Homeopathy Be Used Together in India.pdfCan Allopathy and Homeopathy Be Used Together in India.pdf
Can Allopathy and Homeopathy Be Used Together in India.pdf
Dharma Homoeopathy
 
DECODING THE RISKS - ALCOHOL, TOBACCO & DRUGS.pdf
DECODING THE RISKS - ALCOHOL, TOBACCO & DRUGS.pdfDECODING THE RISKS - ALCOHOL, TOBACCO & DRUGS.pdf
DECODING THE RISKS - ALCOHOL, TOBACCO & DRUGS.pdf
Dr Rachana Gujar
 
Psychedelic Retreat Portugal - Escape to Lighthouse Retreats for an unforgett...
Psychedelic Retreat Portugal - Escape to Lighthouse Retreats for an unforgett...Psychedelic Retreat Portugal - Escape to Lighthouse Retreats for an unforgett...
Psychedelic Retreat Portugal - Escape to Lighthouse Retreats for an unforgett...
Lighthouse Retreat
 
Hypotension and role of physiotherapy in it
Hypotension and role of physiotherapy in itHypotension and role of physiotherapy in it
Hypotension and role of physiotherapy in it
Vishal kr Thakur
 
MBC Support Group for Black Women – Insights in Genetic Testing.pdf
MBC Support Group for Black Women – Insights in Genetic Testing.pdfMBC Support Group for Black Women – Insights in Genetic Testing.pdf
MBC Support Group for Black Women – Insights in Genetic Testing.pdf
bkling
 
NKTI Annual Report - Annual Report FY 2022
NKTI Annual Report - Annual Report FY 2022NKTI Annual Report - Annual Report FY 2022
NKTI Annual Report - Annual Report FY 2022
nktiacc3
 
Comprehensive Rainy Season Advisory: Safety and Preparedness Tips.pdf
Comprehensive Rainy Season Advisory: Safety and Preparedness Tips.pdfComprehensive Rainy Season Advisory: Safety and Preparedness Tips.pdf
Comprehensive Rainy Season Advisory: Safety and Preparedness Tips.pdf
Dr Rachana Gujar
 
The Power of Superfoods and Exercise.pdf
The Power of Superfoods and Exercise.pdfThe Power of Superfoods and Exercise.pdf
The Power of Superfoods and Exercise.pdf
Dr Rachana Gujar
 
Bringing AI into a Mid-Sized Company: A structured Approach
Bringing AI into a Mid-Sized Company: A structured ApproachBringing AI into a Mid-Sized Company: A structured Approach
Bringing AI into a Mid-Sized Company: A structured Approach
Brian Frerichs
 
Hypertension and it's role of physiotherapy in it.
Hypertension and it's role of physiotherapy in it.Hypertension and it's role of physiotherapy in it.
Hypertension and it's role of physiotherapy in it.
Vishal kr Thakur
 
Can coffee help me lose weight? Yes, 25,422 users in the USA use it for that ...
Can coffee help me lose weight? Yes, 25,422 users in the USA use it for that ...Can coffee help me lose weight? Yes, 25,422 users in the USA use it for that ...
Can coffee help me lose weight? Yes, 25,422 users in the USA use it for that ...
nirahealhty
 
LEAD Innovation Launch_WHO Innovation Initiative.pptx
LEAD Innovation Launch_WHO Innovation Initiative.pptxLEAD Innovation Launch_WHO Innovation Initiative.pptx
LEAD Innovation Launch_WHO Innovation Initiative.pptx
ChetanSharma78255
 
Let's Talk About It: Breast Cancer (What is Mindset and Does it Really Matter?)
Let's Talk About It: Breast Cancer (What is Mindset and Does it Really Matter?)Let's Talk About It: Breast Cancer (What is Mindset and Does it Really Matter?)
Let's Talk About It: Breast Cancer (What is Mindset and Does it Really Matter?)
bkling
 
TEST BANK FOR Health Assessment in Nursing 7th Edition by Weber Chapters 1 - ...
TEST BANK FOR Health Assessment in Nursing 7th Edition by Weber Chapters 1 - ...TEST BANK FOR Health Assessment in Nursing 7th Edition by Weber Chapters 1 - ...
TEST BANK FOR Health Assessment in Nursing 7th Edition by Weber Chapters 1 - ...
rightmanforbloodline
 
DRAFT Ventilator Rapid Reference version 2.4.pdf
DRAFT Ventilator Rapid Reference  version  2.4.pdfDRAFT Ventilator Rapid Reference  version  2.4.pdf
DRAFT Ventilator Rapid Reference version 2.4.pdf
Robert Cole
 
Bath patient Fundamental of Nursing.pptx
Bath patient Fundamental of Nursing.pptxBath patient Fundamental of Nursing.pptx
Bath patient Fundamental of Nursing.pptx
MianProductions
 

Recently uploaded (20)

FACIAL NERVE
FACIAL NERVEFACIAL NERVE
FACIAL NERVE
 
HUMAN BRAIN.pptx.PRIYA BHOJWANI@GAMIL.COM
HUMAN BRAIN.pptx.PRIYA BHOJWANI@GAMIL.COMHUMAN BRAIN.pptx.PRIYA BHOJWANI@GAMIL.COM
HUMAN BRAIN.pptx.PRIYA BHOJWANI@GAMIL.COM
 
Top Rated Massage Center In Ajman Chandrima Spa
Top Rated Massage Center In Ajman Chandrima SpaTop Rated Massage Center In Ajman Chandrima Spa
Top Rated Massage Center In Ajman Chandrima Spa
 
Pediatric Emergency Care for Children | Apollo Hospital
Pediatric Emergency Care for Children | Apollo HospitalPediatric Emergency Care for Children | Apollo Hospital
Pediatric Emergency Care for Children | Apollo Hospital
 
Can Allopathy and Homeopathy Be Used Together in India.pdf
Can Allopathy and Homeopathy Be Used Together in India.pdfCan Allopathy and Homeopathy Be Used Together in India.pdf
Can Allopathy and Homeopathy Be Used Together in India.pdf
 
DECODING THE RISKS - ALCOHOL, TOBACCO & DRUGS.pdf
DECODING THE RISKS - ALCOHOL, TOBACCO & DRUGS.pdfDECODING THE RISKS - ALCOHOL, TOBACCO & DRUGS.pdf
DECODING THE RISKS - ALCOHOL, TOBACCO & DRUGS.pdf
 
Psychedelic Retreat Portugal - Escape to Lighthouse Retreats for an unforgett...
Psychedelic Retreat Portugal - Escape to Lighthouse Retreats for an unforgett...Psychedelic Retreat Portugal - Escape to Lighthouse Retreats for an unforgett...
Psychedelic Retreat Portugal - Escape to Lighthouse Retreats for an unforgett...
 
Hypotension and role of physiotherapy in it
Hypotension and role of physiotherapy in itHypotension and role of physiotherapy in it
Hypotension and role of physiotherapy in it
 
MBC Support Group for Black Women – Insights in Genetic Testing.pdf
MBC Support Group for Black Women – Insights in Genetic Testing.pdfMBC Support Group for Black Women – Insights in Genetic Testing.pdf
MBC Support Group for Black Women – Insights in Genetic Testing.pdf
 
NKTI Annual Report - Annual Report FY 2022
NKTI Annual Report - Annual Report FY 2022NKTI Annual Report - Annual Report FY 2022
NKTI Annual Report - Annual Report FY 2022
 
Comprehensive Rainy Season Advisory: Safety and Preparedness Tips.pdf
Comprehensive Rainy Season Advisory: Safety and Preparedness Tips.pdfComprehensive Rainy Season Advisory: Safety and Preparedness Tips.pdf
Comprehensive Rainy Season Advisory: Safety and Preparedness Tips.pdf
 
The Power of Superfoods and Exercise.pdf
The Power of Superfoods and Exercise.pdfThe Power of Superfoods and Exercise.pdf
The Power of Superfoods and Exercise.pdf
 
Bringing AI into a Mid-Sized Company: A structured Approach
Bringing AI into a Mid-Sized Company: A structured ApproachBringing AI into a Mid-Sized Company: A structured Approach
Bringing AI into a Mid-Sized Company: A structured Approach
 
Hypertension and it's role of physiotherapy in it.
Hypertension and it's role of physiotherapy in it.Hypertension and it's role of physiotherapy in it.
Hypertension and it's role of physiotherapy in it.
 
Can coffee help me lose weight? Yes, 25,422 users in the USA use it for that ...
Can coffee help me lose weight? Yes, 25,422 users in the USA use it for that ...Can coffee help me lose weight? Yes, 25,422 users in the USA use it for that ...
Can coffee help me lose weight? Yes, 25,422 users in the USA use it for that ...
 
LEAD Innovation Launch_WHO Innovation Initiative.pptx
LEAD Innovation Launch_WHO Innovation Initiative.pptxLEAD Innovation Launch_WHO Innovation Initiative.pptx
LEAD Innovation Launch_WHO Innovation Initiative.pptx
 
Let's Talk About It: Breast Cancer (What is Mindset and Does it Really Matter?)
Let's Talk About It: Breast Cancer (What is Mindset and Does it Really Matter?)Let's Talk About It: Breast Cancer (What is Mindset and Does it Really Matter?)
Let's Talk About It: Breast Cancer (What is Mindset and Does it Really Matter?)
 
TEST BANK FOR Health Assessment in Nursing 7th Edition by Weber Chapters 1 - ...
TEST BANK FOR Health Assessment in Nursing 7th Edition by Weber Chapters 1 - ...TEST BANK FOR Health Assessment in Nursing 7th Edition by Weber Chapters 1 - ...
TEST BANK FOR Health Assessment in Nursing 7th Edition by Weber Chapters 1 - ...
 
DRAFT Ventilator Rapid Reference version 2.4.pdf
DRAFT Ventilator Rapid Reference  version  2.4.pdfDRAFT Ventilator Rapid Reference  version  2.4.pdf
DRAFT Ventilator Rapid Reference version 2.4.pdf
 
Bath patient Fundamental of Nursing.pptx
Bath patient Fundamental of Nursing.pptxBath patient Fundamental of Nursing.pptx
Bath patient Fundamental of Nursing.pptx
 

SPIL-IR-Presentation-September-2022-INR.pdf

  • 1. Creating Lasting Value Investor Presentation – September 2022 NSE:SUNPHARMA | BSE:524715 | Bloomberg:SUNP IN | Reuters:SUN.BO WWW.SUNPHARMA.COM
  • 2. Except for the historical information contained herein, statements in this presentation and the subsequent discussions, which include words or phrases such as “will”, “aim”, “will likely result”, “would”, “believe”, “may”, “expect”, “will continue”, “anticipate”, “estimate”, “intend”, “plan”, “contemplate”, “seek to”, “future”, “objective”, “goal”, “likely”, “project”, “should”, “potential”, “will pursue” and similar expressions or variations of such expressions may constitute "forward-looking statements". These forward-looking statements involve a number of risks, uncertainties and other factors that could cause actual results to differ materially from those suggested by the forward-looking statements. These risks and uncertainties include, but are not limited to our ability to successfully implement our strategy, our growth and expansion plans, obtain regulatory approvals, our provisioning policies, technological changes, investment and business income, cash flow projections, our exposure to market risks as well as other risks. Sun Pharmaceutical Industries Limited does not undertake any obligation to update forward-looking statements to reflect events or circumstances after the date thereof. Disclaimer 2
  • 3. Contents 3 Sun Pharma at a glance 1 Long-term Strategy 2 Global Specialty Initiatives 3 Revenue Composition, History & Acquisition Track Record 4 Business Operations, R&D, Manufacturing 5 Corporate Governance 6 Financials – P&L, Balance Sheet, Cash Flows & Ratios 7 Key Milestones Targeted 8
  • 4. 4 Sun Pharma at a glance 4th Largest Global Specialty Generic Company* 4th Largest Global Specialty Generic Company* • Ranked 8th in US Generics Market## US US • No. 1 Pharma Company in India India India • Amongst the largest Indian Pharma Company in Emerging Markets Emerging Markets Emerging Markets • Expanding presence in Rest of World markets Rest of World Markets Rest of World Markets • 43 manufacturing sites across the world Manufacturing Footprint Manufacturing Footprint • Presence in more than 100 countries across branded and generic markets Market Presence Market Presence • 38,000+ global employee base Employees Employees • Multiple manufacturing facilities approved by various regulatory authorities across the world including USFDA Quality Compliance Quality Compliance • Capabilities across dosage forms like injectables, sprays, ointments, creams, liquids, tablets and capsules R&D and Manufacturing R&D and Manufacturing • Specialty products, branded generics, generics & APIs Addressable Segments Addressable Segments *Source: Evaluate Pharma Estimates for 12 months ended Dec 2021 ## Source: IQVIA data for 12 months ended April 2022
  • 5. World’s 4th Largest Specialty Generic Pharma Co 1.6 1.7 1.7 1.8 1.9 1.9 2.1 2.2 2.8 3.2 3.3 4.0 4.5 5.6 8.3 9.2 Aspen Les Laboratoires Nichi-Iko Sawai Himka STADA Lupin Dr. Reddy Apotex Aurobindo Fresenius Pfizer Sun Pharma + Taro Viatris Teva Novartis 5 2021 Worldwide Generic Sales (US$ in billions) Source: Evaluate Pharma Estimates for 12 months ended Dec 2021
  • 6. US Formulation 30% India Branded Generics 33% Emerging Markets 18% Rest of World (RoW)# 14% API & Others 5% FY22 India 35% International 65% FY22 Rest of World (RoW)  8th largest generics company in US* with a strong pipeline (89 ANDAs & 13 NDAs awaiting approval)  Presence in Specialty branded & generics segments with more than 560 approved products  FY22 sales: Rs. 113,737 mn 6 Sun Pharma today • Market cap: US$ 26 bn (1) • Gross Sales: Rs. 384,264 mn • EBITDA: Rs. 103,977 mn (26.9% margin) • R&D Investment: 5.8% of Sales • Globalized supply chain • Strong balance sheet • 54% owned by promoter group Note: (1) As of Sept, 15 2022 using spot exchange rate of INR /USD = 79.69 # Includes Western Europe, Canada, Japan, Australia & New Zealand, Israel and other markets. * Source: IQVIA data for 12 months ended April 2022  Presence in about 80 countries across Africa, Americas, Asia and Eastern & Central Europe  Key focus markets – Romania, Russia, South Africa, Brazil & Mexico and complementary & affiliated markets  FY22 sales: Rs. 67,432 mn  Presence across key markets in Western Europe, Canada, Japan, Israel, A&NZ and other markets  Product portfolio includes specialty products, differentiated offerings for hospitals, injectables & generics for retail market  FY22 sales: Rs. 54,545 mn  No.1 ranked with 11 classes of doctor categories  Leading position in high growth chronic therapies  Specializes in technically complex products  FY22 sales: Rs. 127,593 mn Geographical sales split Revenue Share India Branded Generics US Formulations Emerging Markets
  • 7. • Enhance share of specialty business • Achieve differentiation by focusing on technically complex products • Focus on key markets – achieve critical mass • Speed to market • Ensure sustained compliance with global regulatory standards • Sustainability - Committed to Governance, Community Upliftment, Access to Affordable Healthcare & Environment Conservation • Increasing contribution of specialty and complex products • Future investments directed towards differentiated products Cost leadership Growth and Sustainability Driving Sustainable Long Term Growth 7 Business development • Optimize operational costs • Vertically integrated operations • Use acquisitions to bridge critical product/capability gaps • Focus on access to products, technology, market presence • Ensure acquisitions yield targeted return on Investment • Focus on payback timelines Balance profitability & investments for future
  • 8. Our Specialty Portfolio 8 • Indication - For plaque psoriasis • Launched in US in October 2018 & in Australia in Dec-2018, Phased launch in Europe by Almirall starting December 2018 onwards • Long term clinical data shows that the significant response rate seen in 52 & 64 weeks were maintained over five years • Evaluating new indications for Ilumya - Phase-2 data shows potential to improve joint & skin symptoms of Psoriatic Arthritis. Commenced Phase-3 trials in 2020 • Out licensed to CMS for Greater China market & to Hikma for Middle East & North African markets • Launched in Japan in September 2020 and in Canada in October 2021 Ilumya/ Ilumetri Ilumya/ Ilumetri • Indication - For dry eye disease • Launched in US in October 2019 • Out-licensed to CMS for Greater China market in June 2019 • Launched in Canada in January 2022 Cequa Cequa • For the topical treatment of acne vulgaris in patients 12 years of age and older • Launched in US in November 2021 Winlevi Winlevi • Indication - For the treatment of severe recalcitrant nodular acne that cannot be cleared up by any other acne treatments, including antibiotics. • Launched in US in February 2020 Absorica LD Absorica LD • Indication – In combination with BLU-U (Blue Light Photodynamic Therapy Illuminator) for treatment of minimally to moderately thick actinic keratoses of the face, scalp, or upper extremities. • Currently marketed in US for actinic keratosis Levulan Kerastick Levulan Kerastick
  • 9. Our Specialty Portfolio 9 • Indication - For LABCC (locally advanced basal cell carcinoma) • Currently marketed in US, Canada, Germany, France, Denmark, Switzerland, Spain, Italy, Australia and Israel Odomzo Odomzo • Indication - For metastatic castration resistant prostate cancer in combination with methylprednisolone • Launched in US in May 2018 Yonsa Yonsa • Indication - For prevention of ocular pain & treatment of inflammation following cataract surgery • Launched in US in November 2016 Bromsite Bromsite • Indication - For reduction of elevated IOP in patients with open-angle glaucoma or ocular hypertension • BAK (Benzalkonium chloride) free form of latanoprost • Launched In US in January 2019 Xelpros Xelpros • Products using sprinkle technology for patients who have difficulty swallowing • Sprinkle versions of metoprolol (cardiology), rosuvastatin (cardiology) & duloxetine (neuro- psychiatry) commercialized in US between 2018-2019 • Therapeutic solutions for long-term care (LTC) patients Sprinkle Portfolio Sprinkle Portfolio
  • 10. Creating Lasting Value - Investor Presentation Our Specialty Pipeline Molecule/Asset Indication Route of Administration Mechanism of Action Pre-clinical Phase-1 Phase-2 Phase-3 Registration Approved Ilumya (tildrakizumab) Psoriatic Arthritis Injection IL-23 Antagonist SCD-044 Psoriasis, Atopic Dermatitis Oral Selective SIPR1 Agonist MM-II Treatment of pain in osteoarthritis Injection Liposomal intra -articular lubrication GL0034 Type 2 Diabetes Injection GLP-1R Agonist 10
  • 11. 11 Highly Diversified Revenue Base US Formulations 30% India Branded Formulations 33% Emerging Markets 18% Rest of World (RoW)# 14% API & Others 5% # Includes Western Europe, Canada, Japan, Australia & New Zealand, Israel and other markets. FY22 Sales Rs. 384 billion
  • 12. 0.0 15.2 33.9 74.9 FY07 FY12 FY17 FY22 2.4 22.3 70.8 89.8 FY07 FY12 FY17 FY22 21.4 80.1 302.6 384.3 FY07 FY12 FY17 FY22 3.3 11.1 29.0 32.0 FY07 FY12 FY17 FY22 12 Impressive Track Record of Growth Sales 6.7 32.5 100.8 104.0 FY07 FY12 FY17 FY22 7.8 26.6 69.6 76.7 FY07 FY12 FY17 FY22 CAGR 21% CAGR 16% CAGR 20% CAGR 27% CAGR 16% EBITDA Adjusted Net Profit Operating Cash Flow Adjusted EPS (Rs/Share) (All Figures in Rs Billion) Free Cash Flow CAGR for FY07-FY22 CAGR 69% CAGR 69%
  • 13. 16.6 11.9 19.3 29.5 FY19 FY20 FY21 FY22 9.4% 9.1% 12.5% 15.0% FY19 FY20 FY21 FY22 11.8% 11.0% 13.5% 16.4% FY19 FY20 FY21 FY22 72.6% 71.4% 73.9% 73.1% FY19 FY20 FY21 FY22 13 Profitability and Return Ratios 21.7% 21.3% 25.3% 26.9% FY19 FY20 FY21 FY22 13.5% 12.5% 17.8% 20.0% FY19 FY20 FY21 FY22 Gross Margin # EBITDA Margin Adjusted Net Profit Margin ROCE ROE Market Cap (USD Bn) # Gross margin= (Sales - Material Cost)/Sales*100) ROCE & ROE exclude one-time exceptional charges ROCE = EBIT / Average of (Total Assets – Current Liabilities) ROE = Net Profit / Average Shareholders Equity (Market Cap as on 31st March )
  • 14. 22% 21% 25% 27% 16% 17% 20% 19% FY19 FY20 FY21 FY22 14% 13% 18% 20% 9% 10% 14% 11% 73% 71% 74% 73% 64% 64% 65% 63% FY19 FY20 FY21 FY22 Gross margin= (Net Sales – Material Cost) / Net Sales * 100 #Top 9 Indian Pharma company include Aurobindo, Cadila Healthcare, Cipla, DRL, Glenmark, Ipca, Lupin, Torrent and Wockhardt. Profitability Sun Pharma Range of Top 9 Indian Pharma Cos. Average Adjusted Net Profit Margin EBITDA Margin FY19 FY20 FY21 FY22 Gross Margin 14
  • 15. Began with 5 products Acquired Taro Acquired Dusa Acquired URL Pharma Creating a Global Company 15 IPO - Rs. 550 Mn raised Acquired Ranbaxy 38,000+ Global Employee Base Sun Pharma Today Invested ~Rs. 219 Bn in R&D till date (Since 1994) Part of NSE Nifty & BSE Sensex in India 43 Manufacturing facilities in 6 Continents 65% of sales from international markets Year Agreement with Merck for in- licensing Tildrakizumab Acquired InSite Vision ophthalmic portfolio • Entry into Japan -Acquired 14 brands from Novartis • Acquired Global rights for Cequa & Odomzo Acquired Pola Pharma in Japan Acquired Biosintez in Russia Specialty launches • Ilumya • Cequa • Odomzo • Absorica LD • Yonsa • Xelpros • Sprinkle products In-lincesed Winlevi® for acne treatment in US & Canada. Launched in US in Nov-21 Expanded Winlevi® licensing agreement to include Japan, A&NZ, Brazil, Mexico & Russia markets 1983 1994 2010 2012 2013 2014 2015 2016 2018 2019 2020 2021 2022
  • 16. Key Deals & Rationale 16 Year Deals Country Rationale 2022 Expanded Winlevi® licensing agreement to include Japan, Australia, New Zealand, Brazil, Mexico & Russia markets Japan, Australia, New Zealand, Brazil, Mexico and Russia Topical treatment of acne vulgaris 2022 Acquired UractivTM Portfolio from Fiterman Pharma Romania Expand non-prescription product basket in Romania and neighbouring markets 2022 Taro (Sun's subsidiary company) acquired Alchemee Business from Galderma US, Japan, Canada Acquired the "Proactiv", "Restorative Elements" and "In Defense of Skin" brands. Strengthens Taro’s OTC portfolio 2021 In-licensed Winlevi® (clascoterone cream 1%) US & Canada Topical treatment of acne vulgaris 2020 Exclusive licensing agreement with Himka for Ilumya Middle East & North Africa Registration and commercialization of the product in all Middle East & North Africa (MENA) markets. 2020 Licensing agreement with SPARC for SCD-044 Global Potential treatment for psoriasis, atopic dermatitis & other auto-immune disorders 2020 In-licensed Triferic brand from Rockwell Medical Inc. (USA) India Expands nephrology portfolio in India - for treating anaemia in hemodialysis patients. 2019 Licensing agreement with Astrazeneca UK for ready-to-use infusion oncology products Mainland China Access to oncology market in Mainland China 2019 Licensing agreement with CMS for Tildrakizumab, Cequa & 8 generic products Greater China Access to Greater China market 2018 Acquired Pola Pharma in Japan Japan Access to Japanese dermatology market. 2016 Acquired global rights for Cequa & Odomzo Global Enhances specialty pipeline.
  • 17. Key Deals & Rationale 17 Year Deals Country Rationale 2016 Acquired Biosintez Russia Local manufacturing capability to enhance presence in Russian market 2016 Licensing agreement with Almirall for Tildrakizumab for Psoriasis Europe Access to European market for Tidrakizumab 2016 Acquired 14 brands from Novartis Japan Entry into Japan 2016 Distribution agreement with AstraZeneca India Distribution services agreement in India for brand “Oxra” & “Oxramet”® (brands of dapagliflozin, used for diabetes treatment) 2015 Acquired InSite Vision Inc. US Strengthens branded ophthalmic portfolio in U.S. 2015 Distribution agreement with AstraZeneca India Distribution services agreement in India for brand “Axcer”® (brand of ticagrelor, used for the treatment of acute coronary syndrome) 2015 Sun Pharma – Ranbaxy Merger Global Markets Strengthen position in the Global Generic Pharma Industry, No.1 Pharma Company in India & Strong positioning in Emerging Markets 2014 In-licensing agreement with Merck for Tildrakizumab a biologic for psoriasis Global Markets Strengthening the specialty product pipeline 2014 Acquired Pharmalucence US Access to sterile injectable capacity in the US 2012 Acquired DUSA Pharma, Inc. US Access to specialty drug-device combination in dermatology segment 2010 Acquired Taro Pharmaceutical Industries Ltd. Israel Access to dermatology generic portfolio Manufacturing facilities at Israel & Canada 1997 Acquired Caraco Detroit, US Entry into US Market
  • 19. 19 US Business at a glance 8th Largest Pharma Company in the US Generics Market* 8th Largest Pharma Company in the US Generics Market* • Ranked 2nd by prescriptions## in the US dermatology market Dermatology Segment Dermatology Segment • Wide basket of 604 ANDAs & 67 NDAs filed and 515 ANDAs & 54 NDAs approved across multiple therapies Comprehensive Portfolio** Comprehensive Portfolio** • 89 ANDAs & 13 NDAs pending approval with USFDA Robust Pipeline** Robust Pipeline** • Presence in branded, generics & OTC segments Market Presence Market Presence • Integrated manufacturer with flexibility for manufacturing onshore/ offshore Flexible Manufacturing Flexible Manufacturing • Liquids, Creams, Ointments, Gels, Sprays, Injectables, Tablets, Capsules, Drug-Device combination Dosage Forms Dosage Forms * Source: IQVIA data for 12 months ended April 2022 ## Source: IQVIA data for 12 months ended April 2022 **All data as of 30-Jun-2022
  • 20. US Business – Sales 20 35 62 98 137 135 138 87 107 105 101 114 FY12 FY13 FY14 FY15 FY16 FY17 FY18 FY19 FY20 FY21 FY22 Sales in Rs. billion 10 year CAGR - 13%
  • 21. 21 Key Milestones in US • Launched Winlevi® (clascoterone cream 1%) for topical treatment of acne vulgaris FY22 • Presented long term clinical data for Ilumya & other clinical insights for Odomzo & Levulan at American Academy of Dermatology Conference • Presented Pre-clinical data for GL0034 (GLP-1R agonist) at American Diabetes Association Conference FY21 • Launched Cequa in US • Launched Absorica LD in US in Feb-2020 FY20 • Launched Ilumya & Yonsa in US • Received USFDA approval for Cequa • Launched Xelpros in US • Launched Ready-to-Infuse INFUGEMTM FY19 • Launched Odomzo in US • US FDA approval for Ilumya FY18 • Tildrakizumab filing in US & Europe • Acquired Ocular Technologies giving access to Cequa, a product for dry eyes. • Acquired Odomzo- branded oncology product from Novartis FY17 • Acquired DUSA - Entry in branded specialty market FY13 • Acquired Taro Pharma – Entry into US dermatology market FY10 • Entry in US through Caraco acquisition FY98
  • 22. 42 59 60 64 67 67 39 52 55 55 54 54 FY18 FY19 FY20 FY21 FY22 Q1FY23 Cumulative Products Filed Cumulative Products Approved ANDA & NDA Pipeline 561 571 581 595 605 604 422 453 483 501 512 515 FY18 FY19 FY20 FY21 FY22 Q1FY23 Cumulative Products Filed Cumulative Products Approved 22 ANDAs Filed and Approved (Cumulative) NDA Filed and Approved (Cumulative) (All data as of 30-June-2022)
  • 24. 24 India Business at a glance No. 1 in India No. 1 in India • No. 1 ranked with 8.5% market share Market Position** Market Position** • No. 1 ranked by prescriptions with 11 different classes of doctors Prescription Ranking## Prescription Ranking## • Market leader in the chronic segment Chronic Segment Chronic Segment • Strong positioning in the acute segment Acute Segment Acute Segment • Specializes in technically complex products and offers a complete therapy basket Product Offering Product Offering • 33 brands in the country’s top 300 pharmaceutical brands Strong Brand Positioning** Strong Brand Positioning** • Top 10 Brands contribute approx. 18% of India revenues – low product concentration • Growth driven by a basket of brands De-risked Growth** De-risked Growth** • 11,149 strong field force Sales Strength Sales Strength ** - As per AIOCD AWACS data for 12 months ended June’22 ## - As per SMSRC data for Feb’22
  • 25. 49,570 49,570 53,140 55,010 56,780 58,620 62,030 66,610 80,410 82,210 105,120 144,960 Aristo 2.9% Dr. Reddy 2.9% Macleods 3.1% Intas 3.2% Torrent 3.3% Alkem + Cachet + Indchemie 3.4% Lupin 3.6% Zydus 3.9% Mankind 4.7% Cipla 4.8% Abbott + Abbott HC + Novo 6.2% Sun Pharma 8.5% Largest Pharma Company in India 25 Market Share Formulation Sales in India as of 12 Months ended June 2022 (Rs. mn) Source: AIOCD AWACS MAT June 2022
  • 26. Market Share 8.5% Urology 3% Cardiology 17% Neuro-Psychiatry 16% Gastroenterology 13% Anti-Infectives 10% Diabetology 8% Pain / Analgesics 7% Dermatology, 6% Gynaecology, 4% Vitamins / Minerals / Nutrients, 5% Respiratory 5% Opthalmology 2% Others 4% India Business – Sales ramp-up 26 29 30 37 67 71 77 80 73 97 103 128 FY12 FY13 FY14 FY15 FY16 FY17 FY18 FY19 FY20 FY21 FY22 ** As per AIOCD AWACS – June‘22 Sales in Rs. Billion 10 year CAGR -16% Therapeutic Break-up** Impact of Ranbaxy Acquisition One-time impact of change in distribution
  • 27. Creating Lasting Value - Investor Presentation *Ranks based on prescription share Source-Strategic Marketing Solutions and Research Centre (SMSRC) Prescription Data Number 1 Ranking with 11 Doctor Categories* Leadership in key therapeutic areas* Prescription Ranking Specialist Feb ‘18 Feb ’19 Feb ’20 Feb ’21 Feb ’22 Psychiatrists 1 1 1 1 1 Neurologists 1 1 1 1 1 Cardiologists 1 1 1 1 1 Gastroenterologists 1 1 1 1 1 Diabetologists 1 1 1 1 1 Dermatologists 1 1 1 1 1 Urologists 1 1 1 1 1 Consulting Physicians 1 1 1 1 1 Chest Physicians 1 2 2 1 1 ENT 2 2 1 2 1 General surgeons 2 2 2 2 1 Orthopaedic 1 1 1 1 2 Nephrologists 1 1 1 2 2 Ophthalmologists 1 1 2 2 2 27
  • 28. 8.6 8.8 10.0 9.4 11.4 FY18 FY19 FY20 FY21 FY22 No. of Medical Representatives Sales Per Representative (Rs. Mn) Best-in-class field force productivity 28 • Well trained and scientifically oriented sales representatives team with strong performance track record • Field force with highest productivity amongst key players in India • Expanded sales force strength in FY21 to enhance geographical & doctor reach and improve brand focus Sales Per Medical Representative (Rs. Mn) Impact of sales force expansion 9,291 9,550 9,707 10,963 11,149
  • 30. 30 Emerging Markets Business at a glance Amongst the leading Indian Companies in Emerging Markets Amongst the leading Indian Companies in Emerging Markets • Presence in about 80 markets Global footprint Global footprint • Romania, Russia, South Africa, Brazil, Mexico and complementary & affiliated markets Focus Markets Focus Markets • Extensive basket of branded products Product Portfolio Product Portfolio • Strong relationships with doctors and medical practitioners Customer Focus Customer Focus • Approximately 2,200 Sales Representatives Sales Force Sales Force • Favourable macroeconomic parameters to drive pharmaceutical consumption in the long-term Opportunity Opportunity • Across 7 countries Local Manufacturing Local Manufacturing
  • 31. Rest of World (Western Europe, Canada, Japan, ANZ, Israel & Other Markets) 31 14% of Revenues
  • 32. 32 Rest of World Markets at a glance Amongst the leading Indian Companies Amongst the leading Indian Companies • Across all major markets in Western Europe, Canada, A&NZ, Japan, Israel and other markets Market Presence Market Presence • Expanding basket of products including specialty brands, injectable & hospital products as well as products for retail market Product Portfolio Product Portfolio • Development and commercialization of complex generics and differentiated products to drive sustainable and profitable growth Focus Focus • Distribution led model • Sales force for Specialty products Sales Force Sales Force • At Canada, Japan, Australia, Israel and Hungary + supplies from India facilities Local Manufacturing Local Manufacturing • Acquired 14 established prescription brands from Novartis in March 2016 • Acquired Pola Pharma in Japan in Jan 2019 • Launched Ilumya in Japan in September 2020 Japan Presence Japan Presence • Portfolio of generics and specialty products • Specialty products - Launched Ilumya in October 2021 and Cequa in January 2022 Canada Presence Canada Presence
  • 34. 34 Global Consumer Healthcare Business at a glance An Attractive Opportunity An Attractive Opportunity • Amongst the top 10 consumer healthcare companies India India • Presence in about 20+ countries Global Presence Global Presence • Romania, Russia, South Africa, Nigeria, Myanmar, Ukraine, Poland, Thailand, Belarus, Kazakhstan, Nepal, Morocco, UAE and Oman Focus Markets Focus Markets • Enjoys strong brand equity in 4 countries Strong Brand Equity Strong Brand Equity • Promoted through dedicated sales force in each market Sales Force Sales Force • Amongst top 10 consumer healthcare companies in India, Romania, Nigeria & Myanmar Strong Positioning Strong Positioning
  • 35. Active Pharmaceutical Ingredients (API) Business 35 5% of Revenues
  • 36. API Business 36 Backward Integration – Strategic Importance Backward Integration – Strategic Importance • Backward integration provides cost competitiveness and supply reliability Strategic Importance Strategic Importance • Large generic and innovator companies Customers Customers • Approximately 370 APIs Product Portfolio Product Portfolio • Approx. 20-30 APIs scaled up annually Pipeline Development Pipeline Development • 374 DMF/CEP approvals to date • 488 DMF/CEP Filings to date Regulatory approvals Regulatory approvals • Across 14 facilities Manufacturing Manufacturing
  • 38. 38 Research & Development Cumulative R&D Spend of ~Rs. 219 billion to date Cumulative R&D Spend of ~Rs. 219 billion to date • R&D spend at 5.8% of sales for FY22 • Strong cash flows & large scale to support R&D investments R&D Spend R&D Spend • Capabilities in finished dosage development, biological support, chemistry and new drug development Capabilities Capabilities • Approx. 2,700 headcount globally with R&D capabilities across dosage forms like orals, liquids, ointments, gels, sprays, injectables Organization Organization • Strong team of intellectual property experts supporting R&D IPR Support IPR Support • Developing non infringing formulations and development of specialty/complex products Focus Focus
  • 39. 22.5 19.8 19.8 21.5 22.2 FY18 FY19 FY20 FY21 FY22 R&D Investments (Rs Bn) R&D Investments (% of Sales) Filed Approved R&D Investments 39 (All data as of 30-June-2022) 5.8% 8.6% 6.9% 6.1% 6.5% Filed Approved Filed Granted ANDA DMF/CEP Patents** R&D Investments Filings and Approvals 604 515 488 374 2,458 1,556 Filed Approved NDA/BLA 67 54 ** Excludes Expired/Abandoned Patents
  • 41. 41 Global Manufacturing Presence World Class Manufacturing Infrastructure World Class Manufacturing Infrastructure • 43 manufacturing facilities across India, the Americas, Asia, Africa, Australia and Europe Extensive Global Footprint Extensive Global Footprint • Vertically integrated network across six continents enabling high quality, low cost and a quick market entry across the geographies Integrated Network Integrated Network • One of the few companies that has set up integrated manufacturing capability for the production of oncology, hormones, peptides and steroidal drugs Capabilities Capabilities • High quality manufacturing facilities. Many facilities approved by US FDA, UK MHRA, EMEA and other international regulatory authorities High Quality High Quality • Ability to manufacture a variety of dosage forms – Orals, Creams, Ointments, Injectables, Sprays, Liquids Dosage Forms Dosage Forms
  • 42. • Formulation • India : 15, US : 3 • Canada, Japan, Hungary, Israel, Bangladesh, South Africa, Malaysia, Romania, Egypt, Nigeria and Russia : 1 each • Capacities available for a variety of finished dosages • API • India : 9, Australia : 2, Israel : 1, US : 1, Hungary : 1 42 Manufacturing Facilities 43 manufacturing sites  Tablets / Capsules  Semisolids  Liquids  Suppository  Vials  Ampoules  Pre-filled Syringes  Gels  Lyophilized Units  Dry powder  Eye drops  MDI  Aerosols  Creams  Ointments Injectables / Sterile Orals Topicals
  • 43. 43 Corporate Governance Our philosophy on corporate governance envisages working towards high levels of transparency, accountability and consistent value systems across all facets of operations Chairman Israel Makov Former President & CEO of Teva Pharmaceutical Ind. Ltd. (Retired from board of Sun Pharma w.e.f. 29-Aug-2022) Gautam B. Doshi Independent Director Professional with expertise in M&A, Taxation, Accounting & Corp. and Commercial Laws. Lead Independent Director Independent Director Dr. Pawan Goenka Former MD & CEO of Mahindra & Mahindra Ltd. Rama Bijapurkar Independent management consultant & Professor of Management Practice at IIM, Ahmedabad
  • 45. Financials Market Capitalisation Rs. 2,098 billion / US$ 26 billion (as of 15th Sept 2022) FY18 YoY FY19 YoY FY20 YoY FY21 YoY FY22 YoY P&L Summary Sales 260,659 -14% 286,863 10% 323,252 13% 332,331 3% 384,264 16% Gross Profit 186,413 -16% 208,173 12% 230,947 11% 245,430 6% 280,749 14% EBITDA 56,081 -36% 63,076 12% 69,898 11% 84,914 21% 103,977 22% Net Profit 20,957 -70% 26,654 27% 37,649 41% 29,038 -23% 32,727 13% Net Profit (Adjusted) 33,006 -53% 38,798 18% 40,256 4% 59,317 47% 76,671 29% R&D Spend 22,489 -3% 19,847 -12% 19,739 -1% 21,499 9% 22,194 3% BS Summary Mar'18 YoY Mar'19 YoY Mar'20 YoY Mar'21 YoY Mar'22 YoY Shareholders Funds 383,141 5% 414,091 8% 452,645 9% 464,628 3% 480,112 3% Loan Funds 97,518 21% 98,934 1% 75,783 -23% 35,235 -54% 9,307 -74% Net Fixed Assets 157,110 5% 172,919 10% 175,858 2% 168,322 -4% 171,971 2% Investments 71,430 499% 79,030 11% 101,431 28% 96,125 -5% 128,486 34% Cash and Bank Balances 99,290 -34% 72,760 -27% 64,876 -11% 64,455 -1% 50,334 -22% Inventory 68,810 1% 78,860 15% 78,750 0% 89,970 14% 89,968 0% Sundry Debtors 78,150 9% 88,840 14% 94,212 6% 90,614 -4% 105,929 17% Sundry Creditors 47,660 8% 41,480 -13% 35,836 -14% 39,737 11% 44,793 13% 45 # FY18 - Adjusted for Rs. 12.1 bn provision related to Modafinil settlement & deferred tax adjustment # FY19 - Adjusted for Rs. 12 bn provision related to Modafinil settlement **FY19 - Includes a one-time sales reduction of Rs. 10,850mn related to change in distribution for India business # FY20 - Adjusted for Rs. 2.6 bn provision (related to Dusa US DoJ settlement of Rs. 1.6 bn and Indirect Tax provision of Rs. 1.0 bn in India) # FY21 - Adjusted for Rs. 30.3 bn provision (related to Taro US – DOJ & MDL settlement Rs. 42.2 bn, Rs. 0.9 bn provision related to UK Citalopram case, Rs. 4.1 bn related to deferred tax gain. Taro provisions are adjusted for minority interest) # FY22 - Adjusted for Rs. 43.9 bn provision (for US litigation related to Ranbaxy Meijer & Others Rs. 39,357 mn, Japan (plant) loss Rs. 382 mn, Dexasite impairment Rs. 1,503 mn., US MDL (Taro) Rs. 3,465 mn (after adjusting for Taro minority of Rs 960 mn) & Deferred Tax gain = Rs. 5,178 mn offset by MAT Credit reversal of Rs.4,410 mn). # # ( All Figures in Rs. Mn ) # # ** #
  • 46. 46 Sales Break-up 80 73 97 103 128 87 107 105 101 114 48 54 55 58 67 30 35 45 49 55 15 18 20 21 21 FY18 FY19 FY20 FY21 FY22 India Formulations US Formulations Emerging Markets Rest of World API+Others 384 Sales In Rs Billion 332 323 287 261
  • 47. 47 EBITDA Trend 21.2% 21.7% 21.3% 25.3% 26.9% 31.0% 30.8% 31.8% 28.5% 28.0% 20.6% 20.8% 19.7% 20.6% 19.0% 28.5% 27.4% 28.6% 26.1% 26.9% FY18 FY19 FY20 FY21 FY22 EBITDA Other Expenditure Personnel Costs Material Costs % of Sales 261 287 323 332 384 Sales In Rs Billion
  • 48. Net Cash (Excluding Debt) (Rs. Bn) Net Cash From Operating Activities (Rs. Bn) 48 Cash Flow & Debt 39.1 22.0 65.5 61.7 89.8 FY18 FY19 FY20 FY21 FY22 19.5 -10.2 50.1 50.0 74.9 FY18 FY19 FY20 FY21 FY22 Free Cash Flow (Rs. Bn) 103.6 104.8 82.2 35.2 9.3 FY18 FY19 FY20 FY21 FY22 Gross Debt (Rs. Bn) 45.0 34.7 69.5 103.0 149.2 FY18 FY19 FY20 FY21 FY22
  • 49. FY18 FY19 FY20 FY21 FY22 Growth (%) Sales (13.9) 10.1 12.7 2.8 15.6 Gross Profit (15.8) 11.7 10.9 6.3 14.4 EBITDA (44.4) 12.5 10.8 21.5 22.5 Net Profit (69.9) 27.2 41.3 (22.9) 12.7 Net Profit (Adjusted) (52.6) 17.5 3.8 47.4 29.3 Margins (%) Gross Margin 71.5 72.6 71.4 73.9 73.1 EBITDA Margin (%) 21.2 21.7 21.3 25.3 26.9 Net Margin 8.0 9.3 11.6 8.7 8.5 Net Margin (Adjusted) 12.7 13.5 12.5 17.8 20.0 Return (%) ROCE 11.1 11.8 11.0 13.5 16.4 ROE 8.7 9.4 9.1 12.5 15.0 Others Debt / Equity 0.25 0.24 0.17 0.08 0.02 Fully Diluted EPS 8.7 11.1 15.7 12.1 13.6 Fully Diluted EPS (Adjusted) 13.8 16.2 16.8 24.7 32.0 R&D Spend % of Net Sales 8.6 6.9 6.1 6.5 5.8 Revenue 7.9 6.6 6.0 6.4 5.6 Capital 0.7 0.3 0.1 0.1 0.2 49 Financial Ratios # # # # # # # # # # # # ** # FY18 - Adjusted for Rs. 12.1 bn provision related to Modafinil settlement & deferred tax adjustment # FY19 - Adjusted for Rs. 12 bn provision related to Modafinil settlement **FY19 - Includes a one-time sales reduction of Rs. 10,850mn related to change in distribution for India business # FY20 - Adjusted for Rs. 2.6 bn provision (related to Dusa US DoJ settlement of Rs. 1.6 bn and Indirect Tax provision of Rs. 1.0 bn in India) # FY21 - Adjusted for Rs. 30.3 bn provision (related to Taro US – DOJ & MDL settlement Rs. 42.2, Rs. 0.9 bn provision related to UK Citalopram case, Rs. 4.1 bn related to deferred tax gain. Taro provisions are adjusted for minority interest) # FY22 - Adjusted for Rs. 43.9 bn provision (for US litigation related to Ranbaxy Meijer & Others Rs. 39,357 mn, Japan (plant) loss Rs. 382 mn, Dexasite impairment Rs. 1,503 mn., US MDL (Taro) Rs. 3,465 mn (after adjusting for Taro minority of Rs 960 mn) & Deferred Tax gain = Rs. 5,178 mn offset by MAT Credit reversal of Rs.4,410 mn) # # #
  • 50. Q1 FY23 Q1 FY22 CHANGE FY22 FY21 CHANGE Gross Sales 106,440 96,694 10.1% 384,264 332,331 15.6% Gross Profit 77,438 70,200 10.3% 280,749 245,430 14.4% Gross Margin 72.8% 72.6% 73.1% 73.9% EBITDA 28,844 28,211 2.2% 103,977 84,914 22.5% EBITDA Margin 26.8% 29.0% 26.9% 25.3% Net Profit 20,609 14,442 42.7% 32,727 29,038 12.7% Net margin 19.4% 14.9% 8.5% 8.7% Net Profit (Adjusted) 20,609 19,792 4.1% 76,671 59,317 29.3% Net margin (Adjusted) 19.4% 20.5% 20.0% 17.8% R&D 4,608 5,926 -22.2% 22,194 21,499 3.2% R&D as % of Net Sales 4.3% 6.1% 5.8% 6.5% EPS (Diluted) INR 8.6 6.0 42.7% 13.6 12.1 12.7% EPS (Diluted) INR (Adjusted) 8.6 8.2 4.1% 32.0 24.7 29.3% 50 Key Financials Q1 FY23 ( All Figures in Rs. Mn ) # Q1FY22- Adjusted for Rs. 5.3 bn provision (related to (i) US MDL (Taro) =Rs. 4,425 mn (ii) Japan (plant)=Rs. 382 mn (iii) Dexasite impairment=Rs. 1,503 mn. (after adjusting for Taro minority of Rs 960 mn) # FY21 - Adjusted for Rs. 30.3 bn provision (related to Taro US – DOJ & MDL settlement Rs. 42.2, Rs. 0.9 bn provision related to UK Citalopram case, Rs. 4.1 bn related to deferred tax gain. Taro provisions are adjusted for minority interest) # FY22 - Adjusted for Rs. 43.9 bn provision (for US litigation related to Ranbaxy Meijer & Others Rs. 39,357 mn, Japan (plant) loss Rs. 382 mn, Dexasite impairment Rs. 1,503 mn., US MDL (Taro) Rs. 3,465 mn (after adjusting for Taro minority of Rs 960 mn) & Deferred Tax gain = Rs. 5,178 mn offset by MAT Credit reversal of Rs.4,410 mn) # # # # # #
  • 51. Q1 FY23 Q1 FY22 CHANGE FY22 FY21 CHANGE Formulation India 33,871 33,084 2.4% 127,593 103,432 23.4% US 32,437 28,000 15.8% 113,737 100,921 12.7% Emerging Markets 18,911 16,053 17.8% 67,432 57,840 16.6% ROW 14,678 13,680 7.3% 54,545 48,956 11.4% Sub-total 99,897 90,816 10.0% 363,306 311,149 16.8% ÀPI 5,987 5,149 16.3% 18,354 19,504 -5.9% Others 556 729 -23.8% 2,604 1,679 55.1% Gross Sales 106,440 96,694 10.1% 384,264 332,331 15.6% 30% 32% 18% 14% 6% 51 Sales Breakup Q1FY23 ( All Figures in Rs. Mn ) US Formulations India Branded Generics Emerging Markets Rest of World API & Others 29% 34% 17% 14% 6% Q1 FY23 Q1 FY22 # ROW includes Western Europe, Canada, Japan, Australia, New Zealand, Israel and other markets #
  • 52. Key Milestones targeted for future 52 • Enhance share of specialty/branded business • Continue to focus on complex generics and high entry barrier segments • Ensure broad product offering to customers across multiple dosage forms US Business US Business • Focus on productivity enhancement • Maintain leadership position in a fiercely competitive market • Continuously innovate to ensure high brand equity with doctors • Continue to evaluate in-licensing opportunities for latest generation patented products India Business India Business • Gain critical mass in key markets • Enhance product basket in emerging markets • Focus on profitable growth EM & RoW Business EM & RoW Business • Maintain leadership in existing markets through focus on innovative solutions • Enhance presence in high growth markets Global Consumer Healthcare Global Consumer Healthcare
  • 53. Key Milestones targeted for future 53 • Unwavering focus on Sustainability, built on a legacy rooted in caring for people, communities and the planet. • Committed to Governance, Community Upliftment, Access to Affordable Healthcare & Environment Conservation Sustainability Sustainability • Focus on developing complex products across multiple dosage forms • Invest to further build the specialty pipeline R&D R&D • Ensuring 24x7 compliance to cGMP • Continuously enhance systems, processes, human capabilities to ensure compliance with global regulatory standards Regulatory/ Quality Regulatory/ Quality • Target high-single digit to low double-digit consolidated topline growth for FY23 • Focus on sustainable and profitable growth • Focus on improving overall return ratios Financial Financial
  • 54. 54 Sun Pharma at a glance 4th Largest Global Specialty Generic Company* 4th Largest Global Specialty Generic Company* • Ranked 8th in US Generics Market## US US • No. 1 Pharma Company in India India India • Amongst the largest Indian Pharma Company in Emerging Markets Emerging Markets Emerging Markets • Expanding presence in Rest of World markets Rest of World Markets Rest of World Markets • 43 manufacturing sites across the world Manufacturing Footprint Manufacturing Footprint • Presence in more than 100 countries across branded and generic markets Market Presence Market Presence • 38,000+ global employee base Employees Employees • Multiple manufacturing facilities approved by various regulatory authorities across the world including USFDA Quality Compliance Quality Compliance • Capabilities across dosage forms like injectables, sprays, ointments, creams, liquids, tablets and capsules R&D and Manufacturing R&D and Manufacturing • Specialty products, branded generics, generics & APIs Addressable Segments Addressable Segments *Source: Evaluate Pharma Estimates for 12 months ended Dec 2021 ## Source: IQVIA data for 12 months ended April 2022
  • 55. Thank You Investors: Nimish Desai Tel : +91 22 4324 4324, Ext 2778 Tel Direct +91 22 4324 2778 nimish.desai@sunpharma.com Thank You! For more information please contact: 55 © 2017 Sun Pharmaceutical Industries Limited., All Rights Reserved. “SUN Pharma”, The Sun Pharmaceutical Industries Logo are trademarks of Sun Pharmaceutical Industries Limited. This material was used during an oral presentation; it is not a complete record of the discussion. This work may not be used, sold, transferred, adapted, abridged, copied or reproduced in whole on or in part in any manner or form or in any media without the prior written consent. All product names and company names and logos mentioned herein are the trademarks or registered trademarks of their respective owners. Corporate Address: SUN HOUSE, CTS No. 201 B/1, Western Express Highway, Goregaon (E), Mumbai 400063 NSE:SUNPHARMA, BSE: 524715, Reuters: SUN.BO, Bloomberg: SUNP IN CIN: L24230GJ1993PLC019050 www.sunpharma.com