Download to read offline

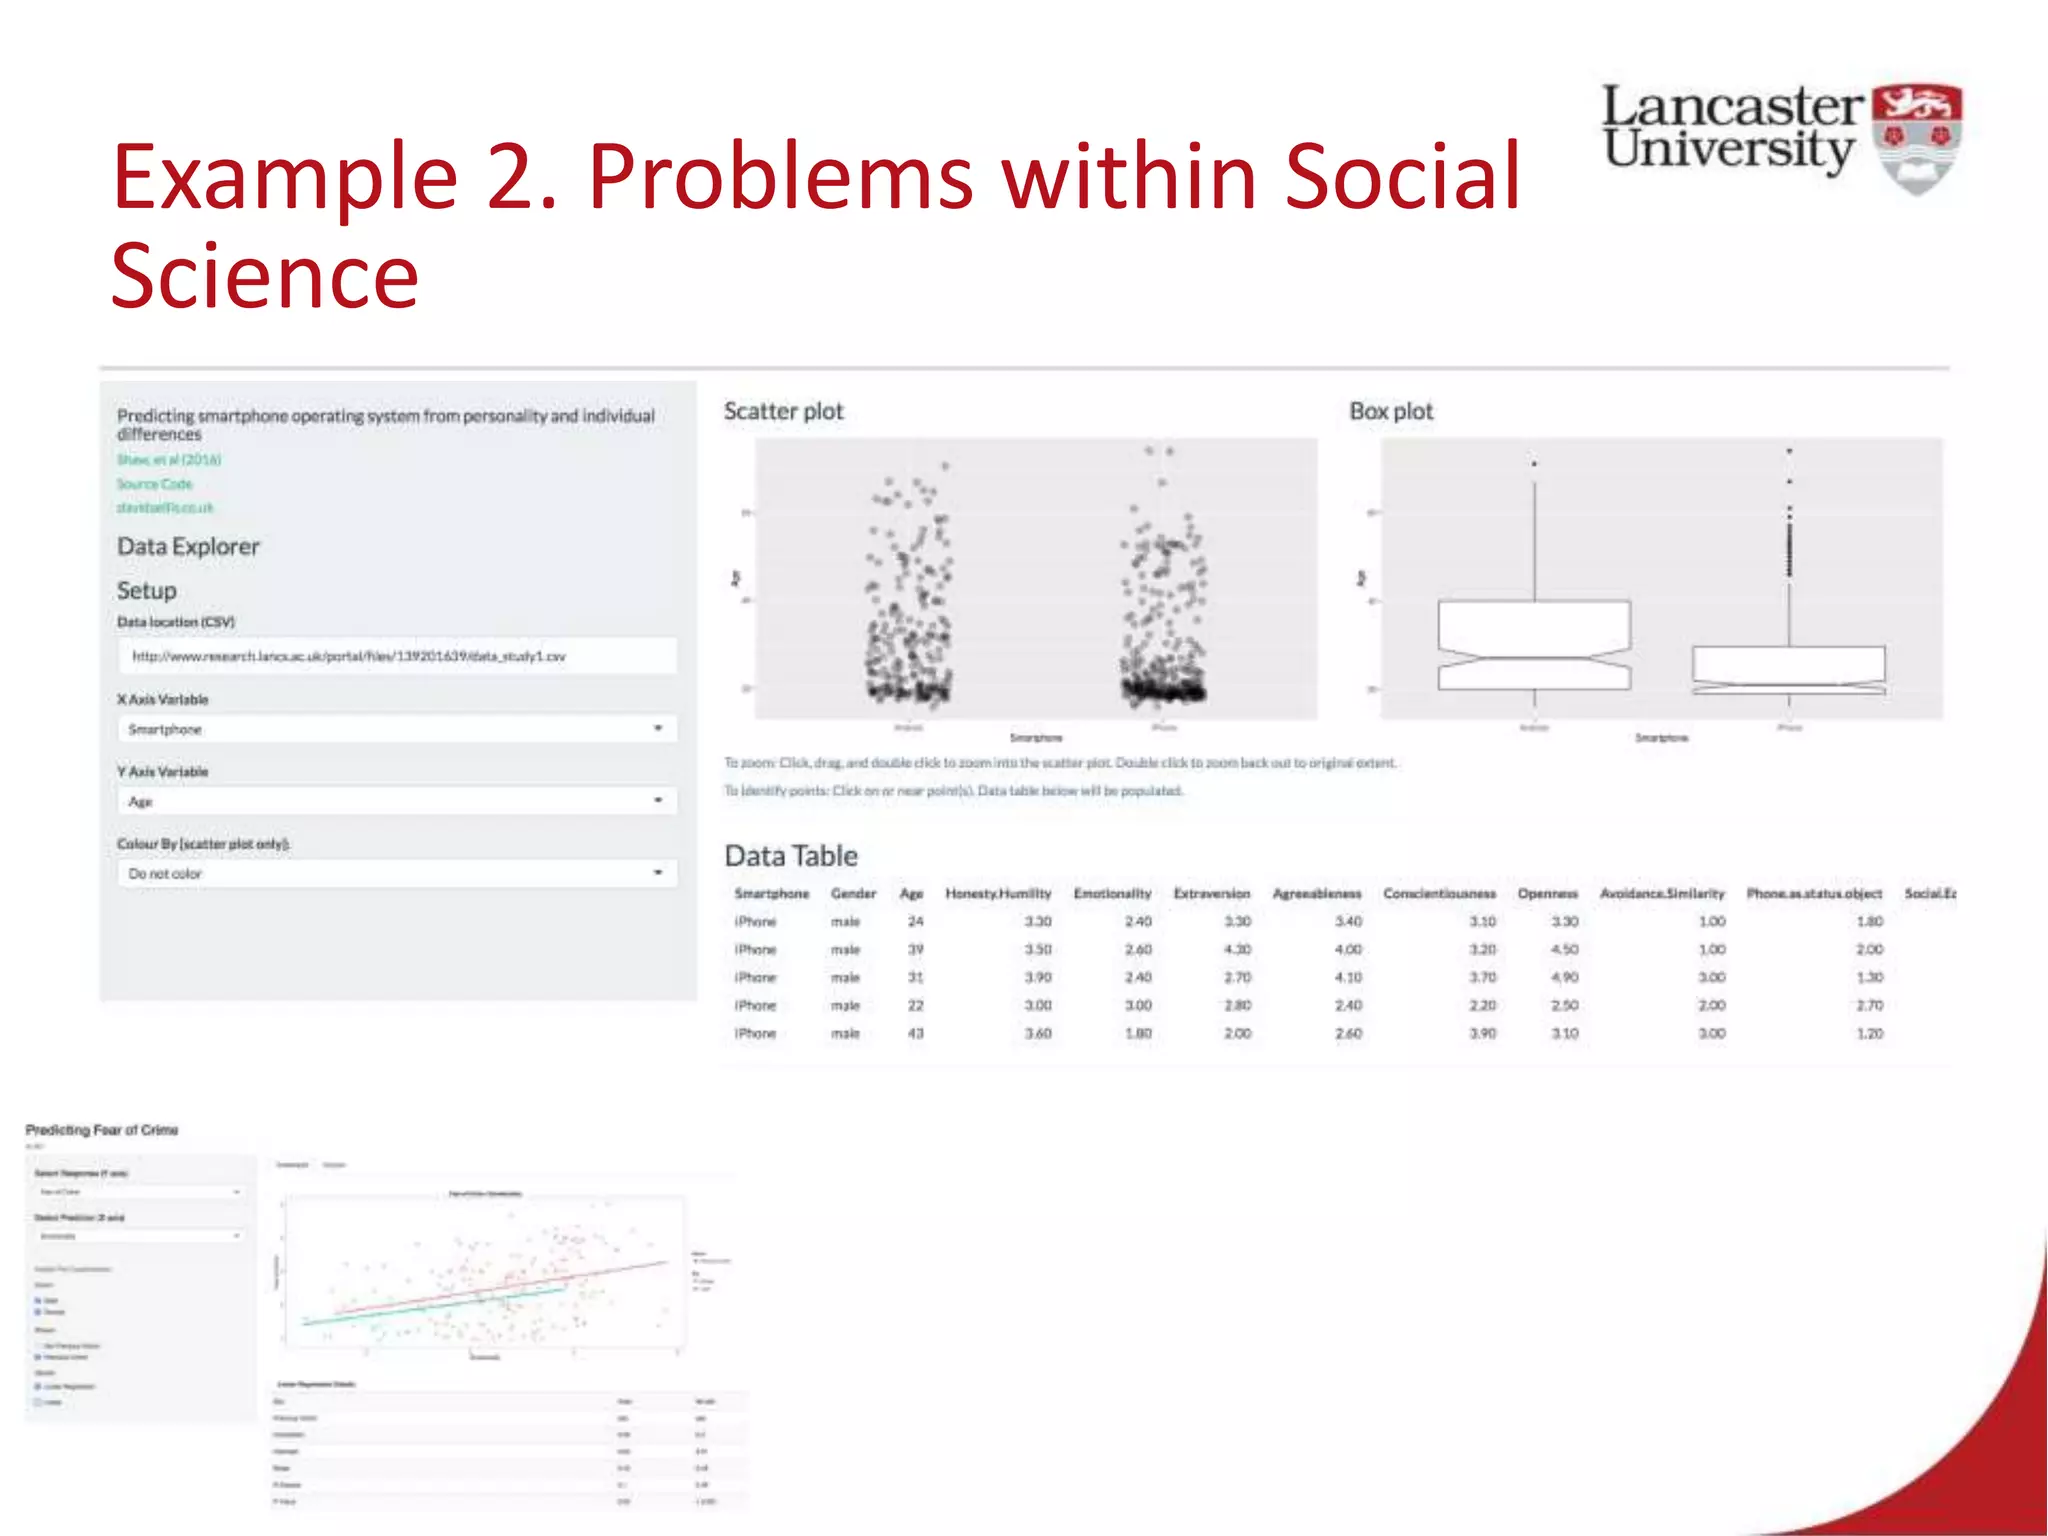

This document introduces Jude Towers and David Ellis, who are lecturers focused on quantitative methods and computational social science. They discuss how data can be messy, including inconsistencies in concepts and definitions, difficulties in data collection, and the politics of data cleaning. They argue that while data is imperfect, it is still useful for understanding society when the signal is distinguished from the noise. They provide two examples of working with messy real-world data: administrative health records from the NHS and social science replication problems. Their overall goal is to help people critically engage with quantitative data.


