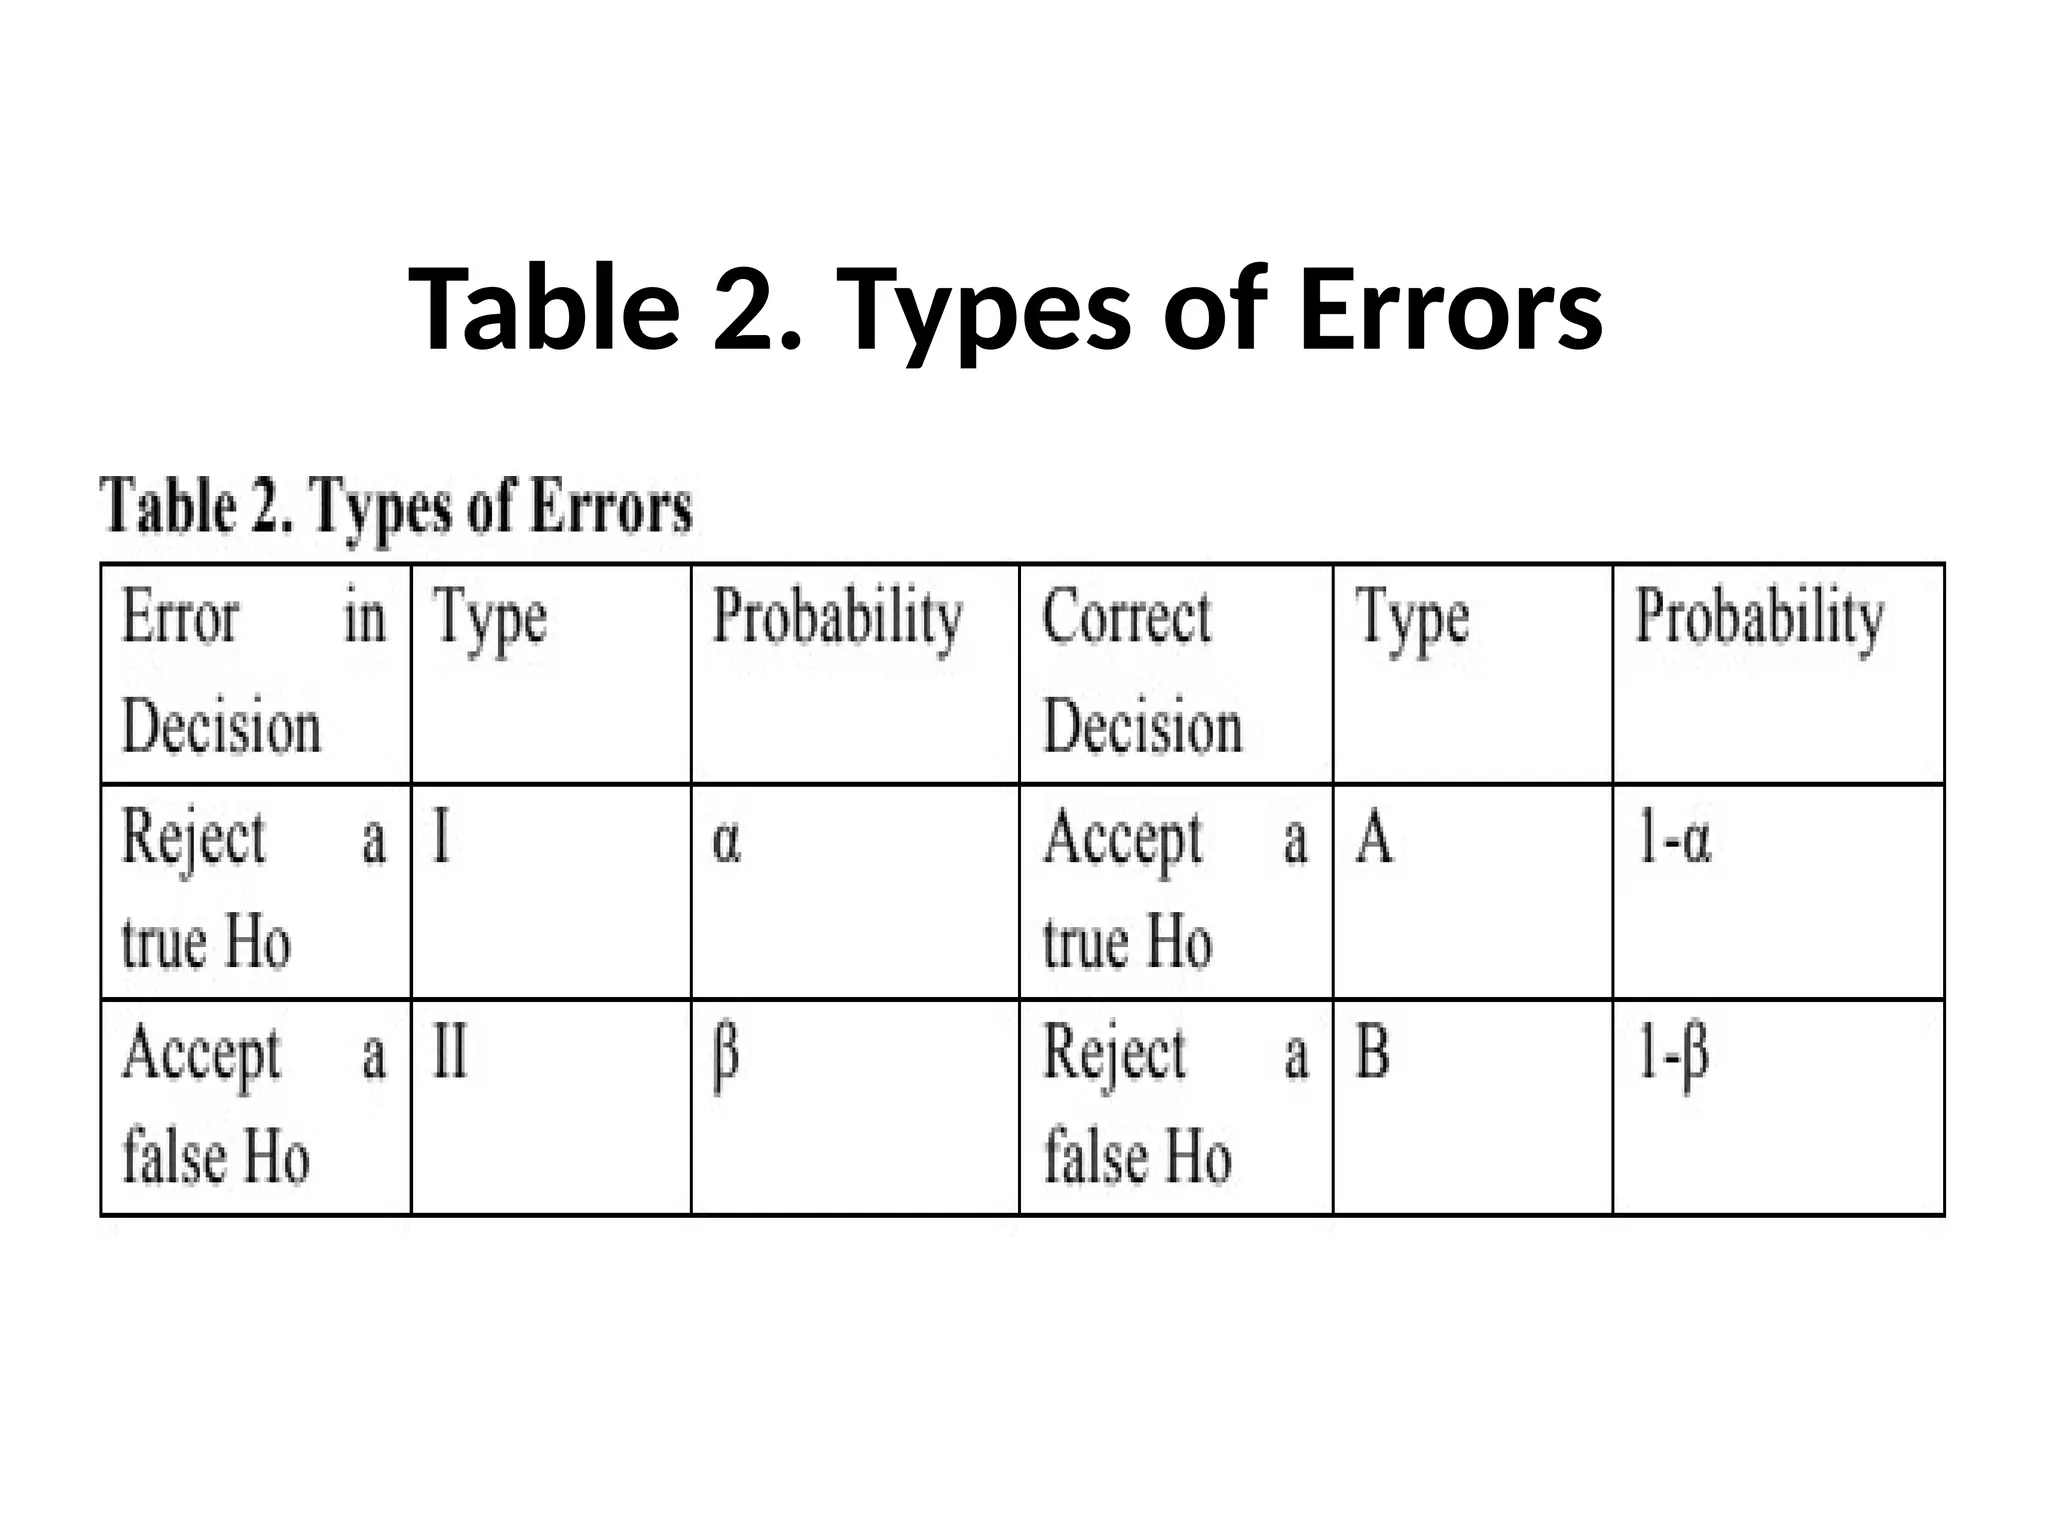
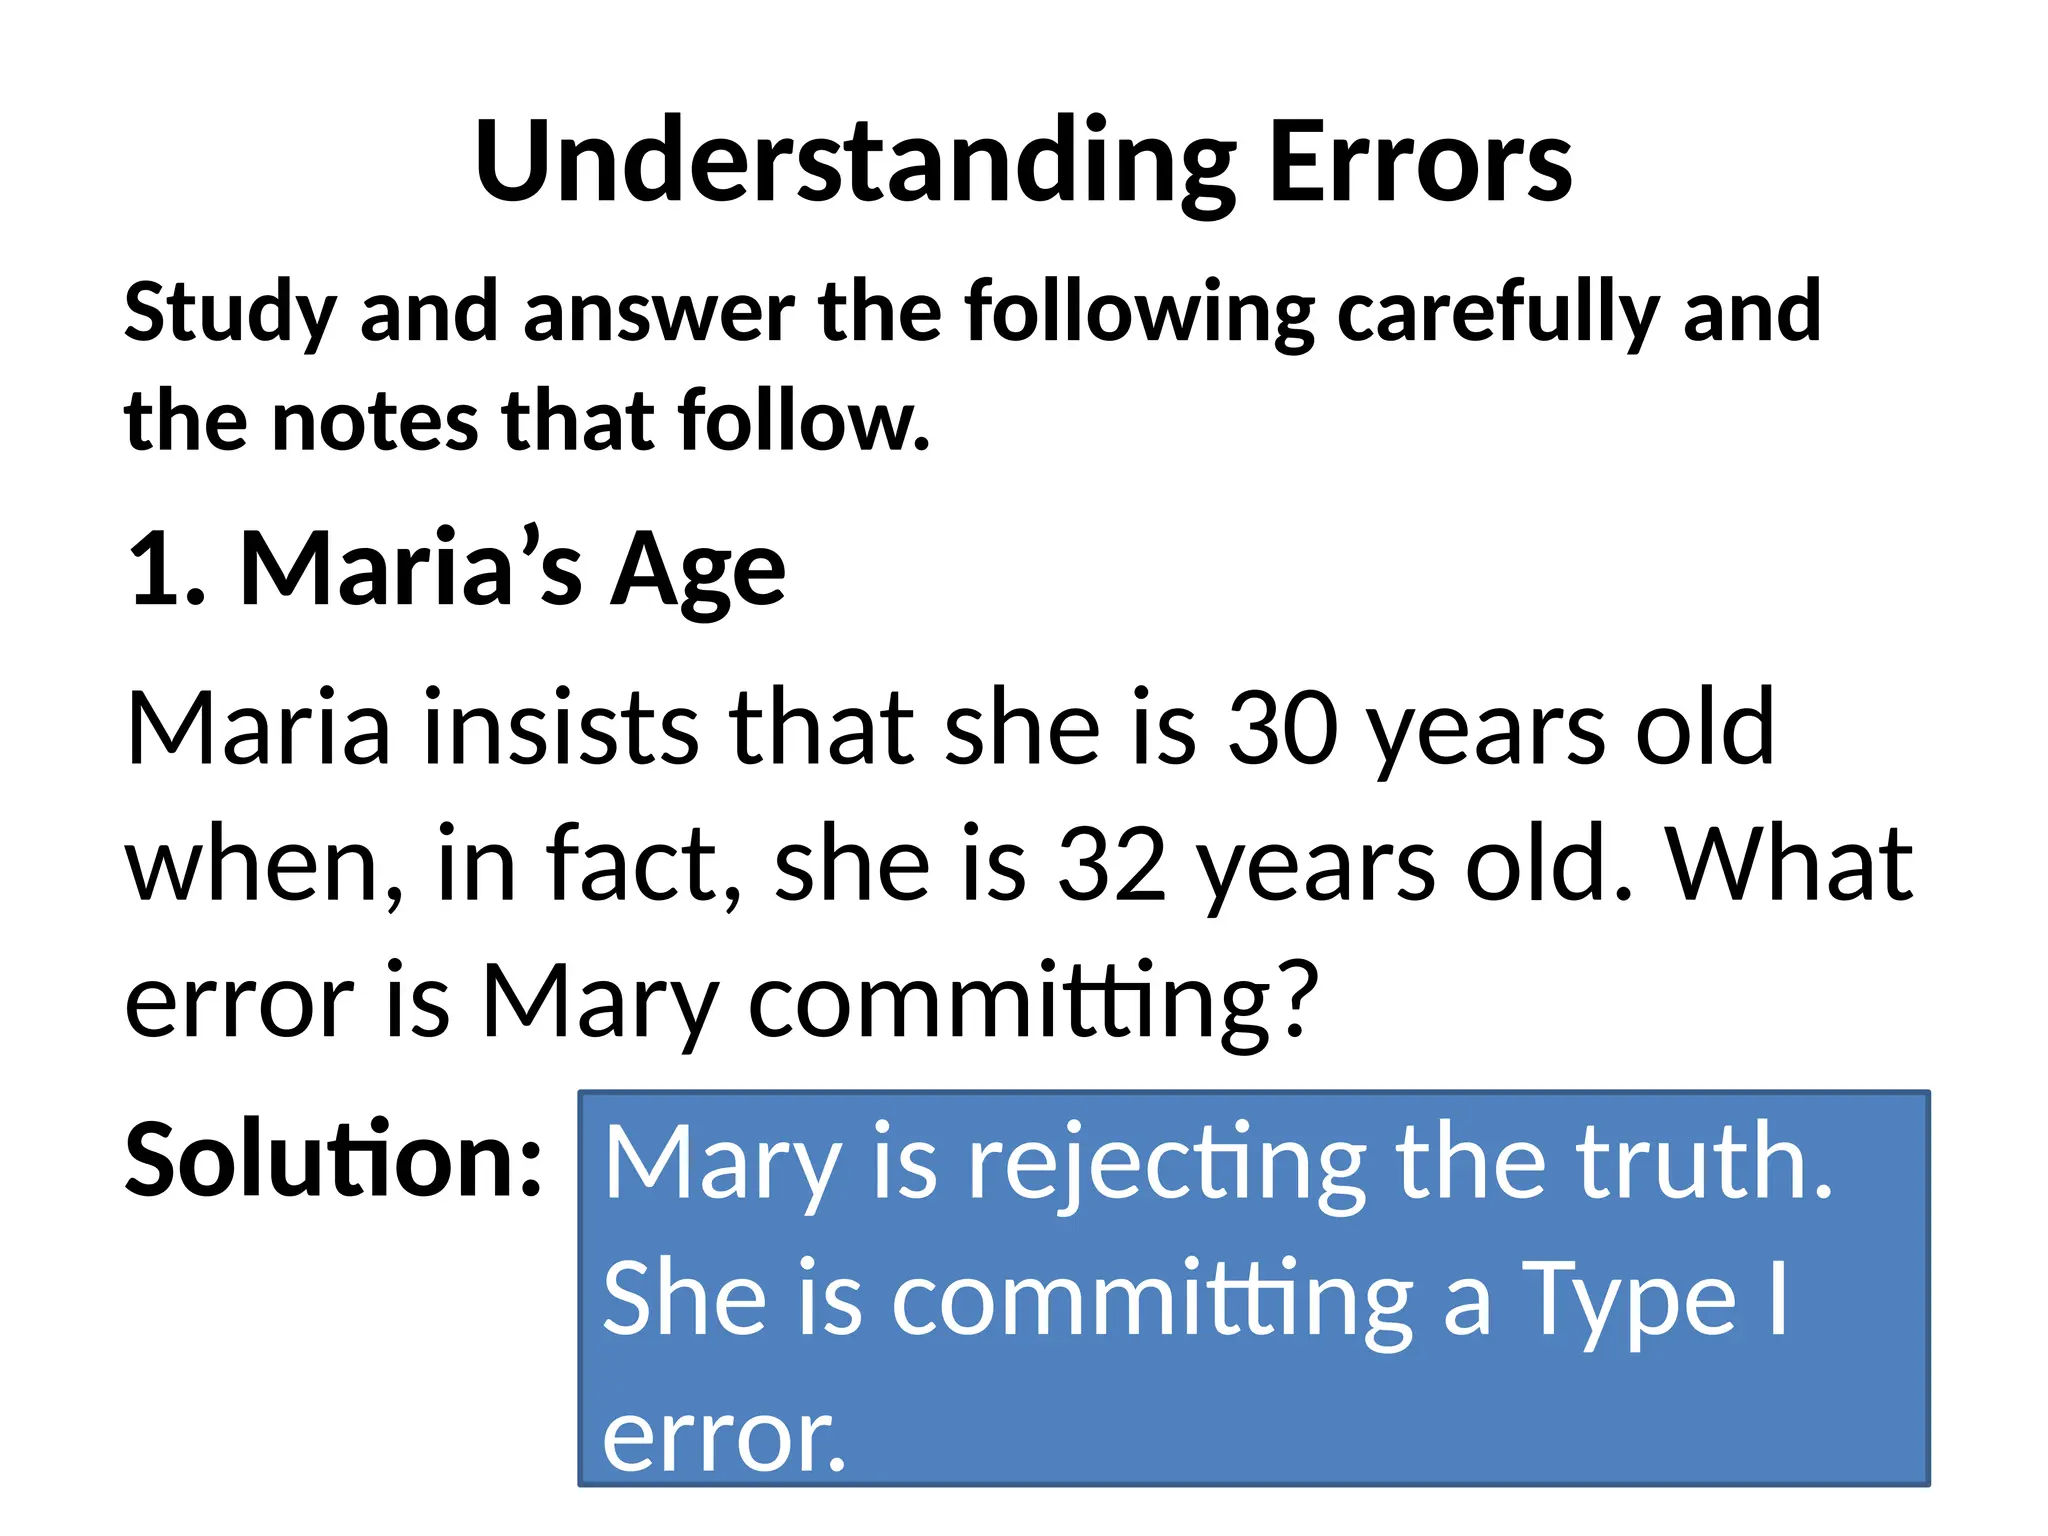
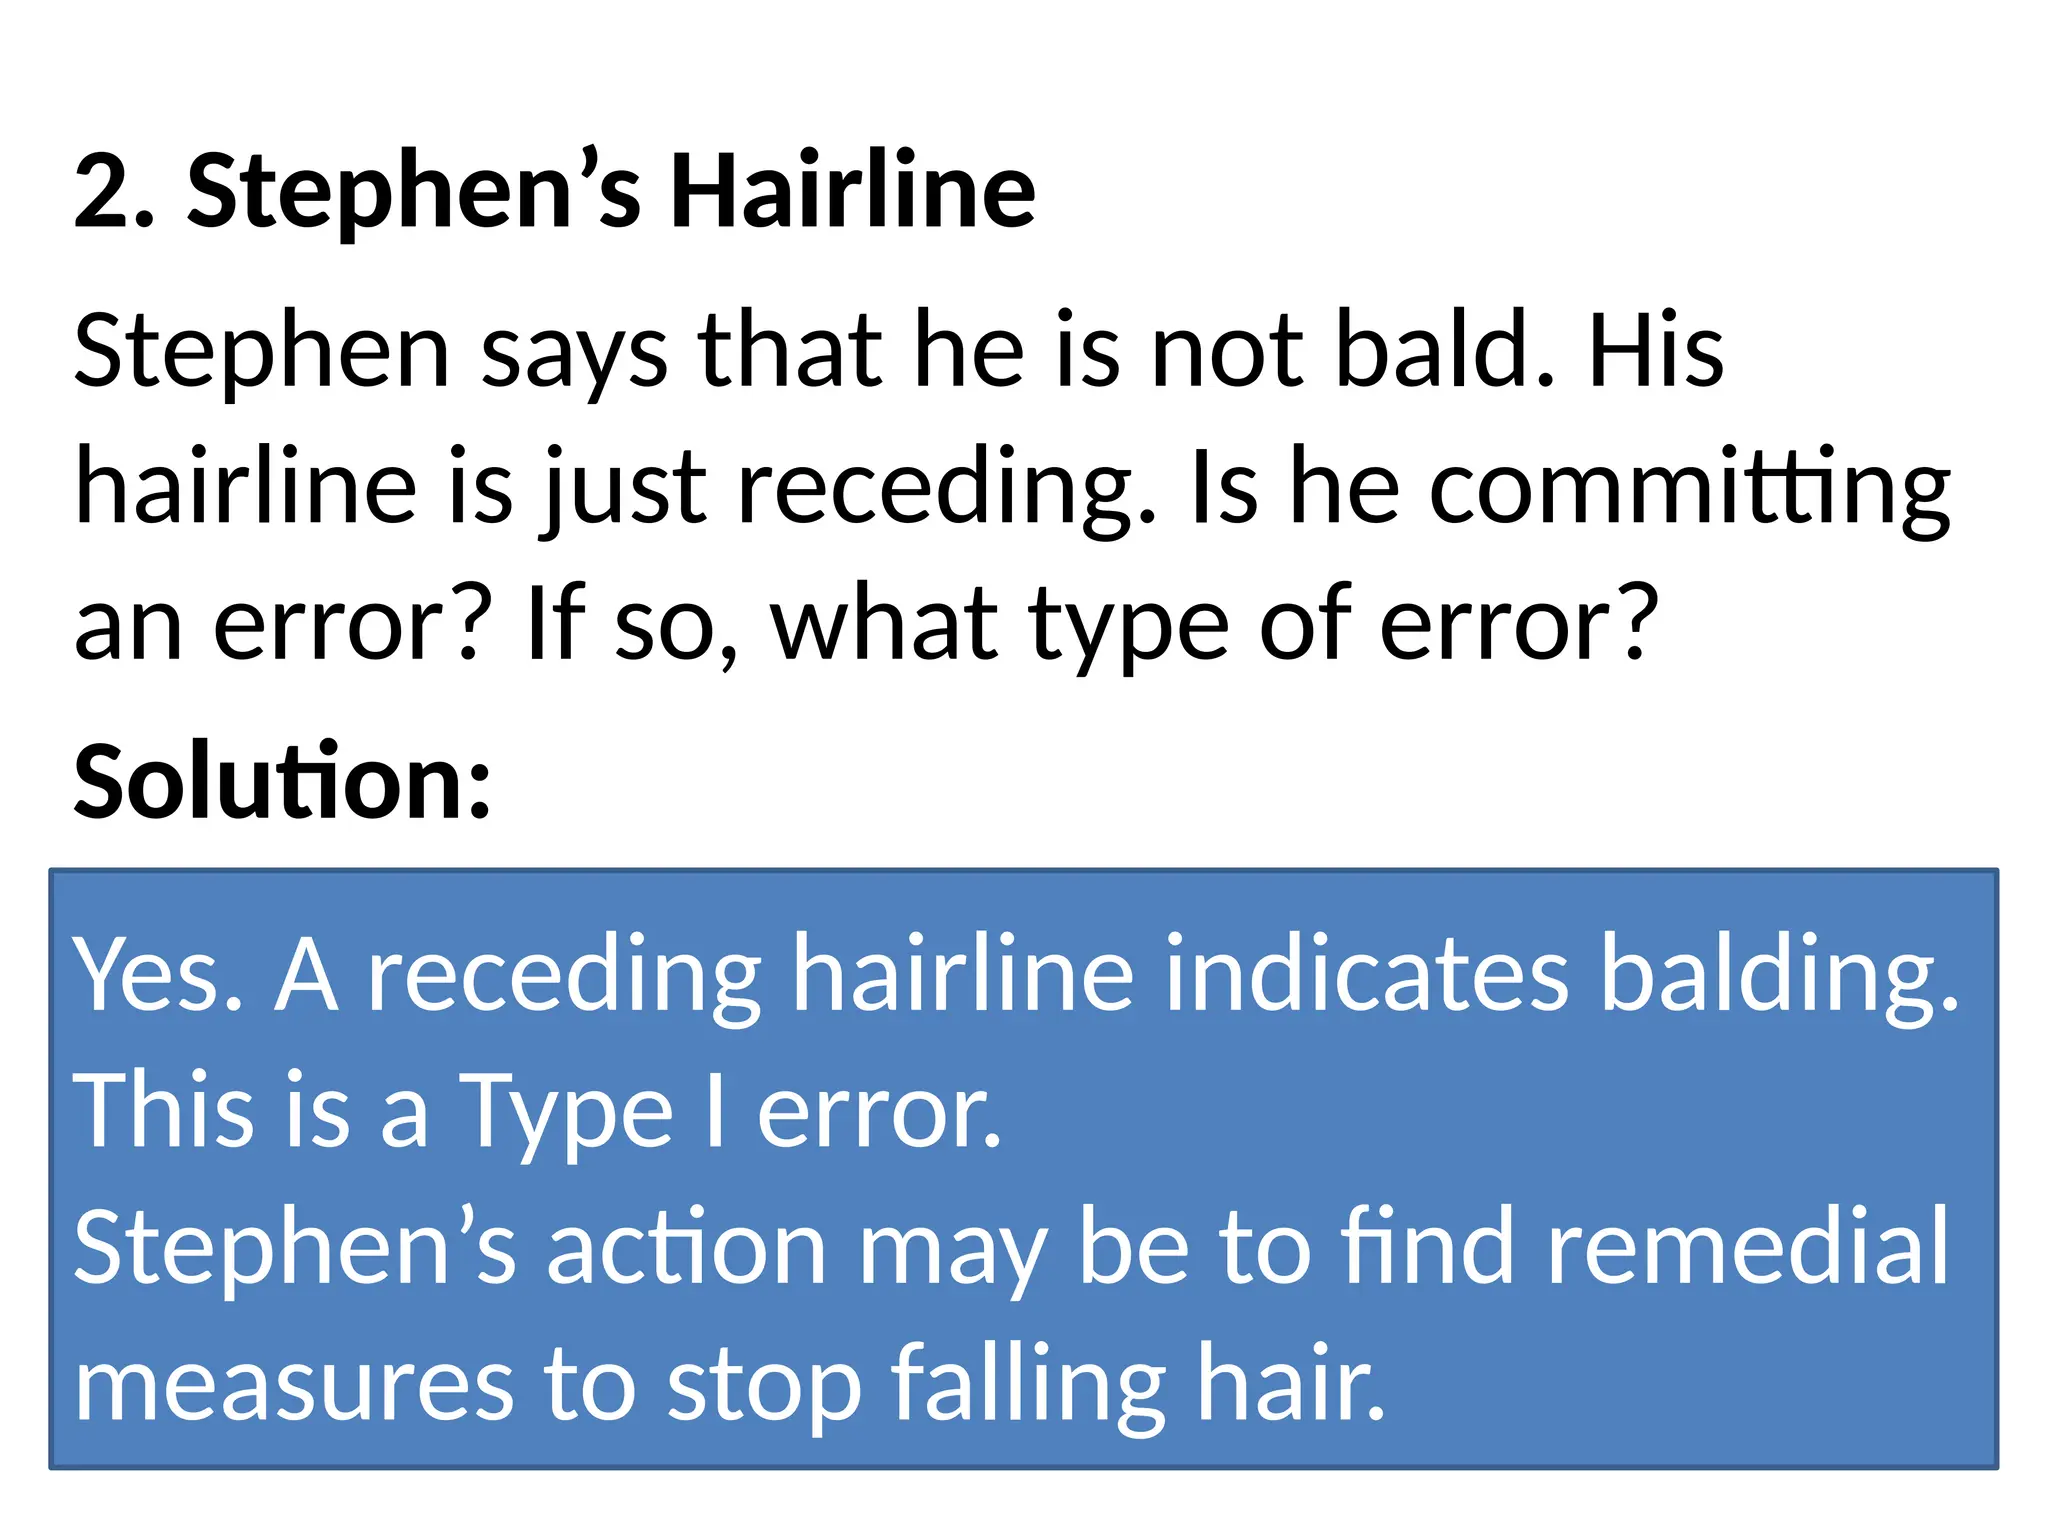
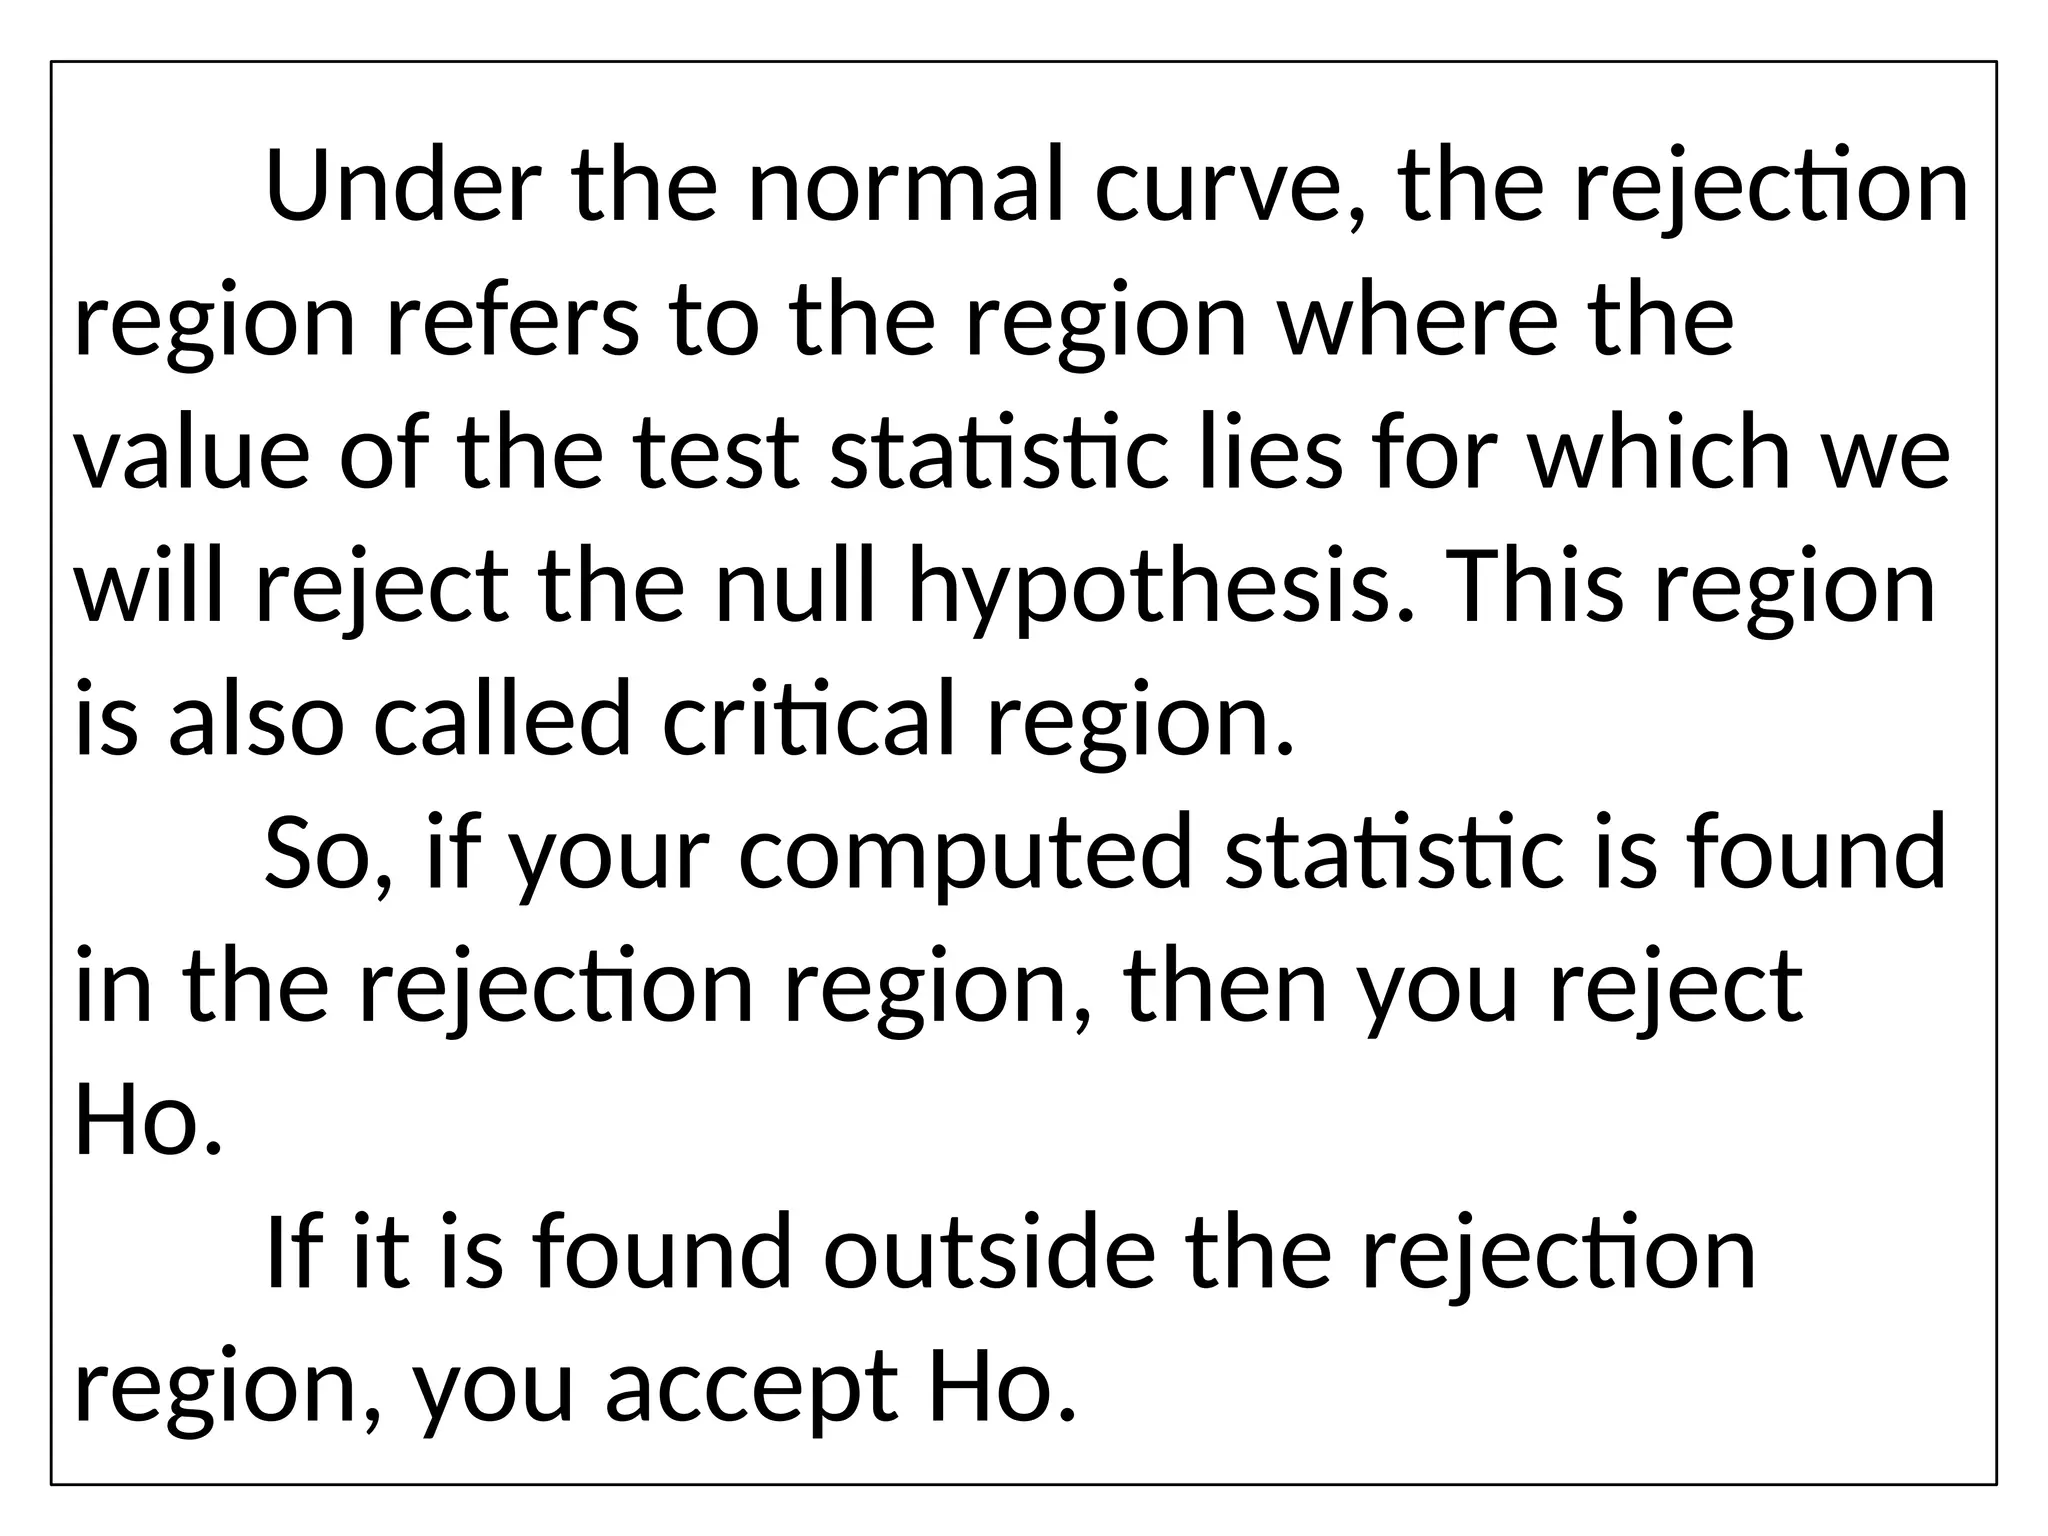
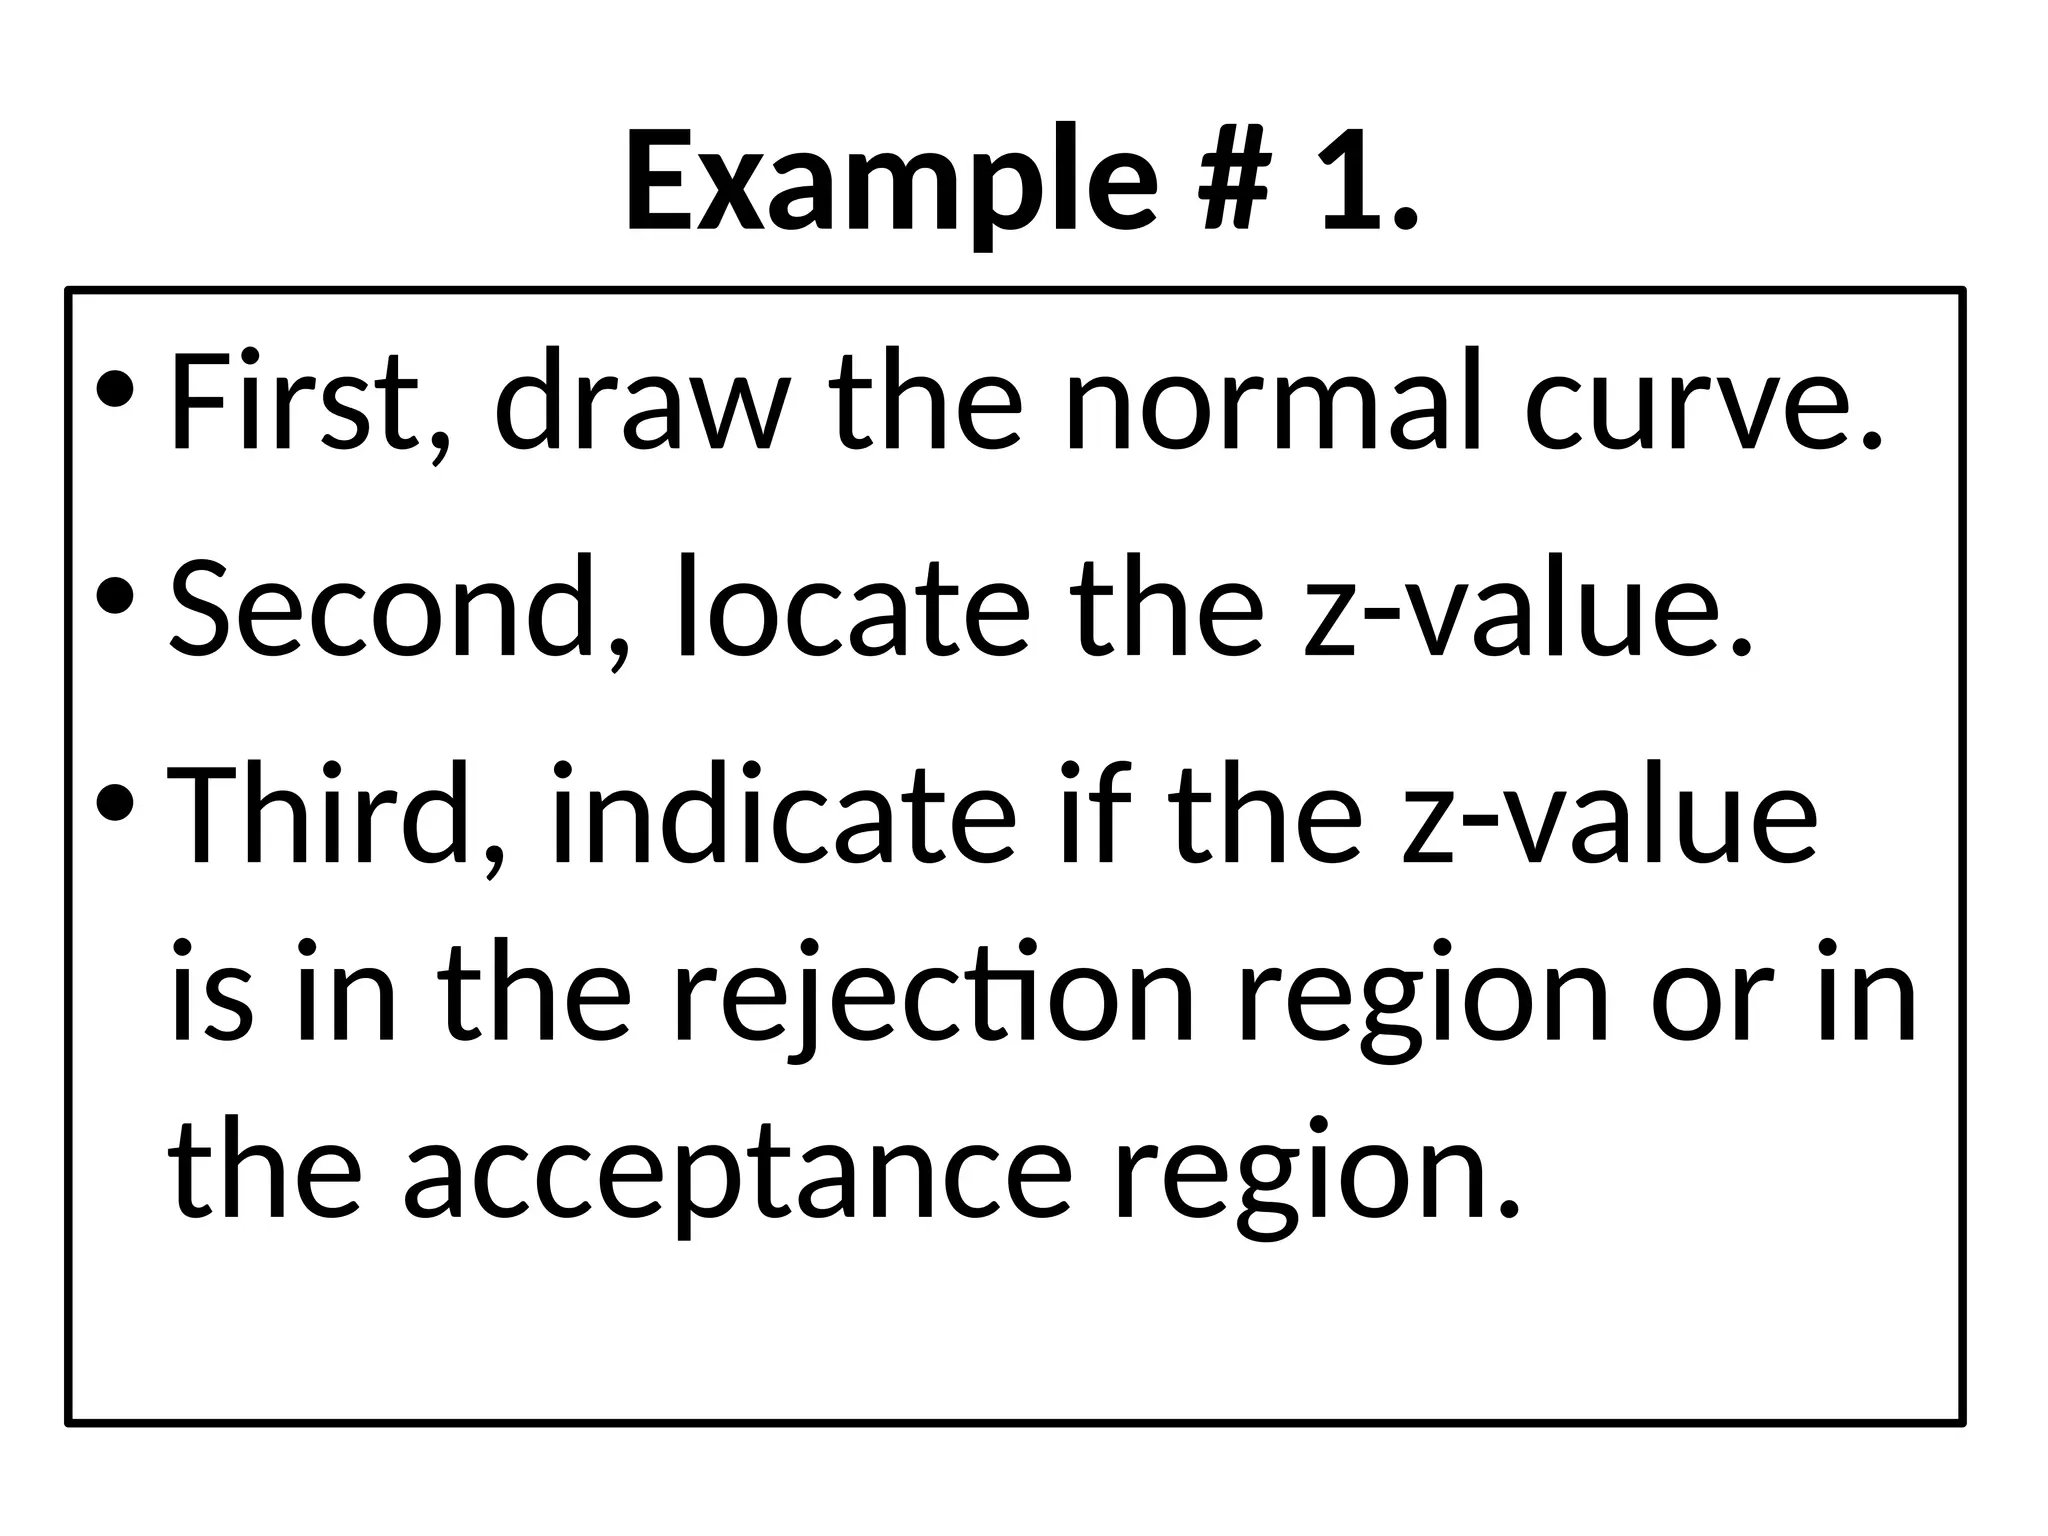
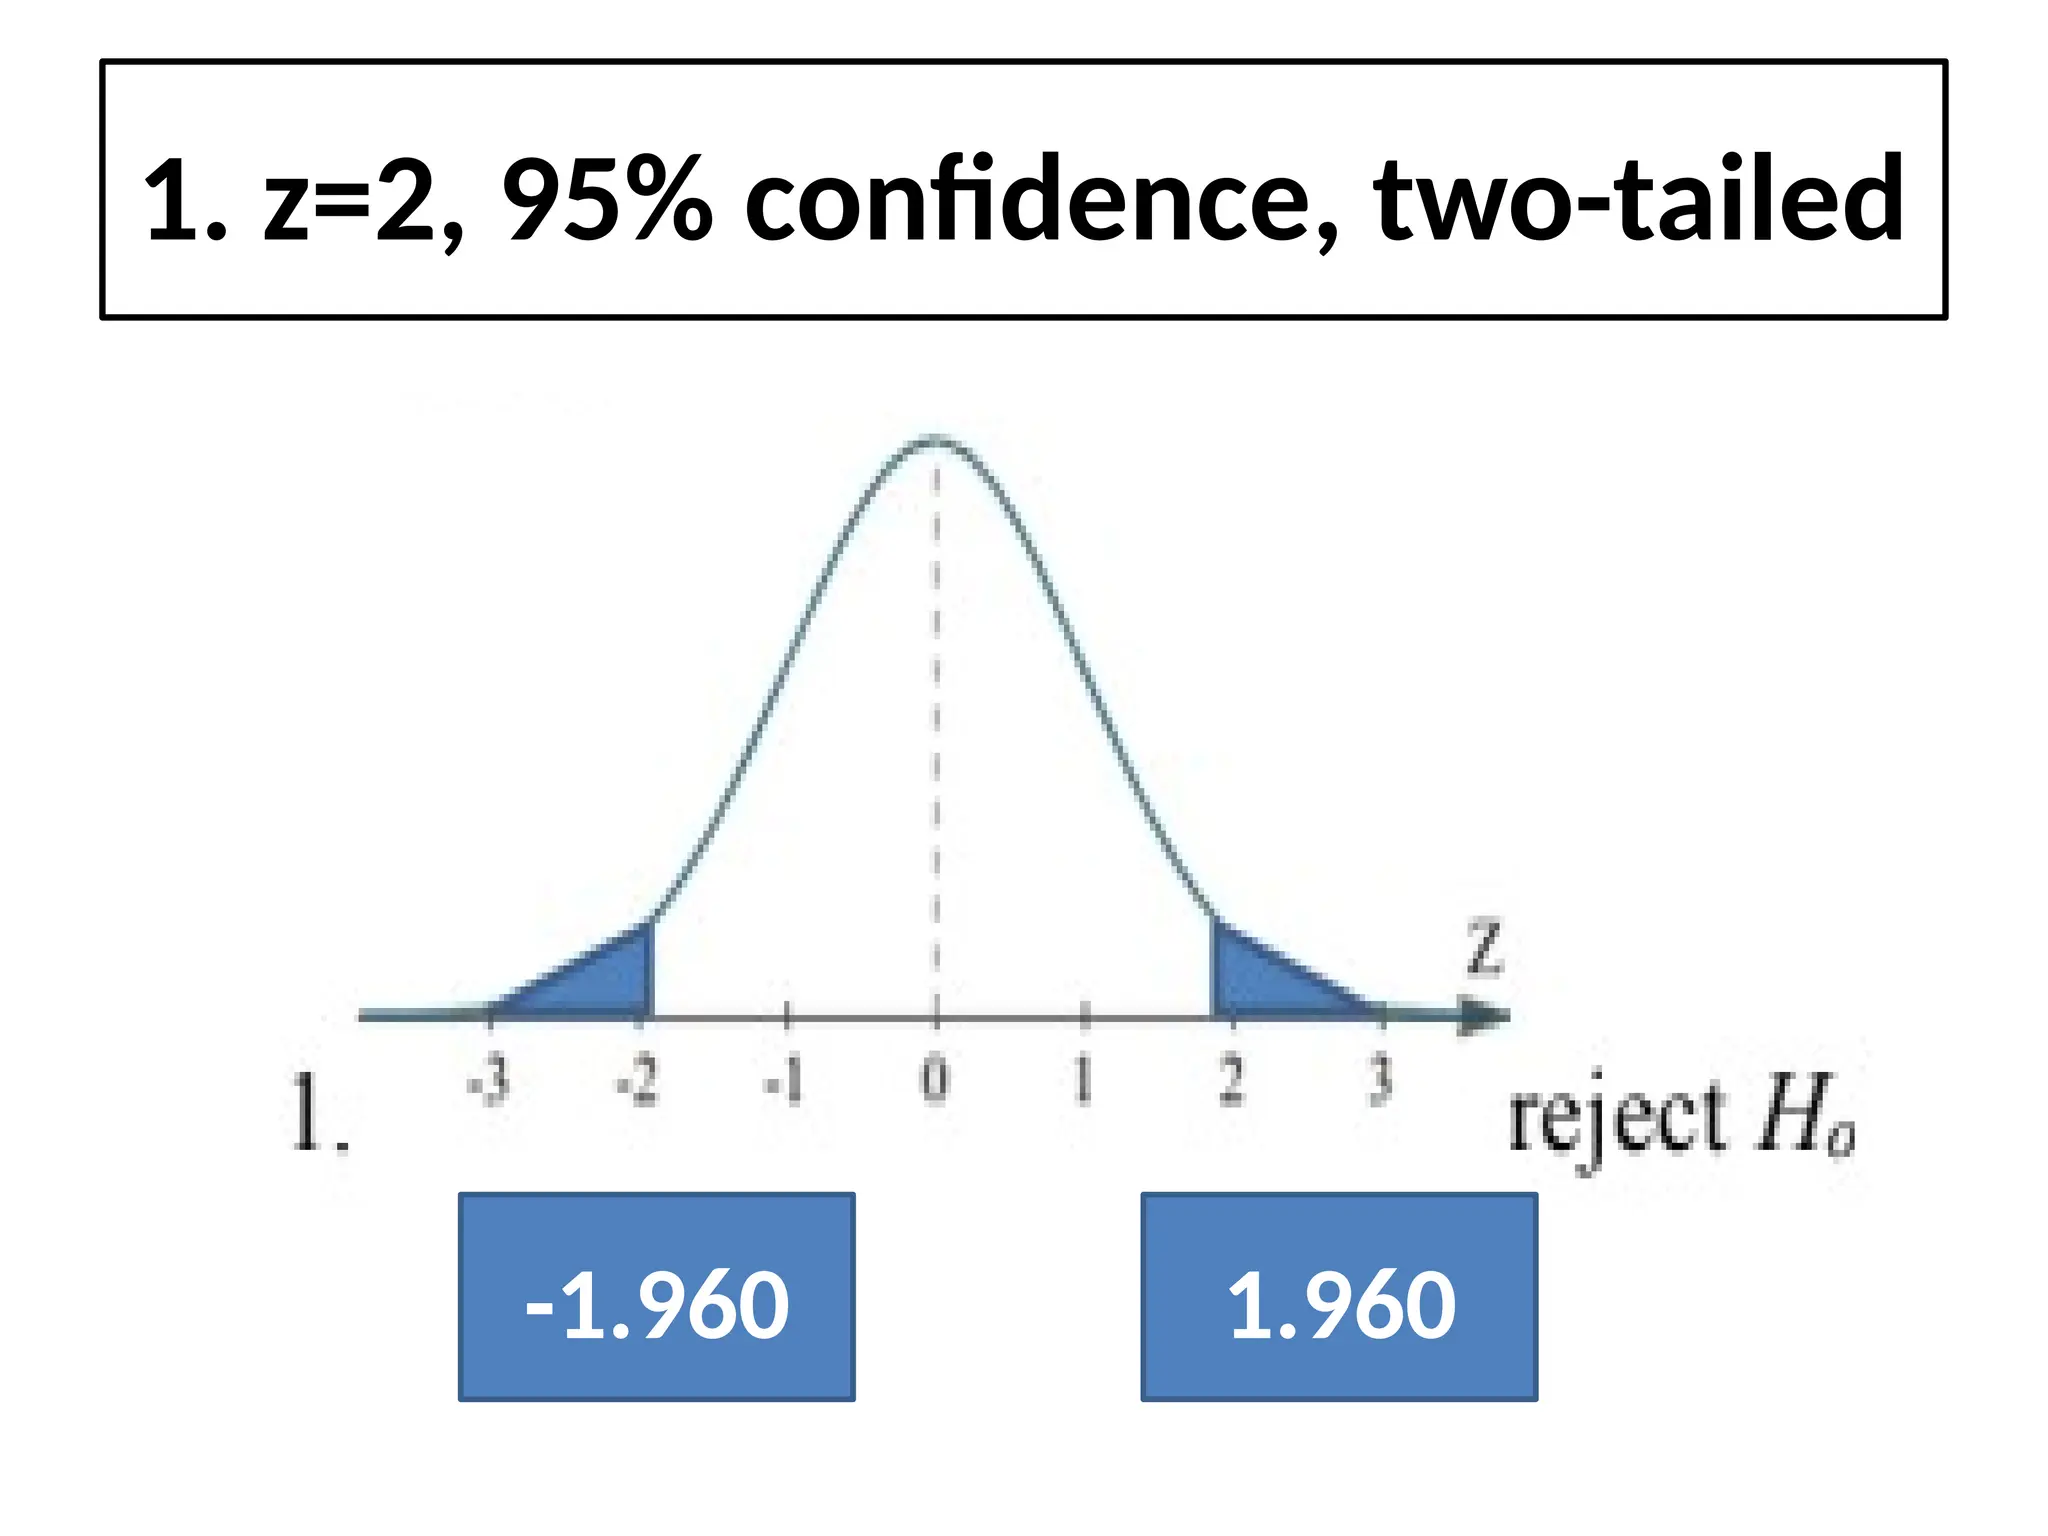
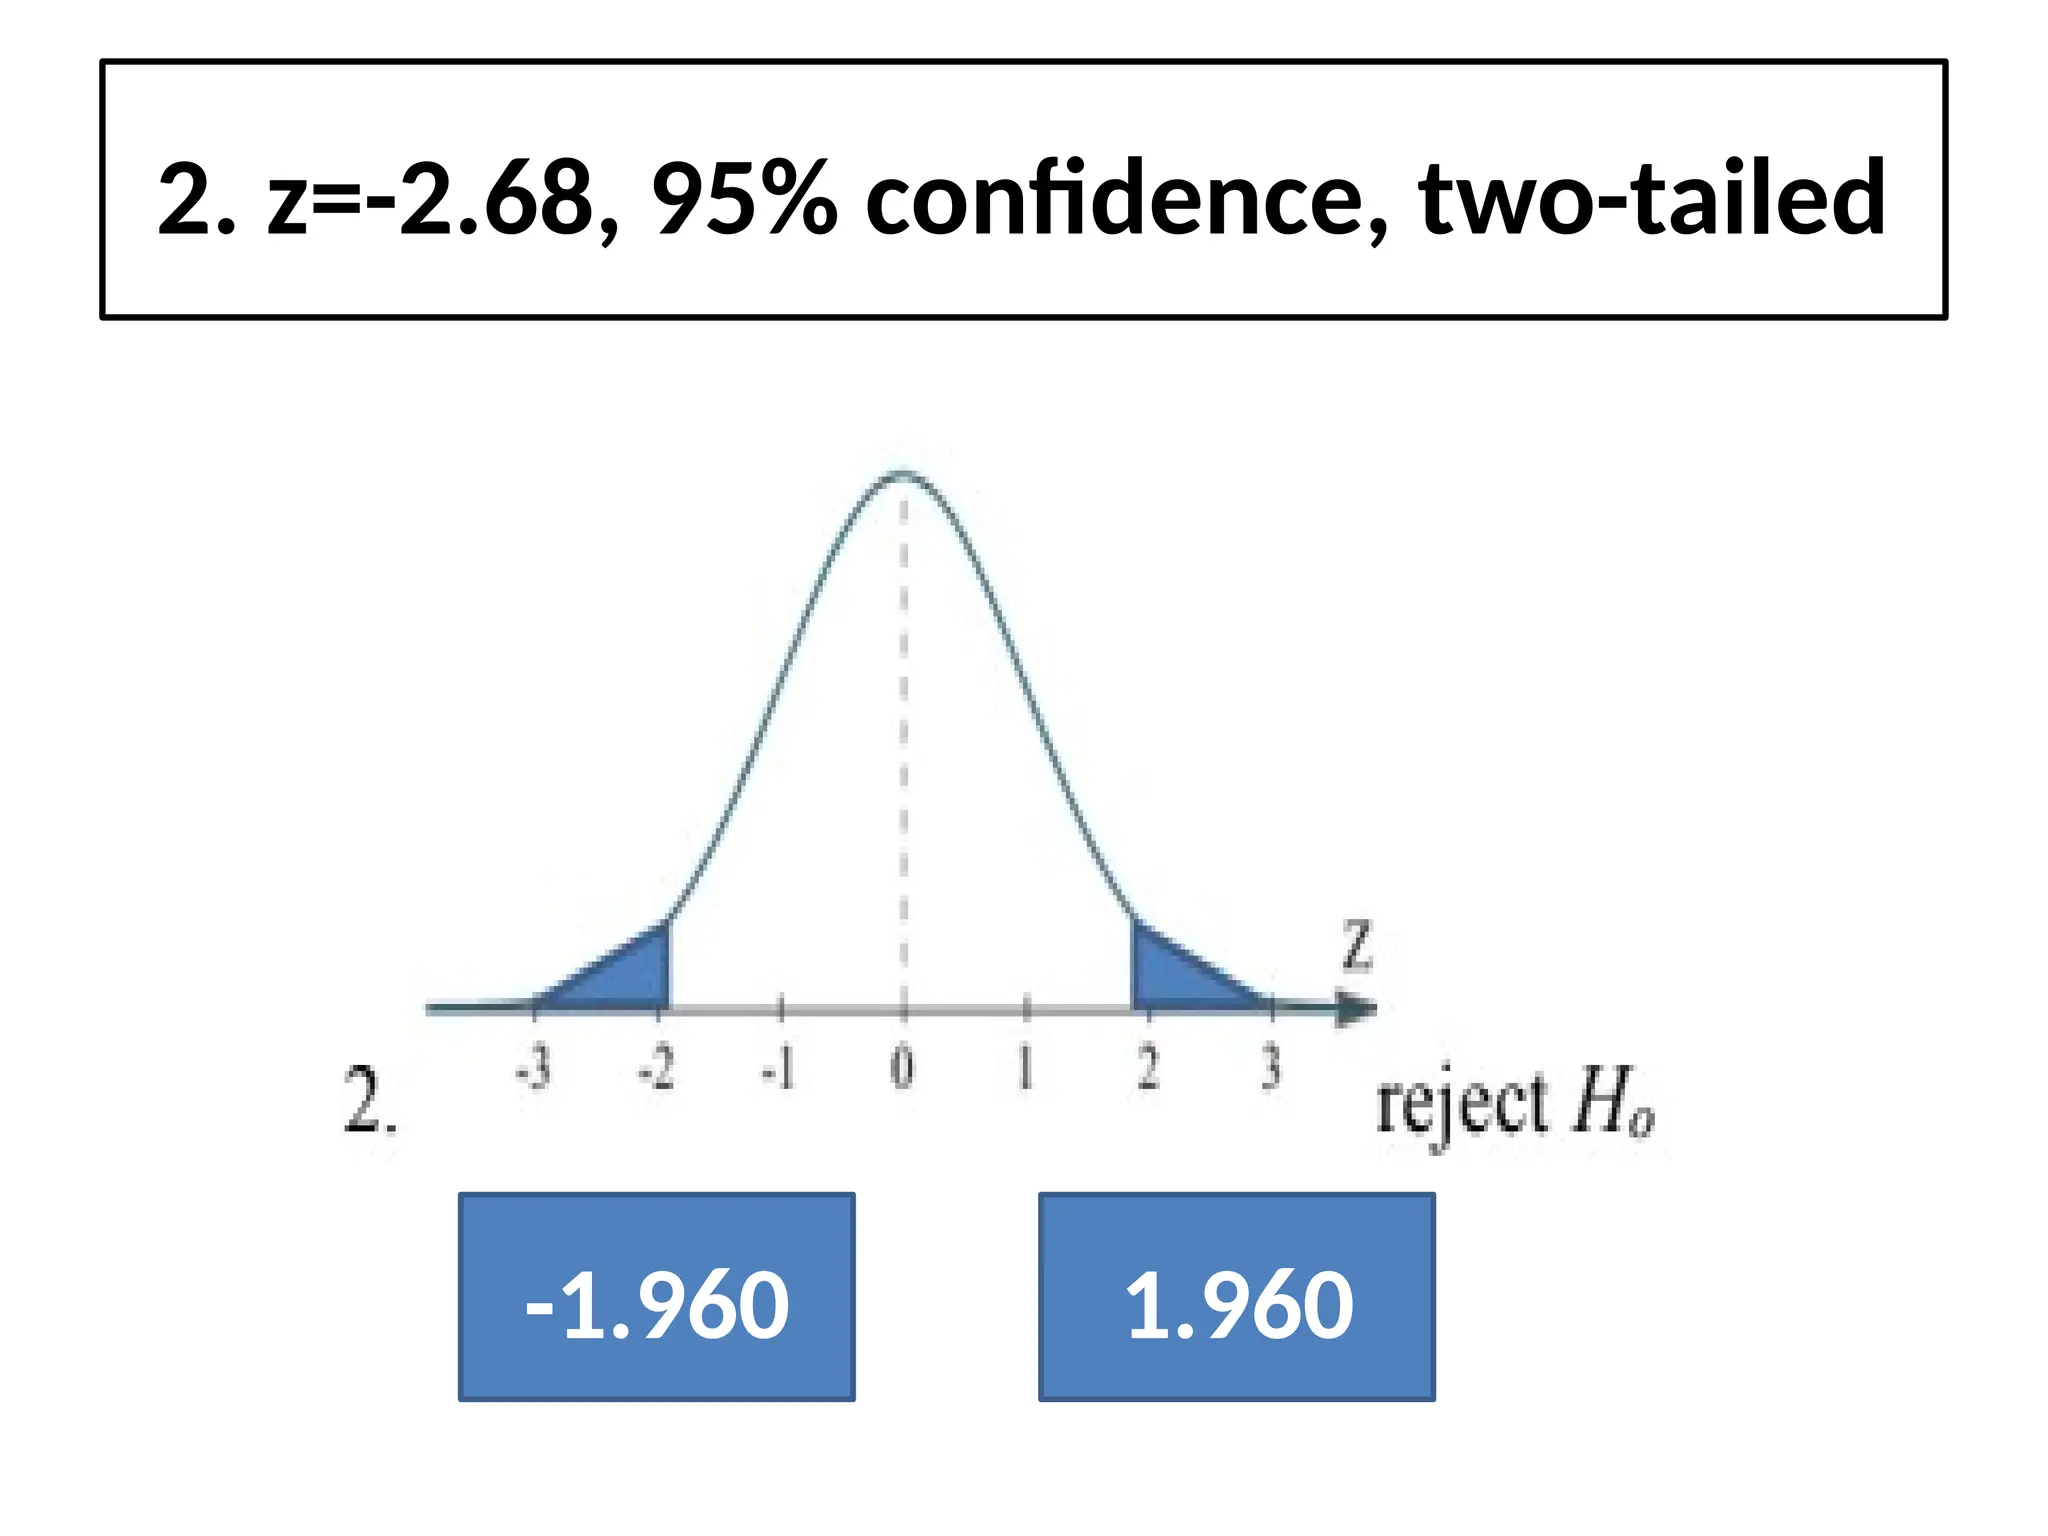
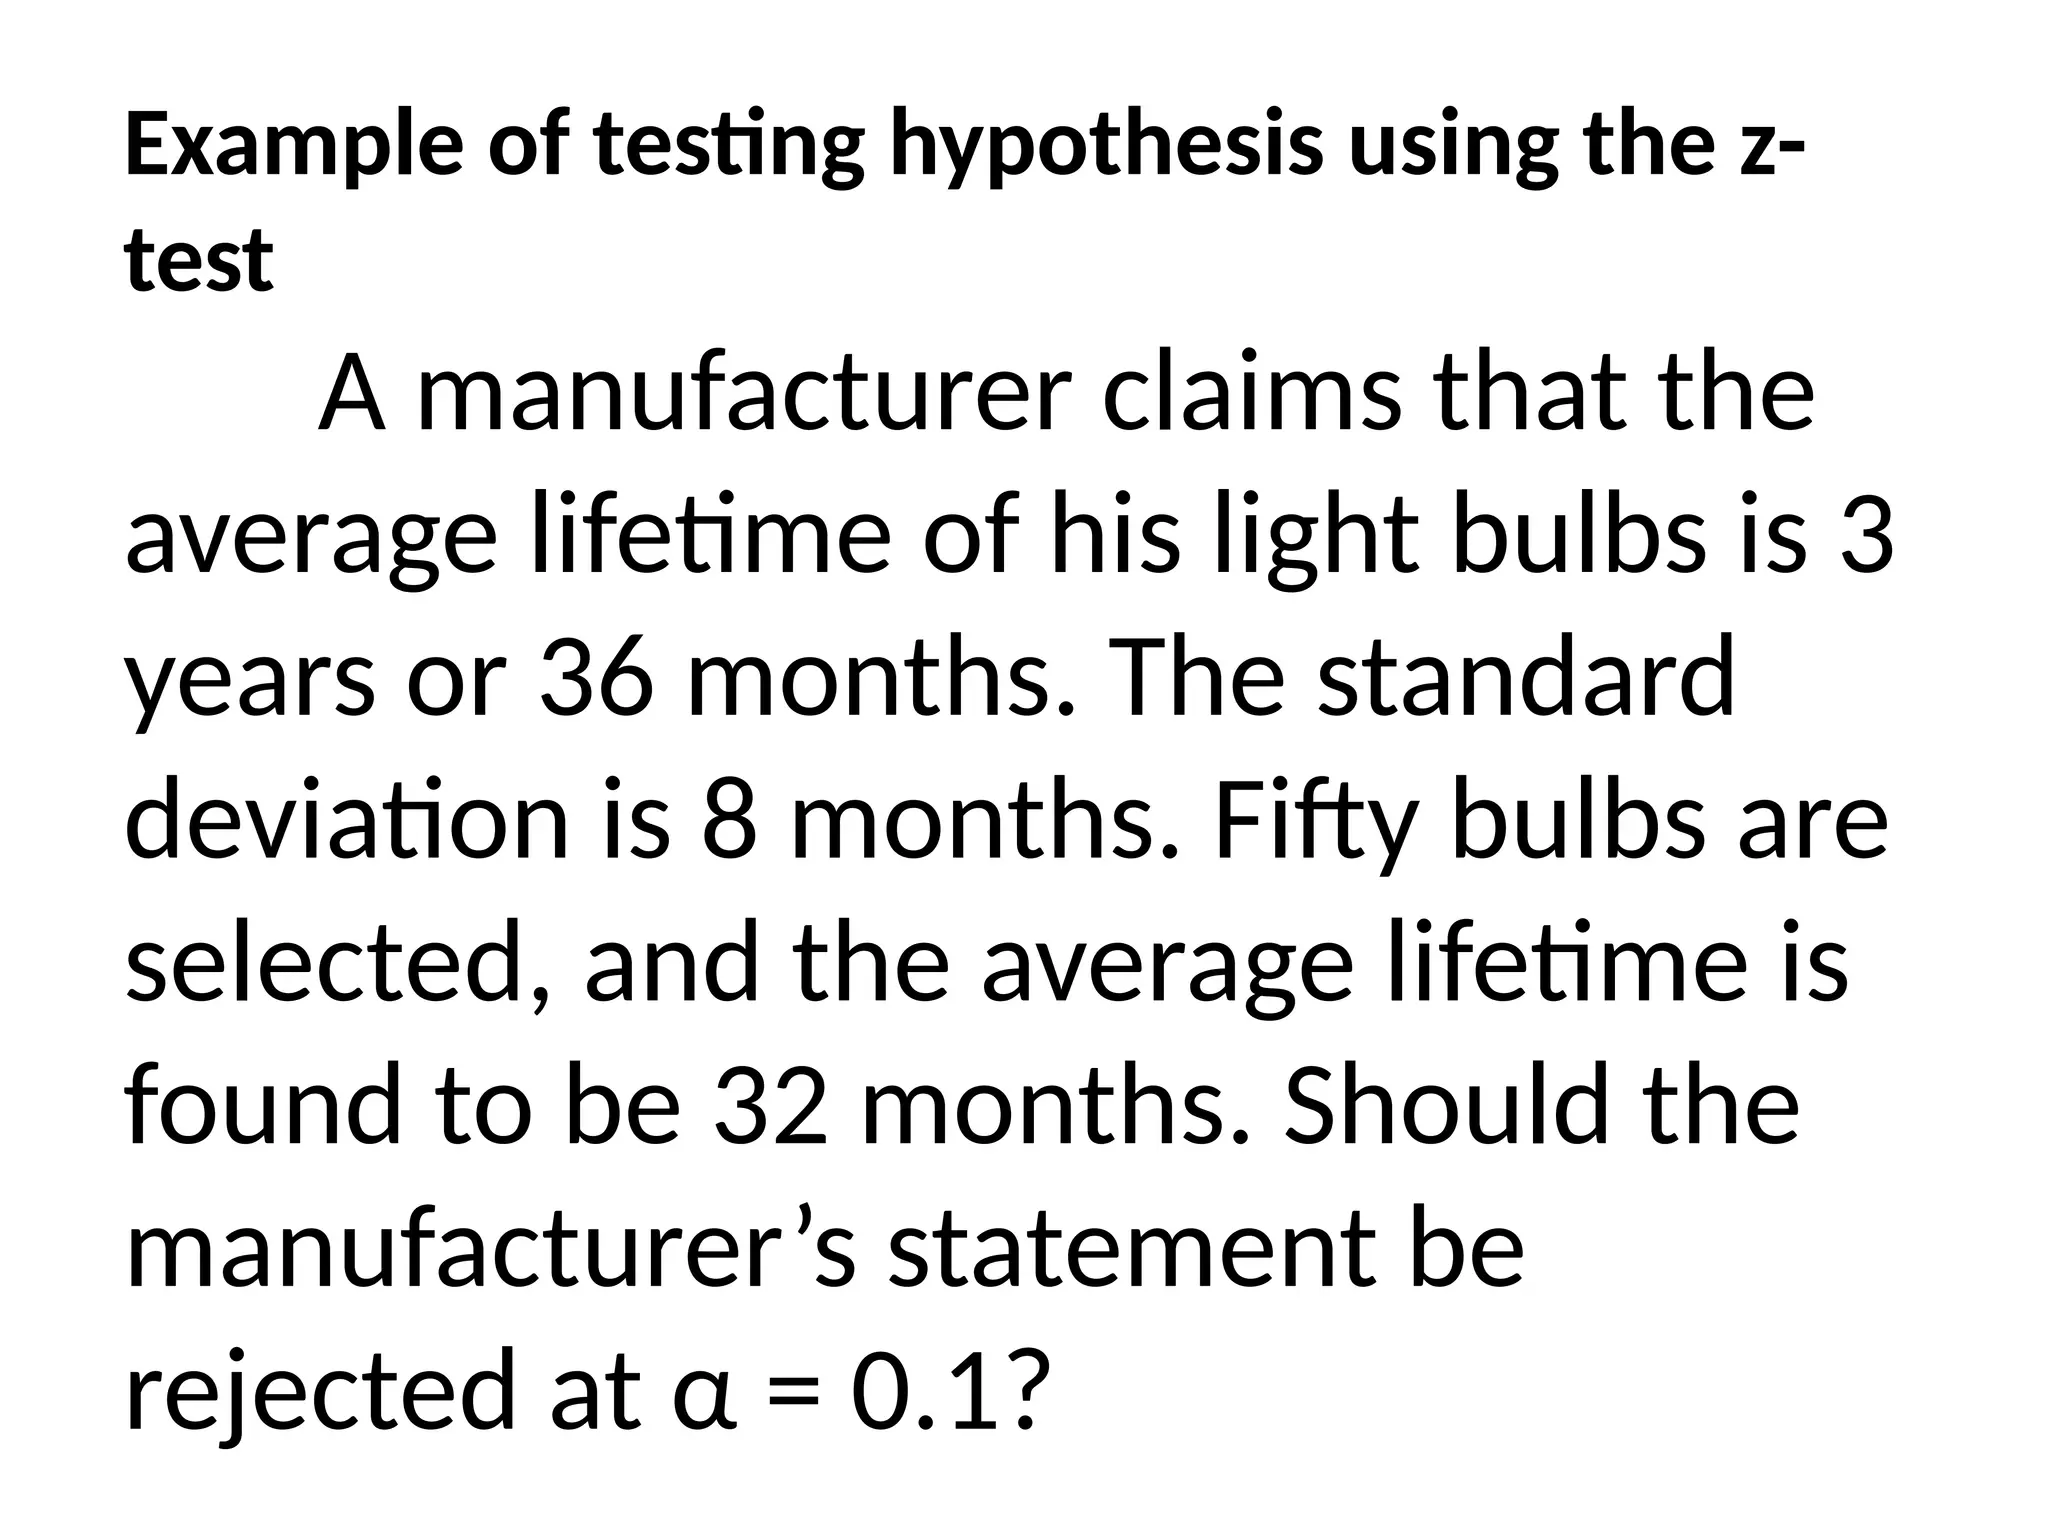
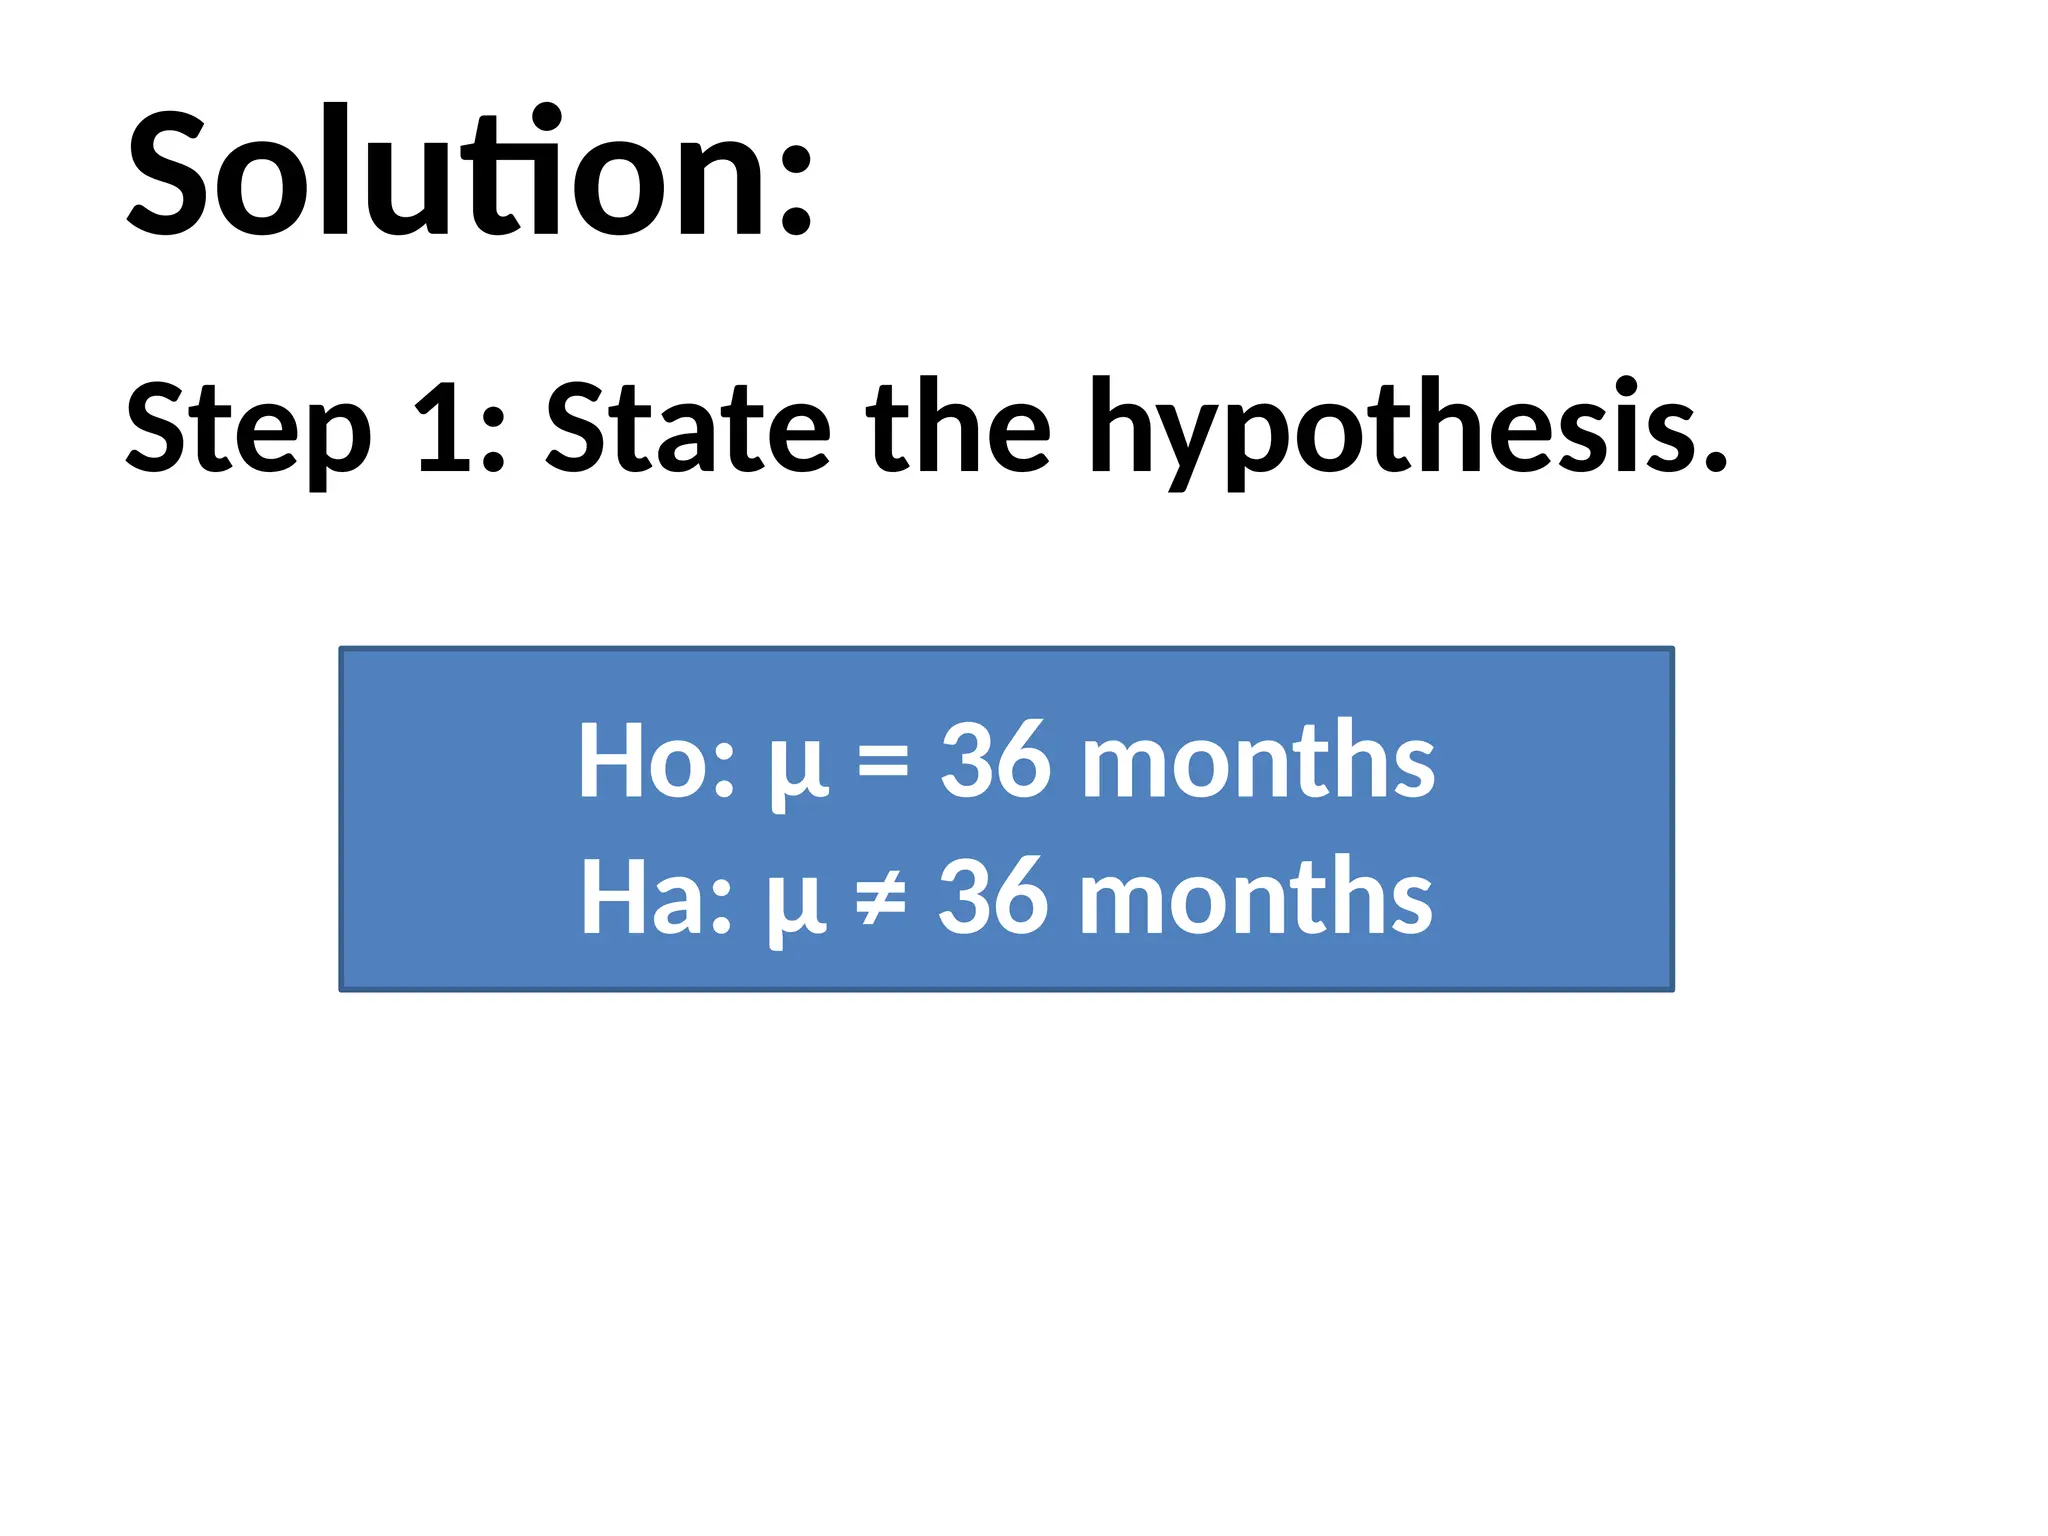
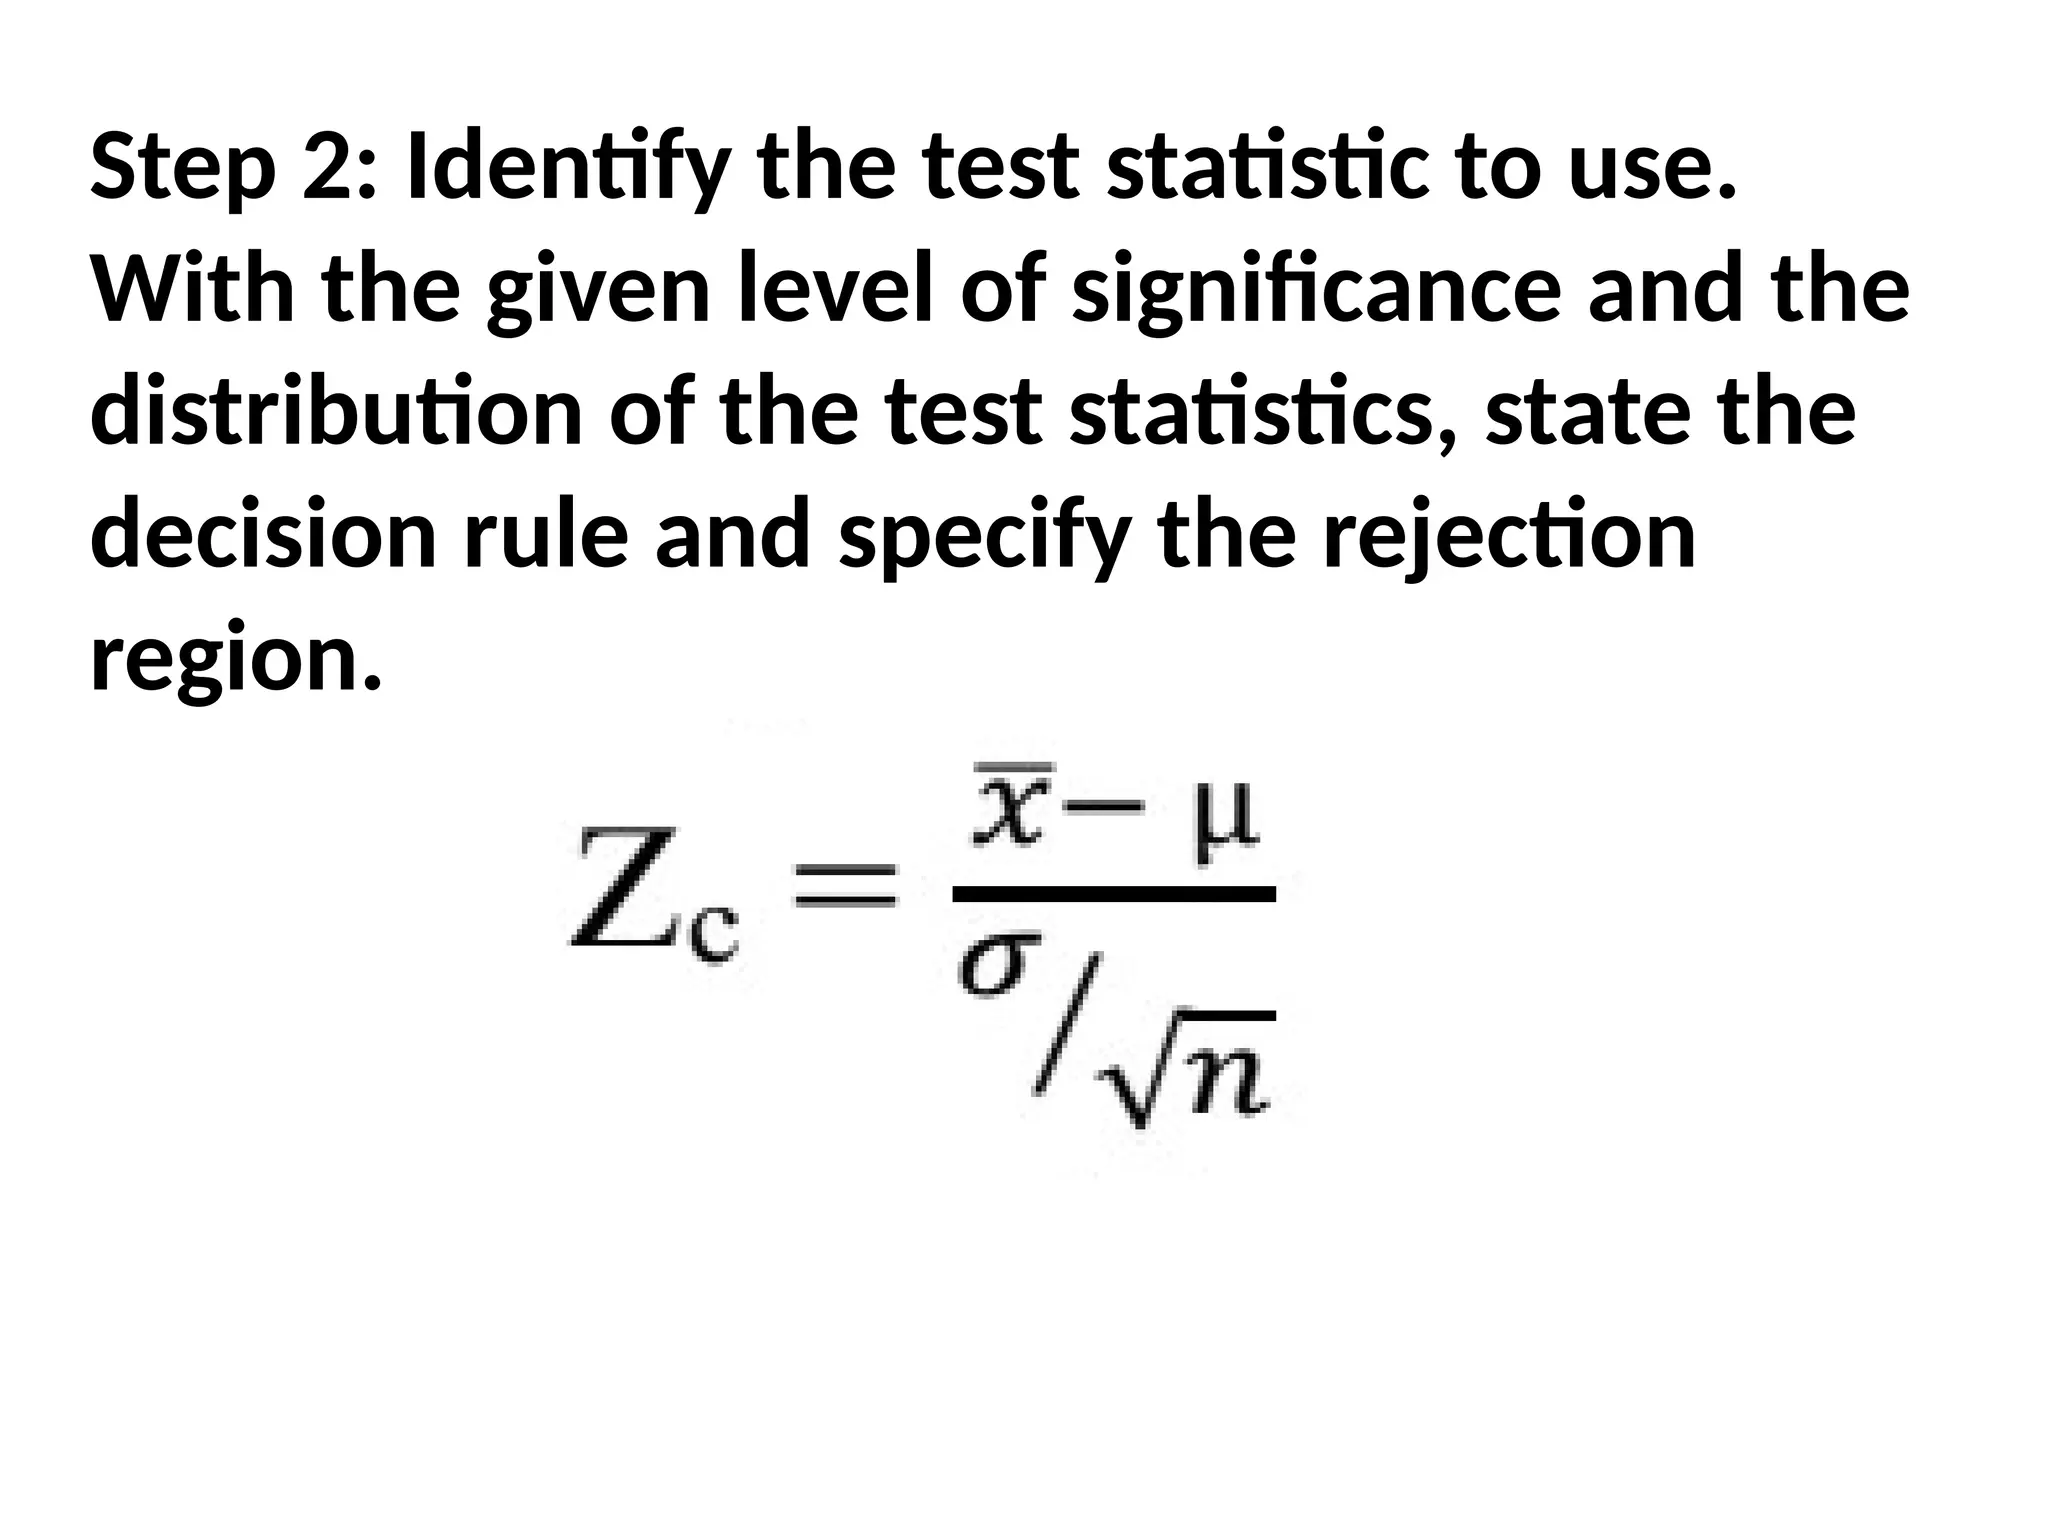
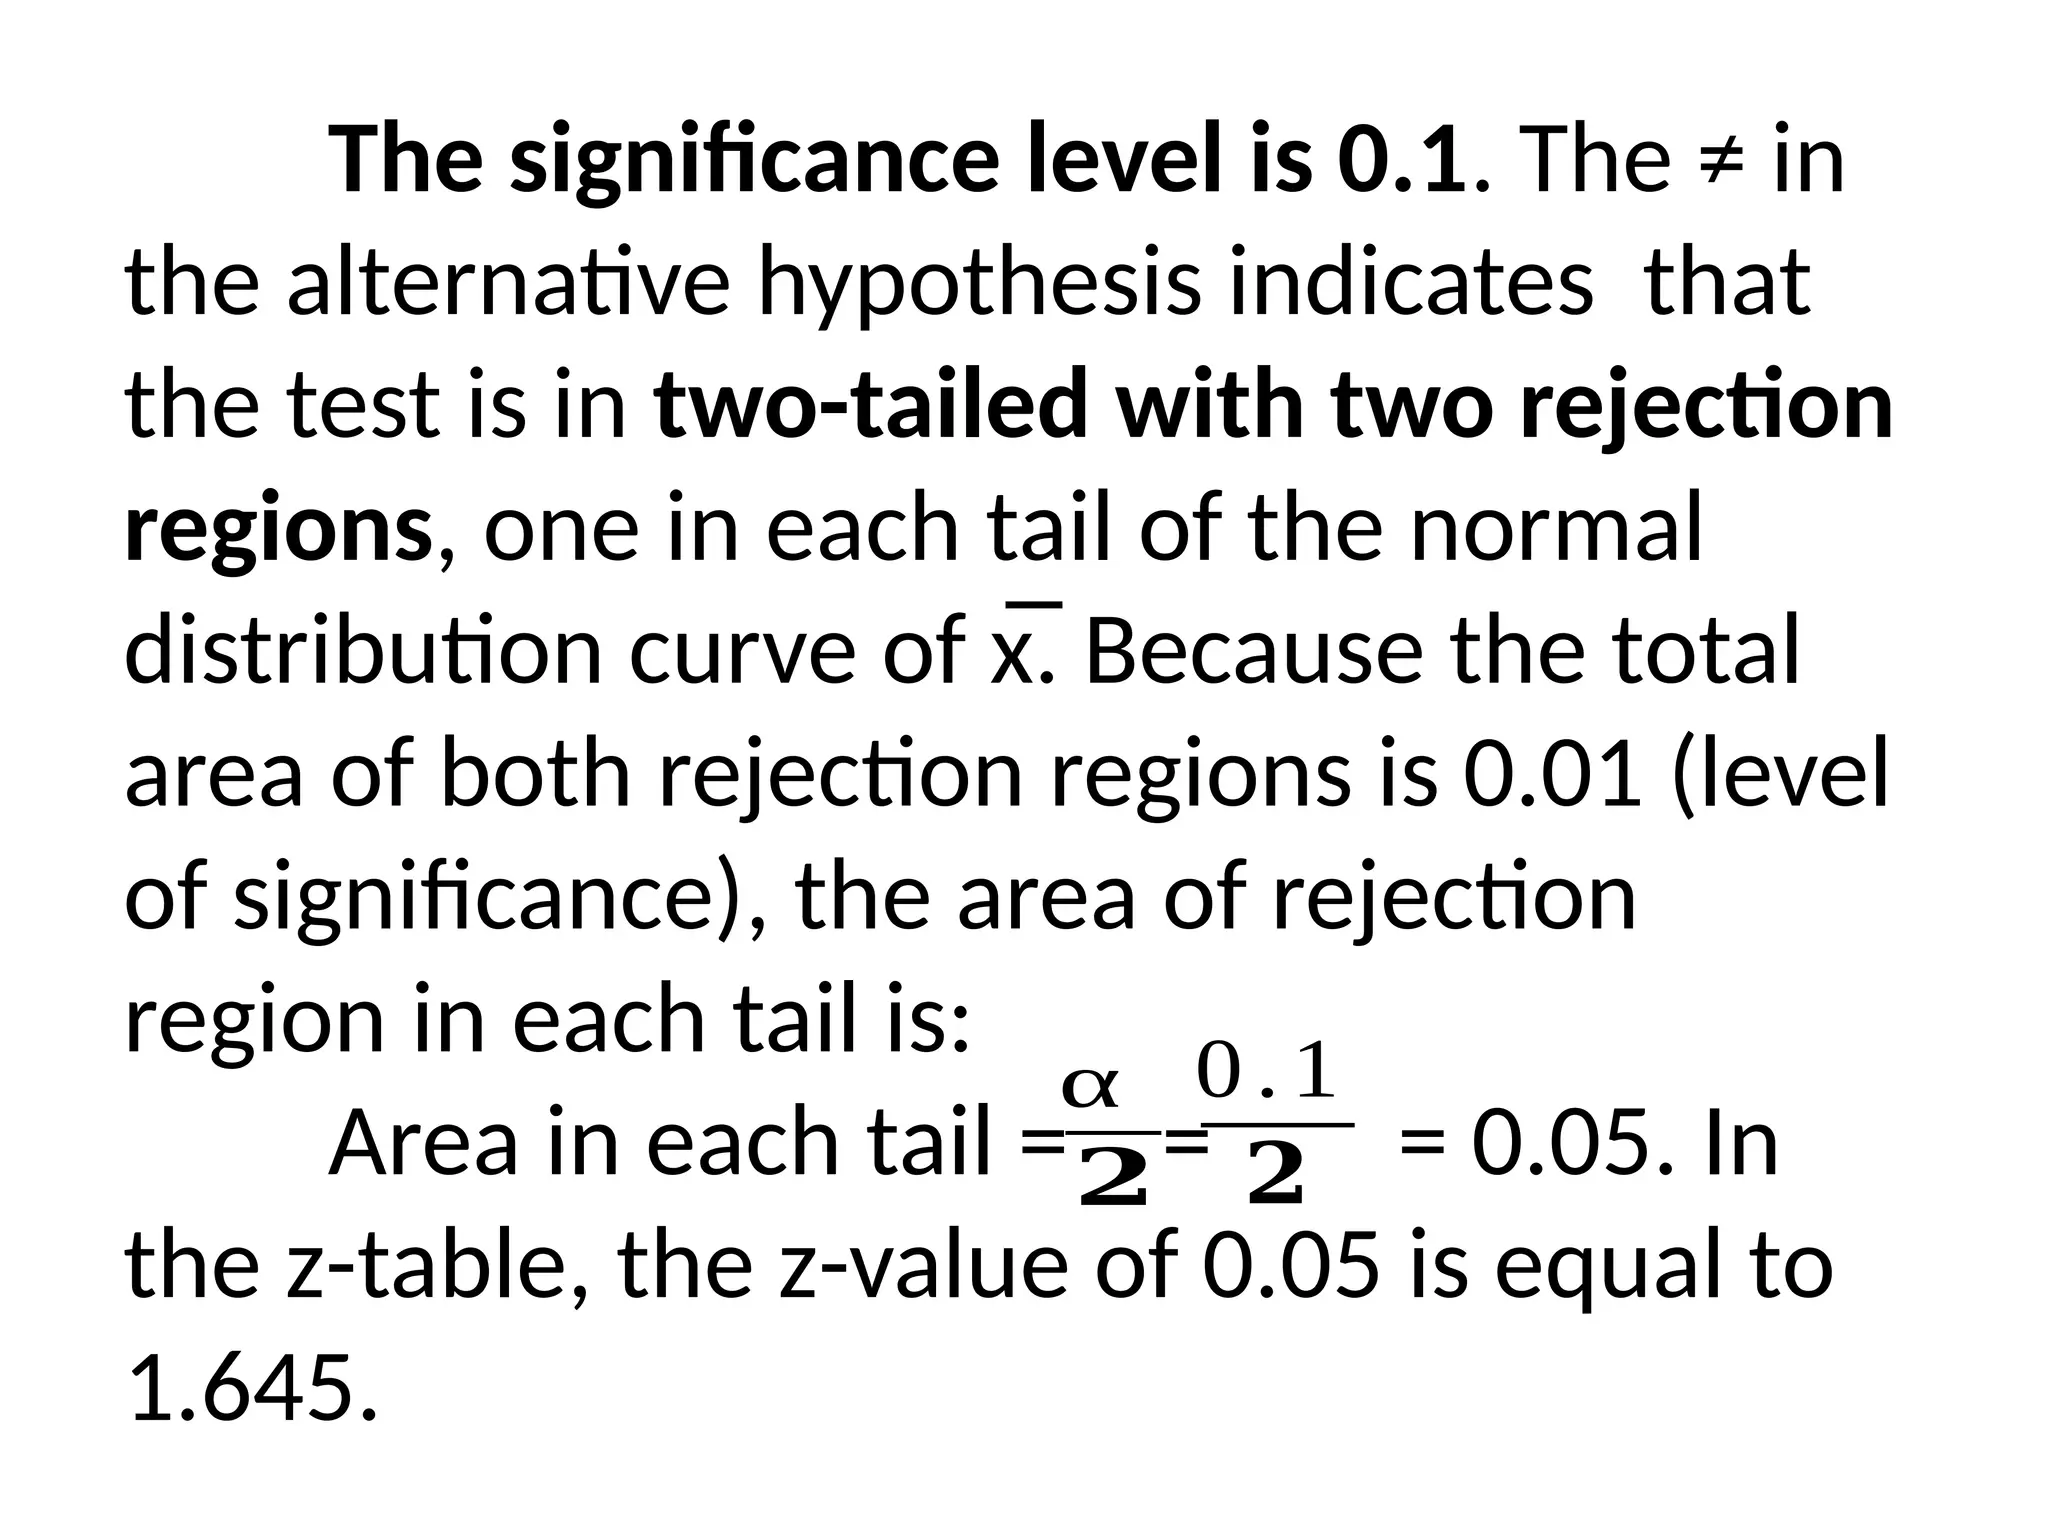
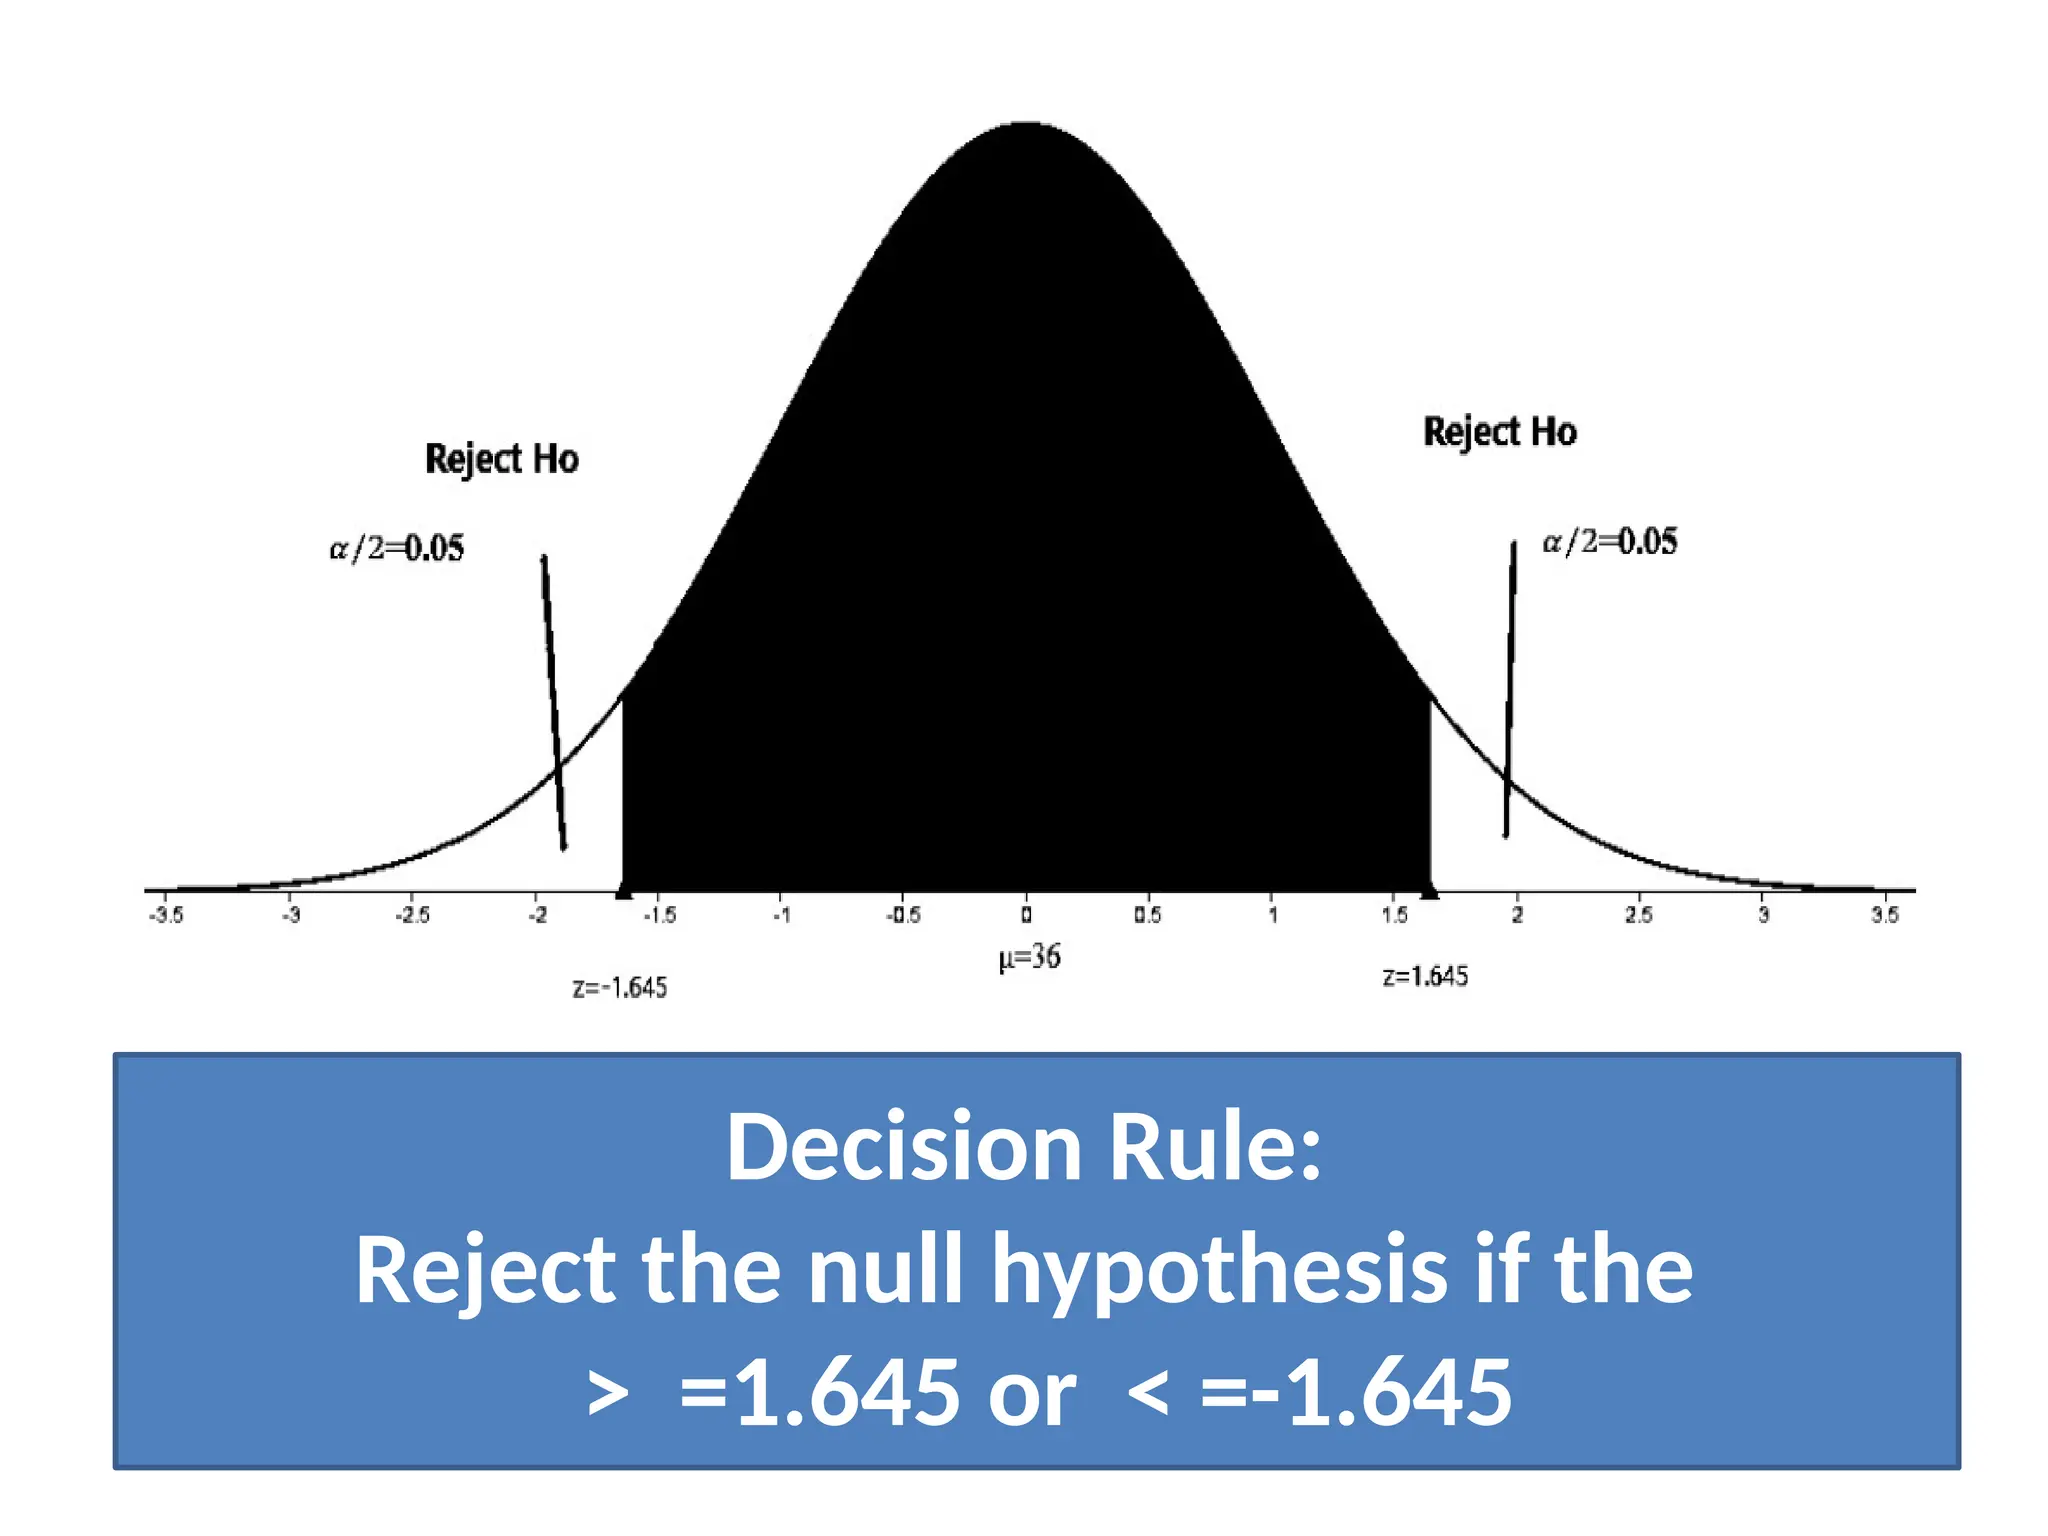
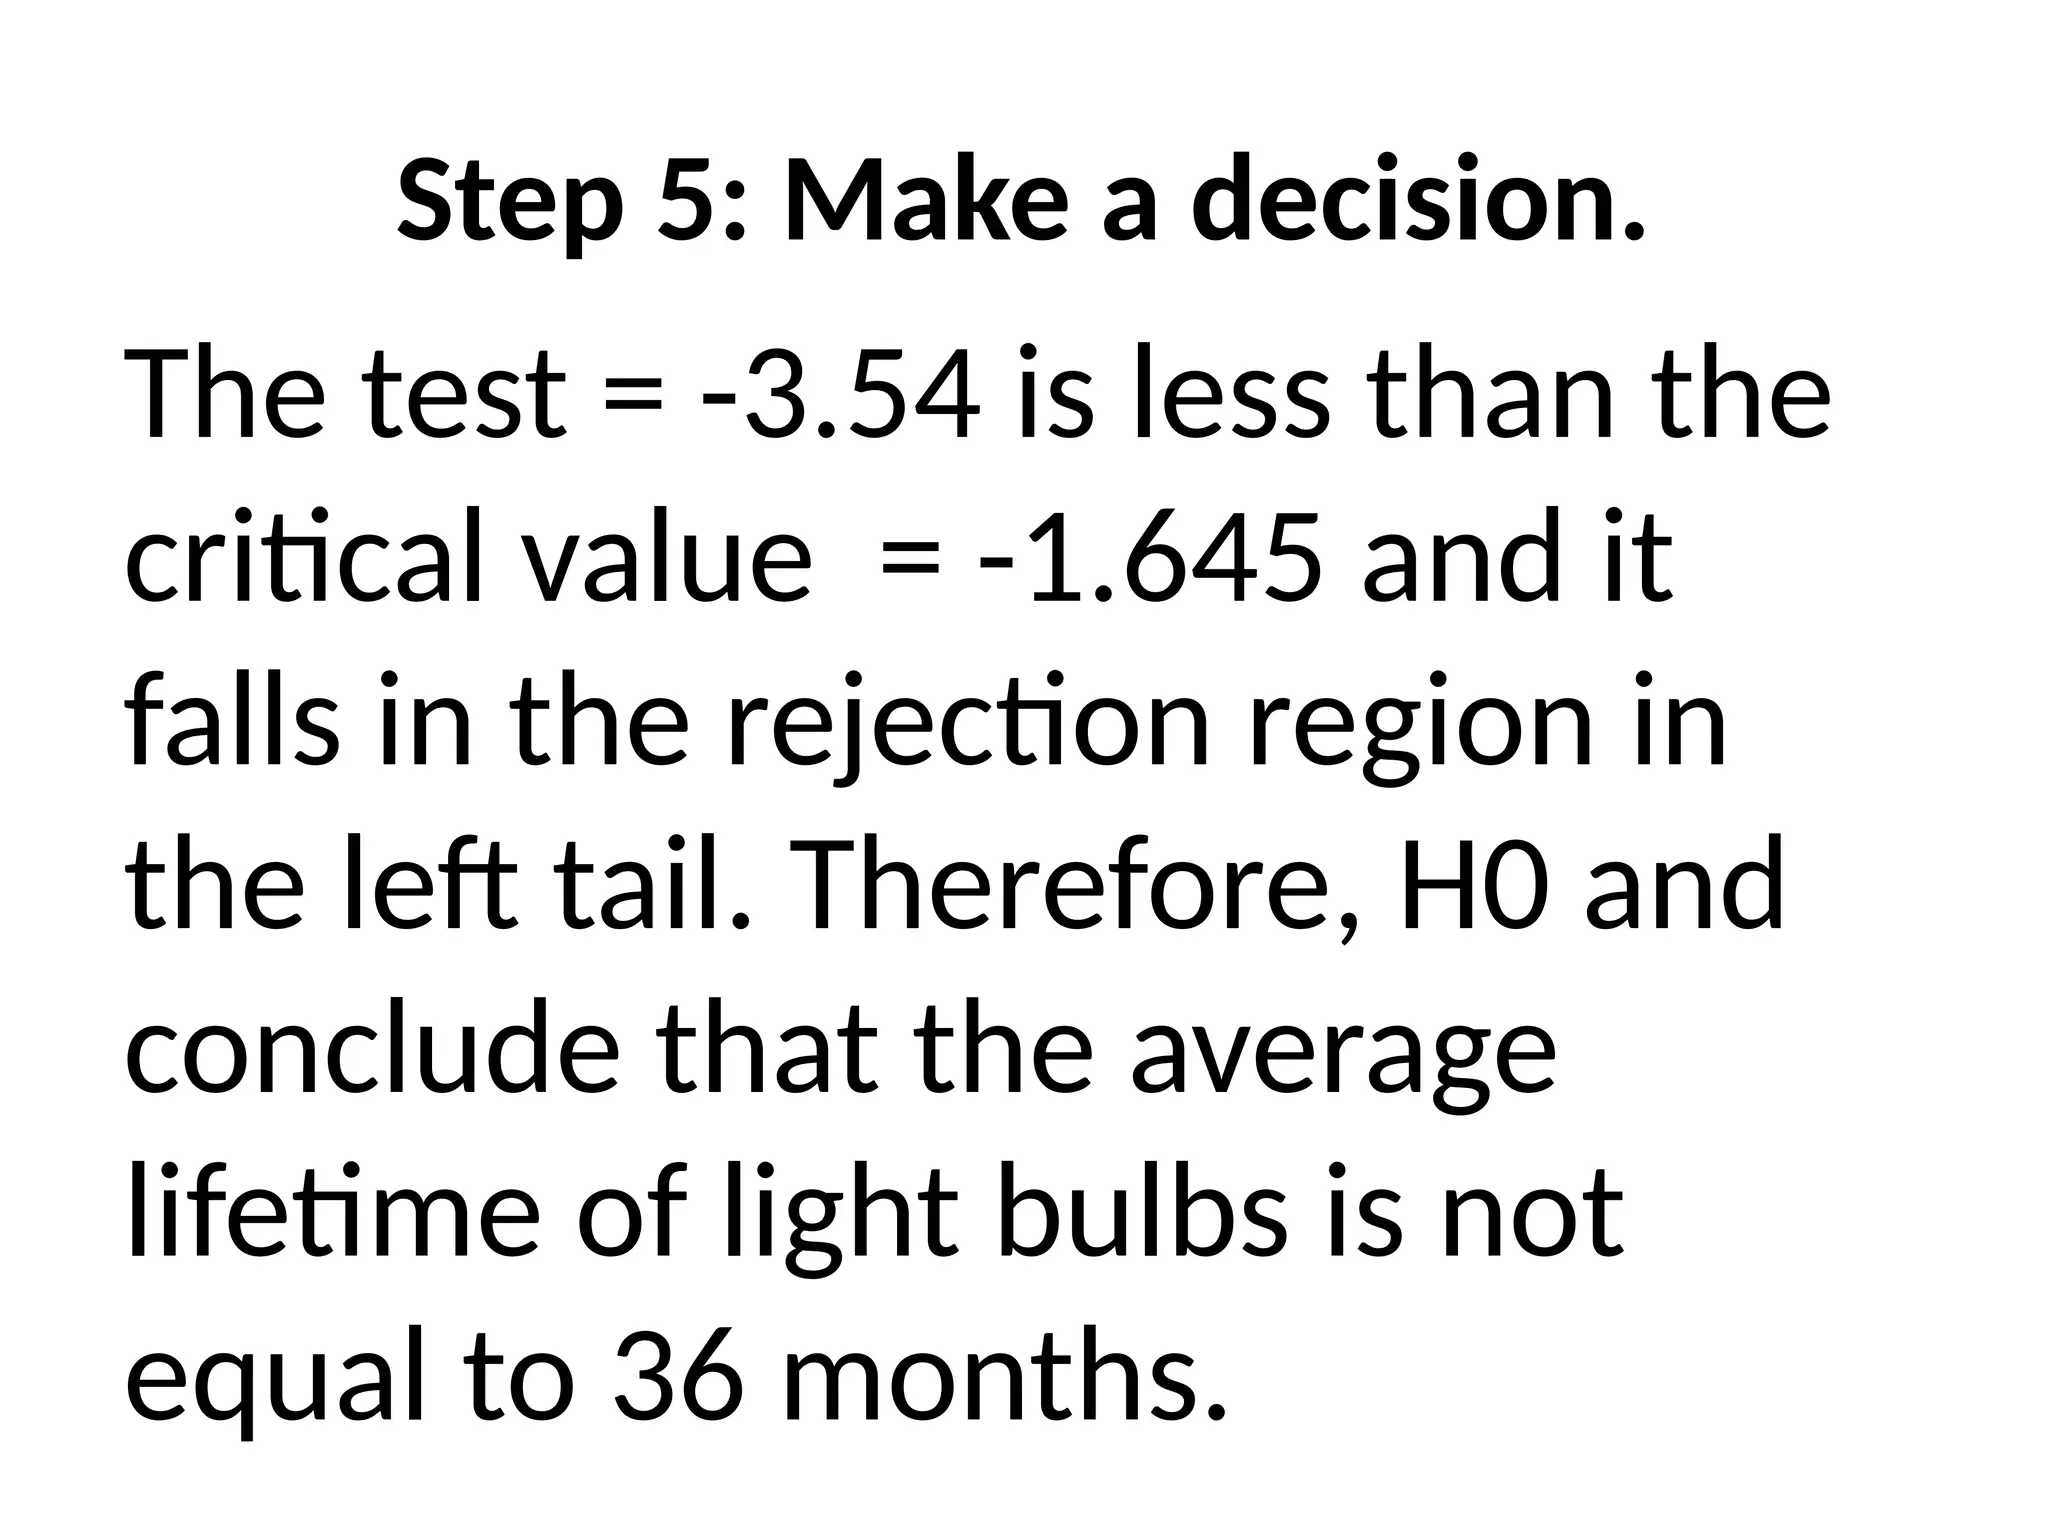
Types of Errors in
Hypothesis Testing
Table 2. Types of Errors
Understanding Errors
Study and answer the following carefully and
the notes that follow.
1. Maria’s Age
Maria insists that she is 30 years old
when, in fact, she is 32 years old. What
error is Mary committing?
Solution: Mary is rejecting the truth.
She is committing a Type I
error.
2. Stephen’s Hairline
Stephen says that he is not bald. His
hairline is just receding. Is he committing
an error? If so, what type of error?
Solution:
Yes. A receding hairline indicates balding.
This is a Type I error.
Stephen’s action may be to find remedial
measures to stop falling hair.
Rejection Region
Under the normal curve, the rejection
region refers to the region where the
value of the test statistic lies for which we
will reject the null hypothesis. This region
is also called critical region.
So, if your computed statistic is found
in the rejection region, then you reject
Ho.
If it is found outside the rejection
region, you accept Ho.
Example # 1.
• First, draw the normal curve.
• Second, locate the z-value.
• Third, indicate if the z-value
is in the rejection region or in
the acceptance region.
1. z=2, 95% confidence, two-tailed
1.960
-1.960
2. z=-2.68, 95% confidence, two-tailed
-1.960 1.960
Example of testing hypothesis using the z-
test
A manufacturer claims that the
average lifetime of his light bulbs is 3
years or 36 months. The standard
deviation is 8 months. Fifty bulbs are
selected, and the average lifetime is
found to be 32 months. Should the
manufacturer’s statement be
rejected at α = 0.1?
Solution:
Step 1: State the hypothesis.
Ho: μ = 36 months
Ha: μ ≠ 36 months
Step 2: Identify the test statistic to use.
With the given level of significance and the
distribution of the test statistics, state the
decision rule and specify the rejection
region.
The significance level is 0.1. The ≠ in
the alternative hypothesis indicates that
the test is in two-tailed with two rejection
regions, one in each tail of the normal
distribution curve of x̅. Because the total
area of both rejection regions is 0.01 (level
of significance), the area of rejection
region in each tail is:
Area in each tail = = = 0.05. In
the z-table, the z-value of 0.05 is equal to
1.645.
α
𝟐
0.1
𝟐
Decision Rule:
Reject the null hypothesis if the
> =1.645 or < =-1.645
Step 3: Compute the value of the test
statistic.
The computed statistic is = -3.54
Step 4: State the decision rule.
Reject the null hypothesis.
Step 5: Make a decision.
The test = -3.54 is less than the
critical value = -1.645 and it
falls in the rejection region in
the left tail. Therefore, H0 and
conclude that the average
lifetime of light bulbs is not
equal to 36 months.

Statistics and Probability-Table 2_Type of Errors.pptx

  • 1.
    Types of Errorsin Hypothesis Testing
  • 2.
    Table 2. Typesof Errors
  • 3.
    Understanding Errors Study andanswer the following carefully and the notes that follow. 1. Maria’s Age Maria insists that she is 30 years old when, in fact, she is 32 years old. What error is Mary committing? Solution: Mary is rejecting the truth. She is committing a Type I error.
  • 4.
    2. Stephen’s Hairline Stephensays that he is not bald. His hairline is just receding. Is he committing an error? If so, what type of error? Solution: Yes. A receding hairline indicates balding. This is a Type I error. Stephen’s action may be to find remedial measures to stop falling hair.
  • 5.
  • 6.
    Under the normalcurve, the rejection region refers to the region where the value of the test statistic lies for which we will reject the null hypothesis. This region is also called critical region. So, if your computed statistic is found in the rejection region, then you reject Ho. If it is found outside the rejection region, you accept Ho.
  • 7.
    Example # 1. •First, draw the normal curve. • Second, locate the z-value. • Third, indicate if the z-value is in the rejection region or in the acceptance region.
  • 8.
    1. z=2, 95%confidence, two-tailed 1.960 -1.960
  • 9.
    2. z=-2.68, 95%confidence, two-tailed -1.960 1.960
  • 10.
    Example of testinghypothesis using the z- test A manufacturer claims that the average lifetime of his light bulbs is 3 years or 36 months. The standard deviation is 8 months. Fifty bulbs are selected, and the average lifetime is found to be 32 months. Should the manufacturer’s statement be rejected at α = 0.1?
  • 11.
    Solution: Step 1: Statethe hypothesis. Ho: μ = 36 months Ha: μ ≠ 36 months
  • 12.
    Step 2: Identifythe test statistic to use. With the given level of significance and the distribution of the test statistics, state the decision rule and specify the rejection region.
  • 13.
    The significance levelis 0.1. The ≠ in the alternative hypothesis indicates that the test is in two-tailed with two rejection regions, one in each tail of the normal distribution curve of x̅. Because the total area of both rejection regions is 0.01 (level of significance), the area of rejection region in each tail is: Area in each tail = = = 0.05. In the z-table, the z-value of 0.05 is equal to 1.645. α 𝟐 0.1 𝟐
  • 14.
    Decision Rule: Reject thenull hypothesis if the > =1.645 or < =-1.645
  • 15.
    Step 3: Computethe value of the test statistic. The computed statistic is = -3.54
  • 16.
    Step 4: Statethe decision rule. Reject the null hypothesis.
  • 17.
    Step 5: Makea decision. The test = -3.54 is less than the critical value = -1.645 and it falls in the rejection region in the left tail. Therefore, H0 and conclude that the average lifetime of light bulbs is not equal to 36 months.