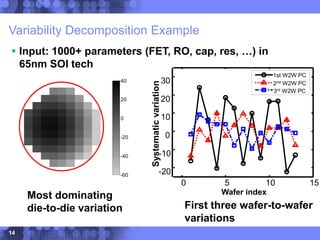
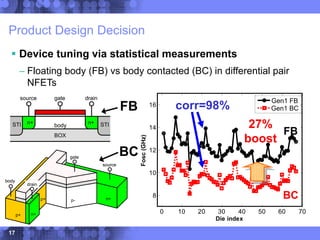
Statistical Framework for
Technology-Model-Product
Co-Design and Convergence
Design Automation Conference
June 6, 2007
Choongyeun Cho†, Daeik Kim†, Jonghae Kim†,
Jean-Olivier Plouchart‡, Robert Trzcinski‡
†IBM Semiconductor R&D Center ‡IBM T.J. Watson Research Center
29-2ebff_ver2007_06_06_05:18
2
Overview
 Motivation
– Current / proposed approaches
 Proposed methodology
– Statistical framework for tech-model-product co-design
 Application
– RF product development in three evolving 65nm SOI
technologies
 Conclusions
– Summary and contributions
3
Overview
 Motivation
– Current / proposed methodologies
 Proposed methodology
– Statistical framework for tech-model-product co-design
 Application
– RF product development in three evolving 65nm SOI
technologies
 Conclusions
– Summary and contributions
4
Current IC Development
 Process, model and product are developed in parallel
(Inter-
pretation)
Prep Mask
Preparation FEOL BEOL
T0
P0
Product
Model
Mask
Process
T1
Time
Node
0
Node
1
Gen 1
B0
Bench-
mark
Migration
Migration
Mask
delivery
B0
Measure
Feedback
P0
Measure
Model
Model
Gen 2
Feedback
Inter-
pretation
Difficult to link
from product to
model/process
5
Current IC Development
 Ring oscillator (RO) is common vehicle for model
calibration and product benchmarking, yet may not
capture complex operation of product circuit
Process Model
Benchmark
Product
Co-Design
6
Proposed Approach
 Statistical framework
– Process variability is statistical by nature
– Measurements from manufacturing-in-line electrical tests are exploited
– Hardware data is capable of capturing complicated behavior of product
 Systematic perspective for co-design
– Translation from one component to another leading to rapid
convergence of tech-model-product
 Benefits
– Accelerate yield learning
– Reduce time-to-market and development cost
7
Overview
 Motivation
 Proposed methodology
– Statistical framework for tech-model-product co-design
1. Cross-correlation analysis
2. Statistical yield estimation
3. Variability decomposition
 Application
 Conclusions
8
Cross-Correlation Analysis
 Correlate circuit performance with device parameters
– Large volume of in-line electrical test data is often available
– Links device characteristics to product performance/yield
– For highly correlated parameters, analyze sensitivity
 For example: Fosc vs Vth samples from one lot
Device
characteristic (Vth)
Product
FOM
(Fosc)
xcorr=85%
Sensitivity=3GHz/V
9
Cross-Correlation Analysis
 Statistical significance is determined:
– E.g. 90% sample correlation using 60 chips guarantees
84~94% correlation range within 95% confidence interval
 Once most correlated device characteristics are
identified, the information is fed to:
– Design side: make more tolerable to the device parameter
(Design-for-yield)
– Technology side: control and monitor a particular process
– Model side: model-to-hardware correlation (MHC) and calibration
10
Statistical Yield Estimation
 “Performance (parametric) yield” defined as probability
that predefined design specs are met:
 Using simulation or hardware data, estimate
performance yield
1. Fit design parameter samples with simple (Gaussian)
distribution
2. Yield is predicted as:
Yield(x) = 1 – CDF(x) where x=minimum design requirement
JPDF
estimated
is
)
(
where
,
)
,
,
,
(
)
met
is
spec
design
Pr(
Yield
spec
design
2
1
2
1
M
1





p
dx
dx
dx
x
x
x
p
i
i
x
M
M
i
 





11
delay
1/(idda-iddq)
8 10 12 14 16 18
900
1000
1100
1200
1300
1400
1500
1600
1700
10 12 14 16 18
800
900
1000
1100
1200
1300
1400
1500
1600
1700
delay
1/(idda-iddq)
Delay (ps)
Delay (ps)
1
/
I
A
1/(Idda-Iddq)
Design
spec
1
/
I
A
500 measurement
samples
Fitted 2-dim Gaussian
equiprobability-contours
Statistical Yield Estimation
 Example: a static inverter-based RO in 90nm tech
– Target max delay=15ps, target max active current=1mA
Delay Delay
Yield=90%
12
Variability Decomposition
 Decompose process variation in die-to-die and
wafer-to-wafer components:
– Using only a collection of manufacturing electrical test data
– No physical model for process variation
 Benefits:
– Allow quick visualization and analysis of systematic variability
– Monitor lot characteristics, and impact of process recipe change
– Efficient sampling for measurement
(Details available in Cho, et al., ISQED’07)
13
Variability Decomposition
Standardize
Collection of in-line test data
(FET’s, SRAM, cap, etc)
Screen data
Find first PC
for D2D variation
Find first PC
for W2W variation
Take PC
with larger variance
Subtract this PC
space from
original data
 Utilize principal
component analysis
(PCA)
 Can generalize for
other variation ranges
(within-die and
lot-to-lot)
 Fast run-time Process
variation
14
Variability Decomposition Example
 Input: 1000+ parameters (FET, RO, cap, res, …) in
65nm SOI tech
-60
-40
-20
0
20
40
Most dominating
die-to-die variation First three wafer-to-wafer
variations
0 5 10 15
-20
-10
0
10
20
30
Wafer index
Systematic
variation
1st W2W PC
2nd W2W PC
3rd W2W PC
15
Overview
 Motivation
– Current / proposed methodologies
 Proposed methodology
– Statistical framework for tech-model-product co-design
 Application
– RF product development in three evolving 65nm SOI
technologies
 Conclusions
– Summary and contributions
16
Application: Background
 Current-mode logic (CML) current-controlled oscillator
(ICO) was developed
– Critical function block in microprocessor clocking
– Migrated from 90nm to 65nm
– Challenging design issues: reduced Vdd headroom, increased
nonlinearity/variation/leakage.
17
Product Design Decision
 Device tuning via statistical measurements
– Floating body (FB) vs body contacted (BC) in differential pair
NFETs
BOX
STI STI
n+ n+
body
gate
source drain
BOX
STI STI
n+ n+
body
gate
source drain
n+
p+ p-
n+
p+
source
drain
gate
body
n+
p+ p-
n+
p+
source
drain
gate
body
Correlation=98%
0 10 20 30 40 50 60 70
8
10
12
14
16
Die index
Fosc
(GHz)
Gen 1 BC
Gen 1 FB
corr=98%
FB
BC
Gen1 FB
Gen1 BC
27%
boost
FB
BC
18
Cross-Correlation Analysis
 Identified critical process variation
– Threshold voltage correlated with Fosc reduced
10
11
12
13
14
15
16
17
18
19
Vth
Fosc
(GHz)
Generation 2
Generation 3
xcorr=94%
xcorr=13%
Gen3
Gen2
19
Variability Decomposition
 Dominant die-to-die variations analyzed for
three tech generations
– Visualize how technology stabilizes.
Generation 1
(Pre-production)
Generation 2 Generation 3
20
Statistical Yield Estimation
 Predicted yield for three generations
– Calculated with Gaussian PDF fits
8 10 12 14 16 18
0
20
40
60
80
100
Fosc(GHz)
Performance
yield
(%)
Gen 1 BC
Gen 1 FB
Gen 2
Gen 3
0.3%
64%
99%
47%
Target=12GHz
21
Application Summary
 ICO of 64-bit processor developed using proposed
method across three 65nm tech generations, and met
design specs in nominal and variation
Target Gen1 Gen2 Gen3
10
15
Mean
Fosc
(GHz)
6
8
10
s
Fosc
/µ
Fosc
(%)
Target Fosc =
12GHz
Target Std=8%
Both Fosc,Std
failed
Fosc passed,
Std failed
Fosc,Std
passed
22
Overview
 Motivation
– Current / proposed methodologies
 Proposed methodology
– Statistical framework for tech-model-product co-design
 Application
– RF product development in three evolving 65nm SOI
technologies
 Conclusions
– Summary and contributions
23
Conclusions
 A simple statistical framework is presented to expedite
co-design of tech-model-product, based on three tools:
1. Cross-correlation analysis: identifies device characteristics
most related/sensitive to product performance
2. Statistical yield estimation: predicts yield based on HW data
3. Variability decomposition: separates systematic variability
for analysis and visualization
 Case study: ICO of microprocessor
– Yield enhancement from 47% to 99% over three 65nm tech
generations
24
Thank you.

Statistical Framework for Technology-Model-Product Co-Design and Convergence

  • 1.
    Statistical Framework for Technology-Model-Product Co-Designand Convergence Design Automation Conference June 6, 2007 Choongyeun Cho†, Daeik Kim†, Jonghae Kim†, Jean-Olivier Plouchart‡, Robert Trzcinski‡ †IBM Semiconductor R&D Center ‡IBM T.J. Watson Research Center 29-2ebff_ver2007_06_06_05:18
  • 2.
    2 Overview  Motivation – Current/ proposed approaches  Proposed methodology – Statistical framework for tech-model-product co-design  Application – RF product development in three evolving 65nm SOI technologies  Conclusions – Summary and contributions
  • 3.
    3 Overview  Motivation – Current/ proposed methodologies  Proposed methodology – Statistical framework for tech-model-product co-design  Application – RF product development in three evolving 65nm SOI technologies  Conclusions – Summary and contributions
  • 4.
    4 Current IC Development Process, model and product are developed in parallel (Inter- pretation) Prep Mask Preparation FEOL BEOL T0 P0 Product Model Mask Process T1 Time Node 0 Node 1 Gen 1 B0 Bench- mark Migration Migration Mask delivery B0 Measure Feedback P0 Measure Model Model Gen 2 Feedback Inter- pretation Difficult to link from product to model/process
  • 5.
    5 Current IC Development Ring oscillator (RO) is common vehicle for model calibration and product benchmarking, yet may not capture complex operation of product circuit Process Model Benchmark Product Co-Design
  • 6.
    6 Proposed Approach  Statisticalframework – Process variability is statistical by nature – Measurements from manufacturing-in-line electrical tests are exploited – Hardware data is capable of capturing complicated behavior of product  Systematic perspective for co-design – Translation from one component to another leading to rapid convergence of tech-model-product  Benefits – Accelerate yield learning – Reduce time-to-market and development cost
  • 7.
    7 Overview  Motivation  Proposedmethodology – Statistical framework for tech-model-product co-design 1. Cross-correlation analysis 2. Statistical yield estimation 3. Variability decomposition  Application  Conclusions
  • 8.
    8 Cross-Correlation Analysis  Correlatecircuit performance with device parameters – Large volume of in-line electrical test data is often available – Links device characteristics to product performance/yield – For highly correlated parameters, analyze sensitivity  For example: Fosc vs Vth samples from one lot Device characteristic (Vth) Product FOM (Fosc) xcorr=85% Sensitivity=3GHz/V
  • 9.
    9 Cross-Correlation Analysis  Statisticalsignificance is determined: – E.g. 90% sample correlation using 60 chips guarantees 84~94% correlation range within 95% confidence interval  Once most correlated device characteristics are identified, the information is fed to: – Design side: make more tolerable to the device parameter (Design-for-yield) – Technology side: control and monitor a particular process – Model side: model-to-hardware correlation (MHC) and calibration
  • 10.
    10 Statistical Yield Estimation “Performance (parametric) yield” defined as probability that predefined design specs are met:  Using simulation or hardware data, estimate performance yield 1. Fit design parameter samples with simple (Gaussian) distribution 2. Yield is predicted as: Yield(x) = 1 – CDF(x) where x=minimum design requirement JPDF estimated is ) ( where , ) , , , ( ) met is spec design Pr( Yield spec design 2 1 2 1 M 1      p dx dx dx x x x p i i x M M i       
  • 11.
    11 delay 1/(idda-iddq) 8 10 1214 16 18 900 1000 1100 1200 1300 1400 1500 1600 1700 10 12 14 16 18 800 900 1000 1100 1200 1300 1400 1500 1600 1700 delay 1/(idda-iddq) Delay (ps) Delay (ps) 1 / I A 1/(Idda-Iddq) Design spec 1 / I A 500 measurement samples Fitted 2-dim Gaussian equiprobability-contours Statistical Yield Estimation  Example: a static inverter-based RO in 90nm tech – Target max delay=15ps, target max active current=1mA Delay Delay Yield=90%
  • 12.
    12 Variability Decomposition  Decomposeprocess variation in die-to-die and wafer-to-wafer components: – Using only a collection of manufacturing electrical test data – No physical model for process variation  Benefits: – Allow quick visualization and analysis of systematic variability – Monitor lot characteristics, and impact of process recipe change – Efficient sampling for measurement (Details available in Cho, et al., ISQED’07)
  • 13.
    13 Variability Decomposition Standardize Collection ofin-line test data (FET’s, SRAM, cap, etc) Screen data Find first PC for D2D variation Find first PC for W2W variation Take PC with larger variance Subtract this PC space from original data  Utilize principal component analysis (PCA)  Can generalize for other variation ranges (within-die and lot-to-lot)  Fast run-time Process variation
  • 14.
    14 Variability Decomposition Example Input: 1000+ parameters (FET, RO, cap, res, …) in 65nm SOI tech -60 -40 -20 0 20 40 Most dominating die-to-die variation First three wafer-to-wafer variations 0 5 10 15 -20 -10 0 10 20 30 Wafer index Systematic variation 1st W2W PC 2nd W2W PC 3rd W2W PC
  • 15.
    15 Overview  Motivation – Current/ proposed methodologies  Proposed methodology – Statistical framework for tech-model-product co-design  Application – RF product development in three evolving 65nm SOI technologies  Conclusions – Summary and contributions
  • 16.
    16 Application: Background  Current-modelogic (CML) current-controlled oscillator (ICO) was developed – Critical function block in microprocessor clocking – Migrated from 90nm to 65nm – Challenging design issues: reduced Vdd headroom, increased nonlinearity/variation/leakage.
  • 17.
    17 Product Design Decision Device tuning via statistical measurements – Floating body (FB) vs body contacted (BC) in differential pair NFETs BOX STI STI n+ n+ body gate source drain BOX STI STI n+ n+ body gate source drain n+ p+ p- n+ p+ source drain gate body n+ p+ p- n+ p+ source drain gate body Correlation=98% 0 10 20 30 40 50 60 70 8 10 12 14 16 Die index Fosc (GHz) Gen 1 BC Gen 1 FB corr=98% FB BC Gen1 FB Gen1 BC 27% boost FB BC
  • 18.
    18 Cross-Correlation Analysis  Identifiedcritical process variation – Threshold voltage correlated with Fosc reduced 10 11 12 13 14 15 16 17 18 19 Vth Fosc (GHz) Generation 2 Generation 3 xcorr=94% xcorr=13% Gen3 Gen2
  • 19.
    19 Variability Decomposition  Dominantdie-to-die variations analyzed for three tech generations – Visualize how technology stabilizes. Generation 1 (Pre-production) Generation 2 Generation 3
  • 20.
    20 Statistical Yield Estimation Predicted yield for three generations – Calculated with Gaussian PDF fits 8 10 12 14 16 18 0 20 40 60 80 100 Fosc(GHz) Performance yield (%) Gen 1 BC Gen 1 FB Gen 2 Gen 3 0.3% 64% 99% 47% Target=12GHz
  • 21.
    21 Application Summary  ICOof 64-bit processor developed using proposed method across three 65nm tech generations, and met design specs in nominal and variation Target Gen1 Gen2 Gen3 10 15 Mean Fosc (GHz) 6 8 10 s Fosc /µ Fosc (%) Target Fosc = 12GHz Target Std=8% Both Fosc,Std failed Fosc passed, Std failed Fosc,Std passed
  • 22.
    22 Overview  Motivation – Current/ proposed methodologies  Proposed methodology – Statistical framework for tech-model-product co-design  Application – RF product development in three evolving 65nm SOI technologies  Conclusions – Summary and contributions
  • 23.
    23 Conclusions  A simplestatistical framework is presented to expedite co-design of tech-model-product, based on three tools: 1. Cross-correlation analysis: identifies device characteristics most related/sensitive to product performance 2. Statistical yield estimation: predicts yield based on HW data 3. Variability decomposition: separates systematic variability for analysis and visualization  Case study: ICO of microprocessor – Yield enhancement from 47% to 99% over three 65nm tech generations
  • 24.