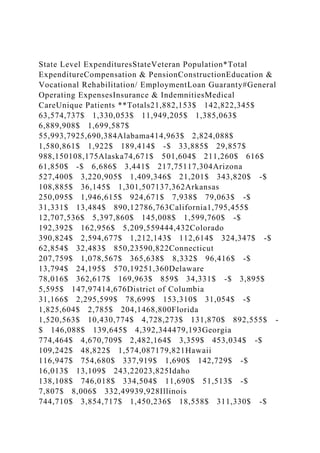
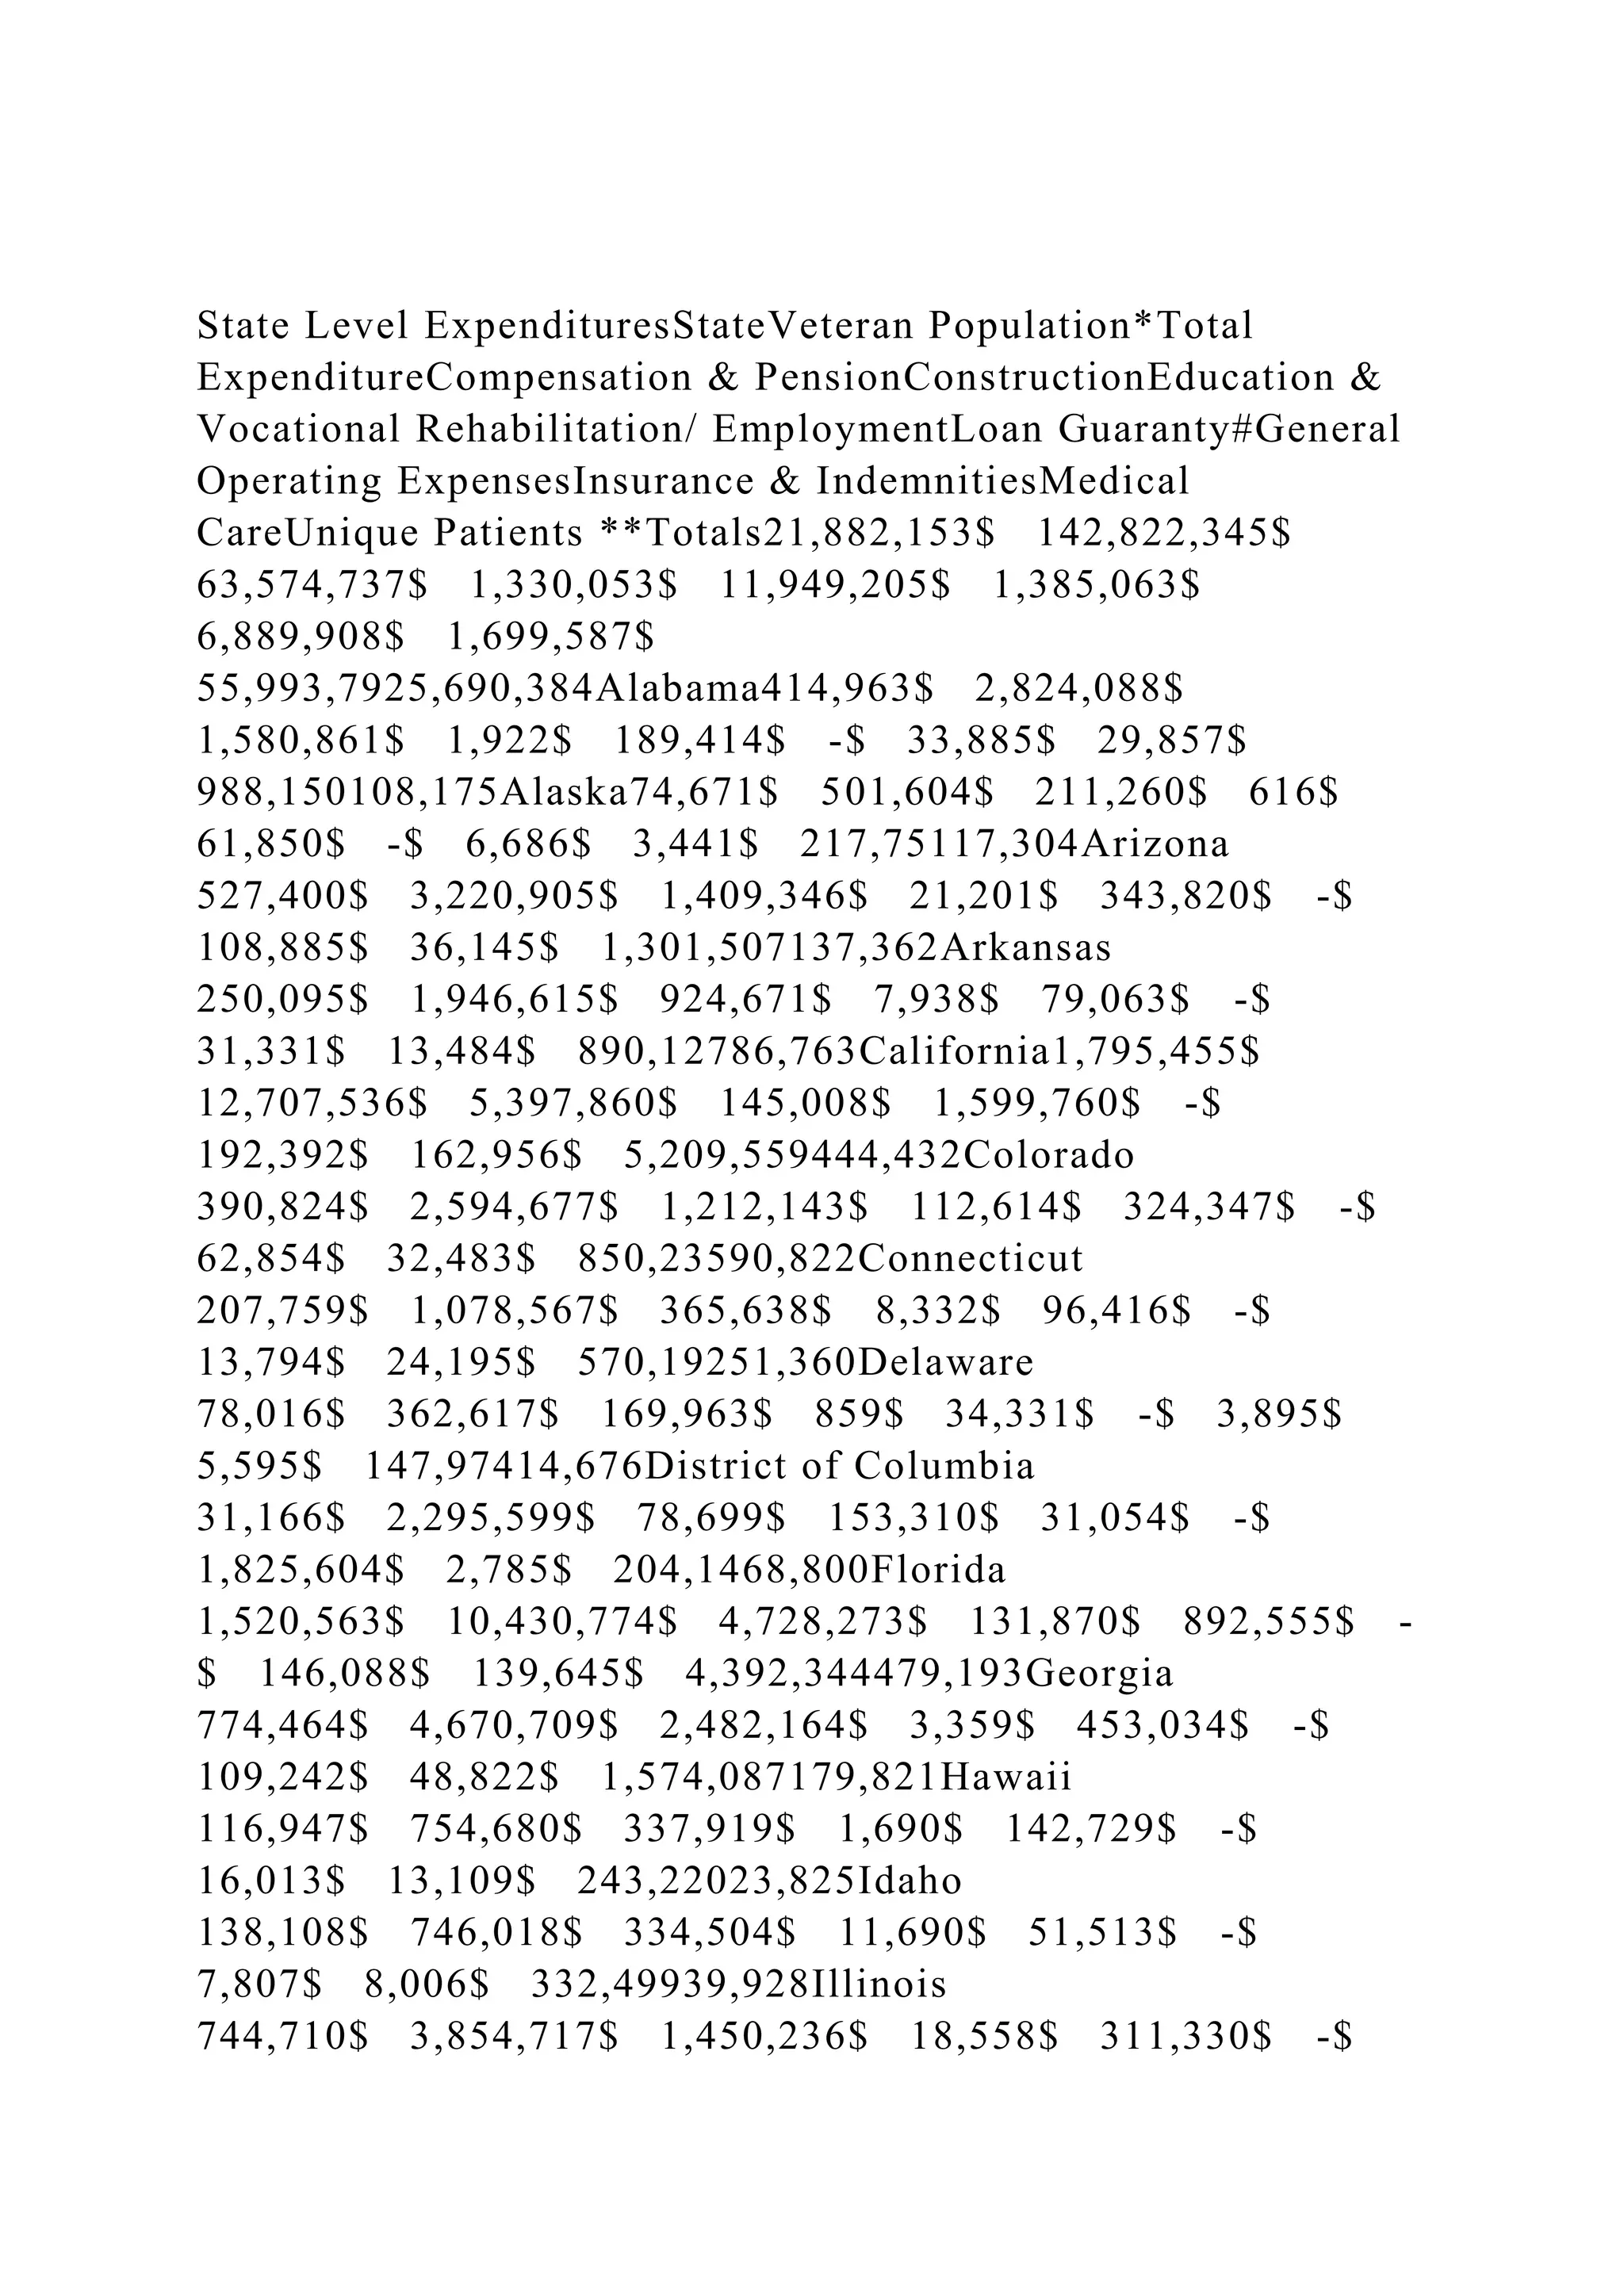
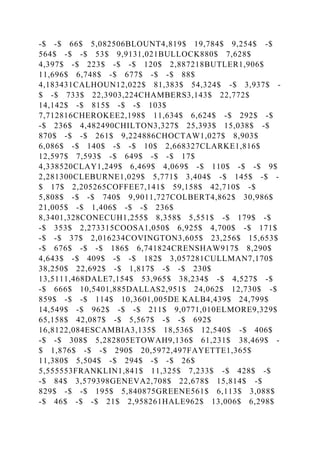
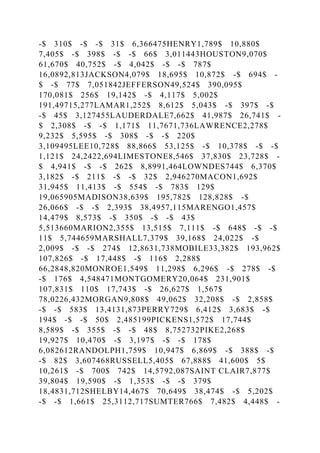
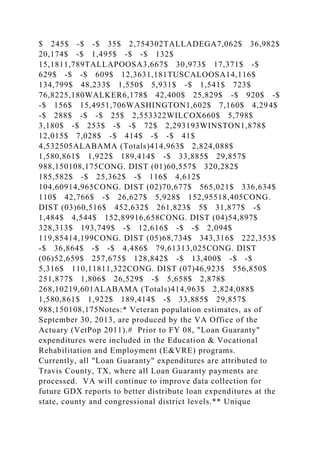
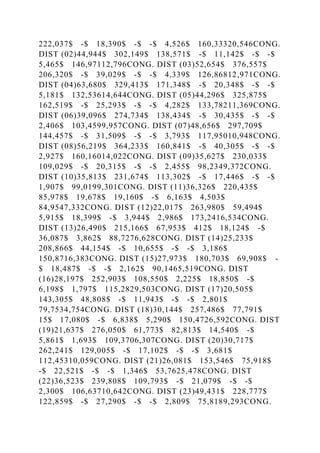
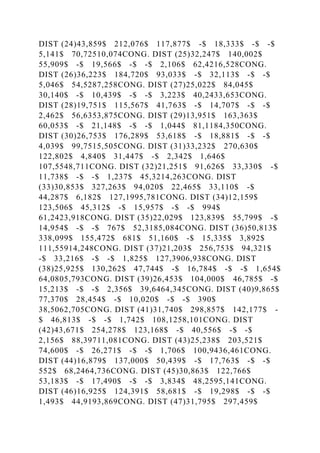
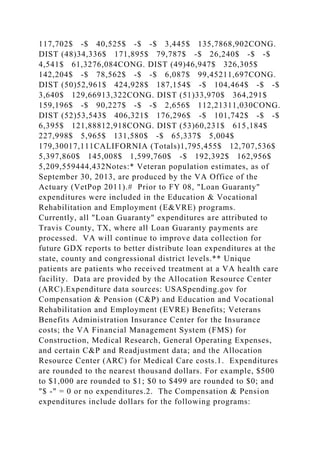
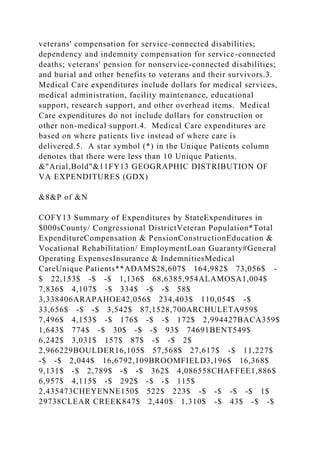
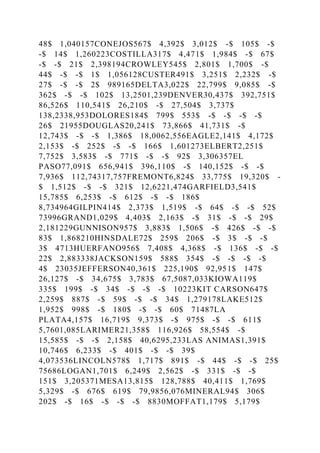
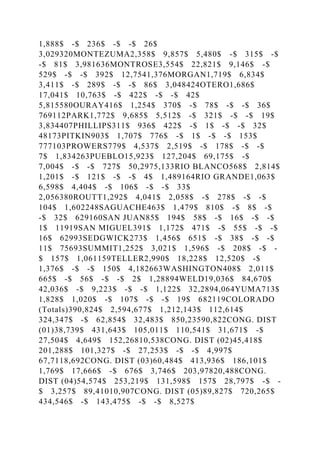
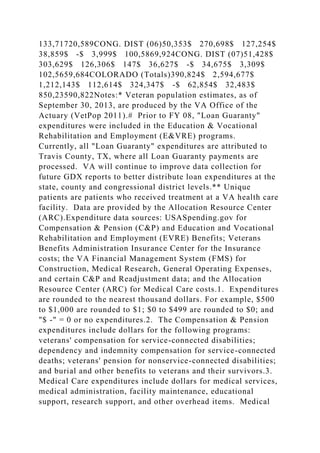
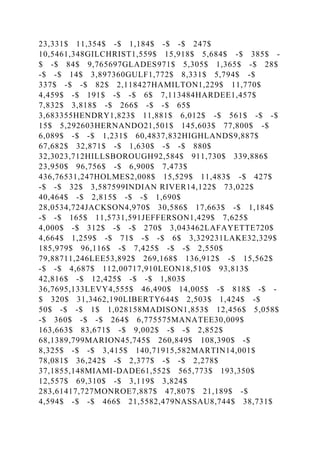
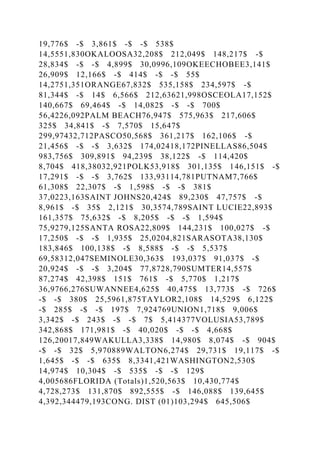
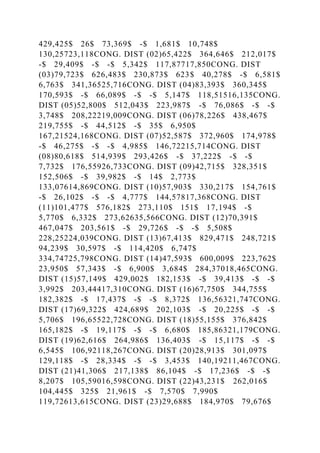
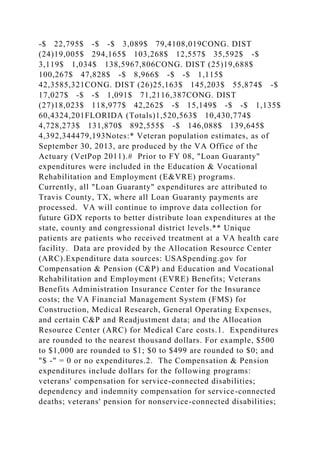
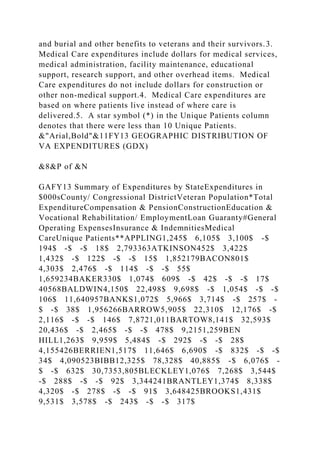
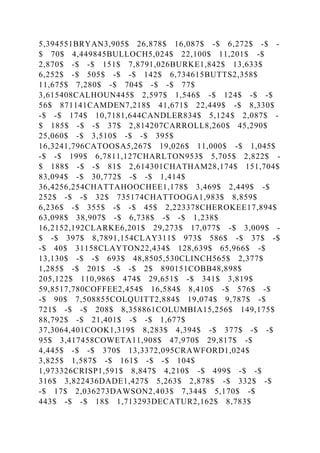
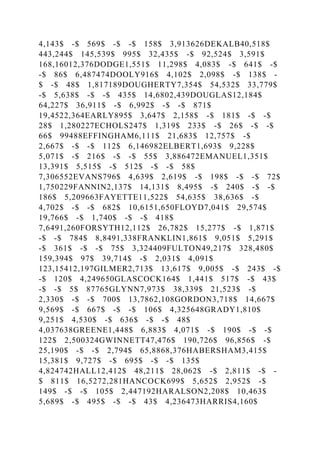
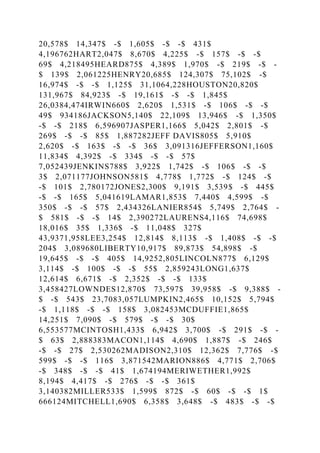
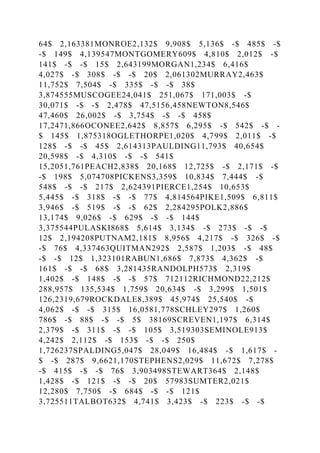
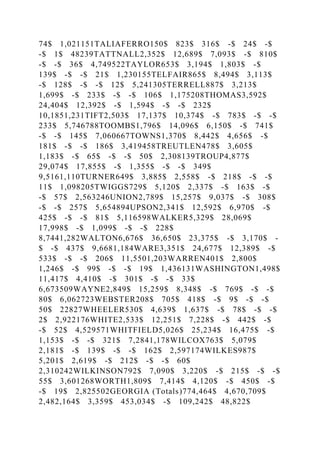
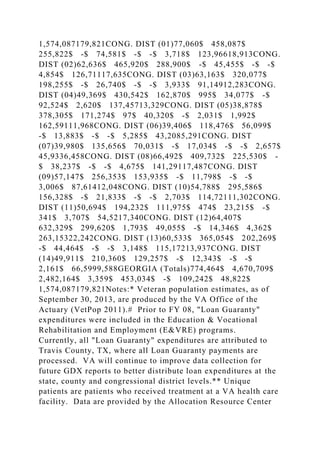
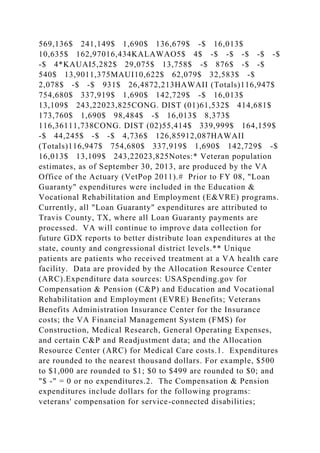
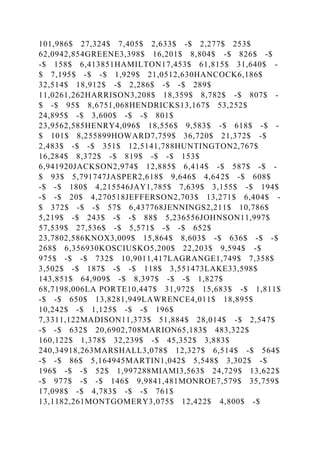
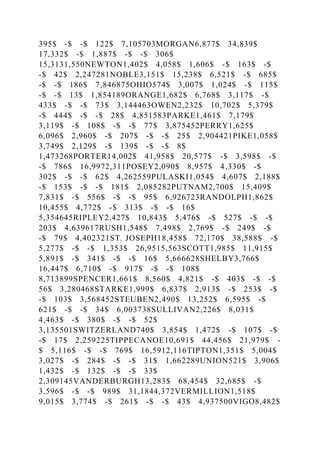
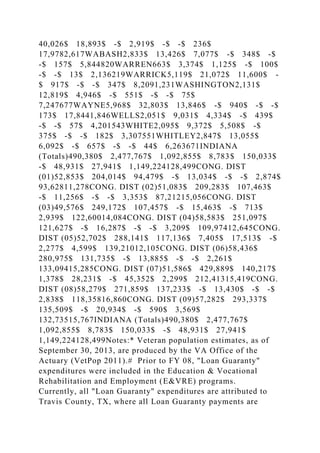
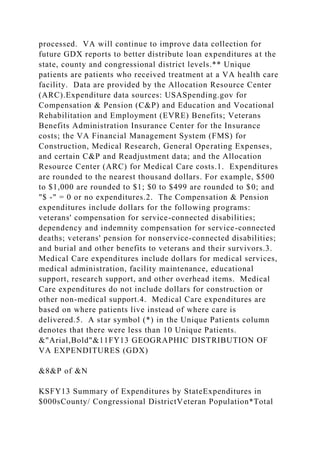
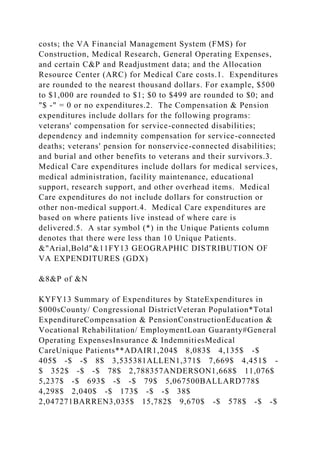
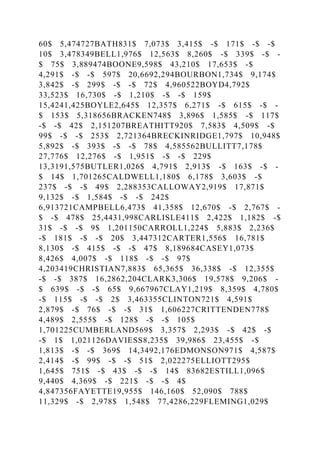
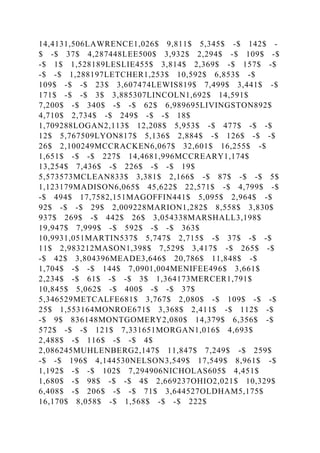
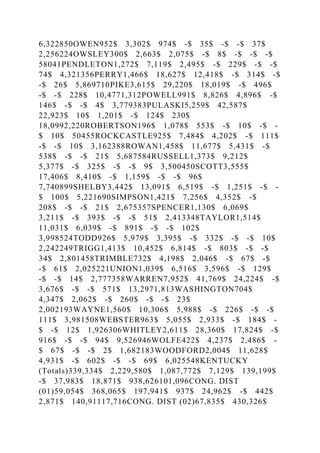
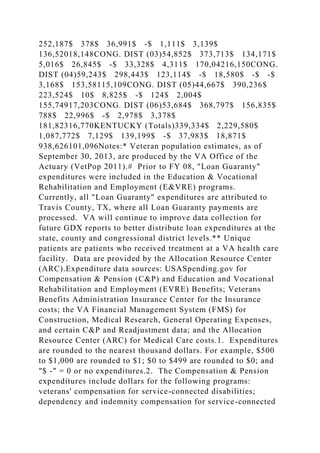
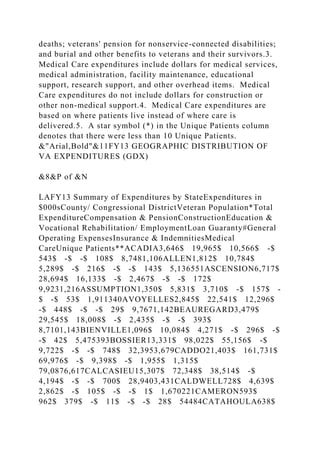
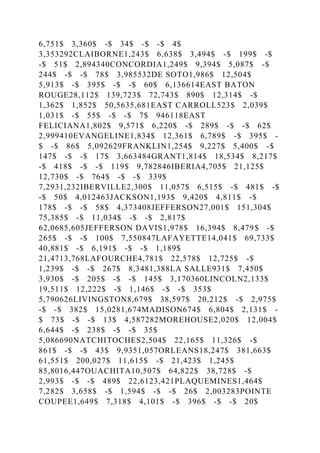
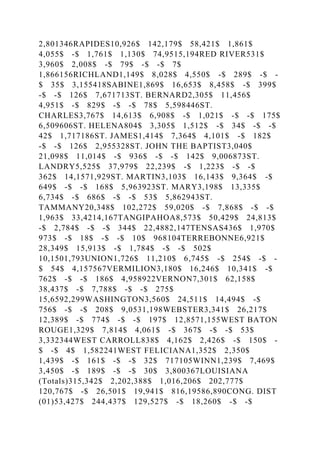
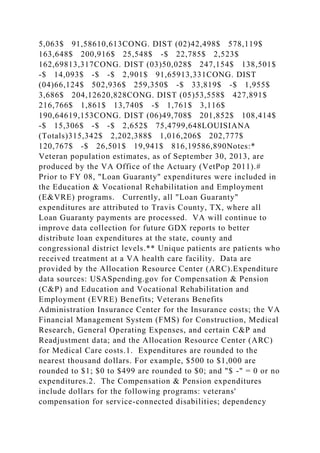
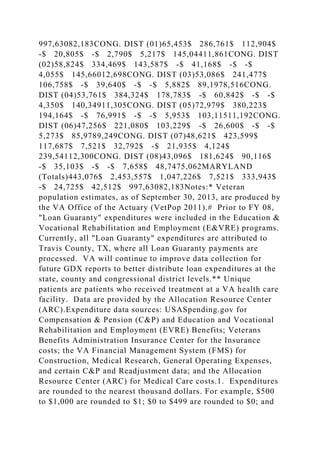
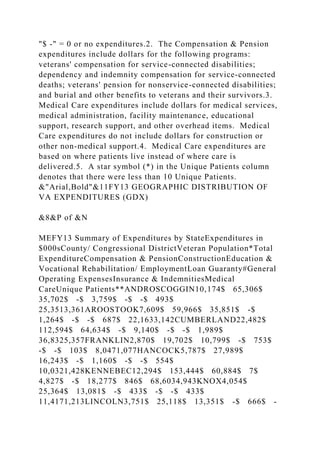
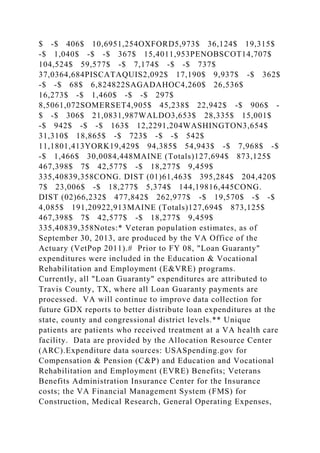
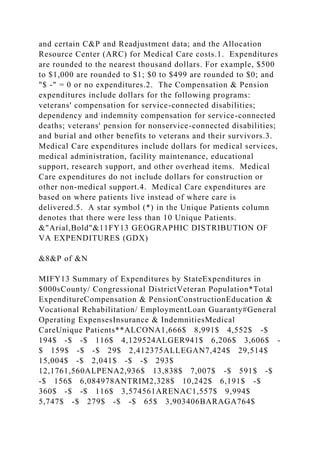
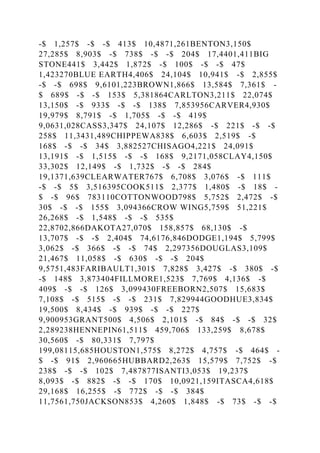
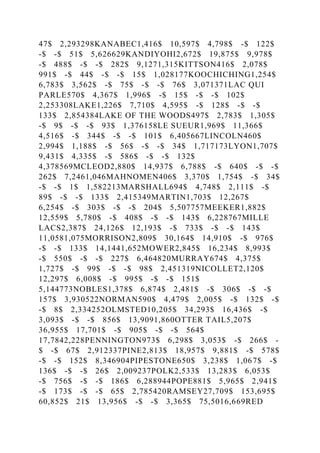
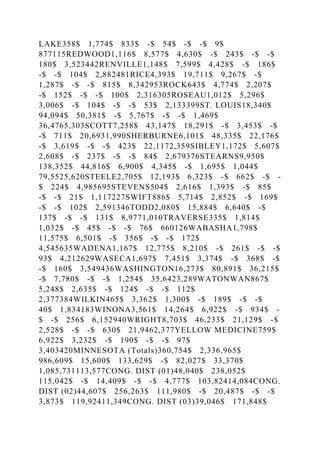
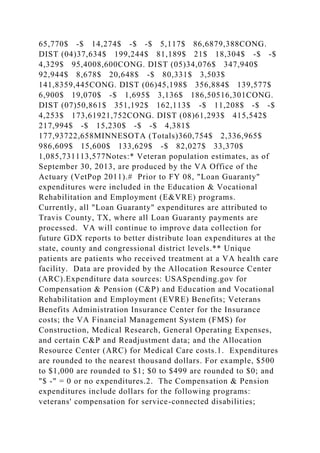
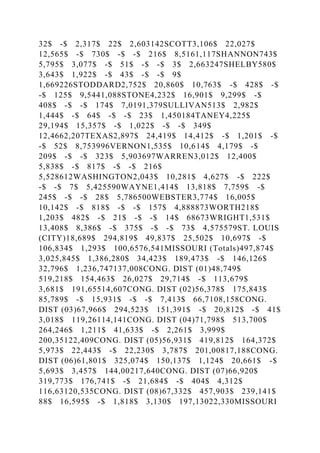
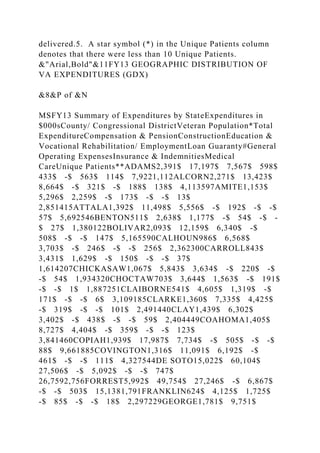
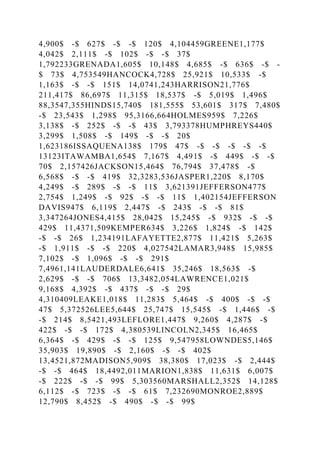
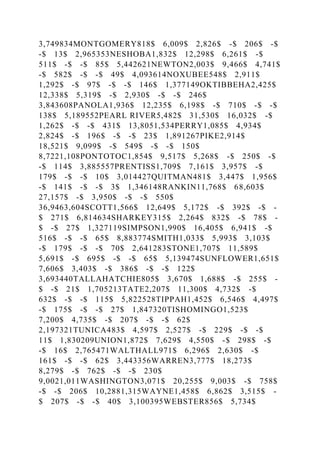
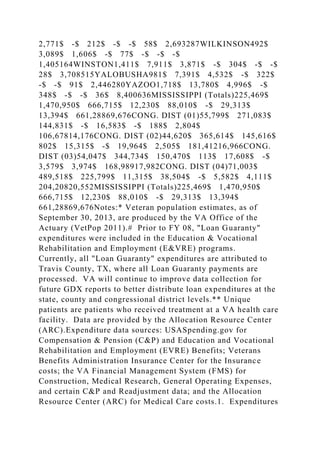
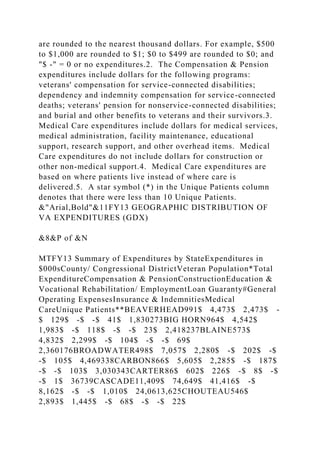
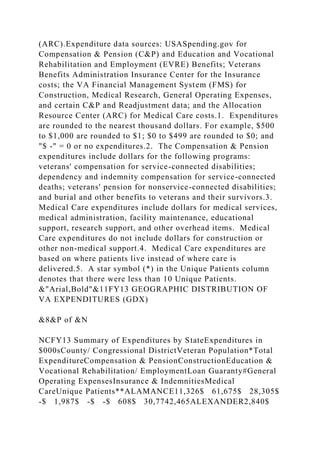
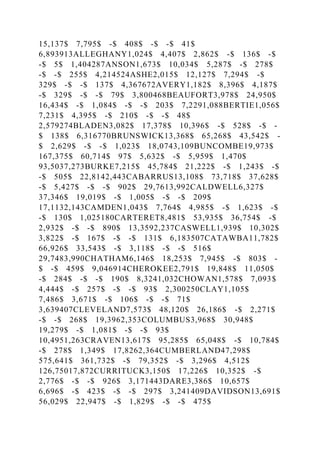
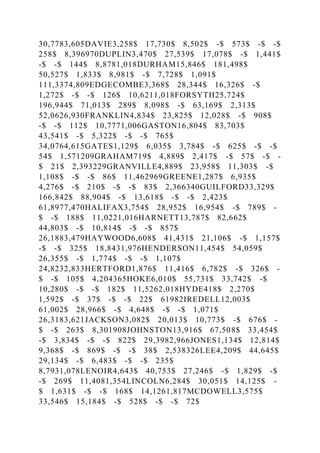
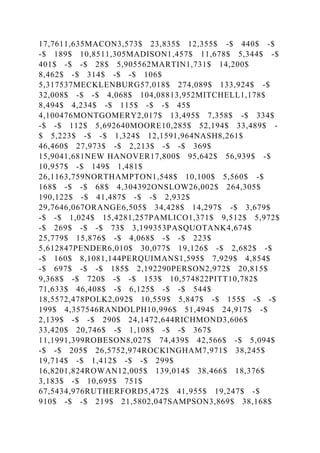
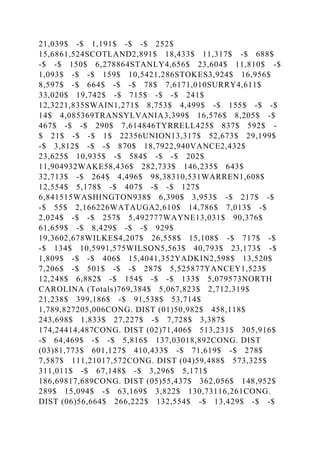
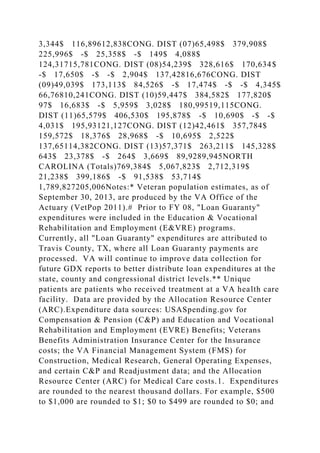
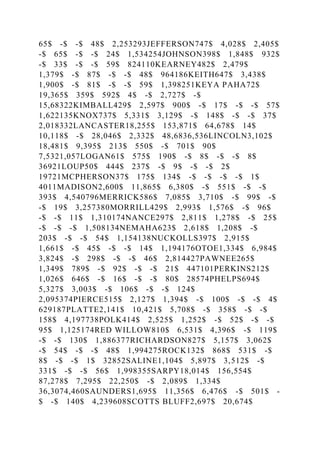
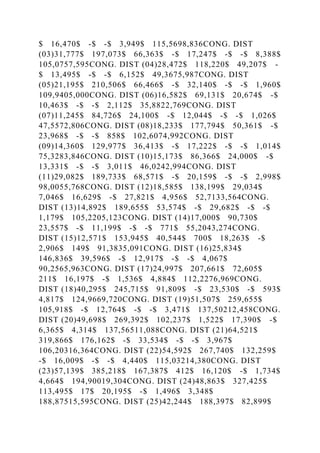
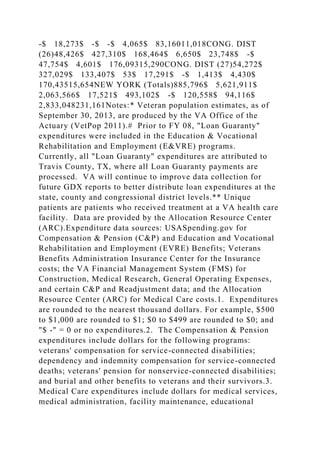
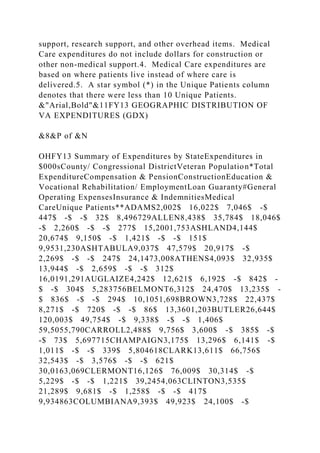
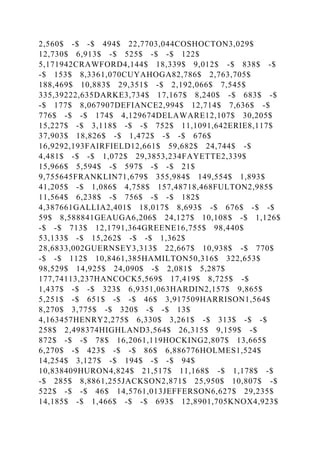
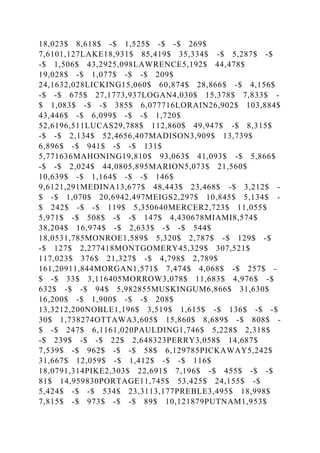
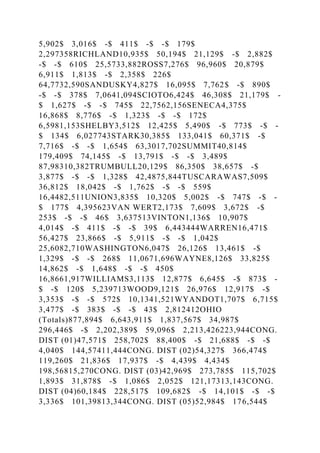
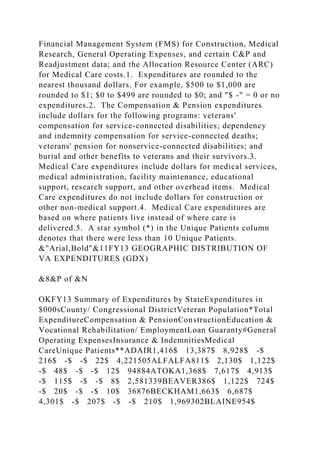
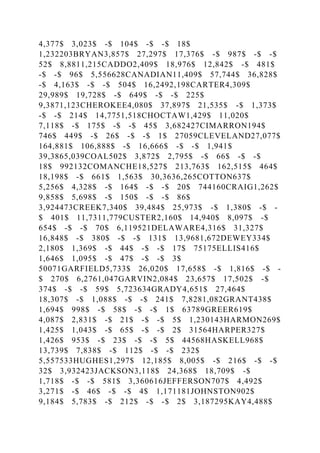
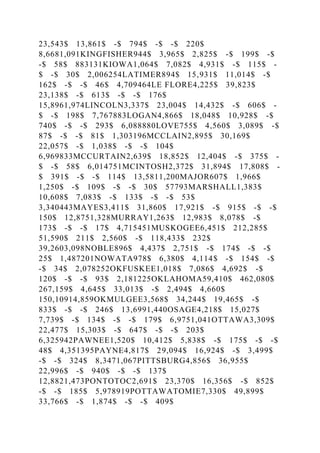
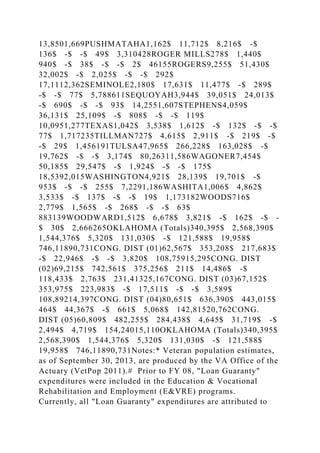
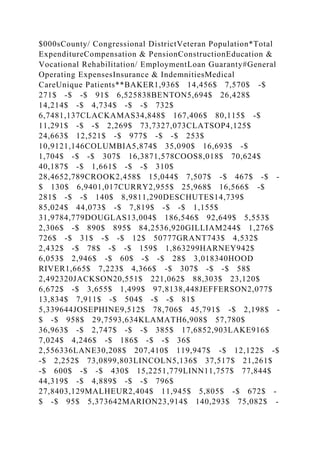
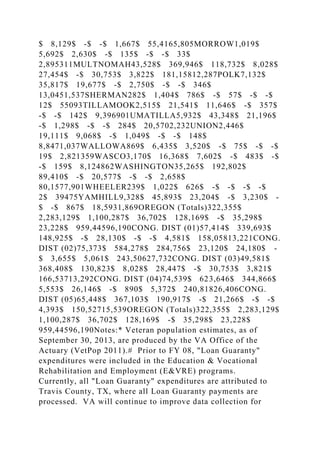
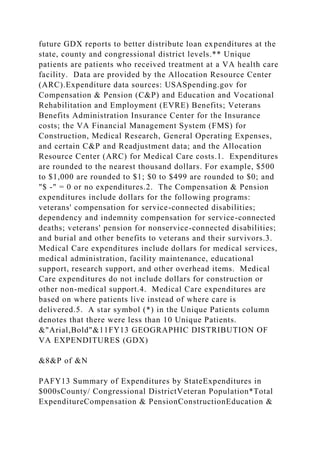
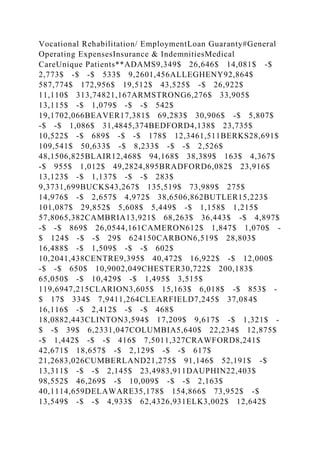
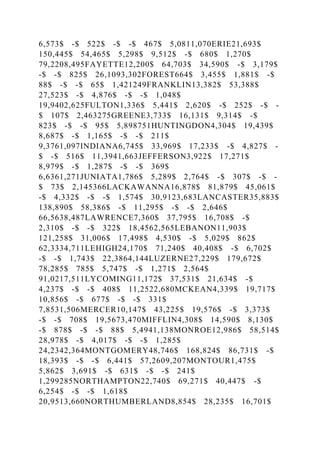
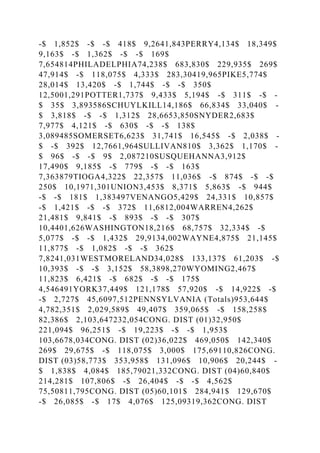
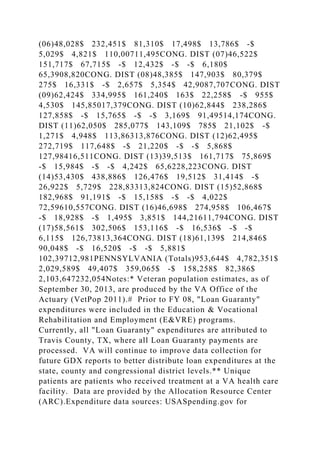
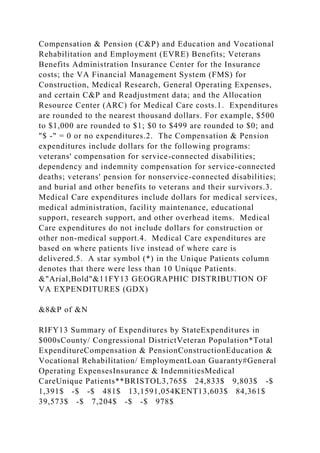
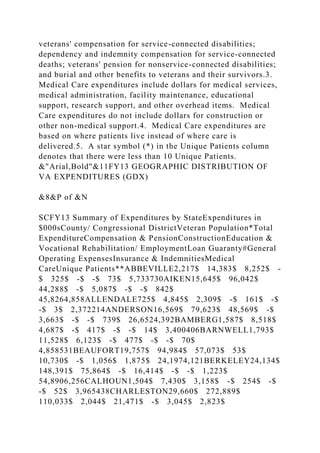
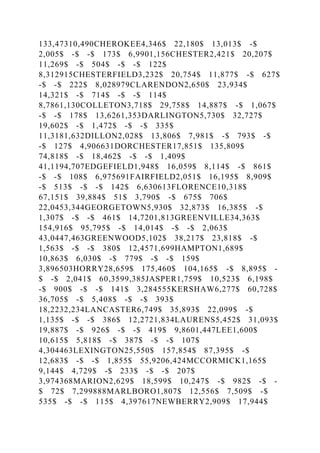
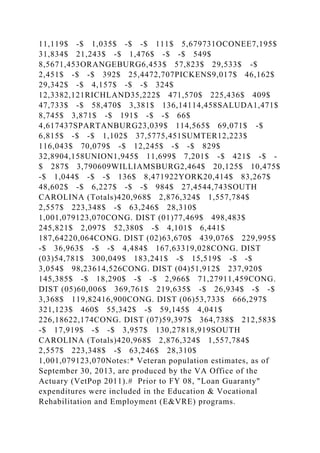
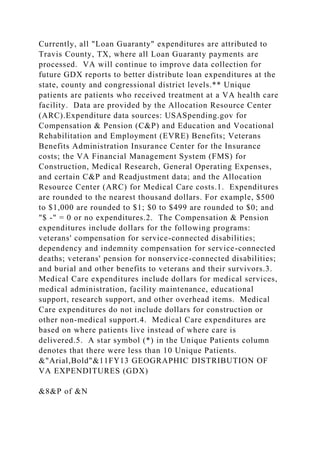
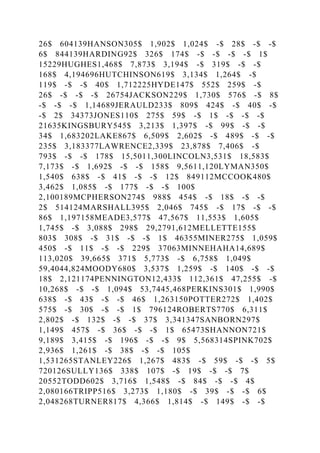
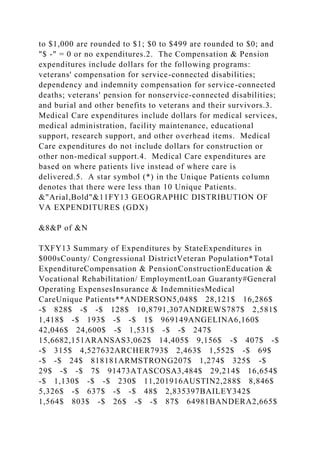
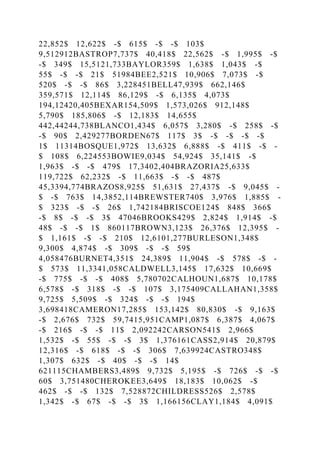
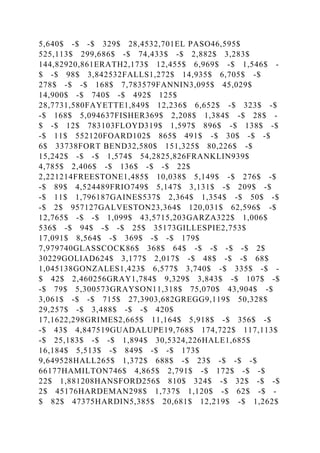
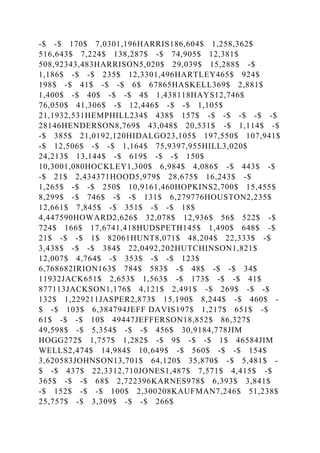
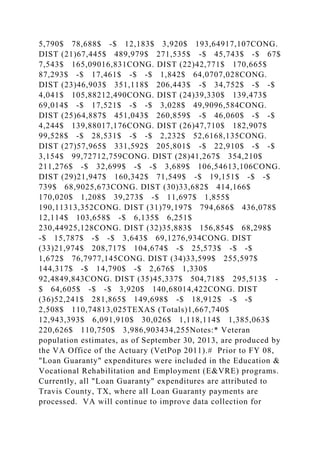
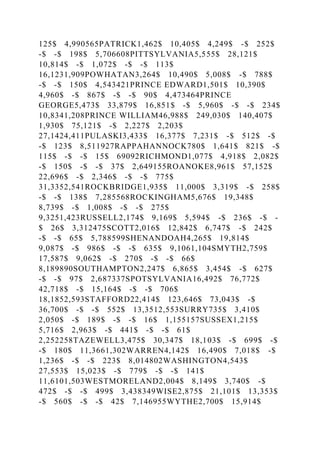
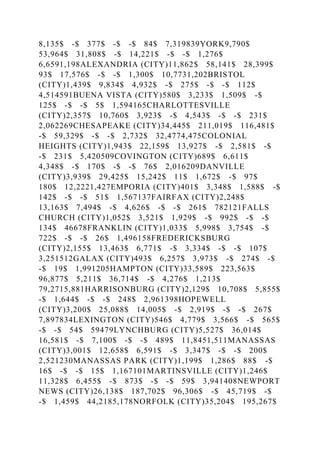
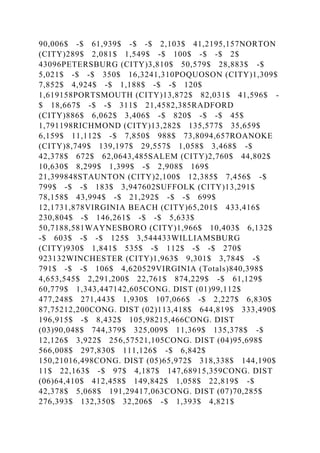
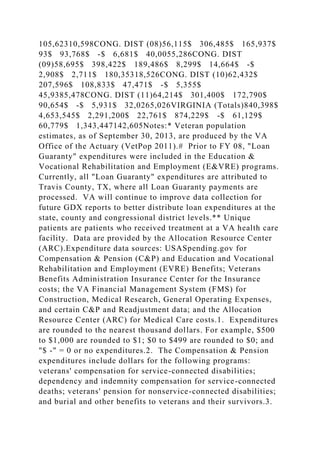
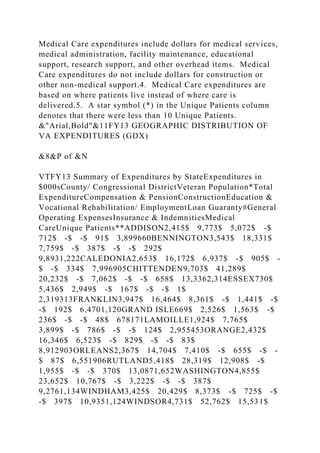
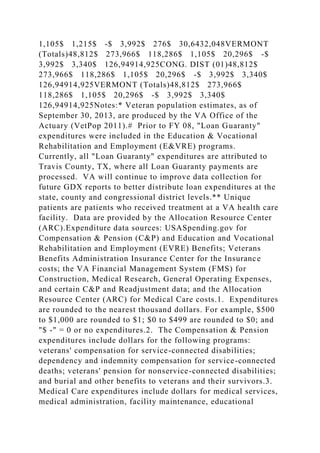
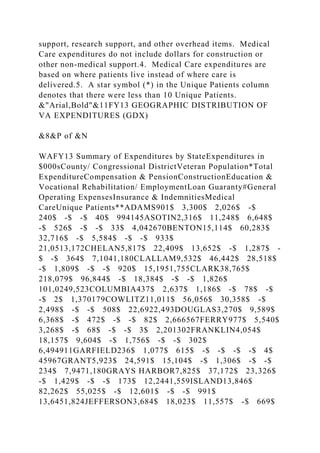
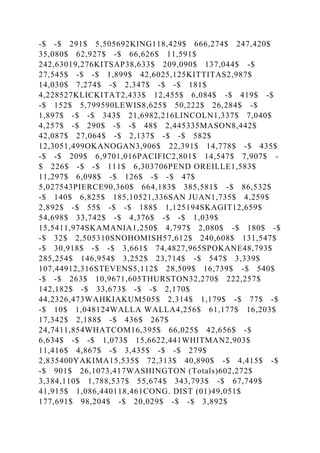
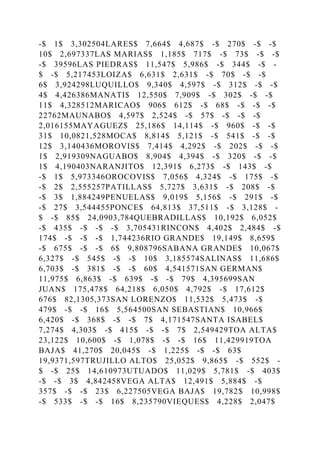
State Level ExpendituresStateVeteran Population*Total
ExpenditureCompensation & PensionConstructionEducation &
Vocational Rehabilitation/ EmploymentLoan Guaranty#General
Operating ExpensesInsurance & IndemnitiesMedical
CareUnique Patients **Totals21,882,153$ 142,822,345$
63,574,737$ 1,330,053$ 11,949,205$ 1,385,063$
6,889,908$ 1,699,587$
55,993,7925,690,384Alabama414,963$ 2,824,088$
1,580,861$ 1,922$ 189,414$ -$ 33,885$ 29,857$
988,150108,175Alaska74,671$ 501,604$ 211,260$ 616$
61,850$ -$ 6,686$ 3,441$ 217,75117,304Arizona
527,400$ 3,220,905$ 1,409,346$ 21,201$ 343,820$ -$
108,885$ 36,145$ 1,301,507137,362Arkansas
250,095$ 1,946,615$ 924,671$ 7,938$ 79,063$ -$
31,331$ 13,484$ 890,12786,763California1,795,455$
12,707,536$ 5,397,860$ 145,008$ 1,599,760$ -$
192,392$ 162,956$ 5,209,559444,432Colorado
390,824$ 2,594,677$ 1,212,143$ 112,614$ 324,347$ -$
62,854$ 32,483$ 850,23590,822Connecticut
207,759$ 1,078,567$ 365,638$ 8,332$ 96,416$ -$
13,794$ 24,195$ 570,19251,360Delaware
78,016$ 362,617$ 169,963$ 859$ 34,331$ -$ 3,895$
5,595$ 147,97414,676District of Columbia
31,166$ 2,295,599$ 78,699$ 153,310$ 31,054$ -$
1,825,604$ 2,785$ 204,1468,800Florida
1,520,563$ 10,430,774$ 4,728,273$ 131,870$ 892,555$ -
$ 146,088$ 139,645$ 4,392,344479,193Georgia
774,464$ 4,670,709$ 2,482,164$ 3,359$ 453,034$ -$
109,242$ 48,822$ 1,574,087179,821Hawaii
116,947$ 754,680$ 337,919$ 1,690$ 142,729$ -$
16,013$ 13,109$ 243,22023,825Idaho
138,108$ 746,018$ 334,504$ 11,690$ 51,513$ -$
7,807$ 8,006$ 332,49939,928Illinois
744,710$ 3,854,717$ 1,450,236$ 18,558$ 311,330$ -$
51,835$ 65,139$ 1,957,618180,384Indiana
490,380$ 2,477,767$ 1,092,855$ 8,783$ 150,033$ -$
48,931$ 27,941$ 1,149,224128,499Iowa
233,815$ 1,192,889$ 505,601$ 79$ 74,079$ -$ 10,585$
18,891$ 583,65372,191Kansas
223,708$ 1,237,985$ 529,023$ 743$ 103,950$ -$
27,158$ 17,340$ 559,77158,097Kentucky
339,334$ 2,229,580$ 1,087,772$ 7,129$ 139,199$ -$
37,983$ 18,871$ 938,626101,096Louisiana
315,342$ 2,202,388$ 1,016,206$ 202,777$ 120,767$ -$
26,501$ 19,941$ 816,19586,890Maine
127,694$ 873,125$ 467,398$ 7$ 42,577$ -$ 18,277$
9,459$ 335,40839,358Maryland
443,076$ 2,453,557$ 1,047,226$ 7,521$ 333,943$ -$
24,725$ 42,512$ 997,63082,183Massachusetts374,809$
2,371,613$ 985,894$ 20,552$ 192,975$ -$ 32,546$
41,235$ 1,098,41284,345Michigan660,773$ 3,361,961$
1,675,388$ 6,185$ 208,565$ -$ 51,291$ 43,961$
1,376,571146,804Minnesota360,754$ 2,336,965$ 986,609$
15,600$ 133,629$ -$ 82,027$ 33,370$
1,085,731113,577Mississippi225,469$ 1,470,950$ 666,715$
12,230$ 88,010$ -$ 29,313$ 13,394$
661,28869,676Missouri
497,874$ 3,025,845$ 1,386,280$ 34,423$ 189,473$ -$
146,126$ 32,796$ 1,236,747137,008Montana
101,597$ 646,509$ 290,869$ 8$ 38,237$ -$ 7,765$
7,072$ 302,55835,189Nebraska
138,773$ 1,023,761$ 487,975$ 9,837$ 63,597$ -$
36,470$ 12,589$ 413,29447,275Nevada
225,933$ 1,573,091$ 641,969$ 19,641$ 95,562$ -$
13,505$ 14,516$ 787,89965,443New Hampshire
110,778$ 613,805$ 268,735$ 1,282$ 50,861$ -$ 6,142$
8,473$ 278,31228,604New Jersey
425,094$ 1,927,021$ 906,744$ 6,578$ 196,113$ -$
15,868$ 51,994$ 749,72477,179New Mexico
170,699$ 1,312,943$ 686,222$ 26,571$ 67,315$ -$
12,586$ 12,750$ 507,49949,981New York
885,796$ 5,621,911$ 2,063,566$ 17,521$ 493,102$ -$
120,558$ 94,116$ 2,833,048231,161North Carolina
769,384$ 5,067,823$ 2,712,319$ 21,238$ 399,186$ -$
91,538$ 53,714$ 1,789,827205,006North Dakota
56,213$ 334,755$ 149,596$ 2,623$ 22,770$ -$ 6,479$
3,770$ 149,51818,526Ohio
877,894$ 6,643,911$ 1,837,567$ 34,987$ 296,446$ -$
2,202,389$ 59,096$ 2,213,426223,944Oklahoma
340,395$ 2,568,390$ 1,544,376$ 5,320$ 131,030$ -$
121,588$ 19,958$ 746,11890,731Oregon
322,355$ 2,283,129$ 1,100,287$ 36,702$ 128,169$ -$
35,298$ 23,228$ 959,44596,190Pennsylvania
953,644$ 4,782,351$ 2,029,589$ 49,407$ 359,065$ -$
158,258$ 82,386$ 2,103,647232,054Rhode Island
69,206$ 474,338$ 193,988$ 2,867$ 35,525$ -$ 19,476$
5,928$ 216,55520,132South Carolina
420,968$ 2,876,324$ 1,557,784$ 2,557$ 223,348$ -$
63,246$ 28,310$ 1,001,079123,070South Dakota
75,687$ 564,489$ 209,347$ 1,976$ 30,364$ -$ 10,392$
5,461$ 306,94929,744Tennessee
521,267$ 3,320,710$ 1,652,616$ 6,443$ 236,754$ -$
63,014$ 33,644$ 1,328,239135,582Texas
1,667,740$ 12,943,393$ 6,091,910$ 30,026$ 1,118,114$
1,385,063$ 220,626$ 110,750$ 3,986,903434,255Utah
150,771$ 887,516$ 350,923$ 6,163$ 85,974$ -$
53,145$ 10,033$ 381,27934,062Vermont
48,812$ 273,966$ 118,286$ 1,105$ 20,296$ -$ 3,992$
3,340$ 126,94914,925Virginia
840,398$ 4,653,545$ 2,291,200$ 22,761$ 874,229$ -$
61,129$ 60,779$ 1,343,447142,605Washington
602,272$ 3,384,110$ 1,788,537$ 55,674$ 343,793$ -$
67,749$ 41,915$ 1,086,440118,461West Virginia
173,389$ 1,601,256$ 625,689$ 6,525$ 44,341$ -$
261,560$ 9,871$ 653,27058,733Wisconsin
409,419$ 2,421,849$ 972,511$ 12,224$ 133,679$ -$
69,991$ 34,398$ 1,199,045118,371Wyoming
56,518$ 343,611$ 127,557$ 7,264$ 15,751$ -$ 1,456$
3,131$ 188,45318,583Puerto Rico
99,928$ 1,387,777$ 697,879$ 7,756$ 46,541$ -$
19,912$ 2,496$ 613,19358,009Guam9,055$ 66,330$
46,193$ -$ 10,629$ -$ -$ 495$ 9,0120Totals21,882,153$
142,822,345$ 63,574,737$ 1,330,053$ 11,949,205$
1,385,063$ 6,889,908$ 1,699,587$
55,993,7925,690,384Notes:* Veteran population estimates, as of
September 30, 2013, are produced by the VA Office of the
Actuary (VetPop 2011).# Prior to FY 08, "Loan Guaranty"
expenditures were included in the Education & Vocational
Rehabilitation and Employment (E&VRE) programs.
Currently, all "Loan Guaranty" expenditures are attributed to
Travis County, TX, where all Loan Guaranty payments are
processed. VA will continue to improve data collection for
future GDX reports to better distribute loan expenditures at the
state, county and congressional district levels.** Unique
patients are patients who received treatment at a VA health care
facility. Data are provided by the Allocation Resource Center
(ARC).Expenditure data sources: USASpending.gov for
Compensation & Pension (C&P) and Education and Vocational
Rehabilitation and Employment (EVRE) Benefits; Veterans
Benefits Administration Insurance Center for the Insurance
costs; the VA Financial Management System (FMS) for
Construction, Medical Research, General Operating Expenses,
and certain C&P and Readjustment data; and the Allocation
Resource Center (ARC) for Medical Care costs.1. Expenditures
are rounded to the nearest thousand dollars. For example, $500
to $1,000 are rounded to $1; $0 to $499 are rounded to $0; and
"$ -" = 0 or no expenditures.2. The Compensation & Pension
expenditures include dollars for the following programs:
veterans' compensation for service-connected disabilities;
dependency and indemnity compensation for service-connected
deaths; veterans' pension for nonservice-connected disabilities;
and burial and other benefits to veterans and their survivors.3.
Medical Care expenditures include dollars for medical services,
medical administration, facility maintenance, educational
support, research support, and other overhead items. Medical
Care expenditures do not include dollars for construction or
other non-medical support.4. Medical Care expenditures are
based on where patients live instead of where care is
delivered.5. A star symbol (*) in the Unique Patients column
denotes that there were less than 10 Unique Patients..
&"Arial,Bold"&11FY13 GEOGRAPHIC DISTRIBUTION OF
VA EXPENDITURES (GDX)
&8&P of &N
AKFY13 Summary of Expenditures by StateExpenditures in
$000sCounty/ Congressional DistrictVeteran Population*Total
ExpenditureCompensation & PensionConstructionEducation &
Vocational Rehabilitation/ EmploymentLoan Guaranty#General
Operating ExpensesInsurance & IndemnitiesMedical
CareUnique Patients**ALEUTIANS EAST159$ 154$ 38$ -$
31$ -$ -$ 3$ 8212ALEUTIANS WEST385$ 154$ 116$
-$ 1$ -$ -$ -$ 3711ANCHORAGE30,663$ 252,992$
99,940$ 383$ 33,941$ -$ 6,686$ 1,661$
110,3818,346BETHEL1,032$ 1,169$ 651$ -$ 96$ -$ -$
-$ 42364BRISTOL BAY149$ 323$ 227$ -$ -$ -$ -$ -
$ 9614DENALI254$ 1,493$ 480$ -$ 147$ -$ -$ 21$
84548DILLINGHAM317$ 528$ 265$ -$ 52$ -$ -$ -$
21130FAIRBANKS N. STAR12,819$ 75,424$ 35,639$ -$
12,835$ -$ -$ 560$ 26,3902,354HAINES284$ 1,094$
542$ -$ 30$ -$ -$ 1$ 52141HOONAH-ANGOON209$
650$ 340$ -$ 13$ -$ -$ 16$ 28138JUNEAU2,347$
11,564$ 5,441$ -$ 1,374$ -$ -$ 260$ 4,489434KENAI
PENINSULA5,513$ 39,419$ 15,015$ -$ 1,587$ -$ -$
229$ 22,5891,643KETCHIKAN GATEWAY1,517$ 4,064$
2,160$ -$ 352$ -$ -$ 20$ 1,532149KODIAK
ISLAND1,424$ 5,142$ 2,490$ -$ 1,025$ -$ -$ 71$
1,557144LAKE AND PENINSULA135$ 111$ 93$ -$ 5$ -
$ -$ -$ 12*MATANUSKA SUSITNA10,876$ 84,368$
36,825$ -$ 9,083$ -$ -$ 491$ 37,9703,074NOME688$
864$ 446$ -$ 78$ -$ -$ -$ 33940NORTH SLOPE389$
362$ 246$ -$ 2$ -$ -$ 1$ 11325NORTHWEST
ARCTIC485$ 271$ 174$ -$ 32$ -$ -$ -$
65*PETERSBURG427$ 1,110$ 721$ -$ 30$ -$ -$ 6$
35344PRINCE OF WALES-HYDER572$ 2,364$ 871$ -$
15$ -$ -$ 22$ 1,455105SITKA858$ 2,762$ 1,309$
233$ 257$ -$ -$ 39$ 923108SKAGWAY90$ 161$ 38$
-$ -$ -$ -$ -$ 12314SOUTHEAST FAIRBANKS761$
5,891$ 3,338$ -$ 395$ -$ -$ 17$ 2,142218VALDEZ
CORDOVA1,127$ 5,610$ 1,950$ -$ 208$ -$ -$ 11$
3,441192WADE HAMPTON288$ 862$ 574$ -$ 16$ -$ -
$ -$ 27129WRANGELL285$ 801$ 361$ -$ 12$ -$ -$
11$ 41639YAKUTAT92$ 176$ 94$ -$ 22$ -$ -$ -$
60*YUKON KOYUKUK528$ 1,721$ 873$ -$ 214$ -$ -$
-$ 63471ALASKA (Totals)74,671$ 501,604$ 211,260$
616$ 61,850$ -$ 6,686$ 3,441$ 217,75117,304CONG.
DIST (01)74,671$ 501,604$ 211,260$ 616$ 61,850$ -$
6,686$ 3,441$ 217,75117,304ALASKA (Totals)74,671$
501,604$ 211,260$ 616$ 61,850$ -$ 6,686$ 3,441$
217,75117,304Notes:* Veteran population estimates, as of
September 30, 2013, are produced by the VA Office of the
Actuary (VetPop 2011).# Prior to FY 08, "Loan Guaranty"
expenditures were included in the Education & Vocational
Rehabilitation and Employment (E&VRE) programs.
Currently, all "Loan Guaranty" expenditures are attributed to
Travis County, TX, where all Loan Guaranty payments are
processed. VA will continue to improve data collection for
future GDX reports to better distribute loan expenditures at the
state, county and congressional district levels.** Unique
patients are patients who received treatment at a VA health care
facility. Data are provided by the Allocation Resource Center
(ARC).Expenditure data sources: USASpending.gov for
Compensation & Pension (C&P) and Education and Vocational
Rehabilitation and Employment (EVRE) Benefits; Veterans
Benefits Administration Insurance Center for the Insurance
costs; the VA Financial Management System (FMS) for
Construction, Medical Research, General Operating Expenses,
and certain C&P and Readjustment data; and the Allocation
Resource Center (ARC) for Medical Care costs.1. Expenditures
are rounded to the nearest thousand dollars. For example, $500
to $1,000 are rounded to $1; $0 to $499 are rounded to $0; and
"$ -" = 0 or no expenditures.2. The Compensation & Pension
expenditures include dollars for the following programs:
veterans' compensation for service-connected disabilities;
dependency and indemnity compensation for service-connected
deaths; veterans' pension for nonservice-connected disabilities;
and burial and other benefits to veterans and their survivors.3.
Medical Care expenditures include dollars for medical services,
medical administration, facility maintenance, educational
support, research support, and other overhead items. Medical
Care expenditures do not include dollars for construction or
other non-medical support.4. Medical Care expenditures are
based on where patients live instead of where care is
delivered.5. A star symbol (*) in the Unique Patients column
denotes that there were less than 10 Unique Patients.
&"Arial,Bold"&11FY13 GEOGRAPHIC DISTRIBUTION OF
VA EXPENDITURES (GDX)
&8&P of &N
ALFY13 Summary of Expenditures by StateExpenditures in
$000sCounty/ Congressional DistrictVeteran Population*Total
ExpenditureCompensation & PensionConstructionEducation &
Vocational Rehabilitation/ EmploymentLoan Guaranty#General
Operating ExpensesInsurance & IndemnitiesMedical
CareUnique Patients**AUTAUGA6,044$ 43,947$ 26,671$ -
$ 5,011$ -$ -$ 363$ 11,9011,339BALDWIN20,214$
85,654$ 52,417$ -$ 6,755$ -$ -$ 1,802$
24,6804,357BARBOUR2,391$ 14,452$ 9,476$ -$ 358$ -$
-$ 196$ 4,423583BIBB1,316$ 12,198$ 6,648$ -$ 402$
-$ -$ 66$ 5,082506BLOUNT4,819$ 19,784$ 9,254$ -$
564$ -$ -$ 53$ 9,9131,021BULLOCK880$ 7,628$
4,397$ -$ 223$ -$ -$ 120$ 2,887218BUTLER1,906$
11,696$ 6,748$ -$ 677$ -$ -$ 88$
4,183431CALHOUN12,022$ 81,383$ 54,324$ -$ 3,937$ -
$ -$ 733$ 22,3903,224CHAMBERS3,143$ 22,772$
14,142$ -$ 815$ -$ -$ 103$
7,712816CHEROKEE2,198$ 11,634$ 6,624$ -$ 292$ -$
-$ 236$ 4,482490CHILTON3,327$ 25,393$ 15,038$ -$
870$ -$ -$ 261$ 9,224886CHOCTAW1,027$ 8,903$
6,086$ -$ 140$ -$ -$ 10$ 2,668327CLARKE1,816$
12,597$ 7,593$ -$ 649$ -$ -$ 17$
4,338520CLAY1,249$ 6,469$ 4,069$ -$ 110$ -$ -$ 9$
2,281300CLEBURNE1,029$ 5,771$ 3,404$ -$ 145$ -$ -
$ 17$ 2,205265COFFEE7,141$ 59,158$ 42,710$ -$
5,808$ -$ -$ 740$ 9,9011,727COLBERT4,862$ 30,986$
21,005$ -$ 1,406$ -$ -$ 236$
8,3401,328CONECUH1,255$ 8,358$ 5,551$ -$ 179$ -$
-$ 353$ 2,273315COOSA1,050$ 6,925$ 4,700$ -$ 171$
-$ -$ 37$ 2,016234COVINGTON3,605$ 23,256$ 15,653$
-$ 676$ -$ -$ 186$ 6,741824CRENSHAW917$ 8,290$
4,643$ -$ 409$ -$ -$ 182$ 3,057281CULLMAN7,170$
38,250$ 22,692$ -$ 1,817$ -$ -$ 230$
13,5111,468DALE7,154$ 53,965$ 38,234$ -$ 4,527$ -$
-$ 666$ 10,5401,885DALLAS2,951$ 24,062$ 12,730$ -$
859$ -$ -$ 114$ 10,3601,005DE KALB4,439$ 24,799$
14,549$ -$ 962$ -$ -$ 211$ 9,0771,010ELMORE9,329$
65,158$ 42,087$ -$ 5,567$ -$ -$ 692$
16,8122,084ESCAMBIA3,135$ 18,536$ 12,540$ -$ 406$
-$ -$ 308$ 5,282805ETOWAH9,136$ 61,231$ 38,469$ -
$ 1,876$ -$ -$ 290$ 20,5972,497FAYETTE1,365$
11,380$ 5,504$ -$ 294$ -$ -$ 26$
5,555553FRANKLIN1,841$ 11,325$ 7,233$ -$ 428$ -$
-$ 84$ 3,579398GENEVA2,708$ 22,678$ 15,814$ -$
829$ -$ -$ 195$ 5,840875GREENE561$ 6,113$ 3,088$
-$ 46$ -$ -$ 21$ 2,958261HALE962$ 13,006$ 6,298$
-$ 310$ -$ -$ 31$ 6,366475HENRY1,789$ 10,880$
7,405$ -$ 398$ -$ -$ 66$ 3,011443HOUSTON9,070$
61,670$ 40,752$ -$ 4,042$ -$ -$ 787$
16,0892,813JACKSON4,079$ 18,695$ 10,872$ -$ 694$ -
$ -$ 77$ 7,051842JEFFERSON49,524$ 390,095$
170,081$ 256$ 19,142$ -$ 4,117$ 5,002$
191,49715,277LAMAR1,252$ 8,612$ 5,043$ -$ 397$ -$
-$ 45$ 3,127455LAUDERDALE7,662$ 41,987$ 26,741$ -
$ 2,308$ -$ -$ 1,171$ 11,7671,736LAWRENCE2,278$
9,232$ 5,595$ -$ 308$ -$ -$ 220$
3,109495LEE10,728$ 88,866$ 53,125$ -$ 10,378$ -$ -$
1,121$ 24,2422,694LIMESTONE8,546$ 37,830$ 23,728$ -
$ 4,941$ -$ -$ 262$ 8,8991,464LOWNDES744$ 6,370$
3,182$ -$ 211$ -$ -$ 32$ 2,946270MACON1,692$
31,945$ 11,413$ -$ 554$ -$ 783$ 129$
19,065905MADISON38,639$ 195,782$ 128,828$ -$
26,066$ -$ -$ 2,393$ 38,4957,115MARENGO1,457$
14,479$ 8,573$ -$ 350$ -$ -$ 43$
5,513660MARION2,355$ 13,515$ 7,111$ -$ 648$ -$ -$
11$ 5,744659MARSHALL7,379$ 39,168$ 24,022$ -$
2,009$ -$ -$ 274$ 12,8631,738MOBILE33,382$ 193,962$
107,826$ -$ 17,448$ -$ 116$ 2,288$
66,2848,820MONROE1,549$ 11,298$ 6,296$ -$ 278$ -$
-$ 176$ 4,548471MONTGOMERY20,064$ 231,901$
107,831$ 110$ 17,743$ -$ 26,627$ 1,567$
78,0226,432MORGAN9,808$ 49,062$ 32,208$ -$ 2,858$
-$ -$ 583$ 13,4131,873PERRY729$ 6,412$ 3,683$ -$
194$ -$ -$ 50$ 2,485199PICKENS1,572$ 17,744$
8,589$ -$ 355$ -$ -$ 48$ 8,752732PIKE2,268$
19,927$ 10,470$ -$ 3,197$ -$ -$ 178$
6,082612RANDOLPH1,759$ 10,947$ 6,869$ -$ 388$ -$
-$ 82$ 3,607468RUSSELL5,405$ 67,888$ 41,600$ 5$
10,261$ -$ 700$ 742$ 14,5792,087SAINT CLAIR7,877$
39,804$ 19,590$ -$ 1,353$ -$ -$ 379$
18,4831,712SHELBY14,467$ 70,649$ 38,474$ -$ 5,202$
-$ -$ 1,661$ 25,3112,717SUMTER766$ 7,482$ 4,448$ -
$ 245$ -$ -$ 35$ 2,754302TALLADEGA7,062$ 36,982$
20,174$ -$ 1,495$ -$ -$ 132$
15,1811,789TALLAPOOSA3,667$ 30,973$ 17,371$ -$
629$ -$ -$ 609$ 12,3631,181TUSCALOOSA14,116$
134,799$ 48,233$ 1,550$ 5,931$ -$ 1,541$ 723$
76,8225,180WALKER6,178$ 42,400$ 25,829$ -$ 920$ -$
-$ 156$ 15,4951,706WASHINGTON1,602$ 7,160$ 4,294$
-$ 288$ -$ -$ 25$ 2,553322WILCOX660$ 5,798$
3,180$ -$ 253$ -$ -$ 72$ 2,293193WINSTON1,878$
12,015$ 7,028$ -$ 414$ -$ -$ 41$
4,532505ALABAMA (Totals)414,963$ 2,824,088$
1,580,861$ 1,922$ 189,414$ -$ 33,885$ 29,857$
988,150108,175CONG. DIST (01)60,557$ 320,282$
185,582$ -$ 25,362$ -$ 116$ 4,612$
104,60914,965CONG. DIST (02)70,677$ 565,021$ 336,634$
110$ 42,766$ -$ 26,627$ 5,928$ 152,95518,405CONG.
DIST (03)60,516$ 452,632$ 261,823$ 5$ 31,877$ -$
1,484$ 4,544$ 152,89916,658CONG. DIST (04)54,897$
328,313$ 193,749$ -$ 12,616$ -$ -$ 2,094$
119,85414,199CONG. DIST (05)68,734$ 343,316$ 222,353$
-$ 36,864$ -$ -$ 4,486$ 79,61313,025CONG. DIST
(06)52,659$ 257,675$ 128,842$ -$ 13,400$ -$ -$
5,316$ 110,11811,322CONG. DIST (07)46,923$ 556,850$
251,877$ 1,806$ 26,529$ -$ 5,658$ 2,878$
268,10219,601ALABAMA (Totals)414,963$ 2,824,088$
1,580,861$ 1,922$ 189,414$ -$ 33,885$ 29,857$
988,150108,175Notes:* Veteran population estimates, as of
September 30, 2013, are produced by the VA Office of the
Actuary (VetPop 2011).# Prior to FY 08, "Loan Guaranty"
expenditures were included in the Education & Vocational
Rehabilitation and Employment (E&VRE) programs.
Currently, all "Loan Guaranty" expenditures are attributed to
Travis County, TX, where all Loan Guaranty payments are
processed. VA will continue to improve data collection for
future GDX reports to better distribute loan expenditures at the
state, county and congressional district levels.** Unique
patients are patients who received treatment at a VA health care
facility. Data are provided by the Allocation Resource Center
(ARC).Expenditure data sources: USASpending.gov for
Compensation & Pension (C&P) and Education and Vocational
Rehabilitation and Employment (EVRE) Benefits; Veterans
Benefits Administration Insurance Center for the Insurance
costs; the VA Financial Management System (FMS) for
Construction, Medical Research, General Operating Expenses,
and certain C&P and Readjustment data; and the Allocation
Resource Center (ARC) for Medical Care costs.1. Expenditures
are rounded to the nearest thousand dollars. For example, $500
to $1,000 are rounded to $1; $0 to $499 are rounded to $0; and
"$ -" = 0 or no expenditures.2. The Compensation & Pension
expenditures include dollars for the following programs:
veterans' compensation for service-connected disabilities;
dependency and indemnity compensation for service-connected
deaths; veterans' pension for nonservice-connected disabilities;
and burial and other benefits to veterans and their survivors.3.
Medical Care expenditures include dollars for medical services,
medical administration, facility maintenance, educational
support, research support, and other overhead items. Medical
Care expenditures do not include dollars for construction or
other non-medical support.4. Medical Care expenditures are
based on where patients live instead of where care is
delivered.5. A star symbol (*) in the Unique Patients column
denotes that there were less than 10 Unique Patients.
&"Arial,Bold"&11FY13 GEOGRAPHIC DISTRIBUTION OF
VA EXPENDITURES (GDX)
&8&P of &N
ARFY13 Summary of Expenditures by StateExpenditures in
$000sCounty/ Congressional DistrictVeteran Population*Total
ExpenditureCompensation & PensionConstructionEducation &
Vocational Rehabilitation/ EmploymentLoan Guaranty#General
Operating ExpensesInsurance & IndemnitiesMedical
CareUnique Patients**ARKANSAS1,518$ 9,190$ 4,254$ -$
202$ -$ -$ 100$ 4,634455ASHLEY1,723$ 11,218$
5,979$ -$ 252$ -$ -$ 140$ 4,846491BAXTER5,820$
31,431$ 16,832$ -$ 904$ -$ -$ 204$
13,4921,987BENTON18,612$ 105,916$ 48,098$ -$ 4,489$
-$ -$ 1,081$ 52,2486,149BOONE3,607$ 24,959$ 13,202$
-$ 817$ -$ -$ 220$ 10,7211,371BRADLEY1,082$
5,635$ 3,003$ -$ 126$ -$ -$ 19$
2,488250CALHOUN511$ 2,420$ 960$ -$ 63$ -$ -$
22$ 1,374126CARROLL2,721$ 15,615$ 7,693$ -$ 302$
-$ -$ 157$ 7,4641,007CHICOT935$ 7,932$ 3,785$ -$
167$ -$ -$ 87$ 3,893320CLARK1,607$ 11,722$ 5,530$
-$ 660$ -$ -$ 69$ 5,463488CLAY1,488$ 10,675$
5,820$ -$ 133$ -$ -$ 61$ 4,661551CLEBURNE3,175$
24,359$ 11,780$ -$ 390$ -$ -$ 32$
12,1571,071CLEVELAND732$ 6,184$ 3,195$ -$ 184$ -$
-$ 29$ 2,777254COLUMBIA1,597$ 11,369$ 5,966$ -$
488$ -$ -$ 168$ 4,746471CONWAY1,796$ 14,690$
7,020$ -$ 514$ -$ -$ 29$ 7,128662CRAIGHEAD7,189$
36,446$ 21,555$ -$ 2,629$ -$ -$ 207$
12,0541,992CRAWFORD5,709$ 42,047$ 23,672$ -$
1,472$ -$ -$ 160$ 16,7432,350CRITTENDEN3,697$
25,728$ 9,829$ -$ 2,183$ -$ -$ 114$
13,6031,108CROSS1,111$ 9,060$ 4,406$ -$ 367$ -$ -$
101$ 4,186399DALLAS737$ 5,073$ 1,981$ -$ 203$ -$
-$ 15$ 2,874204DESHA1,016$ 9,325$ 4,257$ -$ 167$
-$ -$ 27$ 4,873366DREW1,568$ 10,118$ 4,967$ -$
328$ -$ -$ 109$ 4,714473FAULKNER9,819$ 71,204$
32,671$ -$ 4,912$ -$ -$ 414$
33,2072,773FRANKLIN1,709$ 14,198$ 7,341$ -$ 427$ -
$ -$ 380$ 6,051713FULTON1,199$ 9,700$ 5,434$ -$
257$ -$ -$ 22$ 3,986498GARLAND10,357$ 74,953$
37,883$ -$ 1,955$ -$ -$ 760$
34,3543,718GRANT1,472$ 12,656$ 5,947$ -$ 381$ -$ -
$ 25$ 6,303484GREENE3,065$ 26,182$ 14,863$ -$
840$ -$ -$ 168$ 10,3111,263HEMPSTEAD1,435$ 8,865$
4,855$ -$ 187$ -$ -$ 71$ 3,752432HOT SPRING3,161$
19,480$ 9,194$ -$ 476$ -$ -$ 81$
9,7291,000HOWARD961$ 6,657$ 3,204$ -$ 111$ -$ -$
23$ 3,318302INDEPENDENCE3,163$ 20,500$ 10,357$ -$
457$ -$ -$ 173$ 9,513882IZARD1,454$ 10,077$ 5,711$
-$ 144$ -$ -$ 51$ 4,171544JACKSON1,217$ 9,137$
4,340$ -$ 238$ -$ -$ 55$ 4,504394JEFFERSON6,361$
59,003$ 30,067$ -$ 1,941$ -$ -$ 256$
26,7392,374JOHNSON1,863$ 13,850$ 7,261$ -$ 424$ -$
-$ 157$ 6,007735LAFAYETTE656$ 3,786$ 1,598$ -$
48$ -$ -$ 55$ 2,085190LAWRENCE1,374$ 9,432$
5,712$ -$ 264$ -$ -$ 14$ 3,442443LEE741$ 3,603$
1,700$ -$ 53$ -$ -$ 11$ 1,838165LINCOLN1,239$
6,061$ 2,831$ -$ 186$ -$ -$ 51$ 2,993267LITTLE
RIVER1,041$ 6,702$ 3,714$ -$ 165$ -$ -$ 2$
2,820359LOGAN2,117$ 15,266$ 8,666$ -$ 444$ -$ -$
61$ 6,095821LONOKE7,666$ 72,523$ 40,763$ -$ 6,402$
-$ -$ 545$ 24,8132,396MADISON1,111$ 10,782$ 4,040$
-$ 109$ -$ -$ 105$ 6,527548MARION2,650$ 15,620$
8,328$ -$ 117$ -$ -$ 81$ 7,094865MILLER3,619$
19,954$ 10,584$ -$ 608$ -$ -$ 30$
8,732972MISSISSIPPI3,361$ 21,633$ 12,380$ -$ 477$ -
$ -$ 75$ 8,701937MONROE729$ 5,777$ 2,431$ -$
94$ -$ -$ 4$ 3,248254MONTGOMERY922$ 7,770$
4,168$ -$ 80$ -$ -$ 33$ 3,489428NEVADA845$
5,504$ 2,695$ -$ 240$ -$ -$ 36$
2,533244NEWTON756$ 5,243$ 2,706$ -$ 78$ -$ -$
113$ 2,346320OUACHITA2,450$ 16,103$ 8,572$ -$
494$ -$ -$ 143$ 6,894777PERRY961$ 9,897$ 4,295$ -
$ 139$ -$ -$ 11$ 5,452373PHILLIPS1,357$ 11,179$
5,064$ -$ 214$ -$ -$ 130$ 5,770501PIKE978$ 5,547$
2,519$ -$ 130$ -$ -$ 17$ 2,880318POINSETT1,876$
11,156$ 5,371$ -$ 468$ -$ -$ 164$
5,153598POLK2,063$ 19,061$ 10,308$ -$ 375$ -$ -$
60$ 8,3181,078POPE5,182$ 34,202$ 16,157$ -$ 2,010$
-$ -$ 201$ 15,8331,546PRAIRIE854$ 6,469$ 2,586$ -$
111$ -$ -$ 11$ 3,760272PULASKI32,336$ 397,687$
154,821$ 366$ 18,944$ -$ 27,681$ 2,846$
193,03012,629RANDOLPH1,527$ 14,035$ 7,841$ -$ 353$
-$ -$ 46$ 5,795635SAINT FRANCIS1,807$ 12,431$
6,278$ -$ 395$ -$ -$ 21$ 5,737540SALINE10,551$
66,238$ 31,341$ -$ 3,022$ -$ -$ 642$
31,2333,086SCOTT1,006$ 7,185$ 4,045$ -$ 246$ -$ -$
62$ 2,832395SEARCY840$ 7,741$ 3,995$ -$ 118$ -$
-$ 19$ 3,609333SEBASTIAN10,498$ 70,236$ 38,818$
373$ 3,305$ -$ 865$ 561$ 26,3154,199SEVIER1,111$
6,340$ 3,275$ -$ 109$ -$ -$ 16$
2,941303SHARP2,127$ 16,516$ 9,726$ -$ 279$ -$ -$
47$ 6,463789STONE1,171$ 10,848$ 6,111$ -$ 210$ -$
-$ 152$ 4,375493UNION3,504$ 19,339$ 9,415$ -$ 566$
-$ -$ 106$ 9,2531,026VAN BUREN1,946$ 14,308$
7,591$ -$ 224$ -$ -$ 70$
6,422703WASHINGTON13,170$ 122,002$ 44,417$ 7,199$
5,571$ -$ 2,786$ 638$ 61,3905,503WHITE6,691$
55,217$ 28,458$ -$ 2,383$ -$ -$ 411$
23,9652,091WOODRUFF590$ 3,887$ 2,147$ -$ 50$ -$
-$ 61$ 1,630151YELL1,485$ 11,760$ 6,287$ -$ 190$ -
$ -$ 48$ 5,235558ARKANSAS (Totals)250,095$
1,946,615$ 924,671$ 7,938$ 79,063$ -$ 31,331$
13,484$ 890,12786,763CONG. DIST (01)63,364$ 454,371$
238,843$ -$ 18,793$ -$ -$ 2,753$ 193,98220,647CONG.
DIST (02)64,100$ 629,363$ 266,261$ 366$ 30,147$ -$
27,681$ 4,424$ 300,48322,316CONG. DIST (03)59,097$
408,408$ 187,749$ 7,572$ 17,176$ -$ 3,650$ 3,135$
189,12521,871CONG. DIST (04)63,534$ 454,472$ 231,817$
12,947$ -$ -$ 3,172$ 206,53621,929ARKANSAS
(Totals)250,095$ 1,946,615$ 924,671$ 7,938$ 79,063$ -$
31,331$ 13,484$ 890,12786,763Notes:* Veteran population
estimates, as of September 30, 2013, are produced by the VA
Office of the Actuary (VetPop 2011).# Prior to FY 08, "Loan
Guaranty" expenditures were included in the Education &
Vocational Rehabilitation and Employment (E&VRE) programs.
Currently, all "Loan Guaranty" expenditures are attributed to
Travis County, TX, where all Loan Guaranty payments are
processed. VA will continue to improve data collection for
future GDX reports to better distribute loan expenditures at the
state, county and congressional district levels.** Unique
patients are patients who received treatment at a VA health care
facility. Data are provided by the Allocation Resource Center
(ARC).Expenditure data sources: USASpending.gov for
Compensation & Pension (C&P) and Education and Vocational
Rehabilitation and Employment (EVRE) Benefits; Veterans
Benefits Administration Insurance Center for the Insurance
costs; the VA Financial Management System (FMS) for
Construction, Medical Research, General Operating Expenses,
and certain C&P and Readjustment data; and the Allocation
Resource Center (ARC) for Medical Care costs.1. Expenditures
are rounded to the nearest thousand dollars. For example, $500
to $1,000 are rounded to $1; $0 to $499 are rounded to $0; and
"$ -" = 0 or no expenditures.2. The Compensation & Pension
expenditures include dollars for the following programs:
veterans' compensation for service-connected disabilities;
dependency and indemnity compensation for service-connected
deaths; veterans' pension for nonservice-connected disabilities;
and burial and other benefits to veterans and their survivors.3.
Medical Care expenditures include dollars for medical services,
medical administration, facility maintenance, educational
support, research support, and other overhead items. Medical
Care expenditures do not include dollars for construction or
other non-medical support.4. Medical Care expenditures are
based on where patients live instead of where care is
delivered.5. A star symbol (*) in the Unique Patients column
denotes that there were less than 10 Unique Patients.
&"Arial,Bold"&11FY13 GEOGRAPHIC DISTRIBUTION OF
VA EXPENDITURES (GDX)
&8&P of &N
AZFY13 Summary of Expenditures by StateExpenditures in
$000sCounty/ Congressional DistrictVeteran Population*Total
ExpenditureCompensation & PensionConstructionEducation &
Vocational Rehabilitation/ EmploymentLoan Guaranty#General
Operating ExpensesInsurance & IndemnitiesMedical
CareUnique Patients**APACHE4,487$ 24,595$ 15,017$ -$
1,215$ -$ -$ 87$ 8,2761,205COCHISE22,690$ 160,944$
90,547$ -$ 13,726$ -$ -$ 1,865$
54,8076,697COCONINO9,246$ 40,471$ 19,343$ -$ 4,958$
-$ -$ 733$ 15,4371,877GILA6,072$ 31,443$ 16,876$ -$
597$ -$ -$ 313$ 13,6561,711GRAHAM2,922$ 15,139$
7,038$ -$ 416$ -$ -$ 242$ 7,444722GREENLEE1,175$
4,094$ 1,867$ -$ 80$ -$ -$ 3$ 2,144222LA PAZ2,764$
12,674$ 5,655$ -$ 139$ -$ -$ 69$
6,811745MARICOPA271,326$ 1,592,681$ 685,571$
11,878$ 220,048$ -$ 106,391$ 20,108$
548,68460,097MOHAVE25,433$ 135,355$ 66,775$ -$
2,988$ -$ -$ 833$ 64,7607,837NAVAJO7,437$ 40,510$
24,094$ -$ 1,552$ -$ -$ 217$ 14,6472,180PIMA89,642$
658,189$ 269,328$ 5,375$ 50,432$ -$ 1,733$ 8,108$
323,21329,087PINAL37,192$ 145,442$ 64,944$ -$
11,006$ -$ -$ 1,202$ 68,2918,442SANTA CRUZ2,078$
12,730$ 6,583$ -$ 822$ -$ -$ 86$
5,239615YAVAPAI26,214$ 269,941$ 91,539$ 3,948$
27,353$ -$ 762$ 1,731$ 144,60912,150YUMA18,721$
76,696$ 44,169$ -$ 8,489$ -$ -$ 549$
23,4893,775ARIZONA (Totals)527,400$ 3,220,905$
1,409,346$ 21,201$ 343,820$ -$ 108,885$ 36,145$
1,301,507137,362CONG. DIST (01)59,118$ 282,428$
133,787$ 3,948$ 19,517$ -$ 762$ 3,512$
120,90314,809CONG. DIST (02)84,042$ 567,635$ 260,478$
-$ 45,545$ -$ -$ 8,256$ 253,35625,834CONG. DIST
(03)41,213$ 322,650$ 146,944$ -$ 32,196$ -$ -$
1,723$ 141,78713,060CONG. DIST (04)88,475$ 658,971$
230,460$ 11,878$ 41,886$ -$ 106,391$ 3,682$
264,67427,820CONG. DIST (05)59,262$ 245,357$ 111,823$
-$ 35,892$ -$ -$ 3,253$ 94,38911,584CONG. DIST
(06)52,731$ 241,815$ 111,892$ -$ 35,914$ -$ -$
5,160$ 88,84910,210CONG. DIST (07)26,753$ 301,283$
138,727$ 5,375$ 44,527$ -$ 1,733$ 1,621$
109,2999,280CONG. DIST (08)71,813$ 320,569$ 144,011$
-$ 46,223$ -$ -$ 5,891$ 124,44414,554CONG. DIST
(09)43,992$ 280,196$ 131,225$ -$ 42,119$ -$ -$
3,047$ 103,80410,211ARIZONA (Totals)527,400$
3,220,905$ 1,409,346$ 21,201$ 343,820$ -$ 108,885$
36,145$ 1,301,507137,362Notes:* Veteran population
estimates, as of September 30, 2013, are produced by the VA
Office of the Actuary (VetPop 2011).# Prior to FY 08, "Loan
Guaranty" expenditures were included in the Education &
Vocational Rehabilitation and Employment (E&VRE) programs.
Currently, all "Loan Guaranty" expenditures are attributed to
Travis County, TX, where all Loan Guaranty payments are
processed. VA will continue to improve data collection for
future GDX reports to better distribute loan expenditures at the
state, county and congressional district levels.** Unique
patients are patients who received treatment at a VA health care
facility. Data are provided by the Allocation Resource Center
(ARC).Expenditure data sources: USASpending.gov for
Compensation & Pension (C&P) and Education and Vocational
Rehabilitation and Employment (EVRE) Benefits; Veterans
Benefits Administration Insurance Center for the Insurance
costs; the VA Financial Management System (FMS) for
Construction, Medical Research, General Operating Expenses,
and certain C&P and Readjustment data; and the Allocation
Resource Center (ARC) for Medical Care costs.1. Expenditures
are rounded to the nearest thousand dollars. For example, $500
to $1,000 are rounded to $1; $0 to $499 are rounded to $0; and
"$ -" = 0 or no expenditures.2. The Compensation & Pension
expenditures include dollars for the following programs:
veterans' compensation for service-connected disabilities;
dependency and indemnity compensation for service-connected
deaths; veterans' pension for nonservice-connected disabilities;
and burial and other benefits to veterans and their survivors.3.
Medical Care expenditures include dollars for medical services,
medical administration, facility maintenance, educational
support, research support, and other overhead items. Medical
Care expenditures do not include dollars for construction or
other non-medical support.4. Medical Care expenditures are
based on where patients live instead of where care is
delivered.5. A star symbol (*) in the Unique Patients column
denotes that there were less than 10 Unique Patients.
&"Arial,Bold"&11FY13 GEOGRAPHIC DISTRIBUTION OF
VA EXPENDITURES (GDX)
&8&P of &N
CAFY13 Summary of Expenditures by StateExpenditures in
$000sCounty/ Congressional DistrictVeteran Population*Total
ExpenditureCompensation & PensionConstructionEducation &
Vocational Rehabilitation/ EmploymentLoan Guaranty#General
Operating ExpensesInsurance & IndemnitiesMedical
CareUnique Patients**ALAMEDA57,562$ 431,876$
148,728$ 412$ 39,667$ -$ 36,087$ 6,375$
200,60612,989ALPINE148$ 281$ 154$ -$ 23$ -$ -$ -$
10526AMADOR4,246$ 17,622$ 9,130$ -$ 858$ -$ -$
216$ 7,419841BUTTE17,399$ 102,264$ 54,609$ -$
6,372$ -$ -$ 1,410$ 39,8735,127CALAVERAS5,498$
31,370$ 14,115$ -$ 765$ -$ -$ 368$
16,1211,535COLUSA1,159$ 6,358$ 3,271$ -$ 307$ -$ -
$ 89$ 2,691258CONTRA COSTA53,232$ 328,845$
131,229$ 19,678$ 29,244$ -$ 6,163$ 5,861$
136,66911,346DEL NORTE2,507$ 20,092$ 12,606$ -$
307$ -$ -$ 79$ 7,100824EL DORADO14,939$ 75,919$
40,673$ -$ 3,952$ -$ -$ 1,407$
29,8873,236FRESNO43,317$ 344,957$ 137,668$ 2,017$
28,977$ -$ 2,589$ 2,941$ 170,76613,578GLENN1,801$
8,216$ 4,743$ -$ 450$ -$ -$ 43$
2,980477HUMBOLDT10,138$ 87,255$ 40,830$ -$ 2,727$
-$ -$ 662$ 43,0364,329IMPERIAL7,560$ 47,842$
20,525$ -$ 10,198$ -$ -$ 431$ 16,6871,845INYO1,505$
6,631$ 3,793$ -$ 306$ -$ -$ 195$
2,337307KERN46,473$ 239,584$ 132,746$ -$ 29,240$ -$
-$ 2,246$ 75,3518,529KINGS12,281$ 63,513$ 31,493$ -
$ 12,951$ -$ -$ 559$ 18,5092,096LAKE6,499$ 56,895$
24,740$ -$ 893$ -$ -$ 197$ 31,0652,435LASSEN3,524$
15,254$ 8,024$ -$ 558$ -$ -$ 57$ 6,615839LOS
ANGELES306,587$ 2,258,286$ 785,919$ 22,465$
276,771$ -$ 44,287$ 30,188$
1,098,65772,428MADERA8,187$ 55,851$ 25,386$ -$
3,406$ -$ -$ 515$ 26,5442,527MARIN12,257$ 61,443$
23,773$ -$ 3,489$ -$ -$ 2,710$
31,4722,124MARIPOSA2,091$ 12,400$ 5,970$ -$ 224$ -
$ -$ 146$ 6,061612MENDOCINO6,624$ 57,982$
26,980$ -$ 1,015$ -$ -$ 645$
29,3422,309MERCED11,174$ 74,930$ 36,479$ 208$
4,709$ -$ 3,610$ 836$ 29,0883,054MODOC936$ 5,884$
3,367$ -$ 144$ -$ -$ 29$ 2,344335MONO1,169$
2,675$ 1,119$ -$ 62$ -$ -$ 69$
1,425149MONTEREY19,255$ 169,451$ 87,483$ -$
12,177$ -$ -$ 2,217$ 67,5746,432NAPA9,602$ 51,613$
26,630$ -$ 3,164$ -$ -$ 1,056$
20,7632,014NEVADA8,756$ 50,853$ 29,428$ -$ 1,858$
-$ -$ 1,370$ 18,1972,476ORANGE121,992$ 610,243$
284,205$ -$ 93,466$ -$ -$ 14,129$
218,44222,117PLACER29,314$ 136,234$ 77,884$ -$
13,254$ -$ -$ 2,722$ 42,3745,644PLUMAS2,000$
12,754$ 6,057$ -$ 266$ -$ -$ 137$
6,294704RIVERSIDE131,854$ 913,653$ 434,732$ 681$
143,147$ -$ 15,335$ 8,249$
311,51034,944SACRAMENTO89,529$ 571,186$ 284,597$ -
$ 62,077$ -$ -$ 6,296$ 218,21521,297SAN
BENITO2,607$ 20,669$ 9,949$ -$ 1,207$ -$ -$ 161$
9,352797SAN BERNARDINO111,221$ 731,278$ 333,887$
4,840$ 85,501$ -$ 2,342$ 5,320$ 299,38827,254SAN
DIEGO224,881$ 2,028,580$ 843,900$ 5,965$ 487,024$ -
$ 65,337$ 21,727$ 604,62661,278SAN
FRANCISCO25,267$ 311,906$ 66,088$ 5,915$ 20,438$ -
$ 3,944$ 3,468$ 212,0537,335SAN JOAQUIN34,954$
223,699$ 107,888$ -$ 18,639$ -$ -$ 2,132$
95,0409,013SAN LUIS OBISPO20,490$ 88,191$ 50,558$ -$
6,809$ -$ -$ 2,001$ 28,8234,649SAN MATEO27,318$
239,156$ 58,492$ 15$ 13,417$ -$ 6,838$ 3,472$
156,9226,772SANTA BARBARA22,818$ 119,647$ 65,163$
-$ 10,781$ -$ -$ 3,050$ 40,6535,259SANTA
CLARA58,590$ 559,042$ 145,634$ 82,813$ 34,282$ -$
5,861$ 8,047$ 282,40514,672SANTA CRUZ11,554$
85,988$ 38,900$ -$ 4,335$ -$ -$ 1,680$
41,0723,425SHASTA16,184$ 138,594$ 78,440$ -$ 5,415$
-$ -$ 899$ 53,8396,737SIERRA397$ 2,438$ 716$ -$
41$ -$ -$ 1$ 1,680105SISKIYOU4,184$ 26,230$
15,300$ -$ 715$ -$ -$ 137$
10,0781,561SOLANO33,502$ 289,071$ 164,346$ -$
33,385$ -$ -$ 3,228$ 88,1128,646SONOMA28,528$
174,217$ 78,343$ -$ 9,377$ -$ -$ 3,432$
83,0666,946STANISLAUS25,601$ 172,055$ 84,512$ -$
12,472$ -$ -$ 1,434$ 73,6376,874SUTTER6,816$
44,858$ 26,478$ -$ 3,761$ -$ -$ 269$
14,3501,512TEHAMA5,588$ 31,004$ 14,574$ -$ 860$ -$
-$ 274$ 15,2961,825TRINITY1,504$ 10,040$ 5,049$ -$
94$ -$ -$ 3$ 4,893543TULARE18,076$ 114,169$
62,369$ -$ 10,550$ -$ -$ 900$
40,3505,429TUOLUMNE6,174$ 40,504$ 19,331$ -$
1,082$ -$ -$ 261$ 19,8292,138VENTURA42,229$
221,942$ 112,391$ -$ 38,790$ -$ -$ 5,340$
65,4208,390YOLO9,466$ 54,872$ 30,089$ -$ 7,149$ -$
-$ 898$ 16,7361,916YUBA6,390$ 49,175$ 26,375$ -$
6,608$ -$ -$ 368$ 15,8231,573CALIFORNIA
(Totals)1,795,455$ 12,707,536$ 5,397,860$ 145,008$
1,599,760$ -$ 192,392$ 162,956$
5,209,559444,432CONG. DIST (01)62,509$ 405,286$
222,037$ -$ 18,390$ -$ -$ 4,526$ 160,33320,546CONG.
DIST (02)44,944$ 302,149$ 138,571$ -$ 11,142$ -$ -$
5,465$ 146,97112,796CONG. DIST (03)52,654$ 376,557$
206,320$ -$ 39,029$ -$ -$ 4,339$ 126,86812,971CONG.
DIST (04)63,680$ 329,413$ 171,348$ -$ 20,348$ -$ -$
5,181$ 132,53614,644CONG. DIST (05)44,296$ 325,875$
162,519$ -$ 25,293$ -$ -$ 4,282$ 133,78211,369CONG.
DIST (06)39,096$ 274,734$ 138,434$ -$ 30,435$ -$ -$
2,406$ 103,4599,957CONG. DIST (07)48,656$ 297,709$
144,457$ -$ 31,509$ -$ -$ 3,793$ 117,95010,948CONG.
DIST (08)56,219$ 364,233$ 160,841$ -$ 40,305$ -$ -$
2,927$ 160,16014,022CONG. DIST (09)35,627$ 230,033$
109,029$ -$ 20,315$ -$ -$ 2,455$ 98,2349,372CONG.
DIST (10)35,813$ 231,674$ 113,302$ -$ 17,446$ -$ -$
1,907$ 99,0199,301CONG. DIST (11)36,326$ 220,435$
85,978$ 19,678$ 19,160$ -$ 6,163$ 4,503$
84,9547,332CONG. DIST (12)22,017$ 263,980$ 59,494$
5,915$ 18,399$ -$ 3,944$ 2,986$ 173,2416,534CONG.
DIST (13)26,490$ 215,166$ 67,953$ 412$ 18,124$ -$
36,087$ 3,862$ 88,7276,628CONG. DIST (14)25,233$
208,866$ 44,154$ -$ 10,655$ -$ -$ 3,186$
150,8716,383CONG. DIST (15)27,973$ 180,703$ 69,908$ -
$ 18,487$ -$ -$ 2,162$ 90,1465,519CONG. DIST
(16)28,197$ 252,903$ 108,550$ 2,225$ 18,850$ -$
6,198$ 1,797$ 115,2829,503CONG. DIST (17)20,505$
143,305$ 48,808$ -$ 11,943$ -$ -$ 2,801$
79,7534,754CONG. DIST (18)30,144$ 257,486$ 77,791$
15$ 17,080$ -$ 6,838$ 5,290$ 150,4726,592CONG. DIST
(19)21,637$ 276,050$ 61,773$ 82,813$ 14,540$ -$
5,861$ 1,693$ 109,3706,307CONG. DIST (20)30,717$
262,241$ 129,005$ -$ 17,102$ -$ -$ 3,681$
112,45310,059CONG. DIST (21)26,081$ 153,546$ 75,918$
-$ 22,521$ -$ -$ 1,346$ 53,7625,478CONG. DIST
(22)36,523$ 239,808$ 109,793$ -$ 21,079$ -$ -$
2,300$ 106,63710,642CONG. DIST (23)49,431$ 228,777$
122,859$ -$ 27,290$ -$ -$ 2,809$ 75,8189,293CONG.
DIST (24)43,859$ 212,076$ 117,877$ -$ 18,333$ -$ -$
5,141$ 70,72510,074CONG. DIST (25)32,247$ 140,002$
55,909$ -$ 19,566$ -$ -$ 2,106$ 62,4216,528CONG.
DIST (26)36,223$ 184,720$ 93,033$ -$ 32,113$ -$ -$
5,046$ 54,5287,258CONG. DIST (27)25,022$ 84,045$
30,140$ -$ 10,439$ -$ -$ 3,223$ 40,2433,653CONG.
DIST (28)19,751$ 115,567$ 41,763$ -$ 14,707$ -$ -$
2,462$ 56,6353,875CONG. DIST (29)13,951$ 163,363$
60,053$ -$ 21,148$ -$ -$ 1,044$ 81,1184,350CONG.
DIST (30)26,753$ 176,289$ 53,618$ -$ 18,881$ -$ -$
4,039$ 99,7515,505CONG. DIST (31)33,232$ 270,630$
122,802$ 4,840$ 31,447$ -$ 2,342$ 1,646$
107,5548,711CONG. DIST (32)21,251$ 91,626$ 33,330$ -$
11,738$ -$ -$ 1,237$ 45,3214,263CONG. DIST
(33)30,853$ 327,263$ 94,020$ 22,465$ 33,110$ -$
44,287$ 6,182$ 127,1995,781CONG. DIST (34)12,159$
123,506$ 45,312$ -$ 15,957$ -$ -$ 994$
61,2423,918CONG. DIST (35)22,029$ 123,839$ 55,799$ -$
14,954$ -$ -$ 767$ 52,3185,084CONG. DIST (36)50,813$
338,099$ 155,472$ 681$ 51,160$ -$ 15,335$ 3,892$
111,55914,248CONG. DIST (37)21,203$ 256,753$ 94,321$
-$ 33,216$ -$ -$ 1,825$ 127,3906,938CONG. DIST
(38)25,925$ 130,262$ 47,744$ -$ 16,784$ -$ -$ 1,654$
64,0805,793CONG. DIST (39)26,453$ 104,000$ 46,785$ -$
15,213$ -$ -$ 2,356$ 39,6464,345CONG. DIST (40)9,865$
77,370$ 28,454$ -$ 10,020$ -$ -$ 390$
38,5062,705CONG. DIST (41)31,740$ 298,857$ 142,177$ -
$ 46,813$ -$ -$ 1,742$ 108,1258,101CONG. DIST
(42)43,671$ 254,278$ 123,168$ -$ 40,556$ -$ -$
2,156$ 88,39711,081CONG. DIST (43)25,238$ 203,521$
74,600$ -$ 26,271$ -$ -$ 1,706$ 100,9436,461CONG.
DIST (44)16,879$ 137,000$ 50,439$ -$ 17,763$ -$ -$
552$ 68,2464,736CONG. DIST (45)30,863$ 122,766$
53,183$ -$ 17,490$ -$ -$ 3,834$ 48,2595,141CONG.
DIST (46)16,925$ 124,391$ 58,681$ -$ 19,298$ -$ -$
1,493$ 44,9193,869CONG. DIST (47)31,795$ 297,459$
117,702$ -$ 40,525$ -$ -$ 3,445$ 135,7868,902CONG.
DIST (48)34,336$ 171,895$ 79,787$ -$ 26,240$ -$ -$
4,541$ 61,3276,084CONG. DIST (49)46,947$ 326,305$
142,204$ -$ 78,562$ -$ -$ 6,087$ 99,45211,697CONG.
DIST (50)52,961$ 424,928$ 187,154$ -$ 104,464$ -$ -$
3,640$ 129,66913,322CONG. DIST (51)33,970$ 364,291$
159,196$ -$ 90,227$ -$ -$ 2,656$ 112,21311,030CONG.
DIST (52)53,543$ 406,321$ 176,296$ -$ 101,742$ -$ -$
6,395$ 121,88812,918CONG. DIST (53)60,231$ 615,184$
227,998$ 5,965$ 131,580$ -$ 65,337$ 5,004$
179,30017,111CALIFORNIA (Totals)1,795,455$ 12,707,536$
5,397,860$ 145,008$ 1,599,760$ -$ 192,392$ 162,956$
5,209,559444,432Notes:* Veteran population estimates, as of
September 30, 2013, are produced by the VA Office of the
Actuary (VetPop 2011).# Prior to FY 08, "Loan Guaranty"
expenditures were included in the Education & Vocational
Rehabilitation and Employment (E&VRE) programs.
Currently, all "Loan Guaranty" expenditures are attributed to
Travis County, TX, where all Loan Guaranty payments are
processed. VA will continue to improve data collection for
future GDX reports to better distribute loan expenditures at the
state, county and congressional district levels.** Unique
patients are patients who received treatment at a VA health care
facility. Data are provided by the Allocation Resource Center
(ARC).Expenditure data sources: USASpending.gov for
Compensation & Pension (C&P) and Education and Vocational
Rehabilitation and Employment (EVRE) Benefits; Veterans
Benefits Administration Insurance Center for the Insurance
costs; the VA Financial Management System (FMS) for
Construction, Medical Research, General Operating Expenses,
and certain C&P and Readjustment data; and the Allocation
Resource Center (ARC) for Medical Care costs.1. Expenditures
are rounded to the nearest thousand dollars. For example, $500
to $1,000 are rounded to $1; $0 to $499 are rounded to $0; and
"$ -" = 0 or no expenditures.2. The Compensation & Pension
expenditures include dollars for the following programs:
veterans' compensation for service-connected disabilities;
dependency and indemnity compensation for service-connected
deaths; veterans' pension for nonservice-connected disabilities;
and burial and other benefits to veterans and their survivors.3.
Medical Care expenditures include dollars for medical services,
medical administration, facility maintenance, educational
support, research support, and other overhead items. Medical
Care expenditures do not include dollars for construction or
other non-medical support.4. Medical Care expenditures are
based on where patients live instead of where care is
delivered.5. A star symbol (*) in the Unique Patients column
denotes that there were less than 10 Unique Patients.
&"Arial,Bold"&11FY13 GEOGRAPHIC DISTRIBUTION OF
VA EXPENDITURES (GDX)
&8&P of &N
COFY13 Summary of Expenditures by StateExpenditures in
$000sCounty/ Congressional DistrictVeteran Population*Total
ExpenditureCompensation & PensionConstructionEducation &
Vocational Rehabilitation/ EmploymentLoan Guaranty#General
Operating ExpensesInsurance & IndemnitiesMedical
CareUnique Patients**ADAMS28,607$ 164,982$ 73,056$ -
$ 22,153$ -$ -$ 1,136$ 68,6385,954ALAMOSA1,004$
7,836$ 4,107$ -$ 334$ -$ -$ 58$
3,338406ARAPAHOE42,056$ 234,403$ 110,054$ -$
33,656$ -$ -$ 3,542$ 87,1528,700ARCHULETA959$
7,496$ 4,153$ -$ 176$ -$ -$ 172$ 2,994427BACA359$
1,643$ 774$ -$ 30$ -$ -$ 93$ 74691BENT549$
6,242$ 3,031$ 157$ 87$ -$ -$ 2$
2,966229BOULDER16,105$ 57,568$ 27,617$ -$ 11,227$
-$ -$ 2,044$ 16,6792,109BROOMFIELD3,196$ 16,368$
9,131$ -$ 2,789$ -$ -$ 362$ 4,086558CHAFFEE1,886$
6,957$ 4,115$ -$ 292$ -$ -$ 115$
2,435473CHEYENNE150$ 522$ 223$ -$ -$ -$ -$ 1$
29738CLEAR CREEK847$ 2,440$ 1,310$ -$ 43$ -$ -$
48$ 1,040157CONEJOS567$ 4,392$ 3,012$ -$ 105$ -$
-$ 14$ 1,260223COSTILLA317$ 4,471$ 1,984$ -$ 67$
-$ -$ 21$ 2,398194CROWLEY545$ 2,801$ 1,700$ -$
44$ -$ -$ 1$ 1,056128CUSTER491$ 3,251$ 2,232$ -$
27$ -$ -$ 2$ 989165DELTA3,022$ 22,799$ 9,085$ -$
362$ -$ -$ 102$ 13,2501,239DENVER30,437$ 392,751$
86,526$ 110,541$ 26,210$ -$ 27,504$ 3,737$
138,2338,953DOLORES184$ 799$ 553$ -$ -$ -$ -$
26$ 21955DOUGLAS20,241$ 73,866$ 41,731$ -$
12,743$ -$ -$ 1,386$ 18,0062,556EAGLE2,141$ 4,172$
2,153$ -$ 252$ -$ -$ 166$ 1,601273ELBERT2,251$
7,752$ 3,583$ -$ 771$ -$ -$ 92$ 3,306357EL
PASO77,091$ 656,941$ 396,110$ -$ 140,152$ -$ -$
7,936$ 112,74317,757FREMONT6,824$ 33,775$ 19,320$ -
$ 1,512$ -$ -$ 321$ 12,6221,474GARFIELD3,541$
15,785$ 6,253$ -$ 612$ -$ -$ 186$
8,734964GILPIN414$ 2,373$ 1,519$ -$ 64$ -$ -$ 52$
73996GRAND1,029$ 4,403$ 2,163$ -$ 31$ -$ -$ 29$
2,181229GUNNISON957$ 3,883$ 1,506$ -$ 426$ -$ -$
83$ 1,868210HINSDALE72$ 259$ 206$ -$ 3$ -$ -$
3$ 4713HUERFANO956$ 7,408$ 4,368$ -$ 136$ -$ -$
22$ 2,883338JACKSON159$ 588$ 354$ -$ -$ -$ -$
4$ 23035JEFFERSON40,361$ 225,190$ 92,951$ 147$
26,127$ -$ 34,675$ 3,783$ 67,5087,033KIOWA119$
335$ 199$ -$ 34$ -$ -$ -$ 10223KIT CARSON647$
2,259$ 887$ -$ 59$ -$ -$ 34$ 1,279178LAKE512$
1,952$ 998$ -$ 180$ -$ -$ 60$ 71487LA
PLATA4,157$ 16,719$ 9,373$ -$ 975$ -$ -$ 611$
5,7601,085LARIMER21,358$ 116,926$ 58,554$ -$
15,585$ -$ -$ 2,158$ 40,6295,233LAS ANIMAS1,391$
10,746$ 6,233$ -$ 401$ -$ -$ 39$
4,073536LINCOLN578$ 1,717$ 891$ -$ 44$ -$ -$ 25$
75686LOGAN1,701$ 6,249$ 2,562$ -$ 331$ -$ -$
151$ 3,205371MESA13,815$ 128,788$ 40,411$ 1,769$
5,329$ -$ 676$ 619$ 79,9856,076MINERAL94$ 306$
202$ -$ 16$ -$ -$ -$ 8830MOFFAT1,179$ 5,179$
1,888$ -$ 236$ -$ -$ 26$
3,029320MONTEZUMA2,358$ 9,857$ 5,480$ -$ 315$ -$
-$ 81$ 3,981636MONTROSE3,554$ 22,821$ 9,146$ -$
529$ -$ -$ 392$ 12,7541,376MORGAN1,719$ 6,834$
3,411$ -$ 289$ -$ -$ 86$ 3,048424OTERO1,686$
17,041$ 10,763$ -$ 422$ -$ -$ 42$
5,815580OURAY416$ 1,254$ 370$ -$ 78$ -$ -$ 36$
769112PARK1,772$ 9,685$ 5,512$ -$ 321$ -$ -$ 19$
3,834407PHILLIPS311$ 936$ 422$ -$ 1$ -$ -$ 32$
48173PITKIN903$ 1,707$ 776$ -$ 1$ -$ -$ 153$
777103PROWERS779$ 4,537$ 2,519$ -$ 178$ -$ -$
7$ 1,834263PUEBLO15,923$ 127,204$ 69,175$ -$
7,004$ -$ -$ 727$ 50,2975,133RIO BLANCO568$ 2,814$
1,201$ -$ 121$ -$ -$ 4$ 1,489164RIO GRANDE1,063$
6,598$ 4,404$ -$ 106$ -$ -$ 33$
2,056380ROUTT1,292$ 4,041$ 2,058$ -$ 278$ -$ -$
104$ 1,602248SAGUACHE463$ 1,479$ 810$ -$ 8$ -$
-$ 32$ 629160SAN JUAN85$ 194$ 58$ -$ 16$ -$ -$
1$ 11919SAN MIGUEL391$ 1,172$ 471$ -$ 55$ -$ -$
16$ 62993SEDGWICK273$ 1,456$ 651$ -$ 38$ -$ -$
11$ 75693SUMMIT1,252$ 3,021$ 1,596$ -$ 208$ -$ -
$ 157$ 1,061159TELLER2,990$ 18,228$ 12,520$ -$
1,376$ -$ -$ 150$ 4,182663WASHINGTON408$ 2,011$
665$ -$ 56$ -$ -$ 2$ 1,28894WELD19,036$ 84,670$
42,036$ -$ 9,223$ -$ -$ 1,122$ 32,2894,064YUMA713$
1,828$ 1,020$ -$ 107$ -$ -$ 19$ 682119COLORADO
(Totals)390,824$ 2,594,677$ 1,212,143$ 112,614$
324,347$ -$ 62,854$ 32,483$ 850,23590,822CONG. DIST
(01)38,739$ 431,643$ 105,011$ 110,541$ 31,671$ -$
27,504$ 4,649$ 152,26810,538CONG. DIST (02)45,418$
201,288$ 101,327$ -$ 27,253$ -$ -$ 4,997$
67,7118,692CONG. DIST (03)60,484$ 413,936$ 186,101$
1,769$ 17,666$ -$ 676$ 3,746$ 203,97820,488CONG.
DIST (04)54,574$ 253,219$ 131,598$ 157$ 28,797$ -$ -
$ 3,257$ 89,41010,907CONG. DIST (05)89,827$ 720,265$
434,546$ -$ 143,475$ -$ -$ 8,527$
133,71720,589CONG. DIST (06)50,353$ 270,698$ 127,254$
38,859$ -$ 3,999$ 100,5869,924CONG. DIST (07)51,428$
303,629$ 126,306$ 147$ 36,627$ -$ 34,675$ 3,309$
102,5659,684COLORADO (Totals)390,824$ 2,594,677$
1,212,143$ 112,614$ 324,347$ -$ 62,854$ 32,483$
850,23590,822Notes:* Veteran population estimates, as of
September 30, 2013, are produced by the VA Office of the
Actuary (VetPop 2011).# Prior to FY 08, "Loan Guaranty"
expenditures were included in the Education & Vocational
Rehabilitation and Employment (E&VRE) programs.
Currently, all "Loan Guaranty" expenditures are attributed to
Travis County, TX, where all Loan Guaranty payments are
processed. VA will continue to improve data collection for
future GDX reports to better distribute loan expenditures at the
state, county and congressional district levels.** Unique
patients are patients who received treatment at a VA health care
facility. Data are provided by the Allocation Resource Center
(ARC).Expenditure data sources: USASpending.gov for
Compensation & Pension (C&P) and Education and Vocational
Rehabilitation and Employment (EVRE) Benefits; Veterans
Benefits Administration Insurance Center for the Insurance
costs; the VA Financial Management System (FMS) for
Construction, Medical Research, General Operating Expenses,
and certain C&P and Readjustment data; and the Allocation
Resource Center (ARC) for Medical Care costs.1. Expenditures
are rounded to the nearest thousand dollars. For example, $500
to $1,000 are rounded to $1; $0 to $499 are rounded to $0; and
"$ -" = 0 or no expenditures.2. The Compensation & Pension
expenditures include dollars for the following programs:
veterans' compensation for service-connected disabilities;
dependency and indemnity compensation for service-connected
deaths; veterans' pension for nonservice-connected disabilities;
and burial and other benefits to veterans and their survivors.3.
Medical Care expenditures include dollars for medical services,
medical administration, facility maintenance, educational
support, research support, and other overhead items. Medical
Care expenditures do not include dollars for construction or
other non-medical support.4. Medical Care expenditures are
based on where patients live instead of where care is
delivered.5. A star symbol (*) in the Unique Patients column
denotes that there were less than 10 Unique Patients.
&"Arial,Bold"&11FY13 GEOGRAPHIC DISTRIBUTION OF
VA EXPENDITURES (GDX)
&8&P of &N
CTFY13 Summary of Expenditures by StateExpenditures in
$000sCounty/ Congressional DistrictVeteran Population*Total
ExpenditureCompensation & PensionConstructionEducation &
Vocational Rehabilitation/ EmploymentLoan Guaranty#General
Operating ExpensesInsurance & IndemnitiesMedical
CareUnique Patients**FAIRFIELD38,650$ 155,181$ 51,228$
-$ 14,442$ -$ -$ 7,106$ 82,4058,607HARTFORD51,906$
254,624$ 95,704$ 6$ 22,027$ -$ 11,297$ 6,087$
119,50412,970LITCHFIELD14,246$ 55,016$ 21,892$ -$
4,063$ -$ -$ 988$ 28,0733,485MIDDLESEX11,714$
52,009$ 18,892$ -$ 4,169$ -$ -$ 1,225$
27,7232,653NEW HAVEN46,974$ 384,486$ 94,344$ 8,326$
26,035$ -$ 2,497$ 4,897$ 248,38614,502NEW
LONDON25,046$ 103,410$ 51,314$ -$ 15,973$ -$ -$
2,460$ 33,6635,087TOLLAND9,810$ 36,391$ 14,874$ -$
5,259$ -$ -$ 1,033$ 15,2262,098WINDHAM9,414$
37,450$ 17,391$ -$ 4,448$ -$ -$ 398$
15,2131,958CONNECTICUT (Totals)207,759$ 1,078,567$
365,638$ 8,332$ 96,416$ -$ 13,794$ 24,195$
570,19251,360CONG. DIST (01)41,676$ 215,828$ 80,387$
6$ 18,278$ -$ 11,297$ 4,822$ 101,03810,911CONG.
DIST (02)57,368$ 221,956$ 99,748$ -$ 29,347$ -$ -$
5,209$ 87,65211,802CONG. DIST (03)39,579$ 354,985$
89,346$ 8,326$ 24,351$ -$ 2,497$ 4,171$
226,29412,494CONG. DIST (04)28,142$ 116,516$ 37,995$
-$ 10,705$ -$ -$ 5,868$ 61,9486,088CONG. DIST
(05)40,994$ 169,282$ 58,162$ -$ 13,735$ -$ -$ 4,126$
93,25910,065CONNECTICUT (Totals)207,759$ 1,078,567$
365,638$ 8,332$ 96,416$ -$ 13,794$ 24,195$
570,19251,360Notes:* Veteran population estimates, as of
September 30, 2013, are produced by the VA Office of the
Actuary (VetPop 2011).# Prior to FY 08, "Loan Guaranty"
expenditures were included in the Education & Vocational
Rehabilitation and Employment (E&VRE) programs.
Currently, all "Loan Guaranty" expenditures are attributed to
Travis County, TX, where all Loan Guaranty payments are
processed. VA will continue to improve data collection for
future GDX reports to better distribute loan expenditures at the
state, county and congressional district levels.** Unique
patients are patients who received treatment at a VA health care
facility. Data are provided by the Allocation Resource Center
(ARC).Expenditure data sources: USASpending.gov for
Compensation & Pension (C&P) and Education and Vocational
Rehabilitation and Employment (EVRE) Benefits; Veterans
Benefits Administration Insurance Center for the Insurance
costs; the VA Financial Management System (FMS) for
Construction, Medical Research, General Operating Expenses,
and certain C&P and Readjustment data; and the Allocation
Resource Center (ARC) for Medical Care costs.1. Expenditures
are rounded to the nearest thousand dollars. For example, $500
to $1,000 are rounded to $1; $0 to $499 are rounded to $0; and
"$ -" = 0 or no expenditures.2. The Compensation & Pension
expenditures include dollars for the following programs:
veterans' compensation for service-connected disabilities;
dependency and indemnity compensation for service-connected
deaths; veterans' pension for nonservice-connected disabilities;
and burial and other benefits to veterans and their survivors.3.
Medical Care expenditures include dollars for medical services,
medical administration, facility maintenance, educational
support, research support, and other overhead items. Medical
Care expenditures do not include dollars for construction or
other non-medical support.4. Medical Care expenditures are
based on where patients live instead of where care is
delivered.5. A star symbol (*) in the Unique Patients column
denotes that there were less than 10 Unique Patients.
&"Arial,Bold"&11FY13 GEOGRAPHIC DISTRIBUTION OF
VA EXPENDITURES (GDX)
&8&P of &N
DCFY13 Summary of Expenditures by StateExpenditures in
$000sCounty/ Congressional DistrictVeteran Population*Total
ExpenditureCompensation & PensionConstructionEducation &
Vocational Rehabilitation/ EmploymentLoan Guaranty#General
Operating ExpensesInsurance & IndemnitiesMedical
CareUnique Patients**DISTRICT OF COLUMBIA31,166$
2,295,599$ 78,699$ 153,310$ 31,054$ -$ 1,825,604$
2,785$ 204,1468,800DC (Totals)31,166$ 2,295,599$
78,699$ 153,310$ 31,054$ -$ 1,825,604$ 2,785$
204,1468,800CONG. DIST (01)31,166$ 2,295,599$ 78,699$
153,310$ 31,054$ -$ 1,825,604$ 2,785$ 204,1468,800DC
(Totals)31,166$ 2,295,599$ 78,699$ 153,310$ 31,054$ -$
1,825,604$ 2,785$ 204,1468,800Notes:* Veteran population
estimates, as of September 30, 2013, are produced by the VA
Office of the Actuary (VetPop 2011).# Prior to FY 08, "Loan
Guaranty" expenditures were included in the Education &
Vocational Rehabilitation and Employment (E&VRE) programs.
Currently, all "Loan Guaranty" expenditures are attributed to
Travis County, TX, where all Loan Guaranty payments are
processed. VA will continue to improve data collection for
future GDX reports to better distribute loan expenditures at the
state, county and congressional district levels.** Unique
patients are patients who received treatment at a VA health care
facility. Data are provided by the Allocation Resource Center
(ARC).Expenditure data sources: USASpending.gov for
Compensation & Pension (C&P) and Education and Vocational
Rehabilitation and Employment (EVRE) Benefits; Veterans
Benefits Administration Insurance Center for the Insurance
costs; the VA Financial Management System (FMS) for
Construction, Medical Research, General Operating Expenses,
and certain C&P and Readjustment data; and the Allocation
Resource Center (ARC) for Medical Care costs.1. Expenditures
are rounded to the nearest thousand dollars. For example, $500
to $1,000 are rounded to $1; $0 to $499 are rounded to $0; and
"$ -" = 0 or no expenditures.2. The Compensation & Pension
expenditures include dollars for the following programs:
veterans' compensation for service-connected disabilities;
dependency and indemnity compensation for service-connected
deaths; veterans' pension for nonservice-connected disabilities;
and burial and other benefits to veterans and their survivors.3.
Medical Care expenditures include dollars for medical services,
medical administration, facility maintenance, educational
support, research support, and other overhead items. Medical
Care expenditures do not include dollars for construction or
other non-medical support.4. Medical Care expenditures are
based on where patients live instead of where care is
delivered.5. A star symbol (*) in the Unique Patients column
denotes that there were less than 10 Unique Patients.
&"Arial,Bold"&11FY13 GEOGRAPHIC DISTRIBUTION OF
VA EXPENDITURES (GDX)
&8&P of &N
DEFY13 Summary of Expenditures by StateExpenditures in
$000sCounty/ Congressional DistrictVeteran Population*Total
ExpenditureCompensation & PensionConstructionEducation &
Vocational Rehabilitation/ EmploymentLoan Guaranty#General
Operating ExpensesInsurance & IndemnitiesMedical
CareUnique Patients**KENT19,358$ 98,918$ 56,417$ -$
15,470$ -$ -$ 1,225$ 25,8063,521NEW CASTLE36,166$
192,800$ 74,158$ 859$ 15,158$ -$ 3,895$ 2,882$
95,8497,432SUSSEX22,493$ 70,899$ 39,389$ -$ 3,703$
-$ -$ 1,488$ 26,3193,723DELAWARE (Totals)78,016$
362,617$ 169,963$ 859$ 34,331$ -$ 3,895$ 5,595$
147,97414,676CONG. DIST (01)78,016$ 362,617$ 169,963$
859$ 34,331$ -$ 3,895$ 5,595$
147,97414,676DELAWARE (Totals)78,016$ 362,617$
169,963$ 859$ 34,331$ -$ 3,895$ 5,595$
147,97414,676Notes:* Veteran population estimates, as of
September 30, 2013, are produced by the VA Office of the
Actuary (VetPop 2011).# Prior to FY 08, "Loan Guaranty"
expenditures were included in the Education & Vocational
Rehabilitation and Employment (E&VRE) programs.
Currently, all "Loan Guaranty" expenditures are attributed to
Travis County, TX, where all Loan Guaranty payments are
processed. VA will continue to improve data collection for
future GDX reports to better distribute loan expenditures at the
state, county and congressional district levels.** Unique
patients are patients who received treatment at a VA health care
facility. Data are provided by the Allocation Resource Center
(ARC).Expenditure data sources: USASpending.gov for
Compensation & Pension (C&P) and Education and Vocational
Rehabilitation and Employment (EVRE) Benefits; Veterans
Benefits Administration Insurance Center for the Insurance
costs; the VA Financial Management System (FMS) for
Construction, Medical Research, General Operating Expenses,
and certain C&P and Readjustment data; and the Allocation
Resource Center (ARC) for Medical Care costs.1. Expenditures
are rounded to the nearest thousand dollars. For example, $500
to $1,000 are rounded to $1; $0 to $499 are rounded to $0; and
"$ -" = 0 or no expenditures.2. The Compensation & Pension
expenditures include dollars for the following programs:
veterans' compensation for service-connected disabilities;
dependency and indemnity compensation for service-connected
deaths; veterans' pension for nonservice-connected disabilities;
and burial and other benefits to veterans and their survivors.4.
Medical Care expenditures are based on where patients live
instead of where care is delivered.5. A star symbol (*) in the
Unique Patients column denotes that there were less than 10
Unique Patients.
&"Arial,Bold"&11FY13 GEOGRAPHIC DISTRIBUTION OF
VA EXPENDITURES (GDX)
&8&P of &N
FLFY13 Summary of Expenditures by StateExpenditures in
$000sCounty/ Congressional DistrictVeteran Population*Total
ExpenditureCompensation & PensionConstructionEducation &
Vocational Rehabilitation/ EmploymentLoan Guaranty#General
Operating ExpensesInsurance & IndemnitiesMedical
CareUnique Patients**ALACHUA17,505$ 209,158$ 56,996$
623$ 12,225$ -$ 6,581$ 1,468$
131,2657,419BAKER2,625$ 14,746$ 5,620$ -$ 719$ -$
-$ 105$ 8,302635BAY22,405$ 134,321$ 93,443$ -$
11,614$ -$ -$ 2,241$ 27,0225,307BRADFORD4,033$
24,398$ 6,945$ -$ 678$ -$ -$ 130$
16,645966BREVARD65,116$ 432,556$ 248,823$ -$
32,973$ -$ -$ 6,008$ 144,75121,585BROWARD84,388$
522,109$ 237,590$ -$ 63,756$ -$ -$ 9,246$
211,51724,071CALHOUN1,207$ 7,394$ 3,897$ -$ 257$ -
$ -$ 101$ 3,139371CHARLOTTE19,138$ 112,140$
62,019$ -$ 3,123$ -$ -$ 1,526$
45,4726,491CITRUS26,022$ 121,138$ 58,373$ -$ 3,075$
-$ -$ 1,443$ 58,2467,693CLAY28,748$ 169,881$
91,815$ -$ 27,625$ -$ -$ 2,458$
47,9846,092COLLIER27,056$ 87,402$ 49,358$ -$ 4,787$
-$ -$ 3,056$ 30,2005,917COLUMBIA7,713$ 98,910$
28,666$ -$ 1,607$ -$ -$ 486$ 68,1513,599DE
SOTO2,412$ 12,549$ 6,475$ -$ 292$ -$ -$ 48$
5,734715DIXIE1,599$ 19,246$ 6,111$ -$ 141$ -$ -$
179$ 12,815849DUVAL97,642$ 525,661$ 249,926$ -$
105,874$ -$ -$ 5,792$ 164,06921,901ESCAMBIA40,851$
248,454$ 153,890$ 26$ 25,337$ -$ 1,681$ 3,263$
64,25710,386FLAGLER11,480$ 55,295$ 30,327$ -$
4,961$ -$ -$ 807$ 19,2003,357FRANKLIN1,487$ 5,592$
2,926$ -$ 134$ -$ -$ 24$ 2,507377GADSDEN3,786$
23,331$ 11,354$ -$ 1,184$ -$ -$ 247$
10,5461,348GILCHRIST1,559$ 15,918$ 5,684$ -$ 385$ -
$ -$ 84$ 9,765697GLADES971$ 5,305$ 1,365$ -$ 28$
-$ -$ 14$ 3,897360GULF1,772$ 8,331$ 5,794$ -$
337$ -$ -$ 82$ 2,118427HAMILTON1,229$ 11,770$
4,459$ -$ 191$ -$ -$ 6$ 7,113484HARDEE1,457$
7,832$ 3,818$ -$ 266$ -$ -$ 65$
3,683355HENDRY1,823$ 11,881$ 6,012$ -$ 561$ -$ -$
15$ 5,292603HERNANDO21,501$ 145,603$ 77,800$ -$
6,089$ -$ -$ 1,231$ 60,4837,832HIGHLANDS9,887$
67,682$ 32,871$ -$ 1,630$ -$ -$ 880$
32,3023,712HILLSBOROUGH92,584$ 911,730$ 339,886$
23,950$ 96,756$ -$ 6,900$ 7,473$
436,76531,247HOLMES2,008$ 15,529$ 11,483$ -$ 427$
-$ -$ 32$ 3,587599INDIAN RIVER14,122$ 73,022$
40,464$ -$ 2,815$ -$ -$ 1,690$
28,0534,724JACKSON4,970$ 30,586$ 17,663$ -$ 1,184$
-$ -$ 165$ 11,5731,591JEFFERSON1,429$ 7,625$
4,000$ -$ 312$ -$ -$ 270$ 3,043462LAFAYETTE720$
4,664$ 1,259$ -$ 71$ -$ -$ 6$ 3,329231LAKE32,329$
185,979$ 96,116$ -$ 7,425$ -$ -$ 2,550$
79,88711,246LEE53,892$ 269,168$ 136,912$ -$ 15,562$
-$ -$ 4,687$ 112,00717,910LEON18,510$ 93,813$
42,816$ -$ 12,425$ -$ -$ 1,803$
36,7695,133LEVY4,555$ 46,490$ 14,005$ -$ 818$ -$ -
$ 320$ 31,3462,190LIBERTY644$ 2,503$ 1,424$ -$
50$ -$ -$ 1$ 1,028158MADISON1,853$ 12,456$ 5,058$
-$ 360$ -$ -$ 264$ 6,775575MANATEE30,009$
163,663$ 83,671$ -$ 9,002$ -$ -$ 2,852$
68,1389,799MARION45,745$ 260,849$ 108,390$ -$
8,325$ -$ -$ 3,415$ 140,71915,582MARTIN14,001$
78,081$ 36,242$ -$ 2,377$ -$ -$ 2,278$
37,1855,148MIAMI-DADE61,552$ 565,773$ 193,350$
12,557$ 69,310$ -$ 3,119$ 3,824$
283,61417,727MONROE7,887$ 47,807$ 21,189$ -$
4,594$ -$ -$ 466$ 21,5582,479NASSAU8,744$ 38,731$
19,776$ -$ 3,861$ -$ -$ 538$
14,5551,830OKALOOSA32,208$ 212,049$ 148,217$ -$
28,834$ -$ -$ 4,899$ 30,0996,109OKEECHOBEE3,141$
26,909$ 12,166$ -$ 414$ -$ -$ 55$
14,2751,351ORANGE67,832$ 535,158$ 234,597$ -$
81,344$ -$ 14$ 6,566$ 212,63621,998OSCEOLA17,152$
140,667$ 69,464$ -$ 14,082$ -$ -$ 700$
56,4226,092PALM BEACH76,947$ 575,963$ 217,606$
325$ 34,841$ -$ 7,570$ 15,647$
299,97432,712PASCO50,568$ 361,217$ 162,106$ -$
21,456$ -$ -$ 3,632$ 174,02418,172PINELLAS86,504$
983,756$ 309,891$ 94,239$ 38,122$ -$ 114,420$
8,704$ 418,38032,921POLK53,918$ 301,135$ 146,151$ -$
17,291$ -$ -$ 3,762$ 133,93114,781PUTNAM7,766$
61,308$ 22,307$ -$ 1,598$ -$ -$ 381$
37,0223,163SAINT JOHNS20,424$ 89,230$ 47,757$ -$
8,961$ -$ 35$ 2,121$ 30,3574,789SAINT LUCIE22,893$
161,357$ 75,632$ -$ 8,205$ -$ -$ 1,594$
75,9279,125SANTA ROSA22,809$ 144,231$ 100,027$ -$
17,250$ -$ -$ 1,935$ 25,0204,821SARASOTA38,130$
183,846$ 100,138$ -$ 8,588$ -$ -$ 5,537$
69,58312,047SEMINOLE30,363$ 193,037$ 91,037$ -$
20,924$ -$ -$ 3,204$ 77,8728,790SUMTER14,557$
87,274$ 42,398$ 151$ 761$ -$ 5,770$ 1,217$
36,9766,276SUWANNEE4,625$ 40,475$ 13,773$ -$ 726$
-$ -$ 380$ 25,5961,875TAYLOR2,108$ 14,529$ 6,122$
-$ 285$ -$ -$ 197$ 7,924769UNION1,718$ 9,006$
3,342$ -$ 243$ -$ -$ 7$ 5,414377VOLUSIA53,789$
342,868$ 171,981$ -$ 40,020$ -$ -$ 4,668$
126,20017,849WAKULLA3,338$ 14,980$ 8,074$ -$ 904$
-$ -$ 32$ 5,970889WALTON6,274$ 29,731$ 19,117$ -$
1,645$ -$ -$ 635$ 8,3341,421WASHINGTON2,530$
14,974$ 10,304$ -$ 535$ -$ -$ 129$
4,005686FLORIDA (Totals)1,520,563$ 10,430,774$
4,728,273$ 131,870$ 892,555$ -$ 146,088$ 139,645$
4,392,344479,193CONG. DIST (01)103,294$ 645,506$
429,425$ 26$ 73,369$ -$ 1,681$ 10,748$
130,25723,118CONG. DIST (02)65,422$ 364,646$ 212,017$
-$ 29,409$ -$ -$ 5,342$ 117,87717,850CONG. DIST
(03)79,723$ 626,483$ 230,873$ 623$ 40,278$ -$ 6,581$
6,763$ 341,36525,716CONG. DIST (04)83,393$ 360,345$
170,593$ -$ 66,089$ -$ -$ 5,147$ 118,51516,135CONG.
DIST (05)52,800$ 512,043$ 223,987$ -$ 76,086$ -$ -$
3,748$ 208,22219,009CONG. DIST (06)78,226$ 438,467$
219,755$ -$ 44,512$ -$ 35$ 6,950$
167,21524,168CONG. DIST (07)52,587$ 372,960$ 174,978$
-$ 46,275$ -$ -$ 4,985$ 146,72215,714CONG. DIST
(08)80,618$ 514,939$ 293,426$ -$ 37,222$ -$ -$
7,732$ 176,55926,733CONG. DIST (09)42,715$ 328,351$
152,506$ -$ 39,982$ -$ 14$ 2,773$
133,07614,869CONG. DIST (10)57,903$ 330,217$ 154,761$
-$ 26,102$ -$ -$ 4,777$ 144,57817,368CONG. DIST
(11)101,477$ 576,182$ 273,110$ 151$ 17,194$ -$
5,770$ 6,332$ 273,62635,566CONG. DIST (12)70,391$
467,047$ 203,561$ -$ 29,726$ -$ -$ 5,508$
228,25224,039CONG. DIST (13)67,413$ 829,471$ 248,721$
94,239$ 30,597$ -$ 114,420$ 6,747$
334,74725,798CONG. DIST (14)47,593$ 600,009$ 223,762$
23,950$ 57,343$ -$ 6,900$ 3,684$ 284,37018,465CONG.
DIST (15)57,149$ 429,002$ 182,153$ -$ 39,413$ -$ -$
3,992$ 203,44417,310CONG. DIST (16)67,750$ 344,755$
182,382$ -$ 17,437$ -$ -$ 8,372$ 136,56321,747CONG.
DIST (17)69,322$ 424,689$ 202,103$ -$ 20,225$ -$ -$
5,706$ 196,65522,728CONG. DIST (18)55,155$ 376,842$
165,182$ -$ 19,117$ -$ -$ 6,680$ 185,86321,179CONG.
DIST (19)62,616$ 264,986$ 136,403$ -$ 15,117$ -$ -$
6,545$ 106,92118,267CONG. DIST (20)28,913$ 301,097$
129,118$ -$ 28,334$ -$ -$ 3,453$ 140,19211,467CONG.
DIST (21)41,306$ 217,138$ 86,104$ -$ 17,236$ -$ -$
8,207$ 105,59016,598CONG. DIST (22)43,231$ 262,016$
104,445$ 325$ 21,961$ -$ 7,570$ 7,990$
119,72613,615CONG. DIST (23)29,688$ 184,970$ 79,676$
-$ 22,795$ -$ -$ 3,089$ 79,4108,019CONG. DIST
(24)19,005$ 294,165$ 103,268$ 12,557$ 35,592$ -$
3,119$ 1,034$ 138,5967,806CONG. DIST (25)19,688$
100,267$ 47,828$ -$ 8,966$ -$ -$ 1,115$
42,3585,321CONG. DIST (26)25,163$ 145,203$ 55,874$ -$
17,027$ -$ -$ 1,091$ 71,2116,387CONG. DIST
(27)18,023$ 118,977$ 42,262$ -$ 15,149$ -$ -$ 1,135$
60,4324,201FLORIDA (Totals)1,520,563$ 10,430,774$
4,728,273$ 131,870$ 892,555$ -$ 146,088$ 139,645$
4,392,344479,193Notes:* Veteran population estimates, as of
September 30, 2013, are produced by the VA Office of the
Actuary (VetPop 2011).# Prior to FY 08, "Loan Guaranty"
expenditures were included in the Education & Vocational
Rehabilitation and Employment (E&VRE) programs.
Currently, all "Loan Guaranty" expenditures are attributed to
Travis County, TX, where all Loan Guaranty payments are
processed. VA will continue to improve data collection for
future GDX reports to better distribute loan expenditures at the
state, county and congressional district levels.** Unique
patients are patients who received treatment at a VA health care
facility. Data are provided by the Allocation Resource Center
(ARC).Expenditure data sources: USASpending.gov for
Compensation & Pension (C&P) and Education and Vocational
Rehabilitation and Employment (EVRE) Benefits; Veterans
Benefits Administration Insurance Center for the Insurance
costs; the VA Financial Management System (FMS) for
Construction, Medical Research, General Operating Expenses,
and certain C&P and Readjustment data; and the Allocation
Resource Center (ARC) for Medical Care costs.1. Expenditures
are rounded to the nearest thousand dollars. For example, $500
to $1,000 are rounded to $1; $0 to $499 are rounded to $0; and
"$ -" = 0 or no expenditures.2. The Compensation & Pension
expenditures include dollars for the following programs:
veterans' compensation for service-connected disabilities;
dependency and indemnity compensation for service-connected
deaths; veterans' pension for nonservice-connected disabilities;
and burial and other benefits to veterans and their survivors.3.
Medical Care expenditures include dollars for medical services,
medical administration, facility maintenance, educational
support, research support, and other overhead items. Medical
Care expenditures do not include dollars for construction or
other non-medical support.4. Medical Care expenditures are
based on where patients live instead of where care is
delivered.5. A star symbol (*) in the Unique Patients column
denotes that there were less than 10 Unique Patients.
&"Arial,Bold"&11FY13 GEOGRAPHIC DISTRIBUTION OF
VA EXPENDITURES (GDX)
&8&P of &N
GAFY13 Summary of Expenditures by StateExpenditures in
$000sCounty/ Congressional DistrictVeteran Population*Total
ExpenditureCompensation & PensionConstructionEducation &
Vocational Rehabilitation/ EmploymentLoan Guaranty#General
Operating ExpensesInsurance & IndemnitiesMedical
CareUnique Patients**APPLING1,245$ 6,105$ 3,100$ -$
194$ -$ -$ 18$ 2,793363ATKINSON452$ 3,422$
1,432$ -$ 122$ -$ -$ 15$ 1,852179BACON801$
4,303$ 2,476$ -$ 114$ -$ -$ 55$
1,659234BAKER330$ 1,074$ 609$ -$ 42$ -$ -$ 17$
40568BALDWIN4,150$ 22,498$ 9,698$ -$ 1,054$ -$ -$
106$ 11,640957BANKS1,072$ 5,966$ 3,714$ -$ 257$ -
$ -$ 38$ 1,956266BARROW5,905$ 22,310$ 12,176$ -$
2,116$ -$ -$ 146$ 7,8721,011BARTOW8,141$ 32,593$
20,436$ -$ 2,465$ -$ -$ 478$ 9,2151,259BEN
HILL1,263$ 9,959$ 5,484$ -$ 292$ -$ -$ 28$
4,155426BERRIEN1,517$ 11,646$ 6,690$ -$ 832$ -$ -$
34$ 4,090523BIBB12,325$ 78,328$ 40,885$ -$ 6,076$ -
$ -$ 632$ 30,7353,805BLECKLEY1,076$ 7,268$ 3,544$
-$ 288$ -$ -$ 92$ 3,344241BRANTLEY1,374$ 8,338$
4,320$ -$ 278$ -$ -$ 91$ 3,648425BROOKS1,431$
9,531$ 3,578$ -$ 243$ -$ -$ 317$
5,394551BRYAN3,905$ 26,878$ 16,087$ -$ 6,272$ -$ -
$ 70$ 4,449845BULLOCH5,024$ 22,100$ 11,201$ -$
2,870$ -$ -$ 151$ 7,8791,026BURKE1,842$ 13,633$
6,252$ -$ 505$ -$ -$ 142$ 6,734615BUTTS2,358$
11,675$ 7,280$ -$ 704$ -$ -$ 77$
3,615408CALHOUN445$ 2,597$ 1,546$ -$ 124$ -$ -$
56$ 871141CAMDEN7,218$ 41,671$ 22,449$ -$ 8,330$
-$ -$ 174$ 10,7181,644CANDLER834$ 5,124$ 2,087$ -
$ 185$ -$ -$ 37$ 2,814207CARROLL8,260$ 45,290$
25,060$ -$ 3,510$ -$ -$ 395$
16,3241,796CATOOSA5,267$ 19,026$ 11,000$ -$ 1,045$
-$ -$ 199$ 6,7811,127CHARLTON953$ 5,705$ 2,822$ -
$ 188$ -$ -$ 81$ 2,614301CHATHAM28,174$ 151,704$
83,094$ -$ 30,772$ -$ -$ 1,414$
36,4256,254CHATTAHOOCHEE1,178$ 3,469$ 2,449$ -$
252$ -$ -$ 32$ 735174CHATTOOGA1,983$ 8,859$
6,236$ -$ 355$ -$ -$ 45$ 2,223378CHEROKEE17,894$
63,098$ 38,907$ -$ 6,738$ -$ -$ 1,238$
16,2152,192CLARKE6,201$ 29,273$ 17,077$ -$ 3,009$ -
$ -$ 397$ 8,7891,154CLAY311$ 973$ 586$ -$ 37$ -$
-$ 40$ 31158CLAYTON22,434$ 128,639$ 65,966$ -$
13,130$ -$ -$ 693$ 48,8505,530CLINCH565$ 2,377$
1,285$ -$ 201$ -$ -$ 2$ 890151COBB48,898$
205,122$ 110,986$ 474$ 29,651$ -$ 341$ 3,819$
59,8517,780COFFEE2,454$ 16,584$ 8,410$ -$ 576$ -$
-$ 90$ 7,508855COLQUITT2,884$ 19,074$ 9,787$ -$
721$ -$ -$ 208$ 8,358861COLUMBIA15,256$ 149,175$
88,792$ -$ 21,401$ -$ -$ 1,677$
37,3064,401COOK1,319$ 8,283$ 4,394$ -$ 377$ -$ -$
95$ 3,417458COWETA11,908$ 47,970$ 29,817$ -$
4,445$ -$ -$ 370$ 13,3372,095CRAWFORD1,024$
3,825$ 1,587$ -$ 161$ -$ -$ 104$
1,973326CRISP1,591$ 8,847$ 4,210$ -$ 499$ -$ -$
316$ 3,822436DADE1,427$ 5,263$ 2,878$ -$ 332$ -$
-$ 17$ 2,036273DAWSON2,403$ 7,344$ 5,170$ -$
443$ -$ -$ 18$ 1,713293DECATUR2,162$ 8,783$
4,143$ -$ 569$ -$ -$ 158$ 3,913626DEKALB40,518$
443,244$ 145,539$ 995$ 32,435$ -$ 92,524$ 3,591$
168,16012,376DODGE1,551$ 11,298$ 4,083$ -$ 641$ -$
-$ 86$ 6,487474DOOLY916$ 4,102$ 2,098$ -$ 138$ -
$ -$ 48$ 1,817189DOUGHERTY7,354$ 54,532$ 33,779$
-$ 5,638$ -$ -$ 435$ 14,6802,439DOUGLAS12,184$
64,227$ 36,911$ -$ 6,992$ -$ -$ 871$
19,4522,364EARLY895$ 3,647$ 2,158$ -$ 181$ -$ -$
28$ 1,280227ECHOLS247$ 1,319$ 233$ -$ 26$ -$ -$
66$ 99488EFFINGHAM6,111$ 21,683$ 12,757$ -$
2,667$ -$ -$ 112$ 6,146982ELBERT1,693$ 9,228$
5,071$ -$ 216$ -$ -$ 55$ 3,886472EMANUEL1,351$
13,391$ 5,515$ -$ 512$ -$ -$ 58$
7,306552EVANS796$ 4,639$ 2,619$ -$ 198$ -$ -$ 72$
1,750229FANNIN2,137$ 14,131$ 8,495$ -$ 240$ -$ -$
186$ 5,209663FAYETTE11,522$ 54,635$ 38,636$ -$
4,702$ -$ -$ 682$ 10,6151,650FLOYD7,041$ 29,574$
19,766$ -$ 1,740$ -$ -$ 418$
7,6491,260FORSYTH12,112$ 26,782$ 15,277$ -$ 1,871$
-$ -$ 784$ 8,8491,338FRANKLIN1,861$ 9,051$ 5,291$
-$ 361$ -$ -$ 75$ 3,324409FULTON49,217$ 328,480$
159,394$ 97$ 39,714$ -$ 2,031$ 4,091$
123,15412,197GILMER2,713$ 13,617$ 9,005$ -$ 243$ -$
-$ 120$ 4,249650GLASCOCK164$ 1,441$ 517$ -$ 43$
-$ -$ 5$ 87765GLYNN7,973$ 38,339$ 21,523$ -$
2,330$ -$ -$ 700$ 13,7862,108GORDON3,718$ 14,667$
9,569$ -$ 667$ -$ -$ 106$ 4,325648GRADY1,810$
9,251$ 4,530$ -$ 636$ -$ -$ 48$
4,037638GREENE1,448$ 6,883$ 4,071$ -$ 190$ -$ -$
122$ 2,500324GWINNETT47,476$ 190,726$ 96,856$ -$
25,190$ -$ -$ 2,794$ 65,8868,376HABERSHAM3,415$
15,381$ 9,727$ -$ 695$ -$ -$ 135$
4,824742HALL12,412$ 48,211$ 28,062$ -$ 2,811$ -$ -
$ 811$ 16,5272,281HANCOCK699$ 5,652$ 2,952$ -$
149$ -$ -$ 105$ 2,447192HARALSON2,208$ 10,463$
5,689$ -$ 495$ -$ -$ 43$ 4,236473HARRIS4,160$
20,578$ 14,347$ -$ 1,605$ -$ -$ 431$
4,196762HART2,047$ 8,670$ 4,225$ -$ 157$ -$ -$
69$ 4,218495HEARD875$ 4,389$ 1,970$ -$ 219$ -$ -
$ 139$ 2,061225HENRY20,685$ 124,307$ 75,102$ -$
16,974$ -$ -$ 1,125$ 31,1064,228HOUSTON20,820$
131,967$ 84,923$ -$ 19,161$ -$ -$ 1,845$
26,0384,474IRWIN660$ 2,620$ 1,531$ -$ 106$ -$ -$
49$ 934186JACKSON5,140$ 22,109$ 13,946$ -$ 1,350$
-$ -$ 218$ 6,596907JASPER1,166$ 5,042$ 2,801$ -$
269$ -$ -$ 85$ 1,887282JEFF DAVIS805$ 5,910$
2,620$ -$ 163$ -$ -$ 36$ 3,091316JEFFERSON1,160$
11,834$ 4,392$ -$ 334$ -$ -$ 57$
7,052439JENKINS788$ 3,922$ 1,742$ -$ 106$ -$ -$
3$ 2,071177JOHNSON581$ 4,778$ 1,772$ -$ 124$ -$
-$ 101$ 2,780172JONES2,300$ 9,191$ 3,539$ -$ 445$
-$ -$ 165$ 5,041619LAMAR1,853$ 7,440$ 4,599$ -$
350$ -$ -$ 57$ 2,434326LANIER854$ 5,749$ 2,764$ -
$ 581$ -$ -$ 14$ 2,390272LAURENS4,116$ 74,698$
18,016$ 35$ 1,336$ -$ 11,048$ 327$
43,9371,958LEE3,254$ 12,814$ 8,113$ -$ 1,408$ -$ -$
204$ 3,089680LIBERTY10,917$ 89,873$ 54,898$ -$
19,645$ -$ -$ 405$ 14,9252,805LINCOLN877$ 6,129$
3,114$ -$ 100$ -$ -$ 55$ 2,859243LONG1,637$
12,614$ 6,671$ -$ 2,352$ -$ -$ 133$
3,458427LOWNDES12,870$ 73,597$ 39,958$ -$ 9,388$ -
$ -$ 543$ 23,7083,057LUMPKIN2,465$ 10,152$ 5,794$
-$ 1,118$ -$ -$ 158$ 3,082453MCDUFFIE1,865$
14,251$ 7,090$ -$ 579$ -$ -$ 30$
6,553577MCINTOSH1,433$ 6,942$ 3,700$ -$ 291$ -$ -
$ 63$ 2,888383MACON1,114$ 4,690$ 1,887$ -$ 246$
-$ -$ 27$ 2,530262MADISON2,310$ 12,362$ 7,776$ -$
599$ -$ -$ 116$ 3,871542MARION886$ 4,771$ 2,706$
-$ 348$ -$ -$ 41$ 1,674194MERIWETHER1,992$
8,194$ 4,417$ -$ 276$ -$ -$ 361$
3,140382MILLER533$ 1,599$ 872$ -$ 60$ -$ -$ 1$
666124MITCHELL1,690$ 6,358$ 3,648$ -$ 483$ -$ -$
64$ 2,163381MONROE2,132$ 9,908$ 5,136$ -$ 485$ -$
-$ 149$ 4,139547MONTGOMERY609$ 4,810$ 2,012$ -$
141$ -$ -$ 15$ 2,643199MORGAN1,234$ 6,416$
4,027$ -$ 308$ -$ -$ 20$ 2,061302MURRAY2,463$
11,752$ 7,504$ -$ 335$ -$ -$ 38$
3,874555MUSCOGEE24,041$ 251,067$ 171,003$ -$
30,071$ -$ -$ 2,478$ 47,5156,458NEWTON8,546$
47,460$ 26,002$ -$ 3,754$ -$ -$ 458$
17,2471,866OCONEE2,642$ 8,857$ 6,295$ -$ 542$ -$ -
$ 145$ 1,875318OGLETHORPE1,020$ 4,799$ 2,011$ -$
128$ -$ -$ 45$ 2,614313PAULDING11,793$ 40,654$
20,598$ -$ 4,310$ -$ -$ 541$
15,2051,761PEACH2,838$ 20,168$ 12,725$ -$ 2,171$ -$
-$ 198$ 5,074708PICKENS3,359$ 10,834$ 7,444$ -$
548$ -$ -$ 217$ 2,624391PIERCE1,254$ 10,653$
5,445$ -$ 318$ -$ -$ 77$ 4,814564PIKE1,509$ 6,811$
3,946$ -$ 519$ -$ -$ 62$ 2,284295POLK2,886$
13,174$ 9,026$ -$ 629$ -$ -$ 144$
3,375544PULASKI868$ 5,614$ 3,134$ -$ 273$ -$ -$
12$ 2,194208PUTNAM2,181$ 8,956$ 4,217$ -$ 326$ -$
-$ 76$ 4,337463QUITMAN292$ 2,587$ 1,203$ -$ 48$
-$ -$ 12$ 1,323101RABUN1,686$ 7,873$ 4,362$ -$
161$ -$ -$ 68$ 3,281435RANDOLPH573$ 2,319$
1,402$ -$ 148$ -$ -$ 57$ 712112RICHMOND22,212$
288,957$ 135,534$ 1,759$ 20,634$ -$ 3,299$ 1,501$
126,2319,679ROCKDALE8,389$ 45,974$ 25,540$ -$
4,062$ -$ -$ 315$ 16,0581,778SCHLEY297$ 1,260$
786$ -$ 88$ -$ -$ 5$ 38169SCREVEN1,197$ 6,314$
2,379$ -$ 311$ -$ -$ 105$ 3,519303SEMINOLE913$
4,242$ 2,112$ -$ 153$ -$ -$ 250$
1,726237SPALDING5,047$ 28,049$ 16,484$ -$ 1,617$ -
$ -$ 287$ 9,6621,170STEPHENS2,029$ 11,672$ 7,278$
-$ 415$ -$ -$ 76$ 3,903498STEWART364$ 2,148$
1,428$ -$ 121$ -$ -$ 20$ 57983SUMTER2,021$
12,280$ 7,750$ -$ 684$ -$ -$ 121$
3,725511TALBOT632$ 4,741$ 3,423$ -$ 223$ -$ -$
74$ 1,021151TALIAFERRO150$ 823$ 316$ -$ 24$ -$
-$ 1$ 48239TATTNALL2,352$ 12,689$ 7,093$ -$ 810$
-$ -$ 36$ 4,749522TAYLOR653$ 3,194$ 1,803$ -$
139$ -$ -$ 21$ 1,230155TELFAIR865$ 8,494$ 3,113$
-$ 128$ -$ -$ 12$ 5,241305TERRELL887$ 3,213$
1,699$ -$ 233$ -$ -$ 106$ 1,175208THOMAS3,592$
24,404$ 12,392$ -$ 1,594$ -$ -$ 232$
10,1851,231TIFT2,503$ 17,137$ 10,374$ -$ 783$ -$ -$
233$ 5,746788TOOMBS1,796$ 14,096$ 6,150$ -$ 741$
-$ -$ 145$ 7,060667TOWNS1,370$ 8,442$ 4,656$ -$
181$ -$ -$ 186$ 3,419458TREUTLEN478$ 3,605$
1,183$ -$ 65$ -$ -$ 50$ 2,308139TROUP4,877$
29,074$ 17,855$ -$ 1,355$ -$ -$ 349$
9,5161,110TURNER649$ 3,885$ 2,558$ -$ 218$ -$ -$
11$ 1,098205TWIGGS729$ 5,120$ 2,337$ -$ 163$ -$
-$ 57$ 2,563246UNION2,789$ 15,257$ 9,037$ -$ 308$
-$ -$ 257$ 5,654894UPSON2,341$ 12,592$ 6,970$ -$
425$ -$ -$ 81$ 5,116598WALKER5,329$ 28,069$
17,998$ -$ 1,099$ -$ -$ 228$
8,7441,282WALTON6,676$ 36,650$ 23,375$ -$ 3,170$ -
$ -$ 437$ 9,6681,184WARE3,351$ 24,677$ 12,389$ -$
533$ -$ -$ 206$ 11,5501,203WARREN401$ 2,800$
1,246$ -$ 99$ -$ -$ 19$ 1,436131WASHINGTON1,498$
11,417$ 4,410$ -$ 301$ -$ -$ 33$
6,673509WAYNE2,849$ 15,259$ 8,348$ -$ 769$ -$ -$
80$ 6,062723WEBSTER208$ 705$ 418$ -$ 9$ -$ -$
50$ 22827WHEELER530$ 4,639$ 1,637$ -$ 78$ -$ -$
2$ 2,922176WHITE2,533$ 12,251$ 7,228$ -$ 442$ -$
-$ 52$ 4,529571WHITFIELD5,026$ 25,234$ 16,475$ -$
1,153$ -$ -$ 321$ 7,2841,178WILCOX763$ 5,079$
2,181$ -$ 139$ -$ -$ 162$ 2,597174WILKES987$
5,201$ 2,619$ -$ 212$ -$ -$ 60$
2,310242WILKINSON792$ 7,090$ 3,220$ -$ 215$ -$ -$
55$ 3,601268WORTH1,809$ 7,414$ 4,120$ -$ 450$ -$
-$ 19$ 2,825502GEORGIA (Totals)774,464$ 4,670,709$
2,482,164$ 3,359$ 453,034$ -$ 109,242$ 48,822$
1,574,087179,821CONG. DIST (01)77,060$ 458,087$
255,822$ -$ 74,581$ -$ -$ 3,718$ 123,96618,913CONG.
DIST (02)62,636$ 465,920$ 288,900$ -$ 45,455$ -$ -$
4,854$ 126,71117,635CONG. DIST (03)63,163$ 320,077$
198,255$ -$ 26,740$ -$ -$ 3,933$ 91,14912,283CONG.
DIST (04)49,369$ 430,542$ 162,870$ 995$ 34,077$ -$
92,524$ 2,620$ 137,45713,329CONG. DIST (05)38,878$
378,305$ 171,274$ 97$ 40,320$ -$ 2,031$ 1,992$
162,59111,968CONG. DIST (06)39,406$ 118,476$ 56,099$
-$ 13,883$ -$ -$ 5,285$ 43,2085,291CONG. DIST
(07)39,980$ 135,656$ 70,031$ -$ 17,034$ -$ -$ 2,657$
45,9336,458CONG. DIST (08)66,492$ 409,732$ 225,530$ -
$ 38,237$ -$ -$ 4,675$ 141,29117,487CONG. DIST
(09)57,147$ 256,353$ 153,935$ -$ 11,798$ -$ -$
3,006$ 87,61412,048CONG. DIST (10)54,788$ 295,586$
156,328$ -$ 21,833$ -$ -$ 2,703$ 114,72111,302CONG.
DIST (11)50,694$ 194,232$ 111,975$ 474$ 23,215$ -$
341$ 3,707$ 54,5217,340CONG. DIST (12)64,407$
632,329$ 299,620$ 1,793$ 49,055$ -$ 14,346$ 4,362$
263,15322,242CONG. DIST (13)60,533$ 365,054$ 202,269$
-$ 44,464$ -$ -$ 3,148$ 115,17213,937CONG. DIST
(14)49,911$ 210,360$ 129,257$ -$ 12,343$ -$ -$
2,161$ 66,5999,588GEORGIA (Totals)774,464$ 4,670,709$
2,482,164$ 3,359$ 453,034$ -$ 109,242$ 48,822$
1,574,087179,821Notes:* Veteran population estimates, as of
September 30, 2013, are produced by the VA Office of the
Actuary (VetPop 2011).# Prior to FY 08, "Loan Guaranty"
expenditures were included in the Education & Vocational
Rehabilitation and Employment (E&VRE) programs.
Currently, all "Loan Guaranty" expenditures are attributed to
Travis County, TX, where all Loan Guaranty payments are
processed. VA will continue to improve data collection for
future GDX reports to better distribute loan expenditures at the
state, county and congressional district levels.** Unique
patients are patients who received treatment at a VA health care
facility. Data are provided by the Allocation Resource Center
(ARC).Expenditure data sources: USASpending.gov for
Compensation & Pension (C&P) and Education and Vocational
Rehabilitation and Employment (EVRE) Benefits; Veterans
Benefits Administration Insurance Center for the Insurance
costs; the VA Financial Management System (FMS) for
Construction, Medical Research, General Operating Expenses,
and certain C&P and Readjustment data; and the Allocation
Resource Center (ARC) for Medical Care costs.1. Expenditures
are rounded to the nearest thousand dollars. For example, $500
to $1,000 are rounded to $1; $0 to $499 are rounded to $0; and
"$ -" = 0 or no expenditures.2. The Compensation & Pension
expenditures include dollars for the following programs:
veterans' compensation for service-connected disabilities;
dependency and indemnity compensation for service-connected
deaths; veterans' pension for nonservice-connected disabilities;
and burial and other benefits to veterans and their survivors.3.
Medical Care expenditures include dollars for medical services,
medical administration, facility maintenance, educational
support, research support, and other overhead items. Medical
Care expenditures do not include dollars for construction or
other non-medical support.4. Medical Care expenditures are
based on where patients live instead of where care is
delivered.5. A star symbol (*) in the Unique Patients column
denotes that there were less than 10 Unique Patients.
&"Arial,Bold"&11FY13 GEOGRAPHIC DISTRIBUTION OF
VA EXPENDITURES (GDX)
&8&P of &N
HIFY13 Summary of Expenditures by StateExpenditures in
$000sCounty/ Congressional DistrictVeteran Population*Total
ExpenditureCompensation & PensionConstructionEducation &
Vocational Rehabilitation/ EmploymentLoan Guaranty#General
Operating ExpensesInsurance & IndemnitiesMedical
CareUnique Patients**HAWAII15,760$ 94,387$ 50,429$ -$
3,096$ -$ -$ 1,003$ 39,8583,802HONOLULU85,279$
569,136$ 241,149$ 1,690$ 136,679$ -$ 16,013$
10,635$ 162,97016,434KALAWAO5$ 4$ -$ -$ -$ -$ -$
-$ 4*KAUAI5,282$ 29,075$ 13,758$ -$ 876$ -$ -$
540$ 13,9011,375MAUI10,622$ 62,079$ 32,583$ -$
2,078$ -$ -$ 931$ 26,4872,213HAWAII (Totals)116,947$
754,680$ 337,919$ 1,690$ 142,729$ -$ 16,013$
13,109$ 243,22023,825CONG. DIST (01)61,532$ 414,681$
173,760$ 1,690$ 98,484$ -$ 16,013$ 8,373$
116,36111,738CONG. DIST (02)55,414$ 339,999$ 164,159$
-$ 44,245$ -$ -$ 4,736$ 126,85912,087HAWAII
(Totals)116,947$ 754,680$ 337,919$ 1,690$ 142,729$ -$
16,013$ 13,109$ 243,22023,825Notes:* Veteran population
estimates, as of September 30, 2013, are produced by the VA
Office of the Actuary (VetPop 2011).# Prior to FY 08, "Loan
Guaranty" expenditures were included in the Education &
Vocational Rehabilitation and Employment (E&VRE) programs.
Currently, all "Loan Guaranty" expenditures are attributed to
Travis County, TX, where all Loan Guaranty payments are
processed. VA will continue to improve data collection for
future GDX reports to better distribute loan expenditures at the
state, county and congressional district levels.** Unique
patients are patients who received treatment at a VA health care
facility. Data are provided by the Allocation Resource Center
(ARC).Expenditure data sources: USASpending.gov for
Compensation & Pension (C&P) and Education and Vocational
Rehabilitation and Employment (EVRE) Benefits; Veterans
Benefits Administration Insurance Center for the Insurance
costs; the VA Financial Management System (FMS) for
Construction, Medical Research, General Operating Expenses,
and certain C&P and Readjustment data; and the Allocation
Resource Center (ARC) for Medical Care costs.1. Expenditures
are rounded to the nearest thousand dollars. For example, $500
to $1,000 are rounded to $1; $0 to $499 are rounded to $0; and
"$ -" = 0 or no expenditures.2. The Compensation & Pension
expenditures include dollars for the following programs:
veterans' compensation for service-connected disabilities;
dependency and indemnity compensation for service-connected
deaths; veterans' pension for nonservice-connected disabilities;
and burial and other benefits to veterans and their survivors.3.
Medical Care expenditures include dollars for medical services,
medical administration, facility maintenance, educational
support, research support, and other overhead items. Medical
Care expenditures do not include dollars for construction or
other non-medical support.4. Medical Care expenditures are
based on where patients live instead of where care is
delivered.5. A star symbol (*) in the Unique Patients column
denotes that there were less than 10 Unique Patients.
&"Arial,Bold"&11FY13 GEOGRAPHIC DISTRIBUTION OF
VA EXPENDITURES (GDX)
&8&P of &N
IAFY13 Summary of Expenditures by StateExpenditures in
$000sCounty/ Congressional DistrictVeteran Population*Total
ExpenditureCompensation & PensionConstructionEducation &
Vocational Rehabilitation/ EmploymentLoan Guaranty#General
Operating ExpensesInsurance & IndemnitiesMedical
CareUnique Patients**ADAIR718$ 2,791$ 946$ -$ 137$
-$ -$ 20$ 1,688180ADAMS365$ 1,469$ 637$ -$ 37$
-$ -$ 58$ 737117ALLAMAKEE1,136$ 6,259$ 2,893$ -$
123$ -$ -$ 58$ 3,186446APPANOOSE987$ 7,045$
3,399$ -$ 145$ -$ -$ 30$ 3,470430AUDUBON560$
2,807$ 1,339$ -$ 177$ -$ -$ 84$
1,206172BENTON2,216$ 8,748$ 3,998$ -$ 372$ -$ -$
118$ 4,260662BLACK HAWK10,392$ 38,598$ 19,434$ -$
3,096$ -$ -$ 628$ 15,4402,442BOONE2,239$ 9,408$
4,120$ -$ 721$ -$ -$ 196$ 4,371581BREMER1,765$
6,829$ 3,640$ -$ 346$ -$ -$ 165$
2,678462BUCHANAN1,603$ 6,088$ 2,770$ -$ 340$ -$
-$ 99$ 2,881424BUENA VISTA1,273$ 5,092$ 2,621$ -$
353$ -$ -$ 109$ 2,010505BUTLER1,087$ 5,480$
2,722$ -$ 265$ -$ -$ 16$ 2,477394CALHOUN959$
4,625$ 1,732$ -$ 144$ -$ -$ 217$
2,533386CARROLL1,517$ 6,207$ 2,937$ -$ 263$ -$ -$
139$ 2,868624CASS1,188$ 6,023$ 3,032$ -$ 185$ -$ -
$ 84$ 2,722377CEDAR1,521$ 5,852$ 2,127$ -$ 300$ -
$ -$ 41$ 3,385448CERRO GORDO3,469$ 24,014$
11,878$ -$ 859$ -$ -$ 613$
10,6651,698CHEROKEE992$ 5,036$ 2,625$ -$ 65$ -$ -
$ 81$ 2,264394CHICKASAW938$ 4,435$ 1,996$ -$
161$ -$ -$ 113$ 2,164385CLARKE640$ 5,237$ 2,006$
-$ 132$ -$ -$ 17$ 3,081312CLAY1,302$ 6,645$
2,724$ -$ 245$ -$ -$ 106$ 3,571539CLAYTON1,592$
7,670$ 3,071$ -$ 242$ -$ -$ 217$
4,140564CLINTON4,405$ 19,934$ 8,623$ -$ 2,906$ -$
-$ 518$ 7,8861,311CRAWFORD1,288$ 6,200$ 2,806$ -$
111$ -$ -$ 32$ 3,251411DALLAS4,220$ 17,605$
6,719$ -$ 1,084$ -$ -$ 325$ 9,4771,054DAVIS617$
2,850$ 1,548$ -$ 133$ -$ -$ 7$
1,162191DECATUR597$ 3,735$ 1,574$ -$ 135$ -$ -$
6$ 2,020198DELAWARE1,245$ 4,614$ 2,186$ -$ 166$
-$ -$ 211$ 2,050384DES MOINES3,651$ 16,474$ 7,220$
-$ 686$ -$ -$ 384$ 8,184984DICKINSON1,380$ 7,690$
3,197$ -$ 177$ -$ -$ 246$ 4,069681DUBUQUE6,787$
34,085$ 17,139$ -$ 2,514$ -$ -$ 593$
13,8392,389EMMET793$ 4,943$ 1,822$ -$ 220$ -$ -$
78$ 2,824322FAYETTE1,442$ 9,420$ 3,184$ -$ 806$ -
$ -$ 109$ 5,321578FLOYD1,320$ 7,182$ 3,613$ -$
150$ -$ -$ 86$ 3,333547FRANKLIN812$ 3,688$ 1,608$
-$ 114$ -$ -$ 17$ 1,949323FREMONT760$ 3,647$
1,997$ -$ 150$ -$ -$ 98$ 1,402182GREENE729$
3,436$ 1,357$ -$ 124$ -$ -$ 209$
1,747239GRUNDY945$ 3,552$ 1,665$ -$ 138$ -$ -$
150$ 1,599275GUTHRIE988$ 5,509$ 2,420$ -$ 263$ -$
-$ 42$ 2,783333HAMILTON1,130$ 6,491$ 3,135$ -$
329$ -$ -$ 110$ 2,917488HANCOCK908$ 4,114$
2,325$ -$ 78$ -$ -$ 51$ 1,660389HARDIN1,569$
7,338$ 3,476$ -$ 353$ -$ -$ 113$
3,396531HARRISON1,308$ 6,762$ 3,540$ -$ 183$ -$ -
$ 108$ 2,930354HENRY1,406$ 9,357$ 3,981$ -$ 616$
-$ -$ 138$ 4,623495HOWARD693$ 4,265$ 1,957$ -$
122$ -$ -$ 88$ 2,099316HUMBOLDT799$ 3,666$
1,663$ -$ 78$ -$ -$ 58$ 1,867394IDA681$ 2,718$
1,586$ -$ 77$ -$ -$ 63$ 992207IOWA1,245$ 6,534$
2,507$ -$ 185$ -$ -$ 247$ 3,595377JACKSON1,826$
8,363$ 3,820$ -$ 359$ -$ -$ 189$
3,994597JASPER3,066$ 13,421$ 5,580$ -$ 524$ -$ -$
337$ 6,980799JEFFERSON1,121$ 6,227$ 2,506$ -$ 277$
-$ -$ 76$ 3,368387JOHNSON7,298$ 38,861$ 12,041$ -
$ 4,932$ -$ -$ 804$ 21,0831,826JONES2,050$ 9,182$
3,446$ -$ 253$ -$ -$ 65$ 5,418604KEOKUK861$
5,432$ 2,087$ -$ 211$ -$ -$ 50$
3,085370KOSSUTH1,305$ 5,590$ 2,473$ -$ 246$ -$ -$
51$ 2,820611LEE3,382$ 14,837$ 7,067$ 50$ 647$ -$ -
$ 116$ 6,957865LINN17,837$ 70,221$ 29,744$ -$
5,166$ -$ -$ 1,182$ 34,1284,603LOUISA827$ 4,045$
1,489$ -$ 107$ -$ -$ 35$ 2,414267LUCAS633$ 3,617$
1,397$ -$ 187$ -$ -$ 29$ 2,004260LYON628$ 4,014$
1,628$ -$ 139$ -$ -$ 78$ 2,169248MADISON1,083$
7,857$ 3,055$ -$ 285$ -$ -$ 71$
4,446386MAHASKA1,482$ 8,312$ 3,748$ -$ 463$ -$ -
$ 50$ 4,050501MARION2,709$ 20,286$ 8,634$ -$ 638$
-$ -$ 82$ 10,932938MARSHALL3,892$ 30,971$ 12,468$
-$ 572$ -$ -$ 288$ 17,6431,390MILLS1,306$ 9,012$
4,882$ -$ 645$ -$ -$ 137$ 3,348339MITCHELL852$
4,524$ 2,355$ -$ 173$ -$ -$ 91$
1,905386MONONA1,015$ 5,202$ 1,798$ -$ 148$ -$ -$
152$ 3,104259MONROE602$ 5,580$ 2,359$ -$ 221$ -$
-$ 38$ 2,963246MONTGOMERY882$ 5,929$ 2,635$ -$
205$ -$ -$ 92$ 2,997282MUSCATINE3,112$ 13,265$
5,284$ -$ 623$ -$ -$ 193$ 7,164748O'BRIEN1,040$
5,912$ 2,483$ -$ 229$ -$ -$ 109$
3,091433OSCEOLA534$ 1,933$ 728$ -$ 53$ -$ -$ 66$
1,085192PAGE1,429$ 7,062$ 3,073$ -$ 175$ -$ -$
67$ 3,746418PALO ALTO783$ 4,778$ 2,521$ -$ 200$ -
$ -$ 9$ 2,047361PLYMOUTH2,102$ 7,196$ 2,541$ -$
362$ -$ -$ 111$ 4,183637POCAHONTAS804$ 3,252$
1,540$ -$ 107$ -$ -$ 62$ 1,542314POLK28,021$
200,078$ 68,696$ 29$ 14,238$ -$ 10,585$ 2,296$
104,2338,701POTTAWATTAMIE7,897$ 50,405$ 22,797$ -
$ 2,631$ -$ -$ 621$ 24,3572,280POWESHIEK1,417$
6,119$ 2,431$ -$ 204$ -$ -$ 203$
3,281385RINGGOLD459$ 1,810$ 923$ -$ 32$ -$ -$
28$ 827134SAC967$ 4,378$ 2,547$ -$ 80$ -$ -$ 93$
1,659395SCOTT14,535$ 59,317$ 26,831$ -$ 6,684$ -$
-$ 981$ 24,8213,400SHELBY1,129$ 5,454$ 2,518$ -$
113$ -$ -$ 108$ 2,715354SIOUX1,578$ 6,707$ 3,054$
-$ 290$ -$ -$ 153$ 3,211627STORY5,521$ 19,419$
8,444$ -$ 3,077$ -$ -$ 480$ 7,4181,035TAMA1,449$
6,933$ 2,988$ -$ 236$ -$ -$ 69$
3,640483TAYLOR609$ 2,724$ 1,250$ -$ 54$ -$ -$
48$ 1,372166UNION1,053$ 5,964$ 2,392$ -$ 194$ -$
-$ 35$ 3,343358VAN BUREN646$ 3,747$ 1,580$ -$
110$ -$ -$ 41$ 2,016231WAPELLO3,173$ 15,664$
6,340$ -$ 731$ -$ -$ 122$ 8,471959WARREN3,600$
21,076$ 8,868$ -$ 1,754$ -$ -$ 146$
10,3081,178WASHINGTON1,462$ 9,318$ 3,846$ -$ 351$
-$ -$ 333$ 4,788526WAYNE537$ 2,621$ 1,229$ -$
74$ -$ -$ 3$ 1,314155WEBSTER3,225$ 14,301$ 6,650$
-$ 891$ -$ -$ 230$ 6,5311,349WINNEBAGO819$
4,841$ 2,496$ -$ 242$ -$ -$ 69$
2,034328WINNESHIEK1,239$ 5,087$ 2,534$ -$ 386$ -$
-$ 147$ 2,020384WOODBURY8,148$ 31,663$ 14,208$ -
$ 2,704$ -$ -$ 593$ 14,1572,320WORTH674$ 3,867$
1,907$ -$ 88$ -$ -$ 65$ 1,807268WRIGHT1,015$
4,349$ 2,196$ -$ 160$ -$ -$ 102$ 1,890413IOWA
(Totals)233,815$ 1,192,889$ 505,601$ 79$ 74,079$ -$
10,585$ 18,891$ 583,65372,191CONG. DIST (01)61,352$
278,356$ 124,458$ -$ 15,749$ -$ -$ 4,838$
133,31018,141CONG. DIST (02)59,272$ 295,057$ 122,509$
50$ 21,834$ -$ -$ 4,427$ 146,23616,849CONG. DIST
(03)54,576$ 348,964$ 134,325$ 29$ 22,070$ -$ 10,585$
4,164$ 177,79016,486CONG. DIST (04)58,614$ 270,513$
124,309$ -$ 14,426$ -$ -$ 5,461$ 126,31720,715IOWA
(Totals)233,815$ 1,192,889$ 505,601$ 79$ 74,079$ -$
10,585$ 18,891$ 583,65372,191Notes:* Veteran population
estimates, as of September 30, 2013, are produced by the VA
Office of the Actuary (VetPop 2011).# Prior to FY 08, "Loan
Guaranty" expenditures were included in the Education &
Vocational Rehabilitation and Employment (E&VRE) programs.
Currently, all "Loan Guaranty" expenditures are attributed to
Travis County, TX, where all Loan Guaranty payments are
processed. VA will continue to improve data collection for
future GDX reports to better distribute loan expenditures at the
state, county and congressional district levels.** Unique
patients are patients who received treatment at a VA health care
facility. Data are provided by the Allocation Resource Center
(ARC).Expenditure data sources: USASpending.gov for
Compensation & Pension (C&P) and Education and Vocational
Rehabilitation and Employment (EVRE) Benefits; Veterans
Benefits Administration Insurance Center for the Insurance
costs; the VA Financial Management System (FMS) for
Construction, Medical Research, General Operating Expenses,
and certain C&P and Readjustment data; and the Allocation
Resource Center (ARC) for Medical Care costs.1. Expenditures
are rounded to the nearest thousand dollars. For example, $500
to $1,000 are rounded to $1; $0 to $499 are rounded to $0; and
"$ -" = 0 or no expenditures.2. The Compensation & Pension
expenditures include dollars for the following programs:
veterans' compensation for service-connected disabilities;
dependency and indemnity compensation for service-connected
deaths; veterans' pension for nonservice-connected disabilities;
and burial and other benefits to veterans and their survivors.3.
Medical Care expenditures include dollars for medical services,
medical administration, facility maintenance, educational
support, research support, and other overhead items. Medical
Care expenditures do not include dollars for construction or
other non-medical support.4. Medical Care expenditures are
based on where patients live instead of where care is
delivered.5. A star symbol (*) in the Unique Patients column
denotes that there were less than 10 Unique Patients.
&"Arial,Bold"&11FY13 GEOGRAPHIC DISTRIBUTION OF
VA EXPENDITURES (GDX)
&8&P of &N
IDFY13 Summary of Expenditures by StateExpenditures in
$000sCounty/ Congressional DistrictVeteran Population*Total
ExpenditureCompensation & PensionConstructionEducation &
Vocational Rehabilitation/ EmploymentLoan Guaranty#General
Operating ExpensesInsurance & IndemnitiesMedical
CareUnique Patients**ADA34,225$ 240,887$ 89,032$
11,690$ 19,260$ -$ 7,807$ 2,681$
110,41810,890ADAMS474$ 3,092$ 1,394$ -$ 59$ -$ -$
2$ 1,636176BANNOCK6,361$ 34,073$ 16,320$ -$
3,375$ -$ -$ 550$ 13,8281,878BEAR LAKE542$ 2,071$
909$ -$ 33$ -$ -$ 11$ 1,118114BENEWAH1,067$
5,354$ 3,135$ -$ 142$ -$ -$ 71$
2,006304BINGHAM2,991$ 11,816$ 6,012$ -$ 772$ -$ -
$ 74$ 4,958756BLAINE1,419$ 2,466$ 1,281$ -$ 120$
-$ -$ 131$ 934196BOISE828$ 5,283$ 2,201$ -$ 50$ -
$ -$ 4$ 3,027354BONNER4,839$ 23,543$ 11,802$ -$
677$ -$ -$ 296$ 10,7681,514BONNEVILLE7,603$
28,996$ 14,704$ -$ 2,203$ -$ -$ 465$
11,6241,602BOUNDARY1,180$ 6,435$ 4,037$ -$ 104$ -
$ -$ 21$ 2,272388BUTTE260$ 1,061$ 537$ -$ 15$ -$
-$ 16$ 49470CAMAS118$ 495$ 248$ -$ 10$ -$ -$
2$ 23521CANYON14,571$ 87,168$ 36,103$ -$ 6,801$ -
$ -$ 919$ 43,3464,923CARIBOU644$ 1,823$ 929$ -$
50$ -$ -$ 5$ 839114CASSIA1,333$ 5,551$ 2,443$ -$
206$ -$ -$ 240$ 2,661370CLARK74$ 148$ 81$ -$ 5$
-$ -$ 1$ 6210CLEARWATER1,141$ 7,315$ 3,865$ -$
70$ -$ -$ 9$ 3,371430CUSTER505$ 2,067$ 940$ -$
15$ -$ -$ 59$ 1,053148ELMORE8,898$ 32,308$
18,900$ -$ 3,752$ -$ -$ 250$
9,4051,226FRANKLIN691$ 2,339$ 1,150$ -$ 191$ -$ -
$ 19$ 979144FREMONT1,152$ 3,118$ 1,549$ -$ 112$
-$ -$ 16$ 1,441235GEM1,604$ 12,822$ 4,862$ -$
467$ -$ -$ 102$ 7,391698GOODING1,230$ 4,488$
2,151$ -$ 188$ -$ -$ 14$ 2,135302IDAHO1,780$
9,734$ 4,446$ -$ 162$ -$ -$ 11$
5,115656JEFFERSON1,295$ 7,038$ 3,721$ -$ 444$ -$ -
$ 69$ 2,804370JEROME1,605$ 5,477$ 2,610$ -$ 235$
-$ -$ 56$ 2,576363KOOTENAI14,304$ 80,543$ 43,123$
-$ 4,170$ -$ -$ 512$ 32,7384,370LATAH2,891$
11,756$ 5,020$ -$ 2,687$ -$ -$ 133$
3,916503LEMHI907$ 6,143$ 3,151$ -$ 38$ -$ -$ 69$
2,885409LEWIS474$ 4,653$ 3,016$ -$ 94$ -$ -$ 39$
1,504179LINCOLN316$ 1,174$ 424$ -$ 49$ -$ -$ 12$
688115MADISON975$ 4,407$ 2,013$ -$ 765$ -$ -$
29$ 1,599196MINIDOKA1,244$ 4,915$ 2,341$ -$ 190$
-$ -$ 98$ 2,285381NEZ PERCE4,117$ 22,814$ 11,107$
-$ 1,267$ -$ -$ 433$ 10,0071,366ONEIDA313$ 1,441$
720$ -$ 22$ -$ -$ 12$ 688113OWYHEE891$ 5,326$
1,959$ -$ 184$ -$ -$ 11$ 3,172330PAYETTE2,337$
11,718$ 4,205$ -$ 460$ -$ -$ 130$
6,923715POWER660$ 1,620$ 847$ -$ 101$ -$ -$ 12$
660135SHOSHONE1,766$ 7,550$ 4,234$ -$ 93$ -$ -$
17$ 3,206455TETON370$ 1,184$ 621$ -$ 63$ -$ -$
73$ 42778TWIN FALLS6,282$ 23,845$ 11,713$ -$
1,527$ -$ -$ 291$ 10,3151,697VALLEY903$ 4,744$
2,176$ -$ 97$ -$ -$ 24$ 2,447282WASHINGTON926$
5,218$ 2,471$ -$ 187$ -$ -$ 18$ 2,541352IDAHO
(Totals)138,108$ 746,018$ 334,504$ 11,690$ 51,513$ -$
7,807$ 8,006$ 332,49939,928CONG. DIST (01)71,240$
396,723$ 182,128$ -$ 24,905$ -$ -$ 3,794$
185,89622,799CONG. DIST (02)66,869$ 349,295$ 152,376$
11,690$ 26,608$ -$ 7,807$ 4,211$ 146,60317,129IDAHO
(Totals)138,108$ 746,018$ 334,504$ 11,690$ 51,513$ -$
7,807$ 8,006$ 332,49939,928Notes:* Veteran population
estimates, as of September 30, 2013, are produced by the VA
Office of the Actuary (VetPop 2011).# Prior to FY 08, "Loan
Guaranty" expenditures were included in the Education &
Vocational Rehabilitation and Employment (E&VRE) programs.
Currently, all "Loan Guaranty" expenditures are attributed to
Travis County, TX, where all Loan Guaranty payments are
processed. VA will continue to improve data collection for
future GDX reports to better distribute loan expenditures at the
state, county and congressional district levels.** Unique
patients are patients who received treatment at a VA health care
facility. Data are provided by the Allocation Resource Center
(ARC).Expenditure data sources: USASpending.gov for
Compensation & Pension (C&P) and Education and Vocational
Rehabilitation and Employment (EVRE) Benefits; Veterans
Benefits Administration Insurance Center for the Insurance
costs; the VA Financial Management System (FMS) for
Construction, Medical Research, General Operating Expenses,
and certain C&P and Readjustment data; and the Allocation
Resource Center (ARC) for Medical Care costs.1. Expenditures
are rounded to the nearest thousand dollars. For example, $500
to $1,000 are rounded to $1; $0 to $499 are rounded to $0; and
"$ -" = 0 or no expenditures.2. The Compensation & Pension
expenditures include dollars for the following programs:
veterans' compensation for service-connected disabilities;
dependency and indemnity compensation for service-connected
deaths; veterans' pension for nonservice-connected disabilities;
and burial and other benefits to veterans and their survivors.3.
Medical Care expenditures include dollars for medical services,
medical administration, facility maintenance, educational
support, research support, and other overhead items. Medical
Care expenditures do not include dollars for construction or
other non-medical support.4. Medical Care expenditures are
based on where patients live instead of where care is
delivered.5. A star symbol (*) in the Unique Patients column
denotes that there were less than 10 Unique Patients.
&"Arial,Bold"&11FY13 GEOGRAPHIC DISTRIBUTION OF
VA EXPENDITURES (GDX)
&8&P of &N
ILFY13 Summary of Expenditures by StateExpenditures in
$000sCounty/ Congressional DistrictVeteran Population*Total
ExpenditureCompensation & PensionConstructionEducation &
Vocational Rehabilitation/ EmploymentLoan Guaranty#General
Operating ExpensesInsurance & IndemnitiesMedical
CareUnique Patients**ADAMS6,722$ 26,232$ 14,471$ -$
1,625$ -$ -$ 424$ 9,7121,663ALEXANDER764$ 7,040$
2,958$ -$ 117$ -$ -$ 12$ 3,954297BOND1,417$
5,198$ 2,725$ -$ 372$ -$ -$ 28$
2,073264BOONE3,776$ 11,515$ 4,709$ -$ 906$ -$ -$
255$ 5,646756BROWN455$ 1,548$ 721$ -$ 69$ -$ -$
1$ 75898BUREAU2,840$ 10,768$ 4,817$ -$ 517$ -$ -
$ 303$ 5,130868CALHOUN489$ 1,615$ 960$ -$ 107$
-$ -$ 28$ 520104CARROLL1,475$ 5,691$ 2,413$ -$
192$ -$ -$ 18$ 3,068494CASS1,075$ 4,620$ 2,897$ -$
183$ -$ -$ 43$ 1,497235CHAMPAIGN11,184$ 51,438$
22,156$ -$ 5,795$ -$ -$ 883$
22,6042,212CHRISTIAN3,002$ 11,376$ 6,812$ -$ 551$ -
$ -$ 68$ 3,944662CLARK1,506$ 7,510$ 3,572$ -$
197$ -$ -$ 136$ 3,605437CLAY1,119$ 6,704$ 2,569$
-$ 194$ -$ -$ 35$ 3,907447CLINTON3,505$ 14,393$
8,479$ -$ 1,179$ -$ -$ 179$ 4,556624COLES3,845$
19,053$ 9,184$ -$ 1,468$ -$ -$ 440$
7,9601,085COOK209,280$ 1,362,173$ 395,425$ 13,292$
110,402$ -$ 42,547$ 22,137$
778,37155,901CRAWFORD1,705$ 11,003$ 4,131$ -$
173$ -$ -$ 32$ 6,666457CUMBERLAND881$ 4,556$
1,906$ -$ 79$ -$ -$ 77$ 2,494323DEKALB7,017$
24,304$ 11,211$ -$ 4,147$ -$ -$ 666$
8,2811,076DEWITT1,576$ 5,600$ 2,591$ -$ 223$ -$ -$
33$ 2,753363DOUGLAS1,453$ 5,812$ 2,896$ -$ 402$ -
$ -$ 220$ 2,295367DU PAGE41,899$ 180,502$ 65,707$
-$ 33,526$ -$ -$ 5,077$ 76,1927,773EDGAR1,498$
9,208$ 4,077$ -$ 250$ -$ -$ 74$
4,806430EDWARDS599$ 2,640$ 1,206$ -$ 97$ -$ -$
23$ 1,315174EFFINGHAM2,507$ 12,362$ 5,423$ -$
878$ -$ -$ 270$ 5,7911,008FAYETTE1,794$ 6,749$
3,083$ -$ 198$ -$ -$ 73$ 3,396462FORD1,227$
4,977$ 2,324$ -$ 233$ -$ -$ 154$
2,267240FRANKLIN3,748$ 37,712$ 15,169$ -$ 679$ -$
-$ 222$ 21,6431,721FULTON3,284$ 11,011$ 5,950$ -$
560$ -$ -$ 134$ 4,366741GALLATIN560$ 3,876$
1,659$ -$ 32$ -$ -$ 42$ 2,143218GREENE1,330$
5,062$ 3,127$ -$ 245$ -$ -$ 28$
1,661240GRUNDY3,679$ 12,651$ 6,141$ -$ 1,147$ -$
-$ 88$ 5,274621HAMILTON636$ 4,690$ 2,547$ -$ 60$
-$ -$ 12$ 2,071249HANCOCK1,590$ 7,809$ 3,606$ -$
296$ -$ -$ 542$ 3,366487HARDIN368$ 2,208$ 1,040$
-$ 11$ -$ -$ -$ 1,158159HENDERSON813$ 3,609$
1,288$ -$ 56$ -$ -$ 104$ 2,161232HENRY4,369$
15,983$ 7,823$ -$ 852$ -$ -$ 377$
6,9321,074IROQUOIS2,248$ 11,163$ 4,747$ -$ 320$ -$
-$ 108$ 5,988693JACKSON4,453$ 33,224$ 11,994$ -$
3,802$ -$ -$ 146$ 17,2821,522JASPER788$ 2,714$
1,373$ -$ 78$ -$ -$ 23$ 1,240254JEFFERSON3,465$
21,218$ 9,357$ -$ 528$ -$ -$ 195$
11,1381,141JERSEY2,262$ 7,987$ 3,763$ -$ 469$ -$ -$
195$ 3,559416JO DAVIESS2,180$ 7,433$ 2,994$ -$
306$ -$ -$ 172$ 3,961663JOHNSON1,104$ 10,598$
4,103$ -$ 311$ -$ -$ 35$ 6,148523KANE25,274$
76,942$ 31,057$ -$ 8,802$ -$ -$ 2,205$
34,8774,289KANKAKEE8,306$ 37,845$ 16,184$ -$
2,232$ -$ -$ 561$ 18,8672,223KENDALL7,367$ 22,626$
9,728$ -$ 2,600$ -$ -$ 640$ 9,659979KNOX4,526$
19,289$ 8,447$ -$ 751$ -$ -$ 454$
9,6371,351LAKE37,189$ 280,288$ 76,880$ 4,210$
18,476$ -$ 2,564$ 4,486$ 173,67210,080LA SALLE9,216$
38,745$ 19,108$ -$ 1,448$ -$ -$ 502$
17,6872,386LAWRENCE1,339$ 5,680$ 2,642$ -$ 251$ -
$ -$ 100$ 2,688383LEE2,739$ 10,405$ 4,583$ -$ 694$
-$ -$ 148$ 4,980806LIVINGSTON2,792$ 9,819$ 5,040$
-$ 333$ -$ -$ 268$ 4,177671LOGAN2,316$ 6,957$
3,915$ -$ 387$ -$ -$ 92$
2,562442MCDONOUGH2,540$ 12,772$ 5,547$ -$ 1,608$
-$ -$ 132$ 5,484875MCHENRY19,843$ 80,767$ 31,581$
-$ 6,229$ -$ -$ 1,602$ 41,3563,915MCLEAN10,772$
38,838$ 19,764$ -$ 4,376$ -$ -$ 1,048$
13,6501,949MACON9,261$ 37,912$ 18,840$ -$ 1,894$ -
$ -$ 453$ 16,7242,513MACOUPIN4,562$ 19,739$
10,769$ -$ 981$ -$ -$ 340$ 7,649915MADISON25,776$
102,819$ 51,428$ -$ 9,584$ -$ -$ 1,908$
39,8984,169MARION3,390$ 23,637$ 11,296$ -$ 679$ -$
-$ 388$ 11,2741,122MARSHALL1,118$ 4,248$ 2,229$ -
$ 320$ -$ -$ 226$ 1,473268MASON1,456$ 6,010$
2,926$ -$ 202$ -$ -$ 212$ 2,670353MASSAC1,207$
9,046$ 3,701$ -$ 336$ -$ -$ 27$
4,981509MENARD1,011$ 3,790$ 2,241$ -$ 251$ -$ -$
58$ 1,240236MERCER1,426$ 7,971$ 3,260$ -$ 284$ -$
-$ 77$ 4,350441MONROE2,908$ 10,968$ 5,540$ -$
992$ -$ -$ 293$ 4,143492MONTGOMERY2,598$
10,005$ 5,572$ -$ 574$ -$ -$ 229$
3,631538MORGAN3,077$ 11,203$ 6,849$ -$ 942$ -$ -$
133$ 3,278668MOULTRIE1,144$ 5,206$ 2,787$ -$ 301$
-$ -$ 148$ 1,970304OGLE4,505$ 15,784$ 7,167$ -$
985$ -$ -$ 270$ 7,3631,047PEORIA14,273$ 49,770$
22,231$ -$ 3,541$ -$ -$ 803$
23,1953,081PERRY1,586$ 10,361$ 4,734$ -$ 302$ -$ -
$ 76$ 5,250580PIATT1,457$ 3,783$ 1,894$ -$ 104$ -$
-$ 146$ 1,640288PIKE1,404$ 6,363$ 3,148$ -$ 337$ -
$ -$ 86$ 2,791366POPE426$ 2,885$ 1,301$ -$ 73$ -$
-$ 5$ 1,506131PULASKI562$ 6,218$ 2,469$ -$ 41$ -$
250$ 25$ 3,433281PUTNAM576$ 1,936$ 925$ -$ 47$
-$ -$ 42$ 922172RANDOLPH2,934$ 12,038$ 7,091$ -$
507$ -$ -$ 85$ 4,355659RICHLAND1,323$ 6,773$
2,711$ -$ 368$ -$ -$ 79$ 3,615427ROCK
ISLAND12,265$ 51,967$ 23,116$ -$ 3,089$ -$ 2,865$
1,158$ 21,7402,803SAINT CLAIR29,935$ 175,069$
94,200$ -$ 28,486$ -$ -$ 2,518$
49,8655,310SALINE2,330$ 19,551$ 7,229$ -$ 355$ -$ -
$ 224$ 11,743960SANGAMON16,656$ 57,076$ 29,149$
712$ 5,043$ -$ 1,334$ 1,518$
19,3212,960SCHUYLER618$ 3,327$ 2,022$ -$ 54$ -$ -
$ 109$ 1,141205SCOTT444$ 1,772$ 952$ -$ 91$ -$ -
$ 34$ 695119SHELBY2,210$ 7,188$ 3,431$ -$ 277$ -
$ -$ 219$ 3,261533STARK502$ 1,845$ 645$ -$ 52$ -
$ -$ 50$ 1,098150STEPHENSON3,796$ 19,558$ 7,852$
-$ 730$ -$ -$ 273$ 10,7031,474TAZEWELL12,404$
38,859$ 19,066$ -$ 3,210$ -$ -$ 859$
15,7242,367UNION1,618$ 14,084$ 4,866$ -$ 332$ -$ -
$ 90$ 8,797655VERMILION6,279$ 85,608$ 19,215$
344$ 1,761$ -$ 2,276$ 277$
61,7362,826WABASH1,174$ 4,047$ 2,050$ -$ 162$ -$
-$ 84$ 1,752314WARREN1,327$ 6,844$ 2,797$ -$ 259$
-$ -$ 97$ 3,691446WASHINGTON1,322$ 5,850$ 2,452$
-$ 392$ -$ -$ 271$ 2,734308WAYNE1,251$ 6,899$
3,039$ -$ 132$ -$ -$ 36$ 3,692471WHITE1,399$
9,378$ 3,961$ -$ 120$ -$ -$ 104$
5,193474WHITESIDE5,074$ 20,207$ 8,488$ -$ 1,204$ -
$ -$ 161$ 10,3541,693WILL40,017$ 144,065$ 63,193$
-$ 12,463$ -$ -$ 2,378$
66,0327,406WILLIAMSON5,765$ 62,581$ 19,683$ -$
1,795$ -$ -$ 326$ 40,7772,796WINNEBAGO21,383$
86,773$ 37,263$ -$ 4,970$ -$ -$ 1,754$
42,7855,861WOODFORD3,258$ 9,196$ 3,884$ -$ 684$ -
$ -$ 142$ 4,486570ILLINOIS (Totals)744,710$
3,854,717$ 1,450,236$ 18,558$ 311,330$ -$ 51,835$
65,139$ 1,957,618180,384CONG. DIST (01)39,777$
268,743$ 85,178$ -$ 23,289$ -$ -$ 2,797$
157,47911,714CONG. DIST (02)45,718$ 255,343$ 86,342$
-$ 21,086$ -$ -$ 2,719$ 145,19612,369CONG. DIST
(03)32,941$ 152,600$ 49,431$ -$ 13,115$ -$ -$ 3,144$
86,9108,074CONG. DIST (04)14,561$ 97,520$ 30,190$ -$
8,429$ -$ -$ 1,225$ 57,6763,991CONG. DIST (05)24,552$
118,419$ 37,137$ -$ 11,619$ -$ -$ 2,649$
67,0145,038CONG. DIST (06)35,414$ 112,260$ 40,247$ -$
15,867$ -$ -$ 4,110$ 52,0365,901CONG. DIST
(07)25,133$ 386,611$ 96,017$ 13,292$ 26,808$ -$
42,547$ 2,463$ 205,4859,357CONG. DIST (08)29,456$
120,813$ 42,326$ -$ 17,243$ -$ -$ 2,993$
58,2525,999CONG. DIST (09)29,222$ 114,943$ 34,241$ -$
9,560$ -$ -$ 5,444$ 65,6986,096CONG. DIST (10)35,192$
261,743$ 72,021$ 4,210$ 17,563$ -$ 2,564$ 4,936$
160,4509,611CONG. DIST (11)34,665$ 135,796$ 56,174$ -
$ 16,165$ -$ -$ 2,720$ 60,7376,566CONG. DIST
(12)68,247$ 446,392$ 206,250$ -$ 42,836$ -$ 250$
4,633$ 192,42317,626CONG. DIST (13)55,161$ 217,196$
110,240$ -$ 16,745$ -$ -$ 3,898$ 86,31211,075CONG.
DIST (14)43,344$ 161,183$ 60,945$ -$ 14,791$ -$ -$
4,078$ 81,3697,890CONG. DIST (15)59,146$ 357,104$
142,468$ 344$ 14,816$ -$ 2,276$ 4,423$
192,77717,726CONG. DIST (16)54,746$ 202,285$ 91,905$
-$ 12,888$ -$ -$ 3,927$ 93,56513,200CONG. DIST
(17)57,037$ 248,602$ 110,259$ -$ 13,688$ -$ 2,865$
3,887$ 117,90215,739CONG. DIST (18)60,401$ 197,164$
98,865$ 712$ 14,823$ -$ 1,334$ 5,094$
76,33612,412ILLINOIS (Totals)744,710$ 3,854,717$
1,450,236$ 18,558$ 311,330$ -$ 51,835$ 65,139$
1,957,618180,384Notes:* Veteran population estimates, as of
September 30, 2013, are produced by the VA Office of the
Actuary (VetPop 2011).# Prior to FY 08, "Loan Guaranty"
expenditures were included in the Education & Vocational
Rehabilitation and Employment (E&VRE) programs.
Currently, all "Loan Guaranty" expenditures are attributed to
Travis County, TX, where all Loan Guaranty payments are
processed. VA will continue to improve data collection for
future GDX reports to better distribute loan expenditures at the
state, county and congressional district levels.** Unique
patients are patients who received treatment at a VA health care
facility. Data are provided by the Allocation Resource Center
(ARC).Expenditure data sources: USASpending.gov for
Compensation & Pension (C&P) and Education and Vocational
Rehabilitation and Employment (EVRE) Benefits; Veterans
Benefits Administration Insurance Center for the Insurance
costs; the VA Financial Management System (FMS) for
Construction, Medical Research, General Operating Expenses,
and certain C&P and Readjustment data; and the Allocation
Resource Center (ARC) for Medical Care costs.1. Expenditures
are rounded to the nearest thousand dollars. For example, $500
to $1,000 are rounded to $1; $0 to $499 are rounded to $0; and
"$ -" = 0 or no expenditures.2. The Compensation & Pension
expenditures include dollars for the following programs:
veterans' compensation for service-connected disabilities;
dependency and indemnity compensation for service-connected
deaths; veterans' pension for nonservice-connected disabilities;
and burial and other benefits to veterans and their survivors.3.
Medical Care expenditures include dollars for medical services,
medical administration, facility maintenance, educational
support, research support, and other overhead items. Medical
Care expenditures do not include dollars for construction or
other non-medical support.4. Medical Care expenditures are
based on where patients live instead of where care is
delivered.5. A star symbol (*) in the Unique Patients column
denotes that there were less than 10 Unique Patients.
&"Arial,Bold"&11FY13 GEOGRAPHIC DISTRIBUTION OF
VA EXPENDITURES (GDX)
&8&P of &N
INFY13 Summary of Expenditures by StateExpenditures in
$000sCounty/ Congressional DistrictVeteran Population*Total
ExpenditureCompensation & PensionConstructionEducation &
Vocational Rehabilitation/ EmploymentLoan Guaranty#General
Operating ExpensesInsurance & IndemnitiesMedical
CareUnique Patients**ADAMS1,901$ 6,299$ 2,808$ -$
382$ -$ -$ 102$ 3,007456ALLEN24,328$ 130,290$
51,576$ -$ 10,255$ -$ 713$ 1,558$
66,1897,031BARTHOLOMEW5,795$ 22,152$ 11,403$ -$
1,631$ -$ -$ 289$ 8,8291,179BENTON690$ 3,485$
930$ -$ 144$ -$ -$ 16$ 2,394177BLACKFORD1,135$
6,995$ 3,390$ -$ 259$ -$ -$ 37$
3,309418BOONE3,808$ 14,847$ 7,107$ -$ 1,391$ -$ -$
189$ 6,160718BROWN1,507$ 6,389$ 2,378$ -$ 176$ -$
-$ 64$ 3,771467CARROLL2,017$ 6,281$ 2,483$ -$
296$ -$ -$ 195$ 3,306402CASS3,508$ 15,368$ 7,948$
-$ 500$ -$ -$ 105$ 6,815862CLARK9,281$ 56,540$
23,699$ -$ 3,420$ -$ -$ 911$ 28,5112,913CLAY2,401$
12,327$ 5,962$ -$ 813$ -$ -$ 39$
5,512711CLINTON2,670$ 10,125$ 4,990$ -$ 325$ -$ -$
101$ 4,709469CRAWFORD925$ 6,080$ 2,451$ -$ 272$
-$ -$ 36$ 3,321311DAVIESS2,031$ 9,606$ 5,546$ -$
359$ -$ -$ 52$ 3,648561DEARBORN4,396$ 20,305$
8,039$ -$ 1,635$ -$ -$ 133$
10,4971,312DECATUR1,892$ 8,432$ 3,651$ -$ 272$ -$
-$ 28$ 4,481481DE KALB2,840$ 16,182$ 8,217$ -$
599$ -$ -$ 98$ 7,268937DELAWARE9,027$ 43,233$
21,125$ -$ 2,753$ -$ -$ 332$
19,0232,565DUBOIS3,011$ 9,584$ 5,093$ -$ 434$ -$ -
$ 100$ 3,957758ELKHART11,446$ 44,720$ 22,629$ -$
2,296$ -$ -$ 641$ 19,1543,410FAYETTE2,115$ 10,749$
4,586$ -$ 374$ -$ -$ 263$ 5,525601FLOYD6,925$
32,172$ 14,268$ -$ 1,795$ -$ 590$ 446$
15,0741,821FOUNTAIN1,389$ 8,750$ 2,991$ -$ 233$ -$
-$ 55$ 5,472430FRANKLIN1,539$ 6,971$ 2,742$ -$
250$ -$ -$ 43$ 3,936478FULTON1,662$ 7,957$ 3,415$
-$ 225$ -$ -$ 116$ 4,200549GIBSON2,506$ 10,097$
5,466$ -$ 455$ -$ -$ 227$ 3,948747GRANT5,782$
101,986$ 27,324$ 7,405$ 2,633$ -$ 2,277$ 253$
62,0942,854GREENE3,398$ 16,201$ 8,804$ -$ 826$ -$
-$ 158$ 6,413851HAMILTON17,453$ 61,815$ 31,640$ -
$ 7,195$ -$ -$ 1,929$ 21,0512,630HANCOCK6,186$
32,514$ 18,912$ -$ 2,286$ -$ -$ 289$
11,0261,262HARRISON3,208$ 18,359$ 8,782$ -$ 807$ -
$ -$ 95$ 8,6751,068HENDRICKS13,167$ 53,252$
24,895$ -$ 3,600$ -$ -$ 801$
23,9562,585HENRY4,096$ 18,556$ 9,583$ -$ 618$ -$ -
$ 101$ 8,255899HOWARD7,759$ 36,720$ 21,372$ -$
2,483$ -$ -$ 351$ 12,5141,788HUNTINGTON2,767$
16,284$ 8,372$ -$ 819$ -$ -$ 153$
6,941920JACKSON2,974$ 12,885$ 6,414$ -$ 587$ -$ -
$ 93$ 5,791747JASPER2,618$ 9,646$ 4,642$ -$ 608$
-$ -$ 180$ 4,215546JAY1,785$ 7,639$ 3,155$ -$ 194$
-$ -$ 20$ 4,270518JEFFERSON2,703$ 13,271$ 6,404$ -
$ 372$ -$ -$ 57$ 6,437768JENNINGS2,211$ 10,786$
5,219$ -$ 243$ -$ -$ 88$ 5,236556JOHNSON11,997$
57,539$ 27,536$ -$ 5,571$ -$ -$ 652$
23,7802,586KNOX3,009$ 15,864$ 8,603$ -$ 636$ -$ -$
268$ 6,356930KOSCIUSKO5,200$ 22,203$ 9,594$ -$
975$ -$ -$ 732$ 10,9011,417LAGRANGE1,749$ 7,358$
3,502$ -$ 187$ -$ -$ 118$ 3,551473LAKE33,598$
143,851$ 64,909$ -$ 8,397$ -$ -$ 1,827$
68,7198,006LA PORTE10,447$ 31,972$ 15,683$ -$ 1,811$
-$ -$ 650$ 13,8281,949LAWRENCE4,011$ 18,895$
10,242$ -$ 1,125$ -$ -$ 196$
7,3311,122MADISON11,373$ 51,884$ 28,014$ -$ 2,547$
-$ -$ 632$ 20,6902,708MARION65,183$ 483,322$
160,122$ 1,378$ 32,239$ -$ 45,352$ 3,883$
240,34918,263MARSHALL3,078$ 12,327$ 6,514$ -$ 564$
-$ -$ 86$ 5,164945MARTIN1,042$ 5,548$ 3,302$ -$
196$ -$ -$ 52$ 1,997288MIAMI3,563$ 24,729$ 13,622$
-$ 977$ -$ -$ 146$ 9,9841,481MONROE7,579$ 35,759$
17,098$ -$ 4,783$ -$ -$ 761$
13,1182,261MONTGOMERY3,075$ 12,422$ 4,800$ -$
395$ -$ -$ 122$ 7,105703MORGAN6,877$ 34,839$
17,332$ -$ 1,887$ -$ -$ 306$
15,3131,550NEWTON1,402$ 4,058$ 1,606$ -$ 163$ -$
-$ 42$ 2,247281NOBLE3,151$ 15,238$ 6,521$ -$ 685$
-$ -$ 186$ 7,846875OHIO574$ 3,007$ 1,024$ -$ 115$
-$ -$ 13$ 1,854189ORANGE1,682$ 6,768$ 3,117$ -$
433$ -$ -$ 73$ 3,144463OWEN2,232$ 10,702$ 5,379$
-$ 444$ -$ -$ 28$ 4,851583PARKE1,461$ 7,179$
3,119$ -$ 108$ -$ -$ 77$ 3,875452PERRY1,625$
6,096$ 2,960$ -$ 207$ -$ -$ 25$ 2,904421PIKE1,058$
3,749$ 2,129$ -$ 139$ -$ -$ 8$
1,473268PORTER14,002$ 41,958$ 20,577$ -$ 3,598$ -$
-$ 786$ 16,9972,311POSEY2,090$ 8,957$ 4,330$ -$
302$ -$ -$ 62$ 4,262559PULASKI1,054$ 4,607$ 2,188$
-$ 153$ -$ -$ 181$ 2,085282PUTNAM2,700$ 15,409$
7,831$ -$ 556$ -$ -$ 95$ 6,926723RANDOLPH1,862$
10,455$ 4,772$ -$ 313$ -$ -$ 16$
5,354645RIPLEY2,427$ 10,843$ 5,476$ -$ 527$ -$ -$
203$ 4,639617RUSH1,548$ 7,498$ 2,769$ -$ 249$ -$
-$ 79$ 4,402321ST. JOSEPH18,458$ 72,170$ 38,588$ -$
5,277$ -$ -$ 1,353$ 26,9515,563SCOTT1,985$ 11,915$
5,891$ -$ 341$ -$ -$ 16$ 5,666628SHELBY3,766$
16,447$ 6,710$ -$ 917$ -$ -$ 108$
8,713899SPENCER1,661$ 8,560$ 4,821$ -$ 403$ -$ -$
56$ 3,280468STARKE1,999$ 6,837$ 2,913$ -$ 253$ -$
-$ 103$ 3,568452STEUBEN2,490$ 13,252$ 6,595$ -$
621$ -$ -$ 34$ 6,003738SULLIVAN2,226$ 8,031$
4,463$ -$ 380$ -$ -$ 52$
3,135501SWITZERLAND740$ 3,854$ 1,472$ -$ 107$ -$
-$ 17$ 2,259225TIPPECANOE10,691$ 44,456$ 21,979$ -
$ 5,116$ -$ -$ 769$ 16,5912,116TIPTON1,351$ 5,004$
3,027$ -$ 284$ -$ -$ 31$ 1,662289UNION521$ 3,906$
1,432$ -$ 132$ -$ -$ 33$
2,309145VANDERBURGH13,283$ 68,454$ 32,685$ -$
3,596$ -$ -$ 989$ 31,1844,372VERMILLION1,518$
9,015$ 3,774$ -$ 261$ -$ -$ 43$ 4,937500VIGO8,482$
40,026$ 18,893$ -$ 2,919$ -$ -$ 236$
17,9782,617WABASH2,833$ 13,426$ 7,077$ -$ 348$ -$
-$ 157$ 5,844820WARREN663$ 3,374$ 1,125$ -$ 100$
-$ -$ 13$ 2,136219WARRICK5,119$ 21,072$ 11,600$ -
$ 917$ -$ -$ 347$ 8,2091,231WASHINGTON2,131$
12,819$ 4,946$ -$ 551$ -$ -$ 75$
7,247677WAYNE5,968$ 32,803$ 13,846$ -$ 940$ -$ -$
173$ 17,8441,846WELLS2,051$ 9,031$ 4,334$ -$ 439$
-$ -$ 57$ 4,201543WHITE2,095$ 9,372$ 5,508$ -$
375$ -$ -$ 182$ 3,307551WHITLEY2,847$ 13,055$
6,092$ -$ 657$ -$ -$ 44$ 6,263671INDIANA
(Totals)490,380$ 2,477,767$ 1,092,855$ 8,783$ 150,033$
-$ 48,931$ 27,941$ 1,149,224128,499CONG. DIST
(01)52,853$ 204,014$ 94,479$ -$ 13,034$ -$ -$ 2,874$
93,62811,278CONG. DIST (02)51,083$ 209,283$ 107,463$
-$ 11,256$ -$ -$ 3,353$ 87,21215,056CONG. DIST
(03)49,576$ 249,172$ 107,457$ -$ 15,463$ -$ 713$
2,939$ 122,60014,084CONG. DIST (04)58,583$ 251,097$
121,627$ -$ 16,287$ -$ -$ 3,209$ 109,97412,645CONG.
DIST (05)52,702$ 288,141$ 117,136$ 7,405$ 17,513$ -$
2,277$ 4,599$ 139,21012,105CONG. DIST (06)58,436$
280,975$ 131,735$ -$ 13,885$ -$ -$ 2,261$
133,09415,285CONG. DIST (07)51,586$ 429,889$ 140,217$
1,378$ 28,231$ -$ 45,352$ 2,299$ 212,41315,419CONG.
DIST (08)58,279$ 271,859$ 137,233$ -$ 13,430$ -$ -$
2,838$ 118,35816,860CONG. DIST (09)57,282$ 293,337$
135,509$ -$ 20,934$ -$ 590$ 3,569$
132,73515,767INDIANA (Totals)490,380$ 2,477,767$
1,092,855$ 8,783$ 150,033$ -$ 48,931$ 27,941$
1,149,224128,499Notes:* Veteran population estimates, as of
September 30, 2013, are produced by the VA Office of the
Actuary (VetPop 2011).# Prior to FY 08, "Loan Guaranty"
expenditures were included in the Education & Vocational
Rehabilitation and Employment (E&VRE) programs.
Currently, all "Loan Guaranty" expenditures are attributed to
Travis County, TX, where all Loan Guaranty payments are
processed. VA will continue to improve data collection for
future GDX reports to better distribute loan expenditures at the
state, county and congressional district levels.** Unique
patients are patients who received treatment at a VA health care
facility. Data are provided by the Allocation Resource Center
(ARC).Expenditure data sources: USASpending.gov for
Compensation & Pension (C&P) and Education and Vocational
Rehabilitation and Employment (EVRE) Benefits; Veterans
Benefits Administration Insurance Center for the Insurance
costs; the VA Financial Management System (FMS) for
Construction, Medical Research, General Operating Expenses,
and certain C&P and Readjustment data; and the Allocation
Resource Center (ARC) for Medical Care costs.1. Expenditures
are rounded to the nearest thousand dollars. For example, $500
to $1,000 are rounded to $1; $0 to $499 are rounded to $0; and
"$ -" = 0 or no expenditures.2. The Compensation & Pension
expenditures include dollars for the following programs:
veterans' compensation for service-connected disabilities;
dependency and indemnity compensation for service-connected
deaths; veterans' pension for nonservice-connected disabilities;
and burial and other benefits to veterans and their survivors.3.
Medical Care expenditures include dollars for medical services,
medical administration, facility maintenance, educational
support, research support, and other overhead items. Medical
Care expenditures do not include dollars for construction or
other non-medical support.4. Medical Care expenditures are
based on where patients live instead of where care is
delivered.5. A star symbol (*) in the Unique Patients column
denotes that there were less than 10 Unique Patients.
&"Arial,Bold"&11FY13 GEOGRAPHIC DISTRIBUTION OF
VA EXPENDITURES (GDX)
&8&P of &N
KSFY13 Summary of Expenditures by StateExpenditures in
$000sCounty/ Congressional DistrictVeteran Population*Total
ExpenditureCompensation & PensionConstructionEducation &
Vocational Rehabilitation/ EmploymentLoan Guaranty#General
Operating ExpensesInsurance & IndemnitiesMedical
CareUnique Patients**ALLEN1,280$ 4,711$ 2,162$ -$
246$ -$ -$ 27$ 2,276305ANDERSON666$ 2,967$
1,227$ -$ 105$ -$ -$ 128$ 1,507173ATCHISON1,369$
6,876$ 2,787$ -$ 365$ -$ -$ 83$
3,641348BARBER382$ 1,396$ 731$ -$ 87$ -$ -$ 41$
536120BARTON2,073$ 7,566$ 3,804$ -$ 250$ -$ -$
71$ 3,441625BOURBON1,375$ 5,903$ 2,632$ 459$ 219$
-$ -$ 43$ 2,551388BROWN983$ 4,370$ 2,131$ -$ 70$
-$ -$ 14$ 2,155232BUTLER5,888$ 26,518$ 11,506$ -$
2,506$ -$ -$ 289$ 12,2181,276CHASE301$ 1,076$ 571$
-$ 29$ -$ -$ 137$ 33963CHAUTAUQUA395$ 1,768$
644$ -$ 38$ -$ -$ 31$ 1,055105CHEROKEE1,788$
7,380$ 3,931$ -$ 513$ -$ -$ 42$
2,894465CHEYENNE248$ 758$ 455$ -$ -$ -$ -$ 11$
29267CLARK197$ 690$ 321$ -$ 3$ -$ -$ 1$
36567CLAY961$ 6,537$ 3,770$ -$ 547$ -$ -$ 135$
2,085327CLOUD946$ 4,174$ 2,074$ -$ 155$ -$ -$
83$ 1,861243COFFEY758$ 3,944$ 1,915$ -$ 226$ -$ -
$ 12$ 1,792216COMANCHE193$ 660$ 260$ -$ 19$ -$
-$ 24$ 35649COWLEY2,858$ 15,340$ 5,733$ -$ 871$
-$ -$ 321$ 8,415757CRAWFORD2,787$ 10,492$ 5,907$
-$ 1,361$ -$ -$ 44$ 3,179588DECATUR293$ 929$
378$ -$ 24$ -$ -$ 51$ 47685DICKINSON2,261$
15,108$ 7,727$ -$ 1,770$ -$ -$ 512$
5,099677DONIPHAN678$ 2,662$ 1,001$ -$ 122$ -$ -$
12$ 1,526175DOUGLAS6,781$ 31,284$ 12,676$ -$
5,209$ -$ -$ 413$ 12,9861,476EDWARDS265$ 873$
388$ -$ 22$ -$ -$ 2$ 46182ELK305$ 2,144$ 977$ -
$ 46$ -$ -$ 11$ 1,10999ELLIS1,716$ 6,998$ 2,983$
-$ 832$ -$ -$ 117$ 3,066634ELLSWORTH586$ 2,061$
960$ -$ 156$ -$ -$ 131$ 814174FINNEY1,500$
4,196$ 2,216$ -$ 260$ -$ -$ 72$
1,647311FORD1,315$ 7,982$ 2,865$ -$ 1,280$ -$ -$
56$ 3,782531FRANKLIN2,058$ 9,976$ 4,698$ -$ 815$
-$ -$ 51$ 4,413533GEARY5,231$ 51,700$ 28,907$ -$
11,065$ -$ -$ 425$ 11,3021,615GOVE217$ 661$ 378$
-$ 5$ -$ -$ 16$ 26393GRAHAM228$ 810$ 421$ -$
8$ -$ -$ 52$ 32967GRANT308$ 707$ 292$ -$ 48$ -
$ -$ 24$ 34338GRAY239$ 780$ 325$ -$ 15$ -$ -$
4$ 43781GREELEY97$ 109$ 77$ -$ -$ -$ -$ -$
3211GREENWOOD702$ 3,558$ 1,617$ -$ 113$ -$ -$
40$ 1,787184HAMILTON195$ 474$ 215$ -$ 51$ -$ -$
36$ 17241HARPER510$ 1,623$ 546$ -$ 32$ -$ -$ 9$
1,036113HARVEY2,671$ 10,533$ 4,185$ -$ 831$ -$ -$
96$ 5,421534HASKELL182$ 607$ 243$ -$ 8$ -$ -$
55$ 30133HODGEMAN162$ 684$ 378$ -$ 32$ -$ -$
41$ 23352JACKSON1,135$ 8,079$ 3,997$ -$ 243$ -$
-$ 86$ 3,754394JEFFERSON1,815$ 12,587$ 5,036$ -$
604$ -$ -$ 68$ 6,878534JEWELL301$ 1,297$ 652$ -$
28$ -$ -$ 1$ 61592JOHNSON36,844$ 131,071$ 65,897$
-$ 12,857$ -$ -$ 4,467$ 47,8506,502KEARNY235$
985$ 476$ -$ 33$ -$ -$ 1$ 47542KINGMAN685$
2,694$ 1,084$ -$ 214$ -$ -$ 112$
1,285186KIOWA223$ 517$ 232$ -$ 40$ -$ -$ 16$
22842LABETTE1,808$ 7,266$ 3,788$ -$ 243$ -$ -$
74$ 3,162476LANE177$ 436$ 234$ -$ 3$ -$ -$ 10$
18952LEAVENWORTH10,806$ 110,942$ 40,347$ 284$
8,244$ -$ 12,960$ 527$ 48,5793,155LINCOLN334$
1,287$ 441$ -$ 75$ -$ -$ 69$ 702100LINN875$
5,131$ 2,863$ -$ 157$ -$ -$ 71$
2,040317LOGAN269$ 533$ 312$ -$ 12$ -$ -$ 13$
19670LYON2,269$ 12,108$ 5,496$ -$ 678$ -$ -$ 237$
5,697645MCPHERSON2,125$ 7,753$ 3,381$ -$ 514$ -$
-$ 146$ 3,712503MARION805$ 3,623$ 1,703$ -$ 116$
-$ -$ 16$ 1,788215MARSHALL1,046$ 4,503$ 2,241$ -$
137$ -$ -$ 23$ 2,101293MEADE293$ 793$ 481$ -$
10$ -$ -$ 1$ 30281MIAMI2,500$ 9,757$ 5,080$ -$
494$ -$ -$ 48$ 4,134692MITCHELL523$ 1,754$ 723$
-$ 73$ -$ -$ 63$ 896146MONTGOMERY3,096$
11,785$ 6,585$ -$ 474$ -$ -$ 106$
4,619708MORRIS618$ 4,466$ 2,446$ -$ 278$ -$ -$
41$ 1,701202MORTON184$ 510$ 350$ -$ -$ -$ -$
54$ 10631NEMAHA858$ 3,593$ 1,474$ -$ 128$ -$ -$
67$ 1,925240NEOSHO1,301$ 5,783$ 2,510$ -$ 252$ -$
-$ 87$ 2,934367NESS284$ 692$ 316$ -$ 14$ -$ -$
12$ 34994NORTON455$ 1,975$ 770$ -$ 78$ -$ -$
41$ 1,086148OSAGE1,671$ 11,413$ 4,435$ -$ 382$ -$
-$ 88$ 6,508600OSBORNE339$ 1,312$ 608$ -$ 31$ -$
-$ 281$ 39195OTTAWA500$ 2,639$ 1,009$ -$ 94$ -$
-$ 99$ 1,437145PAWNEE544$ 2,523$ 1,257$ -$ 37$ -
$ -$ 13$ 1,216176PHILLIPS467$ 2,085$ 1,143$ -$
13$ -$ -$ 33$ 896202POTTAWATOMIE1,603$ 9,696$
3,930$ -$ 894$ -$ -$ 35$ 4,838513PRATT735$ 2,542$
1,128$ -$ 56$ -$ -$ 77$ 1,281141RAWLINS262$ 527$
285$ -$ 3$ -$ -$ 49$ 19062RENO5,369$ 23,862$
9,858$ -$ 1,024$ -$ -$ 371$
12,6081,500REPUBLIC523$ 1,803$ 749$ -$ 33$ -$ -$
40$ 982134RICE831$ 2,942$ 1,670$ -$ 82$ -$ -$
23$ 1,166201RILEY5,539$ 37,812$ 18,570$ -$ 10,940$
-$ -$ 363$ 7,9381,160ROOKS452$ 2,289$ 1,122$ -$
48$ -$ -$ 25$ 1,093163RUSH335$ 1,098$ 532$ -$
65$ -$ -$ 5$ 497133RUSSELL647$ 2,991$ 1,358$ -$
35$ -$ -$ 61$ 1,537245SALINE4,800$ 21,651$ 9,486$
-$ 3,016$ -$ -$ 122$ 9,0271,413SCOTT325$ 937$
450$ -$ 29$ -$ -$ 21$ 43676SEDGWICK38,061$
226,650$ 85,014$ -$ 20,305$ -$ 9,846$ 3,374$
108,1129,644SEWARD976$ 2,352$ 945$ -$ 235$ -$ -$
28$ 1,143176SHAWNEE16,526$ 163,096$ 58,275$ -$
5,825$ -$ 4,352$ 1,114$ 93,5315,960SHERIDAN222$
415$ 218$ -$ 2$ -$ -$ 21$ 17553SHERMAN620$
1,654$ 827$ -$ 57$ -$ -$ 13$ 758129SMITH345$
1,347$ 776$ -$ 10$ -$ -$ 45$ 517128STAFFORD335$
1,859$ 852$ -$ 34$ -$ -$ 14$ 95994STANTON127$
181$ 72$ -$ -$ -$ -$ 6$ 10418STEVENS306$ 539$
262$ -$ 42$ -$ -$ 1$ 23449SUMNER2,072$ 8,693$
4,270$ -$ 458$ -$ -$ 48$ 3,917454THOMAS449$
1,194$ 697$ -$ 87$ -$ -$ 43$ 368129TREGO269$
1,082$ 661$ -$ 10$ -$ -$ 1$
410107WABAUNSEE661$ 5,407$ 2,093$ -$ 206$ -$ -$
250$ 2,858232WALLACE125$ 327$ 217$ -$ 42$ -$ -$
13$ 5628WASHINGTON476$ 2,066$ 1,177$ -$ 52$ -$
-$ 27$ 810138WICHITA152$ 497$ 241$ -$ 32$ -$ -$
101$ 12330WILSON889$ 3,596$ 1,668$ -$ 132$ -$ -$
32$ 1,764205WOODSON392$ 1,806$ 622$ -$ 37$ -$ -
$ 11$ 1,13698WYANDOTTE9,949$ 65,599$ 26,618$ -$
3,247$ -$ -$ 273$ 35,4603,086KANSAS (Totals)223,708$
1,237,985$ 529,023$ 743$ 103,950$ -$ 27,158$
17,340$ 559,77158,097CONG. DIST (01)55,814$ 286,000$
138,323$ -$ 35,630$ -$ -$ 4,836$ 107,21115,815CONG.
DIST (02)64,080$ 445,399$ 177,706$ 743$ 26,419$ -$
17,313$ 3,217$ 220,00218,602CONG. DIST (03)47,496$
199,135$ 93,797$ -$ 16,229$ -$ -$ 4,757$
84,3539,790CONG. DIST (04)56,318$ 307,451$ 119,198$ -
$ 25,673$ -$ 9,846$ 4,530$ 148,20413,890KANSAS
(Totals)223,708$ 1,237,985$ 529,023$ 743$ 103,950$ -$
27,158$ 17,340$ 559,77158,097Notes:* Veteran population
estimates, as of September 30, 2013, are produced by the VA
Office of the Actuary (VetPop 2011).# Prior to FY 08, "Loan
Guaranty" expenditures were included in the Education &
Vocational Rehabilitation and Employment (E&VRE) programs.
Currently, all "Loan Guaranty" expenditures are attributed to
Travis County, TX, where all Loan Guaranty payments are
processed. VA will continue to improve data collection for
future GDX reports to better distribute loan expenditures at the
state, county and congressional district levels.** Unique
patients are patients who received treatment at a VA health care
facility. Data are provided by the Allocation Resource Center
(ARC).Expenditure data sources: USASpending.gov for
Compensation & Pension (C&P) and Education and Vocational
Rehabilitation and Employment (EVRE) Benefits; Veterans
Benefits Administration Insurance Center for the Insurance
costs; the VA Financial Management System (FMS) for
Construction, Medical Research, General Operating Expenses,
and certain C&P and Readjustment data; and the Allocation
Resource Center (ARC) for Medical Care costs.1. Expenditures
are rounded to the nearest thousand dollars. For example, $500
to $1,000 are rounded to $1; $0 to $499 are rounded to $0; and
"$ -" = 0 or no expenditures.2. The Compensation & Pension
expenditures include dollars for the following programs:
veterans' compensation for service-connected disabilities;
dependency and indemnity compensation for service-connected
deaths; veterans' pension for nonservice-connected disabilities;
and burial and other benefits to veterans and their survivors.3.
Medical Care expenditures include dollars for medical services,
medical administration, facility maintenance, educational
support, research support, and other overhead items. Medical
Care expenditures do not include dollars for construction or
other non-medical support.4. Medical Care expenditures are
based on where patients live instead of where care is
delivered.5. A star symbol (*) in the Unique Patients column
denotes that there were less than 10 Unique Patients.
&"Arial,Bold"&11FY13 GEOGRAPHIC DISTRIBUTION OF
VA EXPENDITURES (GDX)
&8&P of &N
KYFY13 Summary of Expenditures by StateExpenditures in
$000sCounty/ Congressional DistrictVeteran Population*Total
ExpenditureCompensation & PensionConstructionEducation &
Vocational Rehabilitation/ EmploymentLoan Guaranty#General
Operating ExpensesInsurance & IndemnitiesMedical
CareUnique Patients**ADAIR1,204$ 8,083$ 4,135$ -$
405$ -$ -$ 8$ 3,535381ALLEN1,371$ 7,669$ 4,451$ -
$ 352$ -$ -$ 78$ 2,788357ANDERSON1,668$ 11,076$
5,237$ -$ 693$ -$ -$ 79$ 5,067500BALLARD778$
4,298$ 2,040$ -$ 173$ -$ -$ 38$
2,047271BARREN3,035$ 15,782$ 9,670$ -$ 578$ -$ -$
60$ 5,474727BATH831$ 7,073$ 3,415$ -$ 171$ -$ -$
10$ 3,478349BELL1,976$ 12,563$ 8,260$ -$ 339$ -$ -
$ 75$ 3,889474BOONE9,598$ 43,210$ 17,653$ -$
4,291$ -$ -$ 597$ 20,6692,294BOURBON1,734$ 9,174$
3,842$ -$ 299$ -$ -$ 72$ 4,960522BOYD4,792$
33,523$ 16,730$ -$ 1,210$ -$ -$ 159$
15,4241,425BOYLE2,645$ 12,357$ 6,271$ -$ 615$ -$ -
$ 153$ 5,318656BRACKEN748$ 3,896$ 1,585$ -$ 117$
-$ -$ 42$ 2,151207BREATHITT920$ 7,583$ 4,509$ -$
99$ -$ -$ 253$ 2,721364BRECKINRIDGE1,797$ 10,948$
5,892$ -$ 393$ -$ -$ 78$ 4,585562BULLITT7,178$
27,776$ 12,276$ -$ 1,951$ -$ -$ 229$
13,3191,575BUTLER1,026$ 4,791$ 2,913$ -$ 163$ -$ -
$ 14$ 1,701265CALDWELL1,180$ 6,178$ 3,603$ -$
237$ -$ -$ 49$ 2,288353CALLOWAY2,919$ 17,871$
9,132$ -$ 1,584$ -$ -$ 242$
6,913721CAMPBELL6,473$ 41,358$ 12,670$ -$ 2,767$ -
$ -$ 478$ 25,4431,998CARLISLE411$ 2,422$ 1,182$ -$
31$ -$ -$ 9$ 1,201150CARROLL1,224$ 5,883$ 2,236$
-$ 181$ -$ -$ 20$ 3,447312CARTER1,556$ 16,781$
8,130$ -$ 415$ -$ -$ 47$ 8,189684CASEY1,073$
8,426$ 4,007$ -$ 118$ -$ -$ 97$
4,203419CHRISTIAN7,883$ 65,365$ 36,338$ -$ 12,355$
-$ -$ 387$ 16,2862,204CLARK3,306$ 19,578$ 9,206$ -
$ 639$ -$ -$ 65$ 9,667967CLAY1,219$ 8,359$ 4,780$
-$ 115$ -$ -$ 2$ 3,463355CLINTON721$ 4,591$
2,879$ -$ 76$ -$ -$ 31$ 1,606227CRITTENDEN778$
4,489$ 2,555$ -$ 128$ -$ -$ 105$
1,701225CUMBERLAND569$ 3,357$ 2,293$ -$ 42$ -$
-$ 1$ 1,021126DAVIESS8,235$ 39,986$ 23,455$ -$
1,813$ -$ -$ 369$ 14,3492,176EDMONSON971$ 4,587$
2,414$ -$ 99$ -$ -$ 51$ 2,022275ELLIOTT295$
1,645$ 751$ -$ 43$ -$ -$ 14$ 83682ESTILL1,096$
9,440$ 4,369$ -$ 221$ -$ -$ 4$
4,847356FAYETTE19,955$ 146,160$ 52,090$ 788$
11,329$ -$ 2,978$ 1,548$ 77,4286,229FLEMING1,029$
8,853$ 4,012$ -$ 220$ -$ -$ 171$
4,449443FLOYD2,009$ 19,461$ 11,109$ -$ 330$ -$ -$
312$ 7,711922FRANKLIN4,663$ 24,356$ 11,888$ -$
1,098$ -$ -$ 431$ 10,9401,043FULTON553$ 4,315$
2,386$ -$ 82$ -$ -$ 7$ 1,840204GALLATIN750$
3,395$ 1,628$ -$ 91$ -$ -$ 9$
1,667191GARRARD1,202$ 9,312$ 4,423$ -$ 248$ -$ -$
63$ 4,579500GRANT2,133$ 10,397$ 5,218$ -$ 634$ -$
-$ 22$ 4,524506GRAVES2,737$ 18,238$ 8,714$ -$
913$ -$ -$ 120$ 8,4921,039GRAYSON2,043$ 12,732$
7,417$ -$ 398$ -$ -$ 39$ 4,878641GREEN1,088$
4,264$ 2,260$ -$ 170$ -$ -$ 14$
1,819252GREENUP3,408$ 21,237$ 11,281$ -$ 423$ -$
-$ 154$ 9,3791,046HANCOCK800$ 3,103$ 1,963$ -$
103$ -$ -$ 3$ 1,034184HARDIN15,985$ 158,898$
107,052$ -$ 21,944$ -$ -$ 971$
28,9314,681HARLAN1,935$ 20,624$ 12,968$ -$ 339$ -$
-$ 180$ 7,137729HARRISON1,456$ 9,535$ 4,309$ -$
158$ -$ -$ 158$ 4,909462HART1,305$ 7,442$ 4,041$
-$ 248$ -$ -$ 47$ 3,106358HENDERSON3,331$
16,418$ 7,999$ -$ 560$ -$ -$ 319$
7,5391,063HENRY1,434$ 7,724$ 3,378$ -$ 367$ -$ -$
54$ 3,925336HICKMAN448$ 1,726$ 797$ -$ 2$ -$ -$
7$ 921124HOPKINS3,718$ 23,269$ 12,960$ -$ 895$ -$
-$ 194$ 9,2201,171JACKSON572$ 6,152$ 3,283$ -$
106$ -$ -$ -$ 2,764253JEFFERSON56,170$ 376,917$
135,429$ 5,016$ 27,097$ -$ 33,328$ 4,444$
171,60416,404JESSAMINE3,493$ 32,040$ 11,701$ 378$
1,313$ -$ 1,111$ 170$ 17,3671,310JOHNSON1,616$
17,186$ 10,075$ -$ 250$ -$ -$ 42$
6,819669KENTON12,661$ 62,239$ 20,923$ -$ 4,504$ -$
-$ 832$ 35,9803,276KNOTT793$ 6,519$ 4,043$ -$
126$ -$ -$ 10$ 2,341327KNOX2,165$ 12,709$ 7,031$
-$ 573$ -$ -$ 42$ 5,064574LARUE1,418$ 6,477$
3,932$ -$ 348$ -$ -$ 125$ 2,072326LAUREL3,619$
32,393$ 17,125$ -$ 746$ -$ -$ 110$
14,4131,506LAWRENCE1,026$ 9,811$ 5,345$ -$ 142$ -
$ -$ 37$ 4,287448LEE500$ 3,932$ 2,294$ -$ 109$ -$
-$ 1$ 1,528189LESLIE455$ 3,814$ 2,369$ -$ 157$ -$
-$ -$ 1,288197LETCHER1,253$ 10,592$ 6,853$ -$
109$ -$ -$ 23$ 3,607474LEWIS819$ 7,499$ 3,441$ -$
171$ -$ -$ 3$ 3,885307LINCOLN1,692$ 14,591$
7,200$ -$ 340$ -$ -$ 62$ 6,989695LIVINGSTON892$
4,710$ 2,734$ -$ 249$ -$ -$ 18$
1,709288LOGAN2,113$ 12,208$ 5,953$ -$ 477$ -$ -$
12$ 5,767509LYON817$ 5,136$ 2,884$ -$ 126$ -$ -$
26$ 2,100249MCCRACKEN6,067$ 32,601$ 16,255$ -$
1,651$ -$ -$ 227$ 14,4681,996MCCREARY1,174$
13,254$ 7,436$ -$ 226$ -$ -$ 19$
5,573573MCLEAN833$ 3,381$ 2,166$ -$ 87$ -$ -$ 5$
1,123179MADISON6,065$ 45,622$ 22,571$ -$ 4,799$ -$
-$ 494$ 17,7582,151MAGOFFIN441$ 5,095$ 2,964$ -$
92$ -$ -$ 29$ 2,009228MARION1,282$ 8,558$ 3,830$
937$ 269$ -$ 442$ 26$ 3,054338MARSHALL3,198$
19,947$ 7,999$ -$ 592$ -$ -$ 363$
10,9931,051MARTIN537$ 5,747$ 2,715$ -$ 37$ -$ -$
11$ 2,983212MASON1,398$ 7,529$ 3,417$ -$ 265$ -$
-$ 42$ 3,804396MEADE3,646$ 20,786$ 11,848$ -$
1,704$ -$ -$ 144$ 7,0901,004MENIFEE496$ 3,661$
2,234$ -$ 61$ -$ -$ 3$ 1,364173MERCER1,791$
10,845$ 5,062$ -$ 400$ -$ -$ 37$
5,346529METCALFE681$ 3,767$ 2,080$ -$ 109$ -$ -$
25$ 1,553164MONROE671$ 3,368$ 2,411$ -$ 112$ -$
-$ 9$ 836148MONTGOMERY2,080$ 14,379$ 6,356$ -$
572$ -$ -$ 121$ 7,331651MORGAN1,016$ 4,693$
2,488$ -$ 116$ -$ -$ 4$
2,086245MUHLENBERG2,147$ 11,847$ 7,249$ -$ 259$
-$ -$ 196$ 4,144530NELSON3,549$ 17,549$ 8,961$ -$
1,192$ -$ -$ 102$ 7,294906NICHOLAS605$ 4,451$
1,680$ -$ 98$ -$ -$ 4$ 2,669237OHIO2,021$ 10,329$
6,408$ -$ 206$ -$ -$ 71$ 3,644527OLDHAM5,175$
16,170$ 8,058$ -$ 1,568$ -$ -$ 222$
6,322850OWEN952$ 3,302$ 974$ -$ 35$ -$ -$ 37$
2,256224OWSLEY300$ 2,663$ 2,075$ -$ 8$ -$ -$ -$
58041PENDLETON1,272$ 7,119$ 2,495$ -$ 229$ -$ -$
74$ 4,321356PERRY1,466$ 18,627$ 12,418$ -$ 314$ -$
-$ 26$ 5,869710PIKE3,615$ 29,220$ 18,019$ -$ 496$
-$ -$ 228$ 10,4771,312POWELL991$ 8,826$ 4,896$ -$
146$ -$ -$ 4$ 3,779383PULASKI5,259$ 42,587$
22,923$ 10$ 1,201$ -$ 124$ 230$
18,0992,220ROBERTSON196$ 1,078$ 553$ -$ 10$ -$ -
$ 10$ 50455ROCKCASTLE925$ 7,484$ 4,202$ -$ 111$
-$ -$ 10$ 3,162388ROWAN1,458$ 11,677$ 5,431$ -$
538$ -$ -$ 21$ 5,687584RUSSELL1,373$ 9,212$
5,377$ -$ 325$ -$ -$ 9$ 3,500450SCOTT3,555$
17,406$ 8,410$ -$ 1,159$ -$ -$ 96$
7,740899SHELBY3,442$ 13,091$ 6,519$ -$ 1,251$ -$ -
$ 100$ 5,221690SIMPSON1,421$ 7,256$ 4,352$ -$
208$ -$ -$ 21$ 2,675357SPENCER1,130$ 6,069$
3,211$ -$ 393$ -$ -$ 51$ 2,413348TAYLOR1,514$
11,031$ 6,039$ -$ 891$ -$ -$ 102$
3,998524TODD926$ 5,979$ 3,395$ -$ 332$ -$ -$ 10$
2,242249TRIGG1,413$ 10,452$ 6,814$ -$ 803$ -$ -$
34$ 2,801458TRIMBLE732$ 4,198$ 2,046$ -$ 67$ -$
-$ 61$ 2,025221UNION1,039$ 6,516$ 3,596$ -$ 129$
-$ -$ 14$ 2,777358WARREN7,952$ 41,769$ 24,224$ -$
3,676$ -$ -$ 571$ 13,2971,813WASHINGTON704$
4,347$ 2,062$ -$ 260$ -$ -$ 23$
2,002193WAYNE1,560$ 10,306$ 5,988$ -$ 226$ -$ -$
111$ 3,981508WEBSTER963$ 5,055$ 2,933$ -$ 184$ -
$ -$ 12$ 1,926306WHITLEY2,611$ 28,360$ 17,824$ -$
916$ -$ -$ 94$ 9,526946WOLFE422$ 4,237$ 2,486$ -
$ 67$ -$ -$ 2$ 1,682183WOODFORD2,004$ 11,628$
4,931$ -$ 602$ -$ -$ 69$ 6,025548KENTUCKY
(Totals)339,334$ 2,229,580$ 1,087,772$ 7,129$ 139,199$
-$ 37,983$ 18,871$ 938,626101,096CONG. DIST
(01)59,054$ 368,065$ 197,941$ 937$ 24,962$ -$ 442$
2,871$ 140,91117,716CONG. DIST (02)67,835$ 430,326$
252,187$ 378$ 36,991$ -$ 1,111$ 3,139$
136,52018,148CONG. DIST (03)54,852$ 373,713$ 134,171$
5,016$ 26,845$ -$ 33,328$ 4,311$ 170,04216,150CONG.
DIST (04)59,243$ 298,443$ 123,114$ -$ 18,580$ -$ -$
3,168$ 153,58115,109CONG. DIST (05)44,667$ 390,236$
223,524$ 10$ 8,825$ -$ 124$ 2,004$
155,74917,203CONG. DIST (06)53,684$ 368,797$ 156,835$
788$ 22,996$ -$ 2,978$ 3,378$
181,82316,770KENTUCKY (Totals)339,334$ 2,229,580$
1,087,772$ 7,129$ 139,199$ -$ 37,983$ 18,871$
938,626101,096Notes:* Veteran population estimates, as of
September 30, 2013, are produced by the VA Office of the
Actuary (VetPop 2011).# Prior to FY 08, "Loan Guaranty"
expenditures were included in the Education & Vocational
Rehabilitation and Employment (E&VRE) programs.
Currently, all "Loan Guaranty" expenditures are attributed to
Travis County, TX, where all Loan Guaranty payments are
processed. VA will continue to improve data collection for
future GDX reports to better distribute loan expenditures at the
state, county and congressional district levels.** Unique
patients are patients who received treatment at a VA health care
facility. Data are provided by the Allocation Resource Center
(ARC).Expenditure data sources: USASpending.gov for
Compensation & Pension (C&P) and Education and Vocational
Rehabilitation and Employment (EVRE) Benefits; Veterans
Benefits Administration Insurance Center for the Insurance
costs; the VA Financial Management System (FMS) for
Construction, Medical Research, General Operating Expenses,
and certain C&P and Readjustment data; and the Allocation
Resource Center (ARC) for Medical Care costs.1. Expenditures
are rounded to the nearest thousand dollars. For example, $500
to $1,000 are rounded to $1; $0 to $499 are rounded to $0; and
"$ -" = 0 or no expenditures.2. The Compensation & Pension
expenditures include dollars for the following programs:
veterans' compensation for service-connected disabilities;
dependency and indemnity compensation for service-connected
deaths; veterans' pension for nonservice-connected disabilities;
and burial and other benefits to veterans and their survivors.3.
Medical Care expenditures include dollars for medical services,
medical administration, facility maintenance, educational
support, research support, and other overhead items. Medical
Care expenditures do not include dollars for construction or
other non-medical support.4. Medical Care expenditures are
based on where patients live instead of where care is
delivered.5. A star symbol (*) in the Unique Patients column
denotes that there were less than 10 Unique Patients.
&"Arial,Bold"&11FY13 GEOGRAPHIC DISTRIBUTION OF
VA EXPENDITURES (GDX)
&8&P of &N
LAFY13 Summary of Expenditures by StateExpenditures in
$000sCounty/ Congressional DistrictVeteran Population*Total
ExpenditureCompensation & PensionConstructionEducation &
Vocational Rehabilitation/ EmploymentLoan Guaranty#General
Operating ExpensesInsurance & IndemnitiesMedical
CareUnique Patients**ACADIA3,646$ 19,965$ 10,566$ -$
543$ -$ -$ 108$ 8,7481,106ALLEN1,812$ 10,784$
5,289$ -$ 216$ -$ -$ 143$ 5,136551ASCENSION6,717$
28,694$ 16,133$ -$ 2,467$ -$ -$ 172$
9,9231,216ASSUMPTION1,350$ 5,831$ 3,710$ -$ 157$ -
$ -$ 53$ 1,911340AVOYELLES2,845$ 22,541$ 12,296$
-$ 448$ -$ -$ 29$ 9,7671,142BEAUREGARD3,479$
29,545$ 18,008$ -$ 2,435$ -$ -$ 393$
8,7101,143BIENVILLE1,096$ 10,084$ 4,271$ -$ 296$ -$
-$ 42$ 5,475393BOSSIER13,331$ 98,022$ 55,156$ -$
9,722$ -$ -$ 748$ 32,3953,679CADDO21,403$ 161,731$
69,976$ -$ 9,398$ -$ 1,955$ 1,315$
79,0876,617CALCASIEU15,307$ 72,348$ 38,514$ -$
4,194$ -$ -$ 700$ 28,9403,431CALDWELL728$ 4,639$
2,862$ -$ 105$ -$ -$ 1$ 1,670221CAMERON593$
962$ 379$ -$ 11$ -$ -$ 28$ 54484CATAHOULA638$
6,751$ 3,360$ -$ 34$ -$ -$ 4$
3,353292CLAIBORNE1,243$ 6,638$ 3,494$ -$ 199$ -$
-$ 51$ 2,894340CONCORDIA1,249$ 9,394$ 5,087$ -$
244$ -$ -$ 78$ 3,985532DE SOTO1,986$ 12,504$
5,913$ -$ 395$ -$ -$ 60$ 6,136614EAST BATON
ROUGE28,112$ 139,723$ 72,743$ 890$ 12,314$ -$
1,362$ 1,852$ 50,5635,681EAST CARROLL523$ 2,039$
1,031$ -$ 55$ -$ -$ 7$ 946118EAST
FELICIANA1,802$ 9,571$ 6,220$ -$ 289$ -$ -$ 62$
2,999410EVANGELINE1,834$ 12,361$ 6,789$ -$ 395$ -
$ -$ 86$ 5,092629FRANKLIN1,254$ 9,227$ 5,400$ -$
147$ -$ -$ 17$ 3,663484GRANT1,814$ 18,534$ 8,217$
-$ 418$ -$ -$ 119$ 9,782846IBERIA4,705$ 21,125$
12,730$ -$ 764$ -$ -$ 339$
7,2931,232IBERVILLE2,300$ 11,057$ 6,515$ -$ 481$ -$
-$ 50$ 4,012463JACKSON1,193$ 9,420$ 4,811$ -$
178$ -$ -$ 58$ 4,373408JEFFERSON27,001$ 151,304$
75,385$ -$ 11,034$ -$ -$ 2,817$
62,0685,605JEFFERSON DAVIS1,978$ 16,394$ 8,479$ -$
265$ -$ -$ 100$ 7,550847LAFAYETTE14,041$ 69,733$
40,881$ -$ 6,191$ -$ -$ 1,189$
21,4713,768LAFOURCHE4,781$ 22,578$ 12,725$ -$
1,239$ -$ -$ 267$ 8,3481,388LA SALLE931$ 7,450$
3,930$ -$ 205$ -$ -$ 145$ 3,170360LINCOLN2,133$
19,511$ 12,222$ -$ 1,146$ -$ -$ 353$
5,790626LIVINGSTON8,679$ 38,597$ 20,212$ -$ 2,975$
-$ -$ 382$ 15,0281,674MADISON674$ 6,804$ 2,131$ -
$ 73$ -$ -$ 13$ 4,587282MOREHOUSE2,020$ 12,004$
6,644$ -$ 238$ -$ -$ 35$
5,086690NATCHITOCHES2,504$ 22,165$ 11,326$ -$
861$ -$ -$ 43$ 9,9351,057ORLEANS18,247$ 381,663$
61,551$ 200,027$ 11,615$ -$ 21,423$ 1,245$
85,8016,447OUACHITA10,507$ 64,822$ 38,728$ -$
2,993$ -$ -$ 489$ 22,6123,421PLAQUEMINES1,464$
7,282$ 3,658$ -$ 1,594$ -$ -$ 26$ 2,003283POINTE
COUPEE1,649$ 7,318$ 4,101$ -$ 396$ -$ -$ 20$
2,801346RAPIDES10,926$ 142,179$ 58,421$ 1,861$
4,055$ -$ 1,761$ 1,130$ 74,9515,194RED RIVER531$
3,960$ 2,008$ -$ 79$ -$ -$ 7$
1,866156RICHLAND1,149$ 8,028$ 4,550$ -$ 289$ -$ -
$ 35$ 3,155418SABINE1,869$ 16,653$ 8,458$ -$ 399$
-$ -$ 126$ 7,671713ST. BERNARD2,305$ 11,456$
4,951$ -$ 829$ -$ -$ 78$ 5,598446ST.
CHARLES3,767$ 14,613$ 6,908$ -$ 1,021$ -$ -$ 175$
6,509606ST. HELENA804$ 3,305$ 1,512$ -$ 34$ -$ -$
42$ 1,717186ST. JAMES1,414$ 7,364$ 4,101$ -$ 182$
-$ -$ 126$ 2,955328ST. JOHN THE BAPTIST3,040$
21,098$ 11,014$ -$ 936$ -$ -$ 142$ 9,006873ST.
LANDRY5,525$ 37,979$ 22,239$ -$ 1,223$ -$ -$
362$ 14,1571,929ST. MARTIN3,103$ 16,143$ 9,364$ -$
649$ -$ -$ 168$ 5,963923ST. MARY3,198$ 13,335$
6,734$ -$ 686$ -$ -$ 53$ 5,862943ST.
TAMMANY20,348$ 102,272$ 59,020$ -$ 7,868$ -$ -$
1,963$ 33,4214,167TANGIPAHOA8,573$ 50,429$ 24,813$
-$ 2,784$ -$ -$ 344$ 22,4882,147TENSAS436$ 1,970$
973$ -$ 18$ -$ -$ 10$ 968104TERREBONNE6,921$
28,349$ 15,913$ -$ 1,784$ -$ -$ 502$
10,1501,793UNION1,726$ 11,210$ 6,745$ -$ 254$ -$ -
$ 54$ 4,157567VERMILION3,180$ 16,246$ 10,341$ -$
762$ -$ -$ 186$ 4,958922VERNON7,301$ 62,158$
38,437$ -$ 7,788$ -$ -$ 275$
15,6592,299WASHINGTON3,560$ 24,511$ 14,494$ -$
756$ -$ -$ 208$ 9,0531,198WEBSTER3,341$ 26,217$
12,389$ -$ 774$ -$ -$ 197$ 12,8571,155WEST BATON
ROUGE1,329$ 7,814$ 4,061$ -$ 367$ -$ -$ 53$
3,332344WEST CARROLL838$ 4,162$ 2,426$ -$ 150$ -
$ -$ 4$ 1,582241WEST FELICIANA1,352$ 2,350$
1,439$ -$ 161$ -$ -$ 32$ 717105WINN1,239$ 7,469$
3,450$ -$ 189$ -$ -$ 30$ 3,800367LOUISIANA
(Totals)315,342$ 2,202,388$ 1,016,206$ 202,777$
120,767$ -$ 26,501$ 19,941$ 816,19586,890CONG. DIST
(01)53,427$ 244,437$ 129,527$ -$ 18,260$ -$ -$
5,063$ 91,58610,613CONG. DIST (02)42,498$ 578,119$
163,648$ 200,916$ 25,548$ -$ 22,785$ 2,523$
162,69813,317CONG. DIST (03)50,028$ 247,154$ 138,501$
-$ 14,093$ -$ -$ 2,901$ 91,65913,331CONG. DIST
(04)66,124$ 502,936$ 259,350$ -$ 33,819$ -$ 1,955$
3,686$ 204,12620,828CONG. DIST (05)53,558$ 427,891$
216,766$ 1,861$ 13,740$ -$ 1,761$ 3,116$
190,64619,153CONG. DIST (06)49,708$ 201,852$ 108,414$
-$ 15,306$ -$ -$ 2,652$ 75,4799,648LOUISIANA
(Totals)315,342$ 2,202,388$ 1,016,206$ 202,777$
120,767$ -$ 26,501$ 19,941$ 816,19586,890Notes:*
Veteran population estimates, as of September 30, 2013, are
produced by the VA Office of the Actuary (VetPop 2011).#
Prior to FY 08, "Loan Guaranty" expenditures were included in
the Education & Vocational Rehabilitation and Employment
(E&VRE) programs. Currently, all "Loan Guaranty"
expenditures are attributed to Travis County, TX, where all
Loan Guaranty payments are processed. VA will continue to
improve data collection for future GDX reports to better
distribute loan expenditures at the state, county and
congressional district levels.** Unique patients are patients who
received treatment at a VA health care facility. Data are
provided by the Allocation Resource Center (ARC).Expenditure
data sources: USASpending.gov for Compensation & Pension
(C&P) and Education and Vocational Rehabilitation and
Employment (EVRE) Benefits; Veterans Benefits
Administration Insurance Center for the Insurance costs; the VA
Financial Management System (FMS) for Construction, Medical
Research, General Operating Expenses, and certain C&P and
Readjustment data; and the Allocation Resource Center (ARC)
for Medical Care costs.1. Expenditures are rounded to the
nearest thousand dollars. For example, $500 to $1,000 are
rounded to $1; $0 to $499 are rounded to $0; and "$ -" = 0 or no
expenditures.2. The Compensation & Pension expenditures
include dollars for the following programs: veterans'
compensation for service-connected disabilities; dependency
and indemnity compensation for service-connected deaths;
veterans' pension for nonservice-connected disabilities; and
burial and other benefits to veterans and their survivors.3.
Medical Care expenditures include dollars for medical services,
medical administration, facility maintenance, educational
support, research support, and other overhead items. Medical
Care expenditures do not include dollars for construction or
other non-medical support.4. Medical Care expenditures are
based on where patients live instead of where care is
delivered.5. A star symbol (*) in the Unique Patients column
denotes that there were less than 10 Unique Patients.
&"Arial,Bold"&11FY13 GEOGRAPHIC DISTRIBUTION OF
VA EXPENDITURES (GDX)
&8&P of &N
MAFY13 Summary of Expenditures by StateExpenditures in
$000sCounty/ Congressional DistrictVeteran Population*Total
ExpenditureCompensation & PensionConstructionEducation &
Vocational Rehabilitation/ EmploymentLoan Guaranty#General
Operating ExpensesInsurance & IndemnitiesMedical
CareUnique Patients**BARNSTABLE20,215$ 97,483$
52,299$ 2,527$ 6,174$ -$ 2,778$ 2,725$
30,9814,772BERKSHIRE11,172$ 49,390$ 24,099$ -$
2,011$ -$ -$ 986$ 22,2952,156BRISTOL33,197$
197,192$ 91,431$ -$ 16,163$ -$ -$ 2,569$
87,0307,997DUKES1,041$ 3,016$ 1,756$ -$ 183$ -$ -$
149$ 928201ESSEX42,754$ 209,029$ 95,802$ -$
20,792$ -$ -$ 4,351$ 88,0848,820FRANKLIN6,198$
31,695$ 14,734$ -$ 1,849$ -$ -$ 569$
14,5431,761HAMPDEN33,084$ 168,009$ 90,523$ -$
13,243$ -$ -$ 2,264$ 61,9797,749HAMPSHIRE11,066$
81,548$ 30,188$ 694$ 4,807$ -$ 1,221$ 1,314$
43,3252,923MIDDLESEX69,788$ 476,995$ 176,646$ -$
43,005$ -$ 4,298$ 10,930$
242,11714,787NANTUCKET624$ 874$ 537$ -$ 91$ -$
-$ 21$ 22558NORFOLK35,368$ 232,920$ 98,579$ -$
20,217$ -$ -$ 6,042$ 108,0838,051PLYMOUTH34,692$
260,075$ 102,228$ -$ 15,236$ -$ 1,836$ 3,548$
137,2268,286SUFFOLK23,303$ 302,740$ 75,071$ 17,331$
27,157$ -$ 22,414$ 1,888$
158,8806,306WORCESTER52,307$ 260,645$ 132,003$ -$
22,046$ -$ -$ 3,878$ 102,71810,478MASSACHUSETTS
(Totals)374,809$ 2,371,613$ 985,894$ 20,552$ 192,975$
-$ 32,546$ 41,235$ 1,098,41284,345CONG. DIST
(01)55,118$ 261,964$ 133,494$ 694$ 18,249$ -$ 1,221$
4,144$ 104,16312,401CONG. DIST (02)47,401$ 268,436$
126,973$ -$ 20,551$ -$ 4,082$ 116,83010,202CONG.
DIST (03)38,889$ 216,640$ 92,836$ -$ 20,027$ -$ -$
4,272$ 99,5048,717CONG. DIST (04)37,753$ 212,451$
94,406$ -$ 17,566$ -$ -$ 5,911$ 94,5688,166CONG.
DIST (05)32,954$ 160,124$ 59,491$ -$ 15,291$ -$ -$
5,310$ 80,0326,523CONG. DIST (06)44,937$ 338,140$
137,144$ -$ 31,481$ -$ 4,298$ 5,011$
160,2079,794CONG. DIST (07)20,389$ 222,669$ 65,112$
17,331$ 21,030$ -$ 22,414$ 1,560$ 95,2235,176CONG.
DIST (08)43,009$ 418,057$ 149,759$ -$ 30,764$ -$
1,836$ 4,935$ 230,76310,753CONG. DIST (09)54,359$
273,133$ 126,680$ 2,527$ 18,015$ -$ 2,778$ 6,010$
117,12312,613MASSACHUSETTS (Totals)374,809$
2,371,613$ 985,894$ 20,552$ 192,975$ -$ 32,546$
41,235$ 1,098,41284,345Notes:* Veteran population
estimates, as of September 30, 2013, are produced by the VA
Office of the Actuary (VetPop 2011).# Prior to FY 08, "Loan
Guaranty" expenditures were included in the Education &
Vocational Rehabilitation and Employment (E&VRE) programs.
Currently, all "Loan Guaranty" expenditures are attributed to
Travis County, TX, where all Loan Guaranty payments are
processed. VA will continue to improve data collection for
future GDX reports to better distribute loan expenditures at the
state, county and congressional district levels.** Unique
patients are patients who received treatment at a VA health care
facility. Data are provided by the Allocation Resource Center
(ARC).Expenditure data sources: USASpending.gov for
Compensation & Pension (C&P) and Education and Vocational
Rehabilitation and Employment (EVRE) Benefits; Veterans
Benefits Administration Insurance Center for the Insurance
costs; the VA Financial Management System (FMS) for
Construction, Medical Research, General Operating Expenses,
and certain C&P and Readjustment data; and the Allocation
Resource Center (ARC) for Medical Care costs.1. Expenditures
are rounded to the nearest thousand dollars. For example, $500
to $1,000 are rounded to $1; $0 to $499 are rounded to $0; and
"$ -" = 0 or no expenditures.2. The Compensation & Pension
expenditures include dollars for the following programs:
veterans' compensation for service-connected disabilities;
dependency and indemnity compensation for service-connected
deaths; veterans' pension for nonservice-connected disabilities;
and burial and other benefits to veterans and their survivors.3.
Medical Care expenditures include dollars for medical services,
medical administration, facility maintenance, educational
support, research support, and other overhead items. Medical
Care expenditures do not include dollars for construction or
other non-medical support.4. Medical Care expenditures are
based on where patients live instead of where care is
delivered.5. A star symbol (*) in the Unique Patients column
denotes that there were less than 10 Unique Patients.
&"Arial,Bold"&11FY13 GEOGRAPHIC DISTRIBUTION OF
VA EXPENDITURES (GDX)
&8&P of &N
MDFY13 Summary of Expenditures by StateExpenditures in
$000sCounty/ Congressional DistrictVeteran Population*Total
ExpenditureCompensation & PensionConstructionEducation &
Vocational Rehabilitation/ EmploymentLoan Guaranty#General
Operating ExpensesInsurance & IndemnitiesMedical
CareUnique Patients**ALLEGANY7,037$ 38,341$ 17,911$
-$ 1,367$ -$ -$ 358$ 18,7052,273ANNE
ARUNDEL55,542$ 264,854$ 131,305$ -$ 52,565$ -$ -$
4,561$ 76,4237,893BALTIMORE59,431$ 267,966$
106,586$ -$ 27,476$ -$ -$ 6,323$
127,58211,568CALVERT9,419$ 33,553$ 18,913$ -$
7,868$ -$ -$ 997$ 5,775944CAROLINE2,871$ 12,302$
5,011$ -$ 899$ -$ -$ 290$ 6,103589CARROLL14,002$
39,324$ 21,382$ -$ 6,052$ -$ -$ 1,073$
10,8171,443CECIL9,481$ 94,601$ 22,668$ -$ 3,497$ -$
2,790$ 518$ 65,1282,398CHARLES18,025$ 101,907$
56,928$ -$ 24,768$ -$ -$ 1,449$
18,7622,697DORCHESTER2,859$ 15,993$ 5,844$ -$ 523$
-$ -$ 103$ 9,523968FREDERICK19,296$ 86,040$
42,989$ -$ 15,420$ -$ -$ 2,405$
25,2272,870GARRETT2,562$ 11,821$ 6,933$ -$ 397$ -$
-$ 163$ 4,329708HARFORD23,309$ 126,244$ 60,920$ -
$ 14,664$ -$ -$ 1,800$ 48,8614,324HOWARD20,988$
79,131$ 40,118$ -$ 18,890$ -$ -$ 2,072$
18,0512,208KENT1,933$ 6,795$ 3,615$ -$ 507$ -$ -$
57$ 2,617305MONTGOMERY46,136$ 193,803$ 94,031$ -
$ 39,971$ -$ -$ 9,601$ 50,2005,298PRINCE
GEORGE'S62,744$ 471,570$ 215,943$ -$ 70,287$ -$ -$
4,451$ 180,88914,367QUEEN ANNE'S4,688$ 13,873$
6,054$ -$ 1,604$ -$ -$ 607$ 5,609580ST.
MARY'S13,859$ 62,740$ 34,451$ -$ 16,210$ -$ -$
904$ 11,1751,689SOMERSET2,290$ 10,246$ 5,061$ -$
529$ -$ -$ 238$ 4,417503TALBOT4,009$ 13,960$
6,376$ -$ 659$ -$ -$ 418$
6,508762WASHINGTON12,884$ 69,652$ 28,462$ -$
5,141$ -$ -$ 1,000$ 35,0493,000WICOMICO8,479$
36,177$ 16,083$ -$ 2,854$ -$ -$ 533$
16,7071,746WORCESTER5,352$ 16,667$ 8,471$ -$
1,196$ -$ -$ 401$ 6,600964BALTIMORE (CITY)35,881$
385,997$ 91,173$ 7,521$ 20,600$ -$ 21,935$ 2,192$
242,57712,086MARYLAND (Totals)443,076$ 2,453,557$
1,047,226$ 7,521$ 333,943$ -$ 24,725$ 42,512$
997,63082,183CONG. DIST (01)65,453$ 286,761$ 112,904$
-$ 20,805$ -$ 2,790$ 5,217$ 145,04411,861CONG. DIST
(02)58,824$ 334,469$ 143,587$ -$ 41,168$ -$ -$
4,055$ 145,66012,698CONG. DIST (03)53,086$ 241,477$
106,758$ -$ 39,640$ -$ -$ 5,882$ 89,1978,516CONG.
DIST (04)53,761$ 384,324$ 178,783$ -$ 60,842$ -$ -$
4,350$ 140,34911,305CONG. DIST (05)72,979$ 380,223$
194,164$ -$ 76,991$ -$ -$ 5,953$ 103,11511,192CONG.
DIST (06)47,256$ 221,080$ 103,229$ -$ 26,600$ -$ -$
5,273$ 85,9789,249CONG. DIST (07)48,621$ 423,599$
117,687$ 7,521$ 32,792$ -$ 21,935$ 4,124$
239,54112,300CONG. DIST (08)43,096$ 181,624$ 90,116$
-$ 35,103$ -$ -$ 7,658$ 48,7475,062MARYLAND
(Totals)443,076$ 2,453,557$ 1,047,226$ 7,521$ 333,943$
-$ 24,725$ 42,512$ 997,63082,183Notes:* Veteran
population estimates, as of September 30, 2013, are produced by
the VA Office of the Actuary (VetPop 2011).# Prior to FY 08,
"Loan Guaranty" expenditures were included in the Education &
Vocational Rehabilitation and Employment (E&VRE) programs.
Currently, all "Loan Guaranty" expenditures are attributed to
Travis County, TX, where all Loan Guaranty payments are
processed. VA will continue to improve data collection for
future GDX reports to better distribute loan expenditures at the
state, county and congressional district levels.** Unique
patients are patients who received treatment at a VA health care
facility. Data are provided by the Allocation Resource Center
(ARC).Expenditure data sources: USASpending.gov for
Compensation & Pension (C&P) and Education and Vocational
Rehabilitation and Employment (EVRE) Benefits; Veterans
Benefits Administration Insurance Center for the Insurance
costs; the VA Financial Management System (FMS) for
Construction, Medical Research, General Operating Expenses,
and certain C&P and Readjustment data; and the Allocation
Resource Center (ARC) for Medical Care costs.1. Expenditures
are rounded to the nearest thousand dollars. For example, $500
to $1,000 are rounded to $1; $0 to $499 are rounded to $0; and
"$ -" = 0 or no expenditures.2. The Compensation & Pension
expenditures include dollars for the following programs:
veterans' compensation for service-connected disabilities;
dependency and indemnity compensation for service-connected
deaths; veterans' pension for nonservice-connected disabilities;
and burial and other benefits to veterans and their survivors.3.
Medical Care expenditures include dollars for medical services,
medical administration, facility maintenance, educational
support, research support, and other overhead items. Medical
Care expenditures do not include dollars for construction or
other non-medical support.4. Medical Care expenditures are
based on where patients live instead of where care is
delivered.5. A star symbol (*) in the Unique Patients column
denotes that there were less than 10 Unique Patients.
&"Arial,Bold"&11FY13 GEOGRAPHIC DISTRIBUTION OF
VA EXPENDITURES (GDX)
&8&P of &N
MEFY13 Summary of Expenditures by StateExpenditures in
$000sCounty/ Congressional DistrictVeteran Population*Total
ExpenditureCompensation & PensionConstructionEducation &
Vocational Rehabilitation/ EmploymentLoan Guaranty#General
Operating ExpensesInsurance & IndemnitiesMedical
CareUnique Patients**ANDROSCOGGIN10,174$ 65,306$
35,702$ -$ 3,759$ -$ -$ 493$
25,3513,361AROOSTOOK7,609$ 59,966$ 35,851$ -$
1,264$ -$ -$ 687$ 22,1633,142CUMBERLAND22,482$
112,594$ 64,634$ -$ 9,140$ -$ -$ 1,989$
36,8325,357FRANKLIN2,870$ 19,702$ 10,799$ -$ 753$
-$ -$ 103$ 8,0471,077HANCOCK5,787$ 27,989$
16,243$ -$ 1,160$ -$ -$ 554$
10,0321,428KENNEBEC12,294$ 153,444$ 60,884$ 7$
4,827$ -$ 18,277$ 846$ 68,6034,943KNOX4,054$
25,364$ 13,081$ -$ 433$ -$ -$ 433$
11,4171,213LINCOLN3,751$ 25,118$ 13,351$ -$ 666$ -
$ -$ 406$ 10,6951,254OXFORD5,973$ 36,124$ 19,315$
-$ 1,040$ -$ -$ 367$ 15,4011,953PENOBSCOT14,707$
104,524$ 59,577$ -$ 7,174$ -$ -$ 737$
37,0364,684PISCATAQUIS2,092$ 17,190$ 9,937$ -$ 362$
-$ -$ 68$ 6,824822SAGADAHOC4,260$ 26,536$
16,273$ -$ 1,460$ -$ -$ 297$
8,5061,072SOMERSET4,905$ 45,238$ 22,942$ -$ 906$ -
$ -$ 306$ 21,0831,987WALDO3,653$ 28,335$ 15,001$
-$ 942$ -$ -$ 163$ 12,2291,204WASHINGTON3,654$
31,310$ 18,865$ -$ 723$ -$ -$ 542$
11,1801,413YORK19,429$ 94,385$ 54,943$ -$ 7,968$ -$
-$ 1,466$ 30,0084,448MAINE (Totals)127,694$ 873,125$
467,398$ 7$ 42,577$ -$ 18,277$ 9,459$
335,40839,358CONG. DIST (01)61,463$ 395,284$ 204,420$
7$ 23,006$ -$ 18,277$ 5,374$ 144,19816,445CONG.
DIST (02)66,232$ 477,842$ 262,977$ -$ 19,570$ -$ -$
4,085$ 191,20922,913MAINE (Totals)127,694$ 873,125$
467,398$ 7$ 42,577$ -$ 18,277$ 9,459$
335,40839,358Notes:* Veteran population estimates, as of
September 30, 2013, are produced by the VA Office of the
Actuary (VetPop 2011).# Prior to FY 08, "Loan Guaranty"
expenditures were included in the Education & Vocational
Rehabilitation and Employment (E&VRE) programs.
Currently, all "Loan Guaranty" expenditures are attributed to
Travis County, TX, where all Loan Guaranty payments are
processed. VA will continue to improve data collection for
future GDX reports to better distribute loan expenditures at the
state, county and congressional district levels.** Unique
patients are patients who received treatment at a VA health care
facility. Data are provided by the Allocation Resource Center
(ARC).Expenditure data sources: USASpending.gov for
Compensation & Pension (C&P) and Education and Vocational
Rehabilitation and Employment (EVRE) Benefits; Veterans
Benefits Administration Insurance Center for the Insurance
costs; the VA Financial Management System (FMS) for
Construction, Medical Research, General Operating Expenses,
and certain C&P and Readjustment data; and the Allocation
Resource Center (ARC) for Medical Care costs.1. Expenditures
are rounded to the nearest thousand dollars. For example, $500
to $1,000 are rounded to $1; $0 to $499 are rounded to $0; and
"$ -" = 0 or no expenditures.2. The Compensation & Pension
expenditures include dollars for the following programs:
veterans' compensation for service-connected disabilities;
dependency and indemnity compensation for service-connected
deaths; veterans' pension for nonservice-connected disabilities;
and burial and other benefits to veterans and their survivors.3.
Medical Care expenditures include dollars for medical services,
medical administration, facility maintenance, educational
support, research support, and other overhead items. Medical
Care expenditures do not include dollars for construction or
other non-medical support.4. Medical Care expenditures are
based on where patients live instead of where care is
delivered.5. A star symbol (*) in the Unique Patients column
denotes that there were less than 10 Unique Patients.
&"Arial,Bold"&11FY13 GEOGRAPHIC DISTRIBUTION OF
VA EXPENDITURES (GDX)
&8&P of &N
MIFY13 Summary of Expenditures by StateExpenditures in
$000sCounty/ Congressional DistrictVeteran Population*Total
ExpenditureCompensation & PensionConstructionEducation &
Vocational Rehabilitation/ EmploymentLoan Guaranty#General
Operating ExpensesInsurance & IndemnitiesMedical
CareUnique Patients**ALCONA1,666$ 8,991$ 4,552$ -$
194$ -$ -$ 116$ 4,129524ALGER941$ 6,206$ 3,606$ -
$ 159$ -$ -$ 29$ 2,412375ALLEGAN7,424$ 29,514$
15,004$ -$ 2,041$ -$ -$ 293$
12,1761,560ALPENA2,936$ 13,838$ 7,007$ -$ 591$ -$
-$ 156$ 6,084978ANTRIM2,328$ 10,242$ 6,191$ -$
360$ -$ -$ 116$ 3,574561ARENAC1,557$ 9,994$
5,747$ -$ 279$ -$ -$ 65$ 3,903406BARAGA764$
4,610$ 2,373$ -$ 133$ -$ -$ 45$
2,059289BARRY4,870$ 19,718$ 9,606$ -$ 850$ -$ -$
158$ 9,1041,090BAY9,064$ 44,907$ 24,794$ -$ 2,246$
-$ -$ 312$ 17,5552,137BENZIE1,724$ 8,009$ 4,635$ -$
297$ -$ -$ 103$ 2,974452BERRIEN12,558$ 54,692$
28,914$ -$ 3,025$ -$ -$ 1,002$
21,7502,976BRANCH3,414$ 19,721$ 9,422$ -$ 505$ -$
-$ 251$ 9,543869CALHOUN11,297$ 103,187$ 37,854$ -
$ 3,543$ -$ -$ 613$ 61,1773,452CASS4,478$ 15,117$
6,862$ -$ 629$ -$ -$ 149$
7,4771,216CHARLEVOIX2,368$ 7,834$ 4,816$ -$ 290$
-$ -$ 123$ 2,605550CHEBOYGAN2,525$ 17,144$
10,286$ -$ 425$ -$ -$ 140$ 6,293810CHIPPEWA3,685$
20,114$ 11,754$ -$ 1,102$ -$ -$ 112$
7,1471,006CLARE3,321$ 22,935$ 11,404$ -$ 673$ -$
1,137$ 148$ 9,572988CLINTON4,817$ 17,751$ 11,533$
-$ 1,634$ -$ -$ 472$ 4,111667CRAWFORD1,592$
8,869$ 4,519$ -$ 305$ -$ -$ 33$
4,012461DELTA3,823$ 33,249$ 16,518$ -$ 906$ -$ -$
121$ 15,7041,542DICKINSON2,525$ 36,053$ 10,154$
17$ 503$ -$ 1,574$ 79$ 23,7281,374EATON8,388$
36,818$ 22,201$ -$ 2,847$ -$ -$ 397$
11,3741,388EMMET2,886$ 11,555$ 7,485$ -$ 544$ -$ -
$ 191$ 3,336627GENESEE30,138$ 130,289$ 75,487$ -$
10,008$ -$ -$ 1,599$ 43,1954,773GLADWIN2,714$
17,371$ 9,136$ -$ 321$ -$ -$ 189$
7,726751GOGEBIC1,764$ 12,689$ 5,293$ -$ 408$ -$ -$
148$ 6,839782GRAND TRAVERSE6,947$ 34,104$ 20,179$
-$ 2,865$ -$ -$ 517$ 10,5431,603GRATIOT2,837$
17,524$ 10,453$ -$ 636$ -$ -$ 147$
6,288734HILLSDALE3,415$ 18,055$ 8,638$ -$ 710$ -$
-$ 149$ 8,558897HOUGHTON2,886$ 19,217$ 8,961$ -$
1,594$ -$ -$ 234$ 8,4281,016HURON2,611$ 14,977$
8,523$ -$ 364$ -$ -$ 316$ 5,773792INGHAM15,009$
68,814$ 35,246$ -$ 7,890$ -$ -$ 1,357$
24,3212,934IONIA4,509$ 15,840$ 8,933$ -$ 834$ -$ -$
128$ 5,945789IOSCO3,413$ 19,758$ 10,202$ -$ 373$ -
$ -$ 89$ 9,0941,054IRON1,320$ 14,562$ 5,234$ -$
131$ -$ -$ 120$ 9,077663ISABELLA3,538$ 18,387$
8,820$ -$ 2,469$ -$ -$ 122$
6,976822JACKSON11,969$ 58,983$ 29,701$ -$ 3,022$ -
$ -$ 834$ 25,4262,836KALAMAZOO15,396$ 84,662$
33,172$ 5,994$ 6,836$ -$ 4,257$ 990$
33,4113,271KALKASKA1,798$ 9,556$ 5,133$ -$ 387$ -
$ -$ 54$ 3,983463KENT33,576$ 152,391$ 86,050$ -$
15,001$ -$ -$ 2,082$ 49,2597,996KEWEENAW254$
1,041$ 561$ -$ 23$ -$ -$ 3$ 45488LAKE1,462$
7,395$ 4,024$ -$ 108$ -$ -$ 13$
3,250372LAPEER6,881$ 26,444$ 16,397$ -$ 1,380$ -$
-$ 349$ 8,3191,239LEELANAU2,007$ 6,009$ 3,639$ -$
193$ -$ -$ 208$ 1,968437LENAWEE7,486$ 41,277$
19,891$ -$ 2,599$ -$ -$ 210$
18,5771,911LIVINGSTON12,386$ 48,784$ 24,018$ -$
2,656$ -$ -$ 700$ 21,4102,118LUCE639$ 3,255$
2,117$ -$ 87$ -$ -$ 12$ 1,040132MACKINAC1,073$
6,562$ 3,700$ -$ 164$ -$ -$ 53$
2,645323MACOMB55,655$ 232,476$ 139,827$ -$ 17,736$
-$ -$ 3,689$ 71,2248,763MANISTEE2,585$ 11,507$
7,243$ -$ 310$ -$ -$ 121$
3,832636MARQUETTE6,420$ 45,080$ 27,196$ -$ 2,722$
-$ -$ 510$ 14,6521,968MASON2,595$ 10,944$ 6,839$ -
$ 343$ -$ -$ 260$ 3,502549MECOSTA3,212$ 14,087$
7,868$ -$ 1,526$ -$ -$ 145$
4,547625MENOMINEE2,273$ 18,008$ 7,615$ -$ 355$ -$
-$ 127$ 9,9111,029MIDLAND6,294$ 31,529$ 16,514$ -$
1,982$ -$ -$ 648$ 12,3851,454MISSAUKEE1,244$
6,596$ 3,246$ -$ 234$ -$ -$ 161$
2,955348MONROE11,437$ 45,225$ 23,473$ -$ 2,640$ -$
-$ 401$ 18,7112,055MONTCALM4,926$ 22,694$ 13,604$
-$ 1,312$ -$ -$ 216$ 7,5621,023MONTMORENCY1,177$
8,052$ 4,522$ -$ 237$ -$ -$ 23$
3,269349MUSKEGON13,543$ 59,479$ 34,946$ -$ 3,785$
-$ -$ 621$ 20,1273,203NEWAYGO4,063$ 20,317$
12,325$ -$ 883$ -$ -$ 142$
6,9681,077OAKLAND65,420$ 283,834$ 155,425$ 2$
21,630$ -$ 2,014$ 7,126$ 97,63710,955OCEANA2,377$
10,282$ 6,568$ -$ 529$ -$ -$ 150$
3,035515OGEMAW2,268$ 14,675$ 7,520$ -$ 311$ -$ -
$ 106$ 6,738679ONTONAGON953$ 7,759$ 3,380$ -$
159$ -$ -$ 57$ 4,164415OSCEOLA2,159$ 11,276$
6,150$ -$ 429$ -$ -$ 91$ 4,606531OSCODA1,128$
5,408$ 2,376$ -$ 42$ -$ -$ 71$
2,918304OTSEGO2,198$ 10,042$ 5,632$ -$ 392$ -$ -$
120$ 3,898556OTTAWA15,117$ 50,529$ 29,999$ -$
4,880$ -$ -$ 1,042$ 14,6072,886PRESQUE ISLE1,543$
8,689$ 4,767$ -$ 278$ -$ -$ 105$
3,539531ROSCOMMON2,873$ 16,269$ 8,985$ -$ 492$ -
$ -$ 95$ 6,697777SAGINAW13,948$ 83,934$ 40,687$ -
$ 3,055$ -$ 1,822$ 870$ 37,5003,918ST. CLAIR13,133$
57,420$ 34,327$ -$ 3,173$ -$ -$ 1,072$
18,8483,271ST. JOSEPH4,467$ 20,015$ 9,901$ -$ 797$ -
$ -$ 303$ 9,013975SANILAC3,057$ 15,710$ 8,768$ -$
488$ -$ -$ 131$ 6,3221,012SCHOOLCRAFT878$ 6,629$
3,635$ -$ 79$ -$ -$ 51$ 2,864312SHIAWASSEE5,528$
24,917$ 12,827$ -$ 1,741$ -$ -$ 327$
10,0221,048TUSCOLA4,629$ 23,193$ 11,963$ -$ 843$ -
$ -$ 269$ 10,1181,059VAN BUREN6,077$ 26,242$
14,131$ -$ 1,412$ -$ -$ 211$
10,4881,219WASHTENAW17,495$ 127,309$ 33,705$ 143$
10,797$ -$ 9,614$ 1,469$ 71,5813,514WAYNE100,230$
606,639$ 239,741$ 29$ 37,097$ -$ 30,873$ 7,303$
291,59723,366WEXFORD2,891$ 16,181$ 8,938$ -$ 731$
-$ -$ 82$ 6,431788MICHIGAN (Totals)660,773$
3,361,961$ 1,675,388$ 6,185$ 208,565$ -$ 51,291$
43,961$ 1,376,571146,804CONG. DIST (01)68,357$
417,515$ 216,689$ 17$ 16,316$ -$ 1,574$ 3,962$
178,95821,335CONG. DIST (02)47,084$ 196,333$ 115,600$
-$ 14,343$ -$ -$ 2,760$ 63,63010,646CONG. DIST
(03)45,960$ 252,922$ 120,915$ -$ 16,440$ -$ -$
2,415$ 113,15311,180CONG. DIST (04)54,634$ 278,484$
150,031$ -$ 15,462$ -$ 1,137$ 3,254$
108,60112,689CONG. DIST (05)53,321$ 268,186$ 146,704$
-$ 15,183$ -$ 1,822$ 2,702$ 101,77611,109CONG. DIST
(06)50,253$ 229,623$ 107,673$ 5,994$ 14,688$ -$
4,257$ 2,932$ 94,07811,184CONG. DIST (07)52,572$
248,472$ 123,275$ -$ 15,521$ -$ -$ 2,695$
106,98111,128CONG. DIST (08)39,751$ 155,454$ 79,922$
-$ 13,413$ -$ -$ 3,347$ 58,7716,872CONG. DIST
(09)45,605$ 208,812$ 123,468$ -$ 15,969$ -$ -$
3,603$ 65,7737,456CONG. DIST (10)50,850$ 200,665$
117,925$ -$ 11,254$ -$ -$ 3,802$ 67,68310,190CONG.
DIST (11)38,811$ 135,012$ 67,822$ -$ 9,719$ -$ -$
4,533$ 52,9386,036CONG. DIST (12)39,032$ 188,825$
70,371$ 143$ 14,826$ -$ 9,614$ 3,033$
90,8387,583CONG. DIST (13)38,489$ 312,343$ 116,494$
29$ 18,026$ -$ 30,873$ 1,828$ 145,09410,742CONG.
DIST (14)36,055$ 269,315$ 118,501$ 2$ 17,404$ -$
2,014$ 3,096$ 128,2988,654MICHIGAN (Totals)660,773$
3,361,961$ 1,675,388$ 6,185$ 208,565$ -$ 51,291$
43,961$ 1,376,571146,804Notes:* Veteran population
estimates, as of September 30, 2013, are produced by the VA
Office of the Actuary (VetPop 2011).# Prior to FY 08, "Loan
Guaranty" expenditures were included in the Education &
Vocational Rehabilitation and Employment (E&VRE) programs.
Currently, all "Loan Guaranty" expenditures are attributed to
Travis County, TX, where all Loan Guaranty payments are
processed. VA will continue to improve data collection for
future GDX reports to better distribute loan expenditures at the
state, county and congressional district levels.** Unique
patients are patients who received treatment at a VA health care
facility. Data are provided by the Allocation Resource Center
(ARC).Expenditure data sources: USASpending.gov for
Compensation & Pension (C&P) and Education and Vocational
Rehabilitation and Employment (EVRE) Benefits; Veterans
Benefits Administration Insurance Center for the Insurance
costs; the VA Financial Management System (FMS) for
Construction, Medical Research, General Operating Expenses,
and certain C&P and Readjustment data; and the Allocation
Resource Center (ARC) for Medical Care costs.1. Expenditures
are rounded to the nearest thousand dollars. For example, $500
to $1,000 are rounded to $1; $0 to $499 are rounded to $0; and
"$ -" = 0 or no expenditures.2. The Compensation & Pension
expenditures include dollars for the following programs:
veterans' compensation for service-connected disabilities;
dependency and indemnity compensation for service-connected
deaths; veterans' pension for nonservice-connected disabilities;
and burial and other benefits to veterans and their survivors.3.
Medical Care expenditures include dollars for medical services,
medical administration, facility maintenance, educational
support, research support, and other overhead items. Medical
Care expenditures do not include dollars for construction or
other non-medical support.4. Medical Care expenditures are
based on where patients live instead of where care is
delivered.5. A star symbol (*) in the Unique Patients column
denotes that there were less than 10 Unique Patients.
&"Arial,Bold"&11FY13 GEOGRAPHIC DISTRIBUTION OF
VA EXPENDITURES (GDX)
&8&P of &N
MNFY13 Summary of Expenditures by StateExpenditures in
$000sCounty/ Congressional DistrictVeteran Population*Total
ExpenditureCompensation & PensionConstructionEducation &
Vocational Rehabilitation/ EmploymentLoan Guaranty#General
Operating ExpensesInsurance & IndemnitiesMedical
CareUnique Patients**AITKIN1,731$ 14,476$ 6,739$ -$
79$ -$ -$ 101$ 7,557945ANOKA22,848$ 131,906$
55,646$ -$ 9,123$ -$ -$ 1,148$
65,9896,958BECKER2,900$ 20,865$ 9,703$ -$ 519$ -$
-$ 157$ 10,4861,188BELTRAMI3,155$ 26,151$ 13,993$
-$ 1,257$ -$ -$ 413$ 10,4871,261BENTON3,150$
27,285$ 8,903$ -$ 738$ -$ -$ 204$ 17,4401,411BIG
STONE441$ 3,442$ 1,872$ -$ 100$ -$ -$ 47$
1,423270BLUE EARTH4,406$ 24,104$ 10,941$ -$ 2,855$
-$ -$ 698$ 9,6101,223BROWN1,866$ 13,584$ 7,361$ -
$ 689$ -$ -$ 153$ 5,381864CARLTON3,211$ 22,074$
13,150$ -$ 933$ -$ -$ 138$ 7,853956CARVER4,930$
19,979$ 8,791$ -$ 1,705$ -$ -$ 419$
9,0631,028CASS3,347$ 24,107$ 12,286$ -$ 221$ -$ -$
258$ 11,3431,489CHIPPEWA838$ 6,603$ 2,519$ -$
168$ -$ -$ 34$ 3,882527CHISAGO4,221$ 24,091$
13,191$ -$ 1,515$ -$ -$ 168$ 9,2171,058CLAY4,150$
33,302$ 12,149$ -$ 1,732$ -$ -$ 284$
19,1371,639CLEARWATER767$ 6,708$ 3,076$ -$ 111$
-$ -$ 5$ 3,516395COOK511$ 2,377$ 1,480$ -$ 18$ -
$ -$ 96$ 783110COTTONWOOD798$ 5,752$ 2,472$ -$
30$ -$ -$ 155$ 3,094366CROW WING5,759$ 51,221$
26,268$ -$ 1,548$ -$ -$ 535$
22,8702,866DAKOTA27,070$ 158,857$ 68,130$ -$
13,707$ -$ -$ 2,404$ 74,6176,846DODGE1,194$ 5,799$
3,062$ -$ 366$ -$ -$ 74$ 2,297356DOUGLAS3,109$
21,467$ 11,058$ -$ 630$ -$ -$ 204$
9,5751,483FARIBAULT1,301$ 7,828$ 3,427$ -$ 380$ -$
-$ 148$ 3,873404FILLMORE1,523$ 7,769$ 4,136$ -$
409$ -$ -$ 126$ 3,099430FREEBORN2,507$ 15,683$
7,108$ -$ 515$ -$ -$ 231$ 7,829944GOODHUE3,834$
19,500$ 8,434$ -$ 939$ -$ -$ 227$
9,900953GRANT500$ 4,506$ 2,101$ -$ 84$ -$ -$ 32$
2,289238HENNEPIN61,511$ 459,706$ 133,259$ 8,678$
30,560$ -$ 80,331$ 7,797$
199,08115,685HOUSTON1,575$ 8,272$ 4,757$ -$ 464$ -
$ -$ 91$ 2,960665HUBBARD2,263$ 15,579$ 7,752$ -$
238$ -$ -$ 102$ 7,487877ISANTI3,053$ 19,237$
8,093$ -$ 882$ -$ -$ 170$ 10,0921,159ITASCA4,618$
29,168$ 16,255$ -$ 772$ -$ -$ 384$
11,7561,750JACKSON853$ 4,260$ 1,848$ -$ 73$ -$ -$
47$ 2,293298KANABEC1,416$ 10,597$ 4,798$ -$ 122$
-$ -$ 51$ 5,626629KANDIYOHI2,672$ 19,875$ 9,978$
-$ 488$ -$ -$ 282$ 9,1271,315KITTSON416$ 2,078$
991$ -$ 44$ -$ -$ 15$ 1,028177KOOCHICHING1,254$
6,783$ 3,562$ -$ 75$ -$ -$ 76$ 3,071371LAC QUI
PARLE570$ 4,367$ 1,996$ -$ 15$ -$ -$ 102$
2,253308LAKE1,226$ 7,710$ 4,595$ -$ 128$ -$ -$
133$ 2,854384LAKE OF THE WOODS497$ 2,783$ 1,305$
-$ 9$ -$ -$ 93$ 1,376158LE SUEUR1,969$ 11,366$
4,516$ -$ 344$ -$ -$ 101$ 6,405667LINCOLN460$
2,994$ 1,188$ -$ 56$ -$ -$ 34$ 1,717173LYON1,707$
9,431$ 4,335$ -$ 586$ -$ -$ 132$
4,378569MCLEOD2,880$ 14,937$ 6,788$ -$ 640$ -$ -$
262$ 7,2461,046MAHNOMEN406$ 3,370$ 1,754$ -$ 34$
-$ -$ 1$ 1,582213MARSHALL694$ 4,748$ 2,111$ -$
89$ -$ -$ 133$ 2,415349MARTIN1,703$ 12,267$
6,254$ -$ 303$ -$ -$ 204$ 5,507757MEEKER1,882$
12,559$ 5,780$ -$ 408$ -$ -$ 143$ 6,228767MILLE
LACS2,387$ 24,126$ 12,193$ -$ 733$ -$ -$ 143$
11,0581,075MORRISON2,809$ 30,164$ 14,910$ -$ 976$
-$ -$ 133$ 14,1441,652MOWER2,845$ 16,234$ 8,993$
-$ 550$ -$ -$ 227$ 6,464820MURRAY674$ 4,375$
1,727$ -$ 99$ -$ -$ 98$ 2,451319NICOLLET2,120$
12,297$ 6,008$ -$ 995$ -$ -$ 151$
5,144773NOBLES1,378$ 6,874$ 2,481$ -$ 306$ -$ -$
157$ 3,930522NORMAN590$ 4,479$ 2,005$ -$ 132$ -$
-$ 8$ 2,334252OLMSTED10,205$ 34,293$ 16,436$ -$
3,093$ -$ -$ 856$ 13,9091,860OTTER TAIL5,207$
36,955$ 17,701$ -$ 905$ -$ -$ 564$
17,7842,228PENNINGTON973$ 6,298$ 3,053$ -$ 266$ -
$ -$ 67$ 2,912337PINE2,813$ 18,957$ 9,881$ -$ 578$
-$ -$ 152$ 8,346904PIPESTONE650$ 3,238$ 1,067$ -$
136$ -$ -$ 26$ 2,009237POLK2,533$ 13,283$ 6,053$
-$ 756$ -$ -$ 186$ 6,288944POPE881$ 5,965$ 2,941$
-$ 173$ -$ -$ 65$ 2,785420RAMSEY27,709$ 153,695$
60,852$ 21$ 13,956$ -$ -$ 3,365$ 75,5016,669RED
LAKE358$ 1,774$ 833$ -$ 54$ -$ -$ 9$
877115REDWOOD1,116$ 8,577$ 4,630$ -$ 243$ -$ -$
180$ 3,523442RENVILLE1,148$ 7,599$ 4,428$ -$ 186$
-$ -$ 104$ 2,882481RICE4,393$ 19,711$ 9,267$ -$
1,287$ -$ -$ 815$ 8,342953ROCK643$ 4,774$ 2,207$
-$ 152$ -$ -$ 100$ 2,316305ROSEAU1,012$ 5,296$
3,006$ -$ 104$ -$ -$ 53$ 2,133399ST. LOUIS18,340$
94,094$ 50,381$ -$ 5,767$ -$ -$ 1,469$
36,4765,303SCOTT7,258$ 43,147$ 18,291$ -$ 3,453$ -$
-$ 711$ 20,6931,990SHERBURNE6,101$ 48,335$ 22,176$
-$ 3,619$ -$ -$ 423$ 22,1172,359SIBLEY1,172$ 5,607$
2,608$ -$ 237$ -$ -$ 84$ 2,679376STEARNS9,950$
138,352$ 44,816$ 6,900$ 4,345$ -$ 1,695$ 1,044$
79,5525,620STEELE2,705$ 12,193$ 6,323$ -$ 662$ -$ -
$ 224$ 4,985695STEVENS504$ 2,616$ 1,393$ -$ 85$
-$ -$ 21$ 1,117227SWIFT886$ 5,714$ 2,852$ -$ 169$
-$ -$ 102$ 2,591346TODD2,080$ 15,884$ 6,640$ -$
137$ -$ -$ 131$ 8,9771,010TRAVERSE335$ 1,814$
1,032$ -$ 45$ -$ -$ 76$ 660126WABASHA1,798$
11,575$ 6,501$ -$ 356$ -$ -$ 172$
4,545635WADENA1,167$ 12,775$ 8,210$ -$ 261$ -$ -$
93$ 4,212629WASECA1,697$ 7,451$ 3,374$ -$ 368$ -$
-$ 160$ 3,549436WASHINGTON16,273$ 80,891$ 36,215$
-$ 7,780$ -$ -$ 1,254$ 35,6423,289WATONWAN867$
5,248$ 2,635$ -$ 124$ -$ -$ 112$
2,377384WILKIN465$ 3,362$ 1,300$ -$ 189$ -$ -$
40$ 1,834183WINONA3,561$ 14,264$ 6,922$ -$ 934$ -
$ -$ 256$ 6,152940WRIGHT8,703$ 46,233$ 21,129$ -$
2,528$ -$ -$ 630$ 21,9462,377YELLOW MEDICINE759$
6,922$ 3,232$ -$ 190$ -$ -$ 97$
3,403420MINNESOTA (Totals)360,754$ 2,336,965$
986,609$ 15,600$ 133,629$ -$ 82,027$ 33,370$
1,085,731113,577CONG. DIST (01)48,040$ 238,052$
115,042$ -$ 14,409$ -$ -$ 4,777$ 103,82414,084CONG.
DIST (02)44,607$ 256,263$ 111,980$ -$ 20,487$ -$ -$
3,873$ 119,92411,349CONG. DIST (03)39,046$ 171,848$
65,770$ -$ 14,274$ -$ -$ 5,117$ 86,6879,388CONG.
DIST (04)37,634$ 199,244$ 81,189$ 21$ 18,304$ -$ -$
4,329$ 95,4008,600CONG. DIST (05)34,076$ 347,940$
92,944$ 8,678$ 20,648$ -$ 80,331$ 3,503$
141,8359,445CONG. DIST (06)45,198$ 356,884$ 139,577$
6,900$ 19,070$ -$ 1,695$ 3,136$ 186,50516,301CONG.
DIST (07)50,861$ 351,192$ 162,113$ -$ 11,208$ -$ -$
4,253$ 173,61921,752CONG. DIST (08)61,293$ 415,542$
217,994$ -$ 15,230$ -$ -$ 4,381$
177,93722,658MINNESOTA (Totals)360,754$ 2,336,965$
986,609$ 15,600$ 133,629$ -$ 82,027$ 33,370$
1,085,731113,577Notes:* Veteran population estimates, as of
September 30, 2013, are produced by the VA Office of the
Actuary (VetPop 2011).# Prior to FY 08, "Loan Guaranty"
expenditures were included in the Education & Vocational
Rehabilitation and Employment (E&VRE) programs.
Currently, all "Loan Guaranty" expenditures are attributed to
Travis County, TX, where all Loan Guaranty payments are
processed. VA will continue to improve data collection for
future GDX reports to better distribute loan expenditures at the
state, county and congressional district levels.** Unique
patients are patients who received treatment at a VA health care
facility. Data are provided by the Allocation Resource Center
(ARC).Expenditure data sources: USASpending.gov for
Compensation & Pension (C&P) and Education and Vocational
Rehabilitation and Employment (EVRE) Benefits; Veterans
Benefits Administration Insurance Center for the Insurance
costs; the VA Financial Management System (FMS) for
Construction, Medical Research, General Operating Expenses,
and certain C&P and Readjustment data; and the Allocation
Resource Center (ARC) for Medical Care costs.1. Expenditures
are rounded to the nearest thousand dollars. For example, $500
to $1,000 are rounded to $1; $0 to $499 are rounded to $0; and
"$ -" = 0 or no expenditures.2. The Compensation & Pension
expenditures include dollars for the following programs:
veterans' compensation for service-connected disabilities;
dependency and indemnity compensation for service-connected
deaths; veterans' pension for nonservice-connected disabilities;
and burial and other benefits to veterans and their survivors.3.
Medical Care expenditures include dollars for medical services,
medical administration, facility maintenance, educational
support, research support, and other overhead items. Medical
Care expenditures do not include dollars for construction or
other non-medical support.4. Medical Care expenditures are
based on where patients live instead of where care is
delivered.5. A star symbol (*) in the Unique Patients column
denotes that there were less than 10 Unique Patients.
&"Arial,Bold"&11FY13 GEOGRAPHIC DISTRIBUTION OF
VA EXPENDITURES (GDX)
&8&P of &N
MOFY13 Summary of Expenditures by StateExpenditures in
$000sCounty/ Congressional DistrictVeteran Population*Total
ExpenditureCompensation & PensionConstructionEducation &
Vocational Rehabilitation/ EmploymentLoan Guaranty#General
Operating ExpensesInsurance & IndemnitiesMedical
CareUnique Patients**ADAIR1,387$ 8,711$ 4,250$ -$
478$ -$ -$ 38$ 3,946585ANDREW1,391$ 5,548$
2,422$ -$ 224$ -$ -$ 32$ 2,871399ATCHISON589$
2,079$ 1,154$ -$ 93$ -$ -$ 52$
780132AUDRAIN2,042$ 15,688$ 6,510$ -$ 251$ -$ -$
82$ 8,845950BARRY3,000$ 19,530$ 9,908$ -$ 432$ -$
-$ 173$ 9,0171,205BARTON1,046$ 4,996$ 2,885$ -$
165$ -$ -$ 30$ 1,917337BATES1,464$ 8,191$ 5,062$
-$ 305$ -$ -$ 42$ 2,782379BENTON2,508$ 22,697$
11,073$ -$ 193$ -$ -$ 55$
11,3761,081BOLLINGER1,123$ 6,370$ 3,058$ -$ 109$ -
$ -$ 27$ 3,176372BOONE10,702$ 94,541$ 33,034$
1,211$ 9,368$ -$ 2,261$ 1,078$
47,5893,559BUCHANAN7,339$ 39,100$ 18,519$ -$
2,278$ -$ -$ 572$ 17,7302,122BUTLER4,133$ 52,706$
18,935$ 88$ 1,231$ -$ 1,818$ 145$
30,4882,243CALDWELL881$ 5,513$ 2,809$ -$ 172$ -$
-$ 36$ 2,496340CALLAWAY4,294$ 26,513$ 13,265$ -$
1,217$ -$ -$ 226$ 11,8051,400CAMDEN4,805$ 28,602$
14,099$ -$ 757$ -$ -$ 213$ 13,5321,690CAPE
GIRARDEAU6,353$ 29,708$ 16,868$ -$ 1,990$ -$ -$
568$ 10,2811,811CARROLL870$ 5,311$ 2,699$ -$ 157$
-$ -$ 38$ 2,417292CARTER566$ 5,239$ 3,098$ -$
160$ -$ -$ 1$ 1,979204CASS9,629$ 45,853$ 22,523$ -
$ 3,153$ -$ -$ 714$ 19,4622,325CEDAR1,525$ 9,451$
5,402$ -$ 176$ -$ -$ 15$ 3,857547CHARITON767$
4,096$ 2,098$ -$ 74$ -$ -$ 30$
1,893286CHRISTIAN7,356$ 31,055$ 19,474$ -$ 2,256$ -
$ -$ 326$ 8,9991,936CLARK580$ 2,989$ 1,514$ -$
54$ -$ -$ 50$ 1,372202CLAY20,094$ 91,501$ 45,064$
-$ 7,060$ -$ -$ 853$ 38,5234,433CLINTON2,136$
11,465$ 5,951$ -$ 620$ -$ -$ 160$
4,735695COLE7,249$ 33,177$ 17,107$ -$ 2,222$ -$
41$ 234$ 13,5741,897COOPER1,272$ 11,305$ 4,354$ -$
262$ -$ -$ 108$ 6,582581CRAWFORD2,322$ 14,410$
7,625$ -$ 410$ -$ -$ 15$ 6,361747DADE895$ 3,630$
2,091$ -$ 100$ -$ -$ 5$ 1,434243DALLAS1,514$
11,414$ 6,533$ -$ 276$ -$ -$ 151$
4,453547DAVIESS746$ 6,046$ 1,972$ -$ 169$ -$ -$
52$ 3,854280DE KALB1,355$ 4,290$ 1,613$ -$ 122$ -
$ -$ 86$ 2,470292DENT1,414$ 10,501$ 5,665$ -$
239$ -$ -$ 51$ 4,547540DOUGLAS1,124$ 5,105$
3,705$ -$ 280$ -$ -$ 73$ 1,047147DUNKLIN2,203$
16,799$ 8,910$ -$ 315$ -$ -$ 84$
7,489811FRANKLIN8,370$ 36,313$ 20,230$ -$ 2,236$ -
$ -$ 249$ 13,5991,700GASCONADE1,541$ 8,677$
4,713$ -$ 175$ -$ -$ 35$ 3,754447GENTRY641$
3,590$ 1,443$ -$ 274$ -$ -$ 40$
1,833159GREENE24,334$ 105,031$ 59,800$ -$ 11,433$
-$ 404$ 2,093$ 31,3016,060GRUNDY863$ 5,122$
2,196$ -$ 160$ -$ -$ 88$ 2,677347HARRISON752$
4,688$ 1,840$ -$ 121$ -$ -$ 4$
2,722269HENRY2,545$ 16,857$ 10,258$ -$ 694$ -$ -$
213$ 5,692763HICKORY1,305$ 7,394$ 3,682$ -$ 123$
-$ -$ 31$ 3,559360HOLT510$ 1,878$ 910$ -$ 72$ -$
-$ 1$ 894121HOWARD933$ 6,380$ 2,434$ -$ 278$ -$
-$ 27$ 3,641313HOWELL3,734$ 25,630$ 13,782$ -$
901$ -$ -$ 318$ 10,6291,435IRON1,118$ 7,771$ 4,697$
-$ 234$ -$ -$ 20$ 2,819369JACKSON48,405$ 347,965$
133,131$ 2,786$ 18,791$ -$ 20,446$ 3,430$
169,38014,622JASPER9,791$ 49,189$ 27,496$ -$ 3,347$
-$ -$ 404$ 17,9422,846JEFFERSON20,711$ 80,034$
38,548$ -$ 6,051$ -$ -$ 637$
34,7983,708JOHNSON6,395$ 35,363$ 19,609$ -$ 6,450$
-$ -$ 59$ 9,2461,360KNOX342$ 6,286$ 1,409$ 61$
72$ -$ 1,227$ -$ 3,517173LACLEDE3,506$ 24,768$
15,367$ -$ 1,476$ -$ -$ 119$
7,8071,033LAFAYETTE2,984$ 16,470$ 8,376$ -$ 890$ -
$ -$ 97$ 7,106900LAWRENCE3,372$ 19,380$ 10,697$
-$ 606$ -$ -$ 159$ 7,9181,490LEWIS782$ 4,712$
2,335$ -$ 199$ -$ -$ 5$ 2,173278LINCOLN4,795$
18,286$ 8,638$ -$ 1,491$ -$ -$ 188$
7,969814LINN1,145$ 7,726$ 3,761$ -$ 117$ -$ -$ 75$
3,773485LIVINGSTON1,318$ 6,571$ 3,463$ -$ 252$ -$
-$ 76$ 2,780417MCDONALD1,595$ 9,221$ 3,832$ -$
408$ -$ -$ 28$ 4,953628MACON1,259$ 10,223$ 4,905$
-$ 188$ -$ -$ 106$ 5,024592MADISON1,130$ 9,945$
5,030$ -$ 148$ -$ -$ 73$ 4,695483MARIES918$
5,583$ 2,299$ -$ 181$ -$ -$ 24$
3,079328MARION2,562$ 14,256$ 6,981$ -$ 700$ -$ -$
210$ 6,365735MERCER362$ 2,165$ 1,001$ -$ 30$ -$
-$ 1$ 1,133129MILLER2,139$ 15,269$ 6,780$ -$ 423$
-$ -$ 77$ 7,988869MISSISSIPPI868$ 5,803$ 2,749$ -$
135$ -$ -$ 63$ 2,856355MONITEAU1,325$ 6,789$
3,394$ -$ 346$ -$ -$ 18$ 3,031364MONROE825$
6,778$ 3,163$ -$ 101$ -$ -$ 72$
3,442335MONTGOMERY1,189$ 6,791$ 3,085$ -$ 279$ -
$ -$ 165$ 3,261368MORGAN2,315$ 19,149$ 9,114$ -$
262$ -$ -$ 108$ 9,665967NEW MADRID1,529$ 9,551$
4,524$ -$ 202$ -$ -$ 17$ 4,808554NEWTON5,252$
21,955$ 10,529$ -$ 825$ -$ -$ 364$
10,2371,667NODAWAY1,441$ 6,703$ 3,420$ -$ 541$ -$
-$ 60$ 2,683352OREGON1,040$ 7,932$ 4,211$ -$ 105$
-$ -$ 6$ 3,611404OSAGE989$ 4,914$ 2,375$ -$ 268$
-$ -$ 31$ 2,240349OZARK1,077$ 5,512$ 3,479$ -$
147$ -$ -$ 48$ 1,838286PEMISCOT1,279$ 7,667$
4,324$ -$ 128$ -$ -$ 324$ 2,891367PERRY1,519$
6,064$ 3,834$ -$ 387$ -$ -$ 157$
1,687409PETTIS3,607$ 25,448$ 12,326$ -$ 1,403$ -$ -
$ 323$ 11,3961,265PHELPS4,592$ 36,202$ 21,366$ -$
2,313$ -$ -$ 315$ 12,2071,432PIKE1,783$ 7,659$
3,788$ -$ 243$ -$ -$ 132$ 3,496427PLATTE7,423$
44,525$ 21,331$ -$ 7,688$ -$ -$ 333$
15,1731,726POLK2,942$ 14,890$ 8,229$ -$ 776$ -$ -$
130$ 5,754904PULASKI7,899$ 93,174$ 61,295$ -$
14,517$ -$ -$ 185$ 17,1772,413PUTNAM453$ 2,789$
1,435$ -$ 59$ -$ -$ 32$ 1,263172RALLS841$ 7,568$
1,708$ -$ 113$ -$ 2,149$ 64$
3,534381RANDOLPH2,319$ 16,329$ 7,360$ -$ 618$ -$
-$ 91$ 8,260776RAY1,853$ 16,377$ 5,162$ 3,187$
279$ -$ 1,784$ 68$ 5,898633REYNOLDS699$ 5,328$
2,256$ -$ 69$ -$ -$ 5$ 2,999230RIPLEY1,299$
12,154$ 6,001$ -$ 192$ -$ -$ 73$ 5,888564ST.
CHARLES30,628$ 103,301$ 58,931$ -$ 12,156$ -$ -$
1,725$ 30,4893,862ST. CLAIR1,155$ 7,046$ 3,587$ -$
115$ -$ -$ 26$ 3,319370SAINTE GENEVIEVE1,613$
9,159$ 4,196$ -$ 305$ -$ -$ 31$ 4,627481ST.
FRANCOIS6,241$ 37,087$ 18,686$ -$ 1,688$ -$ -$
165$ 16,5471,851ST. LOUIS71,488$ 345,653$ 161,966$
525$ 29,439$ -$ 6,846$ 8,988$
137,88814,156SALINE1,612$ 11,576$ 5,550$ -$ 443$ -$
-$ 281$ 5,302571SCHUYLER324$ 1,635$ 867$ -$ 57$
-$ -$ 9$ 702123SCOTLAND363$ 7,094$ 1,058$ 1,063$
32$ -$ 2,317$ 22$ 2,603142SCOTT3,106$ 22,027$
12,565$ -$ 730$ -$ -$ 216$ 8,5161,117SHANNON743$
5,795$ 3,077$ -$ 51$ -$ -$ 3$ 2,663247SHELBY580$
3,643$ 1,922$ -$ 43$ -$ -$ 9$
1,669226STODDARD2,752$ 20,860$ 10,763$ -$ 428$ -$
-$ 125$ 9,5441,088STONE4,232$ 16,901$ 9,299$ -$
408$ -$ -$ 174$ 7,0191,379SULLIVAN513$ 2,982$
1,444$ -$ 64$ -$ -$ 23$ 1,450184TANEY4,225$
29,194$ 15,357$ -$ 1,022$ -$ -$ 349$
12,4662,207TEXAS2,897$ 24,419$ 14,412$ -$ 1,201$ -$
-$ 52$ 8,753996VERNON1,535$ 10,614$ 4,179$ -$
209$ -$ -$ 323$ 5,903697WARREN3,012$ 12,400$
5,838$ -$ 817$ -$ -$ 216$
5,528612WASHINGTON2,043$ 10,281$ 4,627$ -$ 222$
-$ -$ 7$ 5,425590WAYNE1,414$ 13,818$ 7,759$ -$
245$ -$ -$ 28$ 5,786500WEBSTER3,774$ 16,005$
10,142$ -$ 818$ -$ -$ 157$ 4,888873WORTH218$
1,203$ 482$ -$ 21$ -$ -$ 14$ 68673WRIGHT1,531$
13,408$ 8,386$ -$ 375$ -$ -$ 73$ 4,575579ST. LOUIS
(CITY)18,689$ 294,819$ 49,837$ 25,502$ 10,697$ -$
106,834$ 1,293$ 100,6576,541MISSOURI (Totals)497,874$
3,025,845$ 1,386,280$ 34,423$ 189,473$ -$ 146,126$
32,796$ 1,236,747137,008CONG. DIST (01)48,749$
519,218$ 154,463$ 26,027$ 29,714$ -$ 113,679$
3,681$ 191,65514,607CONG. DIST (02)56,378$ 175,843$
85,789$ -$ 15,931$ -$ -$ 7,413$ 66,7108,158CONG.
DIST (03)67,966$ 294,523$ 151,391$ -$ 20,812$ -$ 41$
3,018$ 119,26114,141CONG. DIST (04)71,798$ 513,700$
264,246$ 1,211$ 41,633$ -$ 2,261$ 3,999$
200,35122,409CONG. DIST (05)56,931$ 419,812$ 164,372$
5,973$ 22,443$ -$ 22,230$ 3,787$ 201,00817,188CONG.
DIST (06)61,801$ 325,074$ 150,137$ 1,124$ 20,661$ -$
5,693$ 3,457$ 144,00217,640CONG. DIST (07)66,920$
319,773$ 176,741$ -$ 21,684$ -$ 404$ 4,312$
116,63120,535CONG. DIST (08)67,332$ 457,903$ 239,141$
88$ 16,595$ -$ 1,818$ 3,130$ 197,13022,330MISSOURI
(Totals)497,874$ 3,025,845$ 1,386,280$ 34,423$
189,473$ -$ 146,126$ 32,796$ 1,236,747137,008Notes:*
Veteran population estimates, as of September 30, 2013, are
produced by the VA Office of the Actuary (VetPop 2011).#
Prior to FY 08, "Loan Guaranty" expenditures were included in
the Education & Vocational Rehabilitation and Employment
(E&VRE) programs. Currently, all "Loan Guaranty"
expenditures are attributed to Travis County, TX, where all
Loan Guaranty payments are processed. VA will continue to
improve data collection for future GDX reports to better
distribute loan expenditures at the state, county and
congressional district levels.** Unique patients are patients who
received treatment at a VA health care facility. Data are
provided by the Allocation Resource Center (ARC).Expenditure
data sources: USASpending.gov for Compensation & Pension
(C&P) and Education and Vocational Rehabilitation and
Employment (EVRE) Benefits; Veterans Benefits
Administration Insurance Center for the Insurance costs; the VA
Financial Management System (FMS) for Construction, Medical
Research, General Operating Expenses, and certain C&P and
Readjustment data; and the Allocation Resource Center (ARC)
for Medical Care costs.1. Expenditures are rounded to the
nearest thousand dollars. For example, $500 to $1,000 are
rounded to $1; $0 to $499 are rounded to $0; and "$ -" = 0 or no
expenditures.2. The Compensation & Pension expenditures
include dollars for the following programs: veterans'
compensation for service-connected disabilities; dependency
and indemnity compensation for service-connected deaths;
veterans' pension for nonservice-connected disabilities; and
burial and other benefits to veterans and their survivors.3.
Medical Care expenditures include dollars for medical services,
medical administration, facility maintenance, educational
support, research support, and other overhead items. Medical
Care expenditures do not include dollars for construction or
other non-medical support.4. Medical Care expenditures are
based on where patients live instead of where care is
delivered.5. A star symbol (*) in the Unique Patients column
denotes that there were less than 10 Unique Patients.
&"Arial,Bold"&11FY13 GEOGRAPHIC DISTRIBUTION OF
VA EXPENDITURES (GDX)
&8&P of &N
MSFY13 Summary of Expenditures by StateExpenditures in
$000sCounty/ Congressional DistrictVeteran Population*Total
ExpenditureCompensation & PensionConstructionEducation &
Vocational Rehabilitation/ EmploymentLoan Guaranty#General
Operating ExpensesInsurance & IndemnitiesMedical
CareUnique Patients**ADAMS2,391$ 17,197$ 7,567$ 598$
433$ -$ 563$ 114$ 7,9221,112ALCORN2,271$ 13,423$
8,664$ -$ 321$ -$ 188$ 138$ 4,113597AMITE1,153$
5,296$ 2,259$ -$ 173$ -$ -$ 13$
2,851415ATTALA1,392$ 11,498$ 5,556$ -$ 192$ -$ -$
57$ 5,692546BENTON511$ 2,638$ 1,177$ -$ 54$ -$ -
$ 27$ 1,380122BOLIVAR2,093$ 12,159$ 6,340$ -$
508$ -$ -$ 147$ 5,165590CALHOUN986$ 6,568$
3,703$ -$ 246$ -$ -$ 256$ 2,362300CARROLL843$
3,431$ 1,629$ -$ 150$ -$ -$ 37$
1,614207CHICKASAW1,067$ 5,843$ 3,634$ -$ 220$ -$
-$ 54$ 1,934320CHOCTAW703$ 3,644$ 1,563$ -$ 191$
-$ -$ 1$ 1,887251CLAIBORNE541$ 4,605$ 1,319$ -$
171$ -$ -$ 6$ 3,109185CLARKE1,360$ 7,335$ 4,425$
-$ 319$ -$ -$ 101$ 2,491440CLAY1,439$ 6,302$
3,402$ -$ 438$ -$ -$ 59$ 2,404449COAHOMA1,405$
8,727$ 4,404$ -$ 359$ -$ -$ 123$
3,841460COPIAH1,939$ 17,987$ 7,734$ -$ 505$ -$ -$
88$ 9,661885COVINGTON1,316$ 11,091$ 6,192$ -$
461$ -$ -$ 111$ 4,327544DE SOTO15,022$ 60,104$
27,506$ -$ 5,092$ -$ -$ 747$
26,7592,756FORREST5,992$ 49,754$ 27,246$ -$ 6,867$
-$ -$ 503$ 15,1381,791FRANKLIN624$ 4,125$ 1,725$
-$ 85$ -$ -$ 18$ 2,297229GEORGE1,781$ 9,751$
4,900$ -$ 627$ -$ -$ 120$ 4,104459GREENE1,177$
4,042$ 2,111$ -$ 102$ -$ -$ 37$
1,792233GRENADA1,605$ 10,148$ 4,685$ -$ 636$ -$ -
$ 73$ 4,753549HANCOCK4,728$ 25,921$ 10,533$ -$
1,163$ -$ -$ 151$ 14,0741,243HARRISON21,776$
211,417$ 86,697$ 11,315$ 18,537$ -$ 5,019$ 1,496$
88,3547,355HINDS15,740$ 181,555$ 53,601$ 317$ 7,480$
-$ 23,543$ 1,298$ 95,3166,664HOLMES959$ 7,226$
3,138$ -$ 252$ -$ -$ 43$ 3,793378HUMPHREYS440$
3,299$ 1,508$ -$ 149$ -$ -$ 20$
1,623186ISSAQUENA138$ 179$ 47$ -$ -$ -$ -$ -$
13123ITAWAMBA1,654$ 7,167$ 4,491$ -$ 449$ -$ -$
70$ 2,157426JACKSON15,464$ 76,794$ 37,478$ -$
6,568$ -$ -$ 419$ 32,3283,536JASPER1,220$ 8,170$
4,249$ -$ 289$ -$ -$ 11$ 3,621391JEFFERSON477$
2,754$ 1,249$ -$ 92$ -$ -$ 11$ 1,402154JEFFERSON
DAVIS947$ 6,119$ 2,447$ -$ 243$ -$ -$ 81$
3,347264JONES4,415$ 28,042$ 15,245$ -$ 932$ -$ -$
429$ 11,4371,509KEMPER634$ 3,226$ 1,824$ -$ 142$
-$ -$ 26$ 1,234191LAFAYETTE2,877$ 11,421$ 5,263$
-$ 1,911$ -$ -$ 220$ 4,027542LAMAR3,948$ 15,985$
7,102$ -$ 1,096$ -$ -$ 291$
7,4961,141LAUDERDALE6,641$ 35,246$ 18,563$ -$
2,629$ -$ -$ 706$ 13,3482,054LAWRENCE1,021$
9,168$ 4,392$ -$ 437$ -$ -$ 29$
4,310409LEAKE1,018$ 11,283$ 5,464$ -$ 400$ -$ -$
47$ 5,372526LEE5,644$ 25,747$ 15,545$ -$ 1,446$ -$
-$ 214$ 8,5421,493LEFLORE1,447$ 9,260$ 4,287$ -$
422$ -$ -$ 172$ 4,380539LINCOLN2,345$ 16,465$
6,364$ -$ 429$ -$ -$ 125$ 9,547958LOWNDES5,146$
35,903$ 19,890$ -$ 2,160$ -$ -$ 402$
13,4521,872MADISON5,909$ 38,380$ 17,023$ -$ 2,444$
-$ -$ 464$ 18,4492,011MARION1,838$ 11,631$ 6,007$
-$ 222$ -$ -$ 99$ 5,303560MARSHALL2,352$ 14,128$
6,112$ -$ 723$ -$ -$ 61$ 7,232690MONROE2,889$
12,790$ 8,452$ -$ 490$ -$ -$ 99$
3,749834MONTGOMERY818$ 6,009$ 2,826$ -$ 206$ -$
-$ 13$ 2,965353NESHOBA1,832$ 12,298$ 6,261$ -$
511$ -$ -$ 85$ 5,442621NEWTON2,003$ 9,466$ 4,741$
-$ 582$ -$ -$ 49$ 4,093614NOXUBEE548$ 2,911$
1,292$ -$ 97$ -$ -$ 146$ 1,377149OKTIBBEHA2,425$
12,338$ 5,319$ -$ 2,930$ -$ -$ 246$
3,843608PANOLA1,936$ 12,235$ 6,198$ -$ 710$ -$ -$
138$ 5,189552PEARL RIVER5,482$ 31,530$ 16,032$ -$
1,262$ -$ -$ 431$ 13,8051,534PERRY1,085$ 4,934$
2,824$ -$ 196$ -$ -$ 23$ 1,891267PIKE2,914$
18,521$ 9,099$ -$ 549$ -$ -$ 150$
8,7221,108PONTOTOC1,854$ 9,517$ 5,268$ -$ 250$ -$
-$ 114$ 3,885557PRENTISS1,709$ 7,161$ 3,957$ -$
179$ -$ -$ 10$ 3,014427QUITMAN481$ 3,447$ 1,956$
-$ 141$ -$ -$ 3$ 1,346148RANKIN11,768$ 68,603$
27,157$ -$ 3,950$ -$ -$ 550$
36,9463,604SCOTT1,566$ 12,649$ 5,172$ -$ 392$ -$ -
$ 271$ 6,814634SHARKEY315$ 2,264$ 832$ -$ 78$ -
$ -$ 27$ 1,327119SIMPSON1,990$ 16,405$ 6,941$ -$
516$ -$ -$ 65$ 8,883774SMITH1,033$ 5,993$ 3,103$
-$ 179$ -$ -$ 70$ 2,641283STONE1,707$ 11,589$
5,691$ -$ 695$ -$ -$ 65$ 5,139474SUNFLOWER1,651$
7,606$ 3,403$ -$ 386$ -$ -$ 122$
3,693440TALLAHATCHIE805$ 3,670$ 1,688$ -$ 255$ -
$ -$ 21$ 1,705213TATE2,207$ 11,300$ 4,732$ -$
632$ -$ -$ 115$ 5,822528TIPPAH1,452$ 6,546$ 4,497$
-$ 175$ -$ -$ 27$ 1,847320TISHOMINGO1,523$
7,200$ 4,735$ -$ 207$ -$ -$ 62$
2,197321TUNICA483$ 4,597$ 2,527$ -$ 229$ -$ -$
11$ 1,830209UNION1,872$ 7,629$ 4,550$ -$ 298$ -$
-$ 16$ 2,765471WALTHALL971$ 6,296$ 2,630$ -$
161$ -$ -$ 62$ 3,443356WARREN3,777$ 18,273$
8,279$ -$ 762$ -$ -$ 230$
9,0021,011WASHINGTON3,071$ 20,255$ 9,003$ -$ 758$
-$ -$ 206$ 10,2881,315WAYNE1,458$ 6,862$ 3,515$ -
$ 207$ -$ -$ 40$ 3,100395WEBSTER856$ 5,734$
2,771$ -$ 212$ -$ -$ 58$ 2,693287WILKINSON492$
3,089$ 1,606$ -$ 77$ -$ -$ -$
1,405164WINSTON1,411$ 7,911$ 3,871$ -$ 304$ -$ -$
28$ 3,708515YALOBUSHA981$ 7,391$ 4,532$ -$ 322$
-$ -$ 91$ 2,446280YAZOO1,718$ 13,780$ 4,996$ -$
348$ -$ -$ 36$ 8,400636MISSISSIPPI (Totals)225,469$
1,470,950$ 666,715$ 12,230$ 88,010$ -$ 29,313$
13,394$ 661,28869,676CONG. DIST (01)55,799$ 271,083$
144,831$ -$ 16,583$ -$ 188$ 2,804$
106,67814,176CONG. DIST (02)44,620$ 365,614$ 145,616$
802$ 15,315$ -$ 19,964$ 2,505$ 181,41216,966CONG.
DIST (03)54,047$ 344,734$ 150,470$ 113$ 17,608$ -$
3,579$ 3,974$ 168,98917,982CONG. DIST (04)71,003$
489,518$ 225,799$ 11,315$ 38,504$ -$ 5,582$ 4,111$
204,20820,552MISSISSIPPI (Totals)225,469$ 1,470,950$
666,715$ 12,230$ 88,010$ -$ 29,313$ 13,394$
661,28869,676Notes:* Veteran population estimates, as of
September 30, 2013, are produced by the VA Office of the
Actuary (VetPop 2011).# Prior to FY 08, "Loan Guaranty"
expenditures were included in the Education & Vocational
Rehabilitation and Employment (E&VRE) programs.
Currently, all "Loan Guaranty" expenditures are attributed to
Travis County, TX, where all Loan Guaranty payments are
processed. VA will continue to improve data collection for
future GDX reports to better distribute loan expenditures at the
state, county and congressional district levels.** Unique
patients are patients who received treatment at a VA health care
facility. Data are provided by the Allocation Resource Center
(ARC).Expenditure data sources: USASpending.gov for
Compensation & Pension (C&P) and Education and Vocational
Rehabilitation and Employment (EVRE) Benefits; Veterans
Benefits Administration Insurance Center for the Insurance
costs; the VA Financial Management System (FMS) for
Construction, Medical Research, General Operating Expenses,
and certain C&P and Readjustment data; and the Allocation
Resource Center (ARC) for Medical Care costs.1. Expenditures
are rounded to the nearest thousand dollars. For example, $500
to $1,000 are rounded to $1; $0 to $499 are rounded to $0; and
"$ -" = 0 or no expenditures.2. The Compensation & Pension
expenditures include dollars for the following programs:
veterans' compensation for service-connected disabilities;
dependency and indemnity compensation for service-connected
deaths; veterans' pension for nonservice-connected disabilities;
and burial and other benefits to veterans and their survivors.3.
Medical Care expenditures include dollars for medical services,
medical administration, facility maintenance, educational
support, research support, and other overhead items. Medical
Care expenditures do not include dollars for construction or
other non-medical support.4. Medical Care expenditures are
based on where patients live instead of where care is
delivered.5. A star symbol (*) in the Unique Patients column
denotes that there were less than 10 Unique Patients.
&"Arial,Bold"&11FY13 GEOGRAPHIC DISTRIBUTION OF
VA EXPENDITURES (GDX)
&8&P of &N
MTFY13 Summary of Expenditures by StateExpenditures in
$000sCounty/ Congressional DistrictVeteran Population*Total
ExpenditureCompensation & PensionConstructionEducation &
Vocational Rehabilitation/ EmploymentLoan Guaranty#General
Operating ExpensesInsurance & IndemnitiesMedical
CareUnique Patients**BEAVERHEAD991$ 4,473$ 2,473$ -
$ 129$ -$ -$ 41$ 1,830273BIG HORN964$ 4,542$
1,983$ -$ 118$ -$ -$ 23$ 2,418237BLAINE573$
4,832$ 2,299$ -$ 104$ -$ -$ 69$
2,360176BROADWATER498$ 7,057$ 2,280$ -$ 202$ -$
-$ 105$ 4,469338CARBON866$ 5,605$ 2,285$ -$ 187$
-$ -$ 103$ 3,030343CARTER86$ 602$ 226$ -$ 8$ -$
-$ 1$ 36739CASCADE11,409$ 74,649$ 41,416$ -$
8,162$ -$ -$ 1,010$ 24,0613,625CHOUTEAU546$
2,893$ 1,445$ -$ 68$ -$ -$ 22$
1,358200CUSTER1,306$ 12,584$ 3,564$ -$ 116$ -$ -$
48$ 8,856489DANIELS200$ 1,123$ 470$ -$ 10$ -$ -$
4$ 63956DAWSON899$ 3,571$ 1,779$ -$ 60$ -$ -$
58$ 1,674250DEER LODGE1,238$ 7,263$ 2,803$ -$
219$ -$ -$ 60$ 4,180480FALLON207$ 928$ 219$ -$
19$ -$ -$ 16$ 67449FERGUS1,195$ 8,429$ 3,650$ -$
162$ -$ -$ 134$ 4,483459FLATHEAD9,321$ 50,887$
25,526$ -$ 2,117$ -$ -$ 710$
22,5353,590GALLATIN6,654$ 35,564$ 15,415$ -$ 6,162$
-$ -$ 541$ 13,4461,897GARFIELD127$ 268$ 102$ -$
-$ -$ -$ -$ 16635GLACIER890$ 5,948$ 3,105$ -$
221$ -$ -$ 30$ 2,592314GOLDEN VALLEY99$ 917$
375$ -$ 31$ -$ -$ -$ 51156GRANITE393$ 1,721$
677$ -$ 20$ -$ -$ 19$ 1,006118HILL1,359$ 7,574$
3,896$ -$ 565$ -$ -$ 47$ 3,066440JEFFERSON1,222$
12,874$ 4,910$ -$ 331$ -$ -$ 138$ 7,496588JUDITH
BASIN250$ 1,850$ 870$ -$ 27$ -$ -$ 27$
92683LAKE3,131$ 14,260$ 7,059$ -$ 267$ -$ -$ 147$
6,787943LEWIS AND CLARK7,328$ 85,346$ 28,014$ 8$
3,383$ -$ 7,765$ 449$ 45,7273,504LIBERTY143$
1,172$ 436$ -$ 11$ -$ -$ 12$ 71338LINCOLN2,757$
16,890$ 9,836$ -$ 300$ -$ -$ 197$
6,5581,064MCCONE174$ 716$ 134$ -$ 35$ -$ -$ 1$
54797MADISON904$ 4,158$ 1,920$ -$ 65$ -$ -$ 75$
2,097314MEAGHER237$ 1,364$ 673$ -$ 12$ -$ -$ -$
67894MINERAL589$ 4,125$ 2,072$ -$ 93$ -$ -$ 69$
1,890235MISSOULA9,794$ 57,530$ 23,911$ -$ 6,124$ -
$ -$ 782$ 26,7123,075MUSSELSHELL531$ 3,931$
2,041$ -$ 20$ -$ -$ 4$ 1,865212PARK1,579$ 8,171$
3,701$ -$ 328$ -$ -$ 77$ 4,066461PETROLEUM46$
277$ 139$ -$ 4$ -$ -$ 3$ 13019PHILLIPS342$
2,053$ 942$ -$ 47$ -$ -$ 9$ 1,055156PONDERA571$
3,339$ 1,849$ -$ 116$ -$ -$ 110$ 1,264203POWDER
RIVER130$ 1,001$ 327$ -$ 1$ -$ -$ 94$
57962POWELL1,087$ 5,726$ 1,971$ -$ 147$ -$ -$
63$ 3,546344PRAIRIE141$ 1,259$ 586$ -$ 10$ -$ -$
6$ 65763RAVALLI5,205$ 34,451$ 18,393$ -$ 912$ -$
-$ 133$ 15,0131,680RICHLAND696$ 3,363$ 1,657$ -$
94$ -$ -$ 147$ 1,465251ROOSEVELT926$ 2,964$
1,579$ -$ 268$ -$ -$ 13$ 1,103180ROSEBUD796$
4,084$ 1,724$ -$ 172$ -$ -$ 46$
2,142229SANDERS1,583$ 10,987$ 6,092$ -$ 140$ -$ -
$ 94$ 4,661588SHERIDAN320$ 957$ 402$ -$ 18$ -$
-$ 2$ 53556SILVER BOW3,672$ 22,211$ 8,979$ -$
1,461$ -$ -$ 196$ 11,5751,326STILLWATER792$
5,497$ 2,515$ -$ 81$ -$ -$ 58$ 2,844352SWEET
GRASS380$ 1,951$ 979$ -$ 20$ -$ -$ 34$
918129TETON626$ 3,463$ 1,899$ -$ 90$ -$ -$ 30$
1,444225TOOLE557$ 2,146$ 1,085$ -$ 69$ -$ -$ 7$
984167TREASURE87$ 274$ 122$ -$ -$ -$ -$ -$
15226VALLEY748$ 3,882$ 1,681$ -$ 51$ -$ -$ 187$
1,962282WHEATLAND199$ 1,319$ 724$ -$ 17$ -$ -$
13$ 56584WIBAUX94$ 344$ 201$ -$ -$ -$ -$ -$
14227YELLOWSTONE14,136$ 81,144$ 35,458$ -$ 4,842$
-$ -$ 809$ 40,0344,568MONTANA (Totals)101,597$
646,509$ 290,869$ 8$ 38,237$ -$ 7,765$ 7,072$
302,55835,189CONG. DIST (01)101,597$ 646,509$
290,869$ 8$ 38,237$ -$ 7,765$ 7,072$
302,55835,189MONTANA (Totals)101,597$ 646,509$
290,869$ 8$ 38,237$ -$ 7,765$ 7,072$
302,55835,189Notes:* Veteran population estimates, as of
September 30, 2013, are produced by the VA Office of the
Actuary (VetPop 2011).# Prior to FY 08, "Loan Guaranty"
expenditures were included in the Education & Vocational
Rehabilitation and Employment (E&VRE) programs.
Currently, all "Loan Guaranty" expenditures are attributed to
Travis County, TX, where all Loan Guaranty payments are
processed. VA will continue to improve data collection for
future GDX reports to better distribute loan expenditures at the
state, county and congressional district levels.** Unique
patients are patients who received treatment at a VA health care
facility. Data are provided by the Allocation Resource Center
(ARC).Expenditure data sources: USASpending.gov for
Compensation & Pension (C&P) and Education and Vocational
Rehabilitation and Employment (EVRE) Benefits; Veterans
Benefits Administration Insurance Center for the Insurance
costs; the VA Financial Management System (FMS) for
Construction, Medical Research, General Operating Expenses,
and certain C&P and Readjustment data; and the Allocation
Resource Center (ARC) for Medical Care costs.1. Expenditures
are rounded to the nearest thousand dollars. For example, $500
to $1,000 are rounded to $1; $0 to $499 are rounded to $0; and
"$ -" = 0 or no expenditures.2. The Compensation & Pension
expenditures include dollars for the following programs:
veterans' compensation for service-connected disabilities;
dependency and indemnity compensation for service-connected
deaths; veterans' pension for nonservice-connected disabilities;
and burial and other benefits to veterans and their survivors.3.
Medical Care expenditures include dollars for medical services,
medical administration, facility maintenance, educational
support, research support, and other overhead items. Medical
Care expenditures do not include dollars for construction or
other non-medical support.4. Medical Care expenditures are
based on where patients live instead of where care is
delivered.5. A star symbol (*) in the Unique Patients column
denotes that there were less than 10 Unique Patients.
&"Arial,Bold"&11FY13 GEOGRAPHIC DISTRIBUTION OF
VA EXPENDITURES (GDX)
&8&P of &N
NCFY13 Summary of Expenditures by StateExpenditures in
$000sCounty/ Congressional DistrictVeteran Population*Total
ExpenditureCompensation & PensionConstructionEducation &
Vocational Rehabilitation/ EmploymentLoan Guaranty#General
Operating ExpensesInsurance & IndemnitiesMedical
CareUnique Patients**ALAMANCE11,326$ 61,675$ 28,305$
-$ 1,987$ -$ -$ 608$ 30,7742,465ALEXANDER2,840$
15,137$ 7,795$ -$ 408$ -$ -$ 41$
6,893913ALLEGHANY1,024$ 4,407$ 2,862$ -$ 136$ -$
-$ 5$ 1,404287ANSON1,673$ 10,034$ 5,287$ -$ 278$
-$ -$ 255$ 4,214524ASHE2,015$ 12,127$ 7,294$ -$
329$ -$ -$ 137$ 4,367672AVERY1,182$ 8,396$ 4,187$
-$ 329$ -$ -$ 79$ 3,800468BEAUFORT3,978$ 24,950$
16,434$ -$ 1,084$ -$ -$ 203$ 7,2291,088BERTIE1,056$
7,231$ 4,395$ -$ 210$ -$ -$ 48$
2,579274BLADEN3,082$ 17,378$ 10,396$ -$ 528$ -$ -
$ 138$ 6,316770BRUNSWICK13,368$ 65,268$ 43,542$ -
$ 2,629$ -$ -$ 1,023$ 18,0743,109BUNCOMBE19,973$
167,375$ 60,714$ 97$ 5,632$ -$ 5,959$ 1,470$
93,5037,273BURKE7,215$ 45,784$ 21,222$ -$ 1,243$ -$
-$ 505$ 22,8142,443CABARRUS13,108$ 73,718$ 37,628$
-$ 5,427$ -$ -$ 902$ 29,7613,992CALDWELL6,327$
37,346$ 19,019$ -$ 1,005$ -$ -$ 209$
17,1132,143CAMDEN1,043$ 7,764$ 4,985$ -$ 1,623$ -$
-$ 130$ 1,025180CARTERET8,481$ 53,935$ 36,754$ -$
2,932$ -$ -$ 890$ 13,3592,237CASWELL1,939$ 10,302$
3,822$ -$ 167$ -$ -$ 131$ 6,183507CATAWBA11,782$
66,926$ 33,543$ -$ 3,118$ -$ -$ 516$
29,7483,990CHATHAM6,146$ 18,253$ 7,945$ -$ 803$ -
$ -$ 459$ 9,046914CHEROKEE2,791$ 19,848$ 11,050$
-$ 284$ -$ -$ 190$ 8,3241,032CHOWAN1,578$ 7,093$
4,444$ -$ 257$ -$ -$ 93$ 2,300250CLAY1,105$
7,486$ 3,671$ -$ 106$ -$ -$ 71$
3,639407CLEVELAND7,573$ 48,120$ 26,186$ -$ 2,271$
-$ -$ 268$ 19,3962,353COLUMBUS3,968$ 30,948$
19,279$ -$ 1,081$ -$ -$ 93$
10,4951,263CRAVEN13,617$ 95,285$ 65,048$ -$ 10,784$
-$ 278$ 1,349$ 17,8262,364CUMBERLAND47,298$
575,641$ 361,732$ -$ 79,352$ -$ 3,296$ 4,512$
126,75017,872CURRITUCK3,150$ 17,226$ 10,352$ -$
2,776$ -$ -$ 926$ 3,171443DARE3,386$ 10,657$
6,696$ -$ 423$ -$ -$ 297$ 3,241409DAVIDSON13,691$
56,029$ 22,947$ -$ 1,829$ -$ -$ 475$
30,7783,605DAVIE3,258$ 17,730$ 8,502$ -$ 573$ -$ -$
258$ 8,396970DUPLIN3,470$ 27,539$ 17,078$ -$ 1,441$
-$ -$ 144$ 8,8781,018DURHAM15,846$ 181,498$
50,527$ 1,833$ 8,981$ -$ 7,728$ 1,091$
111,3374,809EDGECOMBE3,368$ 28,344$ 16,326$ -$
1,272$ -$ -$ 126$ 10,6211,018FORSYTH25,724$
196,944$ 71,013$ 289$ 8,098$ -$ 63,169$ 2,313$
52,0626,930FRANKLIN4,834$ 23,825$ 12,028$ -$ 908$
-$ -$ 112$ 10,7771,006GASTON16,804$ 83,703$
43,541$ -$ 5,322$ -$ -$ 765$
34,0764,615GATES1,129$ 6,035$ 3,784$ -$ 625$ -$ -$
54$ 1,571209GRAHAM719$ 4,889$ 2,417$ -$ 57$ -$ -
$ 21$ 2,393229GRANVILLE4,889$ 23,958$ 11,303$ -$
1,108$ -$ -$ 86$ 11,462969GREENE1,287$ 6,935$
4,276$ -$ 210$ -$ -$ 83$ 2,366340GUILFORD33,329$
166,842$ 88,904$ -$ 13,618$ -$ -$ 2,423$
61,8977,470HALIFAX3,754$ 28,952$ 16,954$ -$ 789$ -
$ -$ 188$ 11,0221,016HARNETT13,787$ 82,662$
44,803$ -$ 10,814$ -$ -$ 857$
26,1883,479HAYWOOD6,608$ 41,431$ 21,106$ -$ 1,157$
-$ -$ 325$ 18,8431,976HENDERSON11,454$ 54,059$
26,355$ -$ 1,774$ -$ -$ 1,107$
24,8232,833HERTFORD1,876$ 11,416$ 6,782$ -$ 326$ -
$ -$ 105$ 4,204365HOKE6,010$ 55,731$ 33,742$ -$
10,280$ -$ -$ 182$ 11,5262,018HYDE418$ 2,270$
1,592$ -$ 37$ -$ -$ 22$ 61982IREDELL12,003$
61,002$ 28,966$ -$ 4,648$ -$ -$ 1,071$
26,3183,621JACKSON3,082$ 20,013$ 10,773$ -$ 676$ -
$ -$ 263$ 8,301908JOHNSTON13,916$ 67,508$ 33,454$
-$ 3,834$ -$ -$ 822$ 29,3982,966JONES1,134$ 12,814$
9,368$ -$ 869$ -$ -$ 38$ 2,538326LEE4,209$ 44,645$
29,134$ -$ 6,483$ -$ -$ 235$
8,7931,078LENOIR4,643$ 40,753$ 27,246$ -$ 1,829$ -$
-$ 269$ 11,4081,354LINCOLN6,284$ 30,051$ 14,125$ -
$ 1,631$ -$ -$ 168$ 14,1261,817MCDOWELL3,575$
33,546$ 15,184$ -$ 528$ -$ -$ 72$
17,7611,635MACON3,573$ 23,835$ 12,355$ -$ 440$ -$
-$ 189$ 10,8511,305MADISON1,457$ 11,678$ 5,344$ -$
401$ -$ -$ 28$ 5,905562MARTIN1,731$ 14,200$
8,462$ -$ 314$ -$ -$ 106$
5,317537MECKLENBURG57,018$ 274,089$ 133,924$ -$
32,008$ -$ -$ 4,068$ 104,08813,952MITCHELL1,178$
8,494$ 4,234$ -$ 115$ -$ -$ 45$
4,100476MONTGOMERY2,017$ 13,495$ 7,358$ -$ 334$
-$ -$ 112$ 5,692640MOORE10,285$ 52,194$ 33,489$ -
$ 5,223$ -$ -$ 1,324$ 12,1591,964NASH8,261$
46,460$ 27,973$ -$ 2,213$ -$ -$ 369$
15,9041,681NEW HANOVER17,800$ 95,642$ 56,939$ -$
10,957$ -$ 149$ 1,481$
26,1163,759NORTHAMPTON1,548$ 10,100$ 5,560$ -$
168$ -$ -$ 68$ 4,304392ONSLOW26,002$ 264,305$
190,122$ -$ 41,487$ -$ -$ 2,932$
29,7646,067ORANGE6,505$ 34,428$ 14,297$ -$ 3,679$
-$ -$ 1,024$ 15,4281,257PAMLICO1,371$ 9,512$ 5,972$
-$ 269$ -$ -$ 73$ 3,199353PASQUOTANK4,674$
25,779$ 15,876$ -$ 4,068$ -$ -$ 223$
5,612847PENDER6,010$ 30,077$ 19,126$ -$ 2,682$ -$
-$ 160$ 8,1081,144PERQUIMANS1,595$ 7,929$ 4,854$
-$ 697$ -$ -$ 185$ 2,192290PERSON2,972$ 20,815$
9,368$ -$ 720$ -$ -$ 153$ 10,574822PITT10,782$
71,633$ 46,408$ -$ 6,125$ -$ -$ 544$
18,5572,478POLK2,092$ 10,559$ 5,847$ -$ 155$ -$ -$
199$ 4,357546RANDOLPH10,996$ 51,494$ 24,917$ -$
2,139$ -$ -$ 290$ 24,1472,644RICHMOND3,606$
33,420$ 20,746$ -$ 1,108$ -$ -$ 367$
11,1991,399ROBESON8,027$ 74,439$ 42,566$ -$ 5,094$
-$ -$ 205$ 26,5752,974ROCKINGHAM7,971$ 38,245$
19,714$ -$ 1,412$ -$ -$ 299$
16,8201,824ROWAN12,005$ 139,014$ 38,466$ 18,376$
3,183$ -$ 10,695$ 751$
67,5434,976RUTHERFORD5,472$ 41,955$ 19,247$ -$
910$ -$ -$ 219$ 21,5802,047SAMPSON3,869$ 38,168$
21,039$ -$ 1,191$ -$ -$ 252$
15,6861,524SCOTLAND2,891$ 18,433$ 11,317$ -$ 688$
-$ -$ 150$ 6,278864STANLY4,656$ 23,604$ 11,810$ -$
1,093$ -$ -$ 159$ 10,5421,286STOKES3,924$ 16,956$
8,597$ -$ 664$ -$ -$ 78$ 7,6171,010SURRY4,611$
33,020$ 19,742$ -$ 715$ -$ -$ 241$
12,3221,835SWAIN1,271$ 8,753$ 4,499$ -$ 155$ -$ -$
14$ 4,085369TRANSYLVANIA3,399$ 16,576$ 8,205$ -$
467$ -$ -$ 290$ 7,614846TYRRELL425$ 837$ 592$ -
$ 21$ -$ -$ 1$ 22356UNION13,317$ 52,673$ 29,199$
-$ 3,812$ -$ -$ 870$ 18,7922,940VANCE2,432$
23,625$ 10,935$ -$ 584$ -$ -$ 202$
11,904932WAKE58,436$ 282,733$ 146,235$ 643$
32,713$ -$ 264$ 4,496$ 98,38310,531WARREN1,608$
12,554$ 5,178$ -$ 407$ -$ -$ 127$
6,841515WASHINGTON938$ 6,390$ 3,953$ -$ 217$ -$
-$ 55$ 2,166226WATAUGA2,610$ 14,786$ 7,013$ -$
2,024$ -$ -$ 257$ 5,492777WAYNE13,031$ 90,376$
61,659$ -$ 8,429$ -$ -$ 929$
19,3602,678WILKES4,207$ 26,558$ 15,108$ -$ 717$ -$
-$ 134$ 10,5991,575WILSON5,563$ 40,793$ 23,173$ -$
1,809$ -$ -$ 406$ 15,4041,352YADKIN2,598$ 13,520$
7,206$ -$ 501$ -$ -$ 287$ 5,525877YANCEY1,523$
12,248$ 6,882$ -$ 154$ -$ -$ 133$ 5,079573NORTH
CAROLINA (Totals)769,384$ 5,067,823$ 2,712,319$
21,238$ 399,186$ -$ 91,538$ 53,714$
1,789,827205,006CONG. DIST (01)50,982$ 458,118$
243,698$ 1,833$ 27,227$ -$ 7,728$ 3,387$
174,24414,487CONG. DIST (02)71,406$ 513,231$ 305,916$
-$ 64,469$ -$ -$ 5,816$ 137,03018,892CONG. DIST
(03)81,773$ 601,127$ 410,433$ -$ 71,619$ -$ 278$
7,587$ 111,21017,572CONG. DIST (04)59,488$ 573,325$
311,011$ -$ 67,148$ -$ 3,296$ 5,171$
186,69817,689CONG. DIST (05)55,437$ 362,056$ 148,952$
289$ 15,094$ -$ 63,169$ 3,822$ 130,73116,261CONG.
DIST (06)56,664$ 266,222$ 132,554$ -$ 13,429$ -$ -$
3,344$ 116,89612,838CONG. DIST (07)65,498$ 379,908$
225,996$ -$ 25,358$ -$ 149$ 4,088$
124,31715,781CONG. DIST (08)54,239$ 328,616$ 170,634$
-$ 17,650$ -$ -$ 2,904$ 137,42816,676CONG. DIST
(09)49,039$ 173,113$ 84,526$ -$ 17,474$ -$ -$ 4,345$
66,76810,241CONG. DIST (10)59,447$ 384,582$ 177,820$
97$ 16,683$ -$ 5,959$ 3,028$ 180,99519,115CONG.
DIST (11)65,579$ 406,530$ 195,878$ -$ 10,690$ -$ -$
4,031$ 195,93121,127CONG. DIST (12)42,461$ 357,784$
159,572$ 18,376$ 28,968$ -$ 10,695$ 2,522$
137,65114,382CONG. DIST (13)57,371$ 263,211$ 145,328$
643$ 23,378$ -$ 264$ 3,669$ 89,9289,945NORTH
CAROLINA (Totals)769,384$ 5,067,823$ 2,712,319$
21,238$ 399,186$ -$ 91,538$ 53,714$
1,789,827205,006Notes:* Veteran population estimates, as of
September 30, 2013, are produced by the VA Office of the
Actuary (VetPop 2011).# Prior to FY 08, "Loan Guaranty"
expenditures were included in the Education & Vocational
Rehabilitation and Employment (E&VRE) programs.
Currently, all "Loan Guaranty" expenditures are attributed to
Travis County, TX, where all Loan Guaranty payments are
processed. VA will continue to improve data collection for
future GDX reports to better distribute loan expenditures at the
state, county and congressional district levels.** Unique
patients are patients who received treatment at a VA health care
facility. Data are provided by the Allocation Resource Center
(ARC).Expenditure data sources: USASpending.gov for
Compensation & Pension (C&P) and Education and Vocational
Rehabilitation and Employment (EVRE) Benefits; Veterans
Benefits Administration Insurance Center for the Insurance
costs; the VA Financial Management System (FMS) for
Construction, Medical Research, General Operating Expenses,
and certain C&P and Readjustment data; and the Allocation
Resource Center (ARC) for Medical Care costs.1. Expenditures
are rounded to the nearest thousand dollars. For example, $500
to $1,000 are rounded to $1; $0 to $499 are rounded to $0; and
"$ -" = 0 or no expenditures.2. The Compensation & Pension
expenditures include dollars for the following programs:
veterans' compensation for service-connected disabilities;
dependency and indemnity compensation for service-connected
deaths; veterans' pension for nonservice-connected disabilities;
and burial and other benefits to veterans and their survivors.3.
Medical Care expenditures include dollars for medical services,
medical administration, facility maintenance, educational
support, research support, and other overhead items. Medical
Care expenditures do not include dollars for construction or
other non-medical support.4. Medical Care expenditures are
based on where patients live instead of where care is
delivered.5. A star symbol (*) in the Unique Patients column
denotes that there were less than 10 Unique Patients.
&"Arial,Bold"&11FY13 GEOGRAPHIC DISTRIBUTION OF
VA EXPENDITURES (GDX)
&8&P of &N
NDFY13 Summary of Expenditures by StateExpenditures in
$000sCounty/ Congressional DistrictVeteran Population*Total
ExpenditureCompensation & PensionConstructionEducation &
Vocational Rehabilitation/ EmploymentLoan Guaranty#General
Operating ExpensesInsurance & IndemnitiesMedical
CareUnique Patients**ADAMS204$ 1,163$ 553$ -$ 40$
-$ -$ 20$ 55078BARNES925$ 5,842$ 2,389$ -$ 163$
-$ -$ 78$ 3,212367BENSON403$ 2,698$ 1,191$ -$
128$ -$ -$ 30$ 1,350111BILLINGS121$ 167$ 72$ -$
9$ -$ -$ 1$ 8623BOTTINEAU643$ 2,617$ 1,437$ -$
205$ -$ -$ 10$ 966195BOWMAN221$ 945$ 445$ -$
-$ -$ -$ 43$ 457101BURKE209$ 728$ 402$ -$ 19$
-$ -$ 1$ 30657BURLEIGH7,038$ 28,836$ 15,944$ -$
1,999$ -$ -$ 363$ 10,5312,043CASS10,444$ 104,180$
32,784$ 2,623$ 5,894$ -$ 6,479$ 1,019$
55,3814,281CAVALIER368$ 1,414$ 648$ -$ 29$ -$ -$
42$ 695116DICKEY487$ 1,571$ 890$ -$ 73$ -$ -$
34$ 575114DIVIDE231$ 763$ 326$ -$ 46$ -$ -$ 59$
33260DUNN327$ 1,456$ 653$ -$ 20$ -$ -$ 15$
767110EDDY188$ 902$ 555$ -$ 17$ -$ -$ -$
33056EMMONS317$ 1,579$ 874$ -$ 20$ -$ -$ 1$
685141FOSTER222$ 921$ 482$ -$ 58$ -$ -$ 4$
37768GOLDEN VALLEY168$ 443$ 180$ -$ 20$ -$ -$
18$ 22544GRAND FORKS6,089$ 32,502$ 16,058$ -$
5,040$ -$ -$ 288$ 11,1161,681GRANT235$ 852$ 418$
-$ 41$ -$ -$ 68$ 32565GRIGGS208$ 1,667$ 824$ -$
13$ -$ -$ 21$ 809108HETTINGER273$ 1,020$ 553$ -
$ 19$ -$ -$ 1$ 44778KIDDER205$ 1,220$ 510$ -$
15$ -$ -$ 91$ 60576LA MOURE341$ 1,428$ 542$ -$
25$ -$ -$ 2$ 859110LOGAN134$ 935$ 439$ -$ -$ -
$ -$ 10$ 48676MCHENRY575$ 2,360$ 1,589$ -$ 86$
-$ -$ 3$ 682155MCINTOSH213$ 1,173$ 548$ -$ 56$
-$ -$ 31$ 53798MCKENZIE507$ 2,193$ 1,185$ -$ 30$
-$ -$ 9$ 970175MCLEAN863$ 4,658$ 2,368$ -$ 80$
-$ -$ 19$ 2,191295MERCER725$ 2,184$ 1,345$ -$
42$ -$ -$ 47$ 751185MORTON2,076$ 12,064$ 6,492$
-$ 526$ -$ -$ 50$ 4,996744MOUNTRAIL564$ 3,022$
1,767$ -$ 76$ -$ -$ 33$ 1,147184NELSON355$
2,461$ 1,369$ -$ 62$ -$ -$ 1$ 1,029149OLIVER144$
536$ 331$ -$ 1$ -$ -$ 3$ 20252PEMBINA705$
3,210$ 1,704$ -$ 183$ -$ -$ 11$
1,312248PIERCE398$ 1,336$ 655$ -$ 90$ -$ -$ 17$
574117RAMSEY810$ 5,721$ 2,734$ -$ 264$ -$ -$ 99$
2,625324RANSOM497$ 4,290$ 1,704$ -$ 30$ -$ -$
54$ 2,502225RENVILLE332$ 1,005$ 739$ -$ 69$ -$ -
$ 4$ 19368RICHLAND1,047$ 7,229$ 2,761$ -$ 370$ -
$ -$ 18$ 4,079381ROLETTE741$ 4,934$ 2,934$ -$
81$ -$ -$ 63$ 1,855191SARGENT321$ 1,810$ 820$ -$
99$ -$ -$ 1$ 890106SHERIDAN148$ 393$ 200$ -$
19$ -$ -$ 1$ 17347SIOUX338$ 1,693$ 931$ -$ 53$
-$ -$ -$ 70972SLOPE46$ 189$ 19$ -$ -$ -$ -$ 5$
16621STARK1,993$ 10,580$ 5,071$ -$ 402$ -$ -$
210$ 4,897780STEELE216$ 1,364$ 715$ -$ 27$ -$ -$
239$ 38470STUTSMAN1,731$ 10,892$ 4,642$ -$ 330$
-$ -$ 65$ 5,855593TOWNER241$ 1,043$ 434$ -$ 21$
-$ -$ 30$ 55889TRAILL724$ 5,406$ 2,190$ -$ 309$
-$ -$ 64$ 2,842266WALSH1,027$ 5,119$ 2,071$ -$
74$ -$ -$ 83$ 2,892327WARD6,521$ 31,146$ 18,296$
-$ 5,347$ -$ -$ 262$ 7,2411,572WELLS354$ 1,442$
752$ -$ 19$ -$ -$ 1$ 669106WILLIAMS1,998$ 9,450$
4,059$ -$ 132$ -$ -$ 131$ 5,128727NORTH DAKOTA
(Totals)56,213$ 334,755$ 149,596$ 2,623$ 22,770$ -$
6,479$ 3,770$ 149,51818,526CONG. DIST (01)56,213$
334,755$ 149,596$ 2,623$ 22,770$ -$ 6,479$ 3,770$
149,51818,526NORTH DAKOTA (Totals)56,213$ 334,755$
149,596$ 2,623$ 22,770$ -$ 6,479$ 3,770$
149,51818,526Notes:* Veteran population estimates, as of
September 30, 2013, are produced by the VA Office of the
Actuary (VetPop 2011).# Prior to FY 08, "Loan Guaranty"
expenditures were included in the Education & Vocational
Rehabilitation and Employment (E&VRE) programs.
Currently, all "Loan Guaranty" expenditures are attributed to
Travis County, TX, where all Loan Guaranty payments are
processed. VA will continue to improve data collection for
future GDX reports to better distribute loan expenditures at the
state, county and congressional district levels.** Unique
patients are patients who received treatment at a VA health care
facility. Data are provided by the Allocation Resource Center
(ARC).Expenditure data sources: USASpending.gov for
Compensation & Pension (C&P) and Education and Vocational
Rehabilitation and Employment (EVRE) Benefits; Veterans
Benefits Administration Insurance Center for the Insurance
costs; the VA Financial Management System (FMS) for
Construction, Medical Research, General Operating Expenses,
and certain C&P and Readjustment data; and the Allocation
Resource Center (ARC) for Medical Care costs.1. Expenditures
are rounded to the nearest thousand dollars. For example, $500
to $1,000 are rounded to $1; $0 to $499 are rounded to $0; and
"$ -" = 0 or no expenditures.2. The Compensation & Pension
expenditures include dollars for the following programs:
veterans' compensation for service-connected disabilities;
dependency and indemnity compensation for service-connected
deaths; veterans' pension for nonservice-connected disabilities;
and burial and other benefits to veterans and their survivors.3.
Medical Care expenditures include dollars for medical services,
medical administration, facility maintenance, educational
support, research support, and other overhead items. Medical
Care expenditures do not include dollars for construction or
other non-medical support.4. Medical Care expenditures are
based on where patients live instead of where care is
delivered.5. A star symbol (*) in the Unique Patients column
denotes that there were less than 10 Unique Patients.
&"Arial,Bold"&11FY13 GEOGRAPHIC DISTRIBUTION OF
VA EXPENDITURES (GDX)
&8&P of &N
NEFY13 Summary of Expenditures by StateExpenditures in
$000sCounty/ Congressional DistrictVeteran Population*Total
ExpenditureCompensation & PensionConstructionEducation &
Vocational Rehabilitation/ EmploymentLoan Guaranty#General
Operating ExpensesInsurance & IndemnitiesMedical
CareUnique Patients**ADAMS2,213$ 18,988$ 10,893$ -$
567$ -$ -$ 360$ 7,167930ANTELOPE593$ 4,222$
2,592$ -$ 95$ -$ -$ 25$ 1,510245ARTHUR41$ 41$
15$ -$ -$ -$ -$ -$ 2612BANNER45$ 222$ 109$ -$
1$ -$ -$ 2$ 11023BLAINE38$ 213$ 120$ -$ -$ -$
-$ 10$ 8318BOONE525$ 3,916$ 2,303$ -$ 36$ -$ -$
17$ 1,559234BOX BUTTE894$ 5,414$ 2,063$ -$ 330$ -
$ -$ 24$ 2,997418BOYD193$ 1,277$ 668$ -$ 21$ -$
-$ -$ 589112BROWN258$ 2,832$ 1,783$ -$ 6$ -$ -$
1$ 1,041148BUFFALO2,735$ 20,738$ 11,504$ -$ 1,207$
-$ -$ 152$ 7,8751,129BURT688$ 3,653$ 1,413$ -$
107$ -$ -$ 142$ 1,991175BUTLER683$ 3,923$ 2,335$
-$ 66$ -$ -$ 51$ 1,471250CASS3,023$ 19,311$
11,491$ -$ 1,350$ -$ -$ 351$ 6,119852CEDAR674$
3,529$ 1,907$ -$ 213$ -$ -$ 53$ 1,355243CHASE278$
1,563$ 931$ -$ 12$ -$ -$ 15$ 604114CHERRY426$
3,221$ 1,055$ -$ 63$ -$ -$ 38$
2,065199CHEYENNE725$ 3,999$ 2,018$ -$ 70$ -$ -$
93$ 1,819311CLAY518$ 4,008$ 2,549$ -$ 100$ -$ -$
5$ 1,354210COLFAX639$ 1,999$ 987$ -$ 118$ -$ -$
17$ 876169CUMING682$ 3,623$ 1,993$ -$ 125$ -$ -$
55$ 1,450221CUSTER836$ 6,644$ 4,221$ -$ 97$ -$ -$
132$ 2,194398DAKOTA1,178$ 6,409$ 3,373$ -$ 286$ -
$ -$ 46$ 2,704420DAWES714$ 7,076$ 2,669$ -$ 290$
-$ -$ 75$ 4,042358DAWSON1,500$ 8,363$ 3,943$ -$
182$ -$ -$ 74$ 4,164534DEUEL231$ 872$ 441$ -$
3$ -$ -$ 1$ 42875DIXON477$ 2,355$ 996$ -$ 61$ -
$ -$ 15$ 1,283152DODGE3,146$ 17,487$ 9,401$ -$
879$ -$ -$ 136$ 7,071889DOUGLAS36,609$ 238,930$
94,800$ 1,723$ 16,911$ -$ 2,425$ 3,846$
119,2269,629DUNDY178$ 717$ 436$ -$ 4$ -$ -$ 10$
26748FILLMORE488$ 5,442$ 2,744$ -$ 58$ -$ -$ 45$
2,595263FRANKLIN281$ 2,737$ 1,750$ -$ 22$ -$ -$
7$ 957175FRONTIER237$ 1,131$ 768$ -$ 29$ -$ -$
19$ 31460FURNAS410$ 3,663$ 2,040$ -$ 23$ -$ -$
6$ 1,594204GAGE1,534$ 15,162$ 8,818$ -$ 374$ -$ -
$ 101$ 5,870857GARDEN201$ 1,626$ 639$ -$ 16$ -$
-$ 4$ 96674GARFIELD140$ 1,449$ 880$ -$ 6$ -$ -$
8$ 55584GOSPER161$ 1,218$ 837$ -$ 12$ -$ -$ 1$
36887GRANT56$ 232$ 70$ -$ 12$ -$ -$ -$
15021GREELEY200$ 1,851$ 973$ -$ 2$ -$ -$ 16$
860136HALL3,728$ 46,781$ 20,518$ -$ 787$ -$ 483$
227$ 24,7652,266HAMILTON634$ 5,197$ 2,705$ -$
135$ -$ -$ 29$ 2,329341HARLAN283$ 2,346$ 1,440$
-$ 2$ -$ -$ 14$ 890158HAYES85$ 254$ 75$ -$ 1$
-$ -$ 2$ 17635HITCHCOCK242$ 1,742$ 1,154$ -$
20$ -$ -$ 49$ 51979HOLT728$ 4,922$ 2,491$ -$
111$ -$ -$ 64$ 2,255399HOOKER73$ 363$ 133$ -$
22$ -$ -$ 3$ 20426HOWARD442$ 5,760$ 3,394$ -$
65$ -$ -$ 48$ 2,253293JEFFERSON747$ 4,028$ 2,405$
-$ 65$ -$ -$ 24$ 1,534254JOHNSON398$ 1,848$ 932$
-$ 33$ -$ -$ 59$ 824110KEARNEY482$ 2,479$
1,379$ -$ 87$ -$ -$ 48$ 964186KEITH647$ 3,438$
1,900$ -$ 81$ -$ -$ 59$ 1,398251KEYA PAHA72$
19,365$ 359$ 592$ 4$ -$ 2,727$ -$
15,68322KIMBALL429$ 2,597$ 900$ -$ 17$ -$ -$ 57$
1,622135KNOX737$ 5,331$ 3,129$ -$ 148$ -$ -$ 37$
2,018332LANCASTER18,255$ 153,871$ 64,678$ 14$
10,118$ -$ 28,046$ 2,332$ 48,6836,536LINCOLN3,102$
18,481$ 9,395$ 213$ 550$ -$ 701$ 90$
7,5321,057LOGAN61$ 575$ 190$ -$ 8$ -$ -$ 8$
36921LOUP50$ 444$ 237$ -$ 9$ -$ -$ 2$
19721MCPHERSON37$ 175$ 134$ -$ -$ -$ -$ 1$
4011MADISON2,600$ 11,865$ 6,380$ -$ 551$ -$ -$
393$ 4,540796MERRICK586$ 7,085$ 3,710$ -$ 99$ -$
-$ 19$ 3,257380MORRILL429$ 2,993$ 1,576$ -$ 96$
-$ -$ 11$ 1,310174NANCE297$ 2,811$ 1,278$ -$ 25$
-$ -$ -$ 1,508134NEMAHA623$ 2,618$ 1,208$ -$
203$ -$ -$ 54$ 1,154138NUCKOLLS397$ 2,915$
1,661$ -$ 45$ -$ -$ 14$ 1,194176OTOE1,334$ 6,984$
3,824$ -$ 298$ -$ -$ 46$ 2,814427PAWNEE265$
1,349$ 789$ -$ 92$ -$ -$ 21$ 447101PERKINS212$
1,026$ 646$ -$ 16$ -$ -$ 80$ 28574PHELPS694$
5,327$ 3,003$ -$ 106$ -$ -$ 124$
2,095374PIERCE515$ 2,127$ 1,394$ -$ 100$ -$ -$ 4$
629187PLATTE2,141$ 10,421$ 5,708$ -$ 358$ -$ -$
158$ 4,197738POLK414$ 2,525$ 1,252$ -$ 52$ -$ -$
95$ 1,125174RED WILLOW810$ 6,531$ 4,396$ -$ 119$
-$ -$ 130$ 1,886377RICHARDSON827$ 5,157$ 3,062$
-$ 54$ -$ -$ 48$ 1,994275ROCK132$ 868$ 531$ -$
8$ -$ -$ 1$ 32852SALINE1,104$ 5,897$ 3,512$ -$
331$ -$ -$ 56$ 1,998355SARPY18,014$ 156,554$
87,278$ 7,295$ 22,250$ -$ 2,089$ 1,334$
36,3074,460SAUNDERS1,695$ 11,356$ 6,476$ -$ 501$ -
$ -$ 140$ 4,239608SCOTTS BLUFF2,697$ 20,674$
10,738$ -$ 684$ -$ -$ 320$ 8,9321,270SEWARD1,050$
7,415$ 3,875$ -$ 266$ -$ -$ 168$
3,106499SHERIDAN530$ 5,500$ 1,882$ -$ 165$ -$ -$
23$ 3,430322SHERMAN281$ 2,417$ 1,427$ -$ 34$ -$
-$ 10$ 947140SIOUX108$ 434$ 94$ -$ 14$ -$ -$ 2$
32438STANTON458$ 1,585$ 817$ -$ 72$ -$ -$ 19$
677148THAYER506$ 2,626$ 1,658$ -$ 45$ -$ -$ 5$
918160THOMAS76$ 747$ 385$ -$ 11$ -$ -$ 20$
33121THURSTON477$ 1,409$ 826$ -$ 24$ -$ -$ 8$
55194VALLEY387$ 2,808$ 1,436$ -$ 44$ -$ -$ 3$
1,325209WASHINGTON1,354$ 7,162$ 3,437$ -$ 404$ -
$ -$ 78$ 3,243389WAYNE636$ 2,391$ 1,153$ -$ 110$
-$ -$ 56$ 1,071180WEBSTER335$ 2,484$ 1,477$ -$
6$ -$ -$ 3$ 998159WHEELER80$ 384$ 180$ -$ -$ -
$ -$ -$ 20427YORK1,033$ 9,263$ 4,828$ -$ 396$ -$
-$ 37$ 4,002609NEBRASKA (Totals)138,773$ 1,023,761$
487,975$ 9,837$ 63,597$ -$ 36,470$ 12,589$
413,29447,275CONG. DIST (01)48,757$ 345,875$ 173,248$
1,295$ 27,612$ -$ 27,502$ 5,026$ 111,19015,495CONG.
DIST (02)44,544$ 333,501$ 133,747$ 8,300$ 26,840$ -$
8,267$ 4,343$ 152,00511,560CONG. DIST (03)45,472$
344,385$ 180,979$ 242$ 9,144$ -$ 701$ 3,219$
150,09920,220NEBRASKA (Totals)138,773$ 1,023,761$
487,975$ 9,837$ 63,597$ -$ 36,470$ 12,589$
413,29447,275Notes:* Veteran population estimates, as of
September 30, 2013, are produced by the VA Office of the
Actuary (VetPop 2011).# Prior to FY 08, "Loan Guaranty"
expenditures were included in the Education & Vocational
Rehabilitation and Employment (E&VRE) programs.
Currently, all "Loan Guaranty" expenditures are attributed to
Travis County, TX, where all Loan Guaranty payments are
processed. VA will continue to improve data collection for
future GDX reports to better distribute loan expenditures at the
state, county and congressional district levels.** Unique
patients are patients who received treatment at a VA health care
facility. Data are provided by the Allocation Resource Center
(ARC).Expenditure data sources: USASpending.gov for
Compensation & Pension (C&P) and Education and Vocational
Rehabilitation and Employment (EVRE) Benefits; Veterans
Benefits Administration Insurance Center for the Insurance
costs; the VA Financial Management System (FMS) for
Construction, Medical Research, General Operating Expenses,
and certain C&P and Readjustment data; and the Allocation
Resource Center (ARC) for Medical Care costs.1. Expenditures
are rounded to the nearest thousand dollars. For example, $500
to $1,000 are rounded to $1; $0 to $499 are rounded to $0; and
"$ -" = 0 or no expenditures.2. The Compensation & Pension
expenditures include dollars for the following programs:
veterans' compensation for service-connected disabilities;
dependency and indemnity compensation for service-connected
deaths; veterans' pension for nonservice-connected disabilities;
and burial and other benefits to veterans and their survivors.3.
Medical Care expenditures include dollars for medical services,
medical administration, facility maintenance, educational
support, research support, and other overhead items. Medical
Care expenditures do not include dollars for construction or
other non-medical support.4. Medical Care expenditures are
based on where patients live instead of where care is
delivered.5. A star symbol (*) in the Unique Patients column
denotes that there were less than 10 Unique Patients.
&"Arial,Bold"&11FY13 GEOGRAPHIC DISTRIBUTION OF
VA EXPENDITURES (GDX)
&8&P of &N
NHFY13 Summary of Expenditures by StateExpenditures in
$000sCounty/ Congressional DistrictVeteran Population*Total
ExpenditureCompensation & PensionConstructionEducation &
Vocational Rehabilitation/ EmploymentLoan Guaranty#General
Operating ExpensesInsurance & IndemnitiesMedical
CareUnique Patients**BELKNAP6,099$ 36,934$ 18,360$ -
$ 2,007$ -$ -$ 632$ 15,9351,793CARROLL5,266$
24,268$ 12,286$ -$ 1,011$ -$ -$ 345$
10,6261,303CHESHIRE7,055$ 36,480$ 15,969$ -$ 2,370$
-$ -$ 447$ 17,6941,704COOS3,315$ 19,603$ 9,212$ -$
774$ -$ -$ 163$ 9,4541,390GRAFTON7,346$ 48,321$
19,062$ -$ 3,748$ -$ -$ 593$
24,9172,478HILLSBOROUGH30,179$ 182,668$ 71,566$
1,282$ 16,044$ -$ 6,142$ 2,651$
84,9827,678MERRIMACK13,035$ 67,423$ 28,482$ -$
6,955$ -$ -$ 988$ 30,9982,984ROCKINGHAM23,582$
114,109$ 54,813$ -$ 10,578$ -$ -$ 1,720$
46,9975,340STRAFFORD10,714$ 53,998$ 26,980$ -$
6,720$ -$ -$ 751$ 19,5472,397SULLIVAN4,187$
30,002$ 12,007$ -$ 654$ -$ -$ 181$ 17,1611,537NEW
HAMPSHIRE (Totals)110,778$ 613,805$ 268,735$ 1,282$
50,861$ -$ 6,142$ 8,473$ 278,31228,604CONG. DIST
(01)55,307$ 321,871$ 145,688$ 1,282$ 28,161$ -$
6,142$ 4,346$ 136,25114,159CONG. DIST (02)55,470$
291,934$ 123,047$ -$ 22,699$ -$ -$ 4,127$
142,06114,445NEW HAMPSHIRE (Totals)110,778$ 613,805$
268,735$ 1,282$ 50,861$ -$ 6,142$ 8,473$
278,31228,604Notes:* Veteran population estimates, as of
September 30, 2013, are produced by the VA Office of the
Actuary (VetPop 2011).# Prior to FY 08, "Loan Guaranty"
expenditures were included in the Education & Vocational
Rehabilitation and Employment (E&VRE) programs.
Currently, all "Loan Guaranty" expenditures are attributed to
Travis County, TX, where all Loan Guaranty payments are
processed. VA will continue to improve data collection for
future GDX reports to better distribute loan expenditures at the
state, county and congressional district levels.** Unique
patients are patients who received treatment at a VA health care
facility. Data are provided by the Allocation Resource Center
(ARC).Expenditure data sources: USASpending.gov for
Compensation & Pension (C&P) and Education and Vocational
Rehabilitation and Employment (EVRE) Benefits; Veterans
Benefits Administration Insurance Center for the Insurance
costs; the VA Financial Management System (FMS) for
Construction, Medical Research, General Operating Expenses,
and certain C&P and Readjustment data; and the Allocation
Resource Center (ARC) for Medical Care costs.1. Expenditures
are rounded to the nearest thousand dollars. For example, $500
to $1,000 are rounded to $1; $0 to $499 are rounded to $0; and
"$ -" = 0 or no expenditures.2. The Compensation & Pension
expenditures include dollars for the following programs:
veterans' compensation for service-connected disabilities;
dependency and indemnity compensation for service-connected
deaths; veterans' pension for nonservice-connected disabilities;
and burial and other benefits to veterans and their survivors.3.
Medical Care expenditures include dollars for medical services,
medical administration, facility maintenance, educational
support, research support, and other overhead items. Medical
Care expenditures do not include dollars for construction or
other non-medical support.4. Medical Care expenditures are
based on where patients live instead of where care is
delivered.5. A star symbol (*) in the Unique Patients column
denotes that there were less than 10 Unique Patients.
&"Arial,Bold"&11FY13 GEOGRAPHIC DISTRIBUTION OF
VA EXPENDITURES (GDX)
&8&P of &N
NJFY13 Summary of Expenditures by StateExpenditures in
$000sCounty/ Congressional DistrictVeteran Population*Total
ExpenditureCompensation & PensionConstructionEducation &
Vocational Rehabilitation/ EmploymentLoan Guaranty#General
Operating ExpensesInsurance & IndemnitiesMedical
CareUnique Patients**ATLANTIC17,174$ 65,026$ 36,560$
-$ 6,557$ -$ -$ 1,471$ 20,4382,961BERGEN33,590$
138,677$ 63,225$ -$ 17,468$ -$ -$ 6,099$
51,8856,757BURLINGTON33,670$ 180,391$ 111,015$ -$
26,352$ -$ -$ 2,537$ 40,4886,061CAMDEN30,510$
139,164$ 77,312$ -$ 12,890$ -$ -$ 2,305$
46,6585,634CAPE MAY8,741$ 30,607$ 19,436$ -$ 1,970$
-$ -$ 1,014$ 8,1871,570CUMBERLAND9,117$ 35,536$
20,069$ -$ 2,368$ -$ -$ 463$
12,6361,775ESSEX26,070$ 225,698$ 62,528$ 6,578$
17,720$ -$ 14,756$ 3,282$
120,8356,593GLOUCESTER20,065$ 81,522$ 45,711$ -$
6,830$ -$ -$ 1,164$ 27,8183,848HUDSON15,693$
78,764$ 30,721$ -$ 16,208$ -$ -$ 1,179$
30,6562,857HUNTERDON7,099$ 25,766$ 11,548$ -$
1,876$ -$ -$ 1,166$ 11,177876MERCER17,267$ 60,272$
32,281$ -$ 7,135$ -$ -$ 2,188$
18,6692,086MIDDLESEX31,612$ 132,453$ 59,106$ -$
15,221$ -$ -$ 4,152$ 53,9745,396MONMOUTH33,438$
124,451$ 67,933$ -$ 11,538$ -$ -$ 5,707$
39,2724,971MORRIS23,381$ 73,861$ 31,434$ -$ 7,656$
-$ -$ 4,190$ 30,5803,403OCEAN45,053$ 184,226$
105,258$ -$ 12,103$ -$ -$ 5,872$
60,9929,566PASSAIC17,436$ 71,317$ 28,936$ -$ 10,093$
-$ -$ 2,722$ 29,5663,080SALEM5,534$ 19,873$ 10,347$
-$ 1,342$ -$ -$ 183$ 8,001865SOMERSET13,416$
87,322$ 23,682$ -$ 3,786$ -$ 1,112$ 2,050$
56,6912,427SUSSEX9,097$ 33,919$ 15,997$ -$ 3,177$ -
$ -$ 611$ 14,1351,489UNION19,481$ 112,335$ 40,246$
-$ 11,393$ -$ -$ 3,005$ 57,6913,965WARREN7,648$
25,842$ 13,399$ -$ 2,432$ -$ -$ 635$ 9,376999NEW
JERSEY (Totals)425,094$ 1,927,021$ 906,744$ 6,578$
196,113$ -$ 15,868$ 51,994$ 749,72477,179CONG. DIST
(01)46,272$ 208,094$ 116,688$ -$ 19,379$ -$ -$
3,143$ 68,8848,736CONG. DIST (02)51,091$ 186,219$
106,134$ -$ 15,004$ -$ -$ 3,998$ 61,0838,927CONG.
DIST (03)57,521$ 270,499$ 162,276$ -$ 31,358$ -$ -$
5,093$ 71,77211,034CONG. DIST (04)43,723$ 168,836$
93,523$ -$ 14,074$ -$ -$ 7,117$ 54,1227,556CONG.
DIST (05)34,035$ 122,412$ 56,545$ -$ 14,111$ -$ -$
5,099$ 46,6586,044CONG. DIST (06)29,728$ 125,403$
60,578$ -$ 13,567$ -$ -$ 3,746$ 47,5124,765CONG.
DIST (07)34,198$ 156,529$ 54,491$ -$ 10,766$ -$
1,112$ 5,590$ 84,5695,116CONG. DIST (08)14,383$
84,851$ 31,110$ -$ 12,464$ -$ -$ 1,175$
40,1023,053CONG. DIST (09)22,560$ 110,394$ 48,329$ -$
15,255$ -$ -$ 3,273$ 43,5374,656CONG. DIST
(10)25,442$ 246,348$ 75,579$ 6,578$ 24,644$ -$
14,756$ 1,962$ 122,8296,904CONG. DIST (11)34,950$
112,837$ 42,428$ -$ 11,281$ -$ -$ 6,788$
52,3415,196CONG. DIST (12)31,192$ 134,598$ 59,064$ -$
14,209$ -$ -$ 5,009$ 56,3165,191NEW JERSEY
(Totals)425,094$ 1,927,021$ 906,744$ 6,578$ 196,113$ -
$ 15,868$ 51,994$ 749,72477,178Notes:* Veteran
population estimates, as of September 30, 2013, are produced by
the VA Office of the Actuary (VetPop 2011).# Prior to FY 08,
"Loan Guaranty" expenditures were included in the Education &
Vocational Rehabilitation and Employment (E&VRE) programs.
Currently, all "Loan Guaranty" expenditures are attributed to
Travis County, TX, where all Loan Guaranty payments are
processed. VA will continue to improve data collection for
future GDX reports to better distribute loan expenditures at the
state, county and congressional district levels.** Unique
patients are patients who received treatment at a VA health care
facility. Data are provided by the Allocation Resource Center
(ARC).Expenditure data sources: USASpending.gov for
Compensation & Pension (C&P) and Education and Vocational
Rehabilitation and Employment (EVRE) Benefits; Veterans
Benefits Administration Insurance Center for the Insurance
costs; the VA Financial Management System (FMS) for
Construction, Medical Research, General Operating Expenses,
and certain C&P and Readjustment data; and the Allocation
Resource Center (ARC) for Medical Care costs.1. Expenditures
are rounded to the nearest thousand dollars. For example, $500
to $1,000 are rounded to $1; $0 to $499 are rounded to $0; and
"$ -" = 0 or no expenditures.2. The Compensation & Pension
expenditures include dollars for the following programs:
veterans' compensation for service-connected disabilities;
dependency and indemnity compensation for service-connected
deaths; veterans' pension for nonservice-connected disabilities;
and burial and other benefits to veterans and their survivors.3.
Medical Care expenditures include dollars for medical services,
medical administration, facility maintenance, educational
support, research support, and other overhead items. Medical
Care expenditures do not include dollars for construction or
other non-medical support.4. Medical Care expenditures are
based on where patients live instead of where care is
delivered.5. A star symbol (*) in the Unique Patients column
denotes that there were less than 10 Unique Patients.
&"Arial,Bold"&11FY13 GEOGRAPHIC DISTRIBUTION OF
VA EXPENDITURES (GDX)
&8&P of &N
NMFY13 Summary of Expenditures by StateExpenditures in
$000sCounty/ Congressional DistrictVeteran Population*Total
ExpenditureCompensation & PensionConstructionEducation &
Vocational Rehabilitation/ EmploymentLoan Guaranty#General
Operating ExpensesInsurance & IndemnitiesMedical
CareUnique Patients**BERNALILLO54,077$ 530,007$
238,373$ 19,141$ 29,472$ -$ 10,999$ 4,781$
227,24117,050CATRON482$ 4,174$ 2,219$ -$ 76$ -$ -
$ 17$ 1,861185CHAVES5,299$ 25,792$ 14,759$ -$
1,101$ -$ -$ 372$ 9,5601,267CIBOLA2,148$ 17,473$
9,214$ -$ 258$ -$ -$ 29$ 7,973643COLFAX1,542$
11,446$ 6,544$ -$ 149$ -$ -$ 54$
4,700540CURRY4,887$ 33,283$ 19,738$ -$ 3,042$ -$ -
$ 852$ 9,6511,361DE BACA225$ 1,416$ 844$ -$ 16$
-$ -$ 2$ 55469DONA ANA14,841$ 91,417$ 54,829$ -$
8,929$ -$ -$ 1,357$ 26,3034,086EDDY4,275$ 18,211$
10,809$ -$ 342$ -$ -$ 122$ 6,9381,003GRANT3,554$
24,521$ 12,899$ 3,054$ 576$ -$ -$ 302$
7,6901,122GUADALUPE444$ 3,663$ 2,112$ -$ 50$ -$
-$ 16$ 1,485142HARDING92$ 1,176$ 302$ -$ 18$ -$
-$ -$ 85638HIDALGO468$ 1,875$ 1,046$ -$ 65$ -$ -
$ 2$ 76195LEA3,613$ 16,280$ 8,200$ -$ 536$ -$ -$
111$ 7,434883LINCOLN2,324$ 13,734$ 7,771$ -$ 286$
-$ -$ 191$ 5,485662LOS ALAMOS1,670$ 3,187$ 2,053$
-$ 268$ -$ -$ 113$ 753128LUNA2,354$ 13,653$
7,847$ -$ 232$ -$ -$ 148$ 5,427669MC KINLEY3,728$
29,948$ 17,930$ -$ 1,208$ -$ -$ 80$
10,7301,200MORA469$ 6,439$ 3,894$ -$ 39$ -$ -$
58$ 2,449219OTERO8,832$ 54,499$ 35,306$ -$ 4,312$
-$ -$ 361$ 14,5202,257QUAY983$ 7,675$ 4,161$ -$
107$ -$ -$ 54$ 3,354375RIO ARRIBA2,650$ 20,415$
12,900$ -$ 400$ -$ -$ 221$
6,893714ROOSEVELT1,405$ 7,335$ 4,228$ -$ 801$ -$
-$ 55$ 2,250318SANDOVAL12,540$ 102,802$ 56,638$ -
$ 6,106$ -$ -$ 952$ 39,1063,661SAN JUAN9,361$
41,155$ 23,877$ -$ 2,250$ -$ -$ 278$
14,7511,996SAN MIGUEL2,129$ 22,972$ 14,535$ -$
433$ -$ -$ 81$ 7,924843SANTA FE10,836$ 72,934$
40,623$ 4,376$ 2,521$ -$ 1,587$ 753$
23,0742,976SIERRA2,239$ 16,598$ 8,824$ -$ 141$ -$ -
$ 211$ 7,422829SOCORRO1,593$ 12,486$ 6,894$ -$
439$ -$ -$ 45$ 5,107509TAOS2,550$ 24,796$ 15,648$
-$ 412$ -$ -$ 467$ 8,2701,102TORRANCE1,931$
15,171$ 7,716$ -$ 276$ -$ -$ 40$
7,139580UNION270$ 2,034$ 1,247$ -$ 27$ -$ -$ 29$
732125VALENCIA6,886$ 64,375$ 32,244$ -$ 2,427$ -$
-$ 597$ 29,1072,334NEW MEXICO (Totals)170,699$
1,312,943$ 686,222$ 26,571$ 67,315$ -$ 12,586$
12,750$ 507,49949,981CONG. DIST (01)57,153$ 564,070$
257,492$ 19,141$ 30,489$ -$ 10,999$ 4,921$
241,02818,019CONG. DIST (02)60,175$ 381,681$ 217,299$
3,054$ 20,105$ -$ -$ 3,843$ 137,38016,843CONG. DIST
(03)53,371$ 367,192$ 211,431$ 4,376$ 16,722$ -$
1,587$ 3,986$ 129,09115,119NEW MEXICO
(Totals)170,699$ 1,312,943$ 686,222$ 26,571$ 67,315$ -
$ 12,586$ 12,750$ 507,49949,981Notes:* Veteran
population estimates, as of September 30, 2013, are produced by
the VA Office of the Actuary (VetPop 2011).# Prior to FY 08,
"Loan Guaranty" expenditures were included in the Education &
Vocational Rehabilitation and Employment (E&VRE) programs.
Currently, all "Loan Guaranty" expenditures are attributed to
Travis County, TX, where all Loan Guaranty payments are
processed. VA will continue to improve data collection for
future GDX reports to better distribute loan expenditures at the
state, county and congressional district levels.** Unique
patients are patients who received treatment at a VA health care
facility. Data are provided by the Allocation Resource Center
(ARC).Expenditure data sources: USASpending.gov for
Compensation & Pension (C&P) and Education and Vocational
Rehabilitation and Employment (EVRE) Benefits; Veterans
Benefits Administration Insurance Center for the Insurance
costs; the VA Financial Management System (FMS) for
Construction, Medical Research, General Operating Expenses,
and certain C&P and Readjustment data; and the Allocation
Resource Center (ARC) for Medical Care costs.1. Expenditures
are rounded to the nearest thousand dollars. For example, $500
to $1,000 are rounded to $1; $0 to $499 are rounded to $0; and
"$ -" = 0 or no expenditures.2. The Compensation & Pension
expenditures include dollars for the following programs:
veterans' compensation for service-connected disabilities;
dependency and indemnity compensation for service-connected
deaths; veterans' pension for nonservice-connected disabilities;
and burial and other benefits to veterans and their survivors.3.
Medical Care expenditures include dollars for medical services,
medical administration, facility maintenance, educational
support, research support, and other overhead items. Medical
Care expenditures do not include dollars for construction or
other non-medical support.4. Medical Care expenditures are
based on where patients live instead of where care is
delivered.5. A star symbol (*) in the Unique Patients column
denotes that there were less than 10 Unique Patients.
&"Arial,Bold"&11FY13 GEOGRAPHIC DISTRIBUTION OF
VA EXPENDITURES (GDX)
&8&P of &N
NVFY13 Summary of Expenditures by StateExpenditures in
$000sCounty/ Congressional DistrictVeteran Population*Total
ExpenditureCompensation & PensionConstructionEducation &
Vocational Rehabilitation/ EmploymentLoan Guaranty#General
Operating ExpensesInsurance & IndemnitiesMedical
CareUnique Patients**CHURCHILL3,971$ 27,110$ 13,744$
-$ 1,419$ -$ -$ 358$ 11,5901,189CLARK152,847$
1,051,792$ 439,575$ 11,348$ 76,659$ -$ 2,990$ 9,488$
511,73240,214DOUGLAS4,657$ 24,879$ 11,353$ -$ 910$
-$ -$ 389$ 12,2261,639ELKO4,134$ 16,229$ 6,552$ -$
585$ -$ -$ 67$ 9,025849ESMERALDA199$ 750$ 249$
-$ 30$ -$ -$ 10$ 46038EUREKA210$ 605$ 243$ -$
13$ -$ -$ 1$ 34737HUMBOLDT1,501$ 7,530$ 3,422$
-$ 106$ -$ -$ 98$ 3,903355LANDER590$ 1,384$ 612$
-$ 80$ -$ -$ -$ 69285LINCOLN638$ 1,880$ 1,099$ -
$ 59$ -$ -$ 13$ 70993LYON6,866$ 46,786$ 20,600$
-$ 1,940$ -$ -$ 301$ 23,9452,427MINERAL979$
5,198$ 2,201$ -$ 64$ -$ -$ 52$ 2,881214NYE6,142$
54,632$ 24,741$ -$ 698$ -$ -$ 630$
28,5632,602PERSHING797$ 2,576$ 1,054$ -$ 29$ -$ -$
20$ 1,473178STOREY689$ 2,701$ 315$ -$ 13$ -$ -$
17$ 2,356182WASHOE34,718$ 289,245$ 98,363$ 8,293$
11,838$ -$ 10,515$ 2,766$ 157,46913,193WHITE
PINE1,254$ 5,813$ 1,966$ -$ 88$ -$ -$ 91$
3,668309CARSON CITY5,742$ 33,982$ 15,880$ -$
1,029$ -$ -$ 214$ 16,8581,839NEVADA (Totals)225,933$
1,573,091$ 641,969$ 19,641$ 95,562$ -$ 13,505$
14,516$ 787,89965,443CONG. DIST (01)46,676$ 420,860$
172,011$ 11,348$ 29,997$ -$ 2,990$ 2,844$
201,67113,934CONG. DIST (02)62,406$ 446,325$ 169,188$
8,293$ 17,686$ -$ 10,515$ 4,197$ 236,44621,584CONG.
DIST (03)55,365$ 280,758$ 118,892$ -$ 20,734$ -$ -$
3,174$ 137,95812,894CONG. DIST (04)61,486$ 425,147$
181,877$ -$ 27,145$ -$ -$ 4,301$
211,82517,031NEVADA (Totals)225,933$ 1,573,091$
641,969$ 19,641$ 95,562$ -$ 13,505$ 14,516$
787,89965,443Notes:* Veteran population estimates, as of
September 30, 2013, are produced by the VA Office of the
Actuary (VetPop 2011).# Prior to FY 08, "Loan Guaranty"
expenditures were included in the Education & Vocational
Rehabilitation and Employment (E&VRE) programs.
Currently, all "Loan Guaranty" expenditures are attributed to
Travis County, TX, where all Loan Guaranty payments are
processed. VA will continue to improve data collection for
future GDX reports to better distribute loan expenditures at the
state, county and congressional district levels.** Unique
patients are patients who received treatment at a VA health care
facility. Data are provided by the Allocation Resource Center
(ARC).Expenditure data sources: USASpending.gov for
Compensation & Pension (C&P) and Education and Vocational
Rehabilitation and Employment (EVRE) Benefits; Veterans
Benefits Administration Insurance Center for the Insurance
costs; the VA Financial Management System (FMS) for
Construction, Medical Research, General Operating Expenses,
and certain C&P and Readjustment data; and the Allocation
Resource Center (ARC) for Medical Care costs.1. Expenditures
are rounded to the nearest thousand dollars. For example, $500
to $1,000 are rounded to $1; $0 to $499 are rounded to $0; and
"$ -" = 0 or no expenditures.2. The Compensation & Pension
expenditures include dollars for the following programs:
veterans' compensation for service-connected disabilities;
dependency and indemnity compensation for service-connected
deaths; veterans' pension for nonservice-connected disabilities;
and burial and other benefits to veterans and their survivors.3.
Medical Care expenditures include dollars for medical services,
medical administration, facility maintenance, educational
support, research support, and other overhead items. Medical
Care expenditures do not include dollars for construction or
other non-medical support.4. Medical Care expenditures are
based on where patients live instead of where care is
delivered.5. A star symbol (*) in the Unique Patients column
denotes that there were less than 10 Unique Patients.
&"Arial,Bold"&11FY13 GEOGRAPHIC DISTRIBUTION OF
VA EXPENDITURES (GDX)
&8&P of &N
NYFY13 Summary of Expenditures by StateExpenditures in
$000sCounty/ Congressional DistrictVeteran Population*Total
ExpenditureCompensation & PensionConstructionEducation &
Vocational Rehabilitation/ EmploymentLoan Guaranty#General
Operating ExpensesInsurance & IndemnitiesMedical
CareUnique Patients**ALBANY19,513$ 133,312$ 40,903$
1,522$ 7,458$ -$ 6,365$ 1,763$
75,3024,743ALLEGANY4,160$ 30,927$ 12,888$ -$
1,354$ -$ -$ 262$ 16,4231,531BRONX35,073$ 344,602$
89,106$ 700$ 40,139$ -$ 2,906$ 1,651$
210,10110,682BROOME14,596$ 52,449$ 29,406$ -$
3,285$ -$ -$ 1,113$ 18,6463,288CATTARAUGUS7,312$
47,182$ 24,324$ -$ 2,203$ -$ -$ 355$
20,3002,359CAYUGA6,401$ 32,830$ 14,195$ -$ 1,518$
-$ -$ 259$ 16,8571,943CHAUTAUQUA10,719$ 71,340$
37,375$ -$ 2,703$ -$ -$ 705$
30,5574,062CHEMUNG7,853$ 48,859$ 23,263$ -$ 2,048$
-$ -$ 836$ 22,7122,462CHENANGO4,553$ 21,070$
10,847$ -$ 1,009$ -$ -$ 380$ 8,835994CLINTON6,703$
36,666$ 22,940$ -$ 1,875$ -$ -$ 421$
11,4302,000COLUMBIA4,910$ 22,284$ 9,137$ -$ 550$ -
$ -$ 343$ 12,2551,130CORTLAND3,515$ 19,537$
7,531$ -$ 906$ -$ -$ 126$
10,9731,083DELAWARE3,678$ 16,635$ 7,796$ -$ 583$
-$ -$ 278$ 7,977844DUTCHESS18,063$ 119,606$
35,745$ -$ 8,384$ -$ 593$ 1,970$
72,9134,755ERIE62,686$ 491,832$ 194,254$ 6,650$
27,267$ -$ 47,754$ 6,352$ 209,55419,050ESSEX3,797$
15,631$ 8,013$ -$ 735$ -$ -$ 177$
6,706938FRANKLIN3,994$ 18,710$ 11,250$ -$ 1,256$ -
$ -$ 230$ 5,9741,050FULTON4,546$ 19,174$ 9,502$ -$
1,186$ -$ -$ 226$ 8,260950GENESEE4,218$ 47,822$
14,651$ 53$ 1,588$ -$ 304$ 470$
30,7561,840GREENE4,021$ 23,987$ 9,226$ -$ 630$ -$
-$ 182$ 13,9491,125HAMILTON647$ 1,652$ 700$ -$
42$ -$ -$ 9$ 90198HERKIMER5,387$ 23,060$ 12,821$
-$ 1,290$ -$ -$ 277$ 8,6731,273JEFFERSON13,150$
86,739$ 45,476$ -$ 18,311$ -$ -$ 1,272$
21,6803,651KINGS52,159$ 464,548$ 130,097$ -$ 61,532$
-$ -$ 3,769$ 269,15013,351LEWIS2,188$ 12,552$
6,828$ -$ 1,010$ -$ -$ 63$
4,650694LIVINGSTON4,797$ 21,793$ 10,055$ -$ 1,400$
-$ -$ 342$ 9,9951,270MADISON5,188$ 28,609$ 11,821$
-$ 1,900$ -$ -$ 599$ 14,2901,412MONROE44,177$
196,184$ 86,354$ -$ 19,036$ -$ -$ 4,169$
86,62511,470MONTGOMERY3,853$ 20,584$ 11,362$ -$
1,042$ -$ -$ 211$ 7,969850NASSAU54,849$ 233,363$
96,969$ -$ 26,594$ -$ -$ 12,544$ 97,25611,754NEW
YORK37,720$ 296,165$ 71,695$ 7,046$ 43,833$ -$
27,821$ 8,572$ 137,1978,691NIAGARA17,710$ 98,809$
46,908$ -$ 6,809$ -$ -$ 1,320$
43,7724,588ONEIDA17,531$ 95,795$ 49,926$ -$ 5,919$
-$ -$ 1,783$ 38,1674,946ONONDAGA29,198$ 227,026$
71,716$ 17$ 14,735$ -$ 1,496$ 2,205$
136,8589,647ONTARIO8,260$ 64,668$ 20,146$ -$ 2,647$
-$ 1,109$ 488$ 40,2783,001ORANGE21,979$ 132,886$
55,790$ -$ 15,340$ -$ -$ 2,142$
59,6155,118ORLEANS3,142$ 19,445$ 10,107$ -$ 648$ -
$ -$ 81$ 8,609954OSWEGO9,940$ 60,784$ 22,732$ -$
3,802$ -$ -$ 667$ 33,5843,354OTSEGO4,361$ 21,857$
12,752$ -$ 1,038$ -$ -$ 372$ 7,694995PUTNAM4,749$
23,297$ 9,431$ -$ 1,946$ -$ -$ 432$
11,4881,166QUEENS55,558$ 364,577$ 110,919$ -$
56,139$ -$ -$ 5,747$
191,77211,042RENSSELAER11,798$ 62,781$ 25,292$ -$
4,163$ -$ -$ 872$ 32,4552,779RICHMOND20,733$
120,984$ 49,459$ -$ 11,120$ -$ -$ 1,953$
58,4524,026ROCKLAND10,546$ 53,695$ 25,104$ -$
4,899$ -$ -$ 1,302$ 22,3903,081ST. LAWRENCE9,039$
44,999$ 28,457$ -$ 3,214$ -$ -$ 560$
12,7682,341SARATOGA17,485$ 69,736$ 32,346$ -$
6,049$ -$ -$ 1,115$ 30,2263,481SCHENECTADY11,040$
50,863$ 22,329$ -$ 3,628$ -$ -$ 1,094$
23,8112,437SCHOHARIE2,746$ 14,366$ 6,340$ -$ 592$
-$ -$ 95$ 7,339614SCHUYLER1,704$ 9,824$ 4,333$ -$
363$ -$ -$ 138$ 4,990539SENECA2,662$ 15,818$
6,608$ -$ 919$ -$ -$ 157$ 8,135850STEUBEN8,720$
90,958$ 28,434$ 412$ 2,594$ -$ 1,734$ 344$
57,4403,639SUFFOLK76,577$ 496,356$ 145,538$ 911$
33,191$ -$ 28,939$ 9,588$
278,18919,971SULLIVAN4,954$ 30,818$ 12,324$ -$
1,063$ -$ -$ 232$ 17,1991,407TIOGA4,655$ 15,975$
8,807$ -$ 651$ -$ -$ 291$
6,2261,080TOMPKINS4,964$ 20,801$ 9,666$ -$ 2,013$
-$ -$ 1,218$ 7,9041,073ULSTER12,710$ 53,208$
21,313$ -$ 3,372$ -$ -$ 1,023$
27,5002,886WARREN6,353$ 26,016$ 14,025$ -$ 1,573$
-$ -$ 362$ 10,0571,472WASHINGTON5,665$ 22,488$
12,355$ -$ 1,375$ -$ -$ 113$
8,6451,287WAYNE7,208$ 38,371$ 15,761$ -$ 1,964$ -$
-$ 515$ 20,1312,080WESTCHESTER34,115$ 241,511$
73,207$ 211$ 17,412$ -$ 1,536$ 7,706$
141,4398,248WYOMING3,284$ 17,667$ 8,648$ -$ 752$
-$ -$ 131$ 8,137979YATES1,984$ 15,827$ 6,261$ -$
504$ -$ -$ 144$ 8,917737NEW YORK (Totals)885,796$
5,621,911$ 2,063,566$ 17,521$ 493,102$ -$ 120,558$
94,116$ 2,833,048231,161CONG. DIST (01)40,726$
209,374$ 56,218$ 911$ 12,821$ -$ 28,939$ 4,525$
105,9619,713CONG. DIST (02)33,516$ 204,234$ 68,246$ -
$ 16,470$ -$ -$ 3,949$ 115,5698,836CONG. DIST
(03)31,777$ 197,073$ 66,363$ -$ 17,247$ -$ -$ 8,388$
105,0757,595CONG. DIST (04)28,472$ 118,220$ 49,207$ -
$ 13,495$ -$ -$ 6,152$ 49,3675,987CONG. DIST
(05)21,195$ 210,506$ 66,466$ -$ 32,140$ -$ -$ 1,960$
109,9405,000CONG. DIST (06)16,582$ 69,131$ 20,674$ -$
10,463$ -$ -$ 2,112$ 35,8822,769CONG. DIST
(07)11,245$ 84,726$ 24,100$ -$ 12,044$ -$ -$ 1,026$
47,5572,806CONG. DIST (08)18,233$ 177,794$ 50,361$ -$
23,968$ -$ -$ 858$ 102,6074,992CONG. DIST
(09)14,360$ 129,977$ 36,413$ -$ 17,222$ -$ -$ 1,014$
75,3283,846CONG. DIST (10)15,173$ 86,366$ 24,000$ -$
13,331$ -$ -$ 3,011$ 46,0242,994CONG. DIST
(11)29,082$ 189,733$ 68,571$ -$ 20,159$ -$ -$ 2,998$
98,0055,768CONG. DIST (12)18,585$ 138,199$ 29,034$
7,046$ 16,629$ -$ 27,821$ 4,956$ 52,7133,564CONG.
DIST (13)14,892$ 189,655$ 53,574$ -$ 29,682$ -$ -$
1,179$ 105,2205,123CONG. DIST (14)17,000$ 90,730$
23,557$ -$ 11,199$ -$ -$ 771$ 55,2043,274CONG.
DIST (15)12,571$ 153,945$ 40,544$ 700$ 18,263$ -$
2,906$ 149$ 91,3835,091CONG. DIST (16)25,834$
146,836$ 39,596$ -$ 12,917$ -$ -$ 4,067$
90,2565,963CONG. DIST (17)24,997$ 207,661$ 72,605$
211$ 16,197$ -$ 1,536$ 4,884$ 112,2276,969CONG.
DIST (18)40,295$ 245,715$ 91,809$ -$ 23,530$ -$ 593$
4,817$ 124,9669,720CONG. DIST (19)51,507$ 259,655$
105,918$ -$ 12,764$ -$ -$ 3,471$ 137,50212,458CONG.
DIST (20)49,698$ 269,392$ 102,237$ 1,522$ 17,390$ -$
6,365$ 4,314$ 137,56511,088CONG. DIST (21)64,521$
319,866$ 176,162$ -$ 33,534$ -$ -$ 3,967$
106,20316,364CONG. DIST (22)54,592$ 267,740$ 132,259$
-$ 16,009$ -$ -$ 4,440$ 115,03214,380CONG. DIST
(23)57,139$ 385,218$ 167,387$ 412$ 16,120$ -$ 1,734$
4,664$ 194,90019,304CONG. DIST (24)48,863$ 327,425$
113,495$ 17$ 20,195$ -$ 1,496$ 3,348$
188,87515,595CONG. DIST (25)42,244$ 188,397$ 82,899$
-$ 18,273$ -$ -$ 4,065$ 83,16011,018CONG. DIST
(26)48,426$ 427,310$ 168,464$ 6,650$ 23,748$ -$
47,754$ 4,601$ 176,09315,290CONG. DIST (27)54,272$
327,029$ 133,407$ 53$ 17,291$ -$ 1,413$ 4,430$
170,43515,654NEW YORK (Totals)885,796$ 5,621,911$
2,063,566$ 17,521$ 493,102$ -$ 120,558$ 94,116$
2,833,048231,161Notes:* Veteran population estimates, as of
September 30, 2013, are produced by the VA Office of the
Actuary (VetPop 2011).# Prior to FY 08, "Loan Guaranty"
expenditures were included in the Education & Vocational
Rehabilitation and Employment (E&VRE) programs.
Currently, all "Loan Guaranty" expenditures are attributed to
Travis County, TX, where all Loan Guaranty payments are
processed. VA will continue to improve data collection for
future GDX reports to better distribute loan expenditures at the
state, county and congressional district levels.** Unique
patients are patients who received treatment at a VA health care
facility. Data are provided by the Allocation Resource Center
(ARC).Expenditure data sources: USASpending.gov for
Compensation & Pension (C&P) and Education and Vocational
Rehabilitation and Employment (EVRE) Benefits; Veterans
Benefits Administration Insurance Center for the Insurance
costs; the VA Financial Management System (FMS) for
Construction, Medical Research, General Operating Expenses,
and certain C&P and Readjustment data; and the Allocation
Resource Center (ARC) for Medical Care costs.1. Expenditures
are rounded to the nearest thousand dollars. For example, $500
to $1,000 are rounded to $1; $0 to $499 are rounded to $0; and
"$ -" = 0 or no expenditures.2. The Compensation & Pension
expenditures include dollars for the following programs:
veterans' compensation for service-connected disabilities;
dependency and indemnity compensation for service-connected
deaths; veterans' pension for nonservice-connected disabilities;
and burial and other benefits to veterans and their survivors.3.
Medical Care expenditures include dollars for medical services,
medical administration, facility maintenance, educational
support, research support, and other overhead items. Medical
Care expenditures do not include dollars for construction or
other non-medical support.4. Medical Care expenditures are
based on where patients live instead of where care is
delivered.5. A star symbol (*) in the Unique Patients column
denotes that there were less than 10 Unique Patients.
&"Arial,Bold"&11FY13 GEOGRAPHIC DISTRIBUTION OF
VA EXPENDITURES (GDX)
&8&P of &N
OHFY13 Summary of Expenditures by StateExpenditures in
$000sCounty/ Congressional DistrictVeteran Population*Total
ExpenditureCompensation & PensionConstructionEducation &
Vocational Rehabilitation/ EmploymentLoan Guaranty#General
Operating ExpensesInsurance & IndemnitiesMedical
CareUnique Patients**ADAMS2,002$ 16,022$ 7,046$ -$
447$ -$ -$ 32$ 8,496729ALLEN8,438$ 35,784$ 18,046$
-$ 2,260$ -$ -$ 277$ 15,2001,753ASHLAND4,144$
20,674$ 9,150$ -$ 1,421$ -$ -$ 151$
9,9531,230ASHTABULA9,037$ 47,579$ 20,917$ -$
2,269$ -$ -$ 247$ 24,1473,008ATHENS4,093$ 32,935$
13,944$ -$ 2,659$ -$ -$ 312$
16,0191,291AUGLAIZE4,242$ 12,621$ 6,192$ -$ 842$ -
$ -$ 304$ 5,283756BELMONT6,312$ 24,470$ 13,235$ -
$ 836$ -$ -$ 294$ 10,1051,698BROWN3,728$ 22,437$
8,271$ -$ 720$ -$ -$ 86$ 13,3601,203BUTLER26,644$
120,003$ 49,754$ -$ 9,338$ -$ -$ 1,406$
59,5055,790CARROLL2,488$ 9,756$ 3,600$ -$ 385$ -$
-$ 73$ 5,697715CHAMPAIGN3,175$ 13,296$ 6,141$ -$
1,011$ -$ -$ 339$ 5,804618CLARK13,611$ 66,756$
32,543$ -$ 3,576$ -$ -$ 621$
30,0163,069CLERMONT16,126$ 76,009$ 30,314$ -$
5,229$ -$ -$ 1,221$ 39,2454,063CLINTON3,535$
21,289$ 9,681$ -$ 1,258$ -$ -$ 417$
9,934863COLUMBIANA9,393$ 49,923$ 24,100$ -$
2,560$ -$ -$ 494$ 22,7703,044COSHOCTON3,029$
12,730$ 6,913$ -$ 525$ -$ -$ 122$
5,171942CRAWFORD4,144$ 18,339$ 9,012$ -$ 838$ -$
-$ 153$ 8,3361,070CUYAHOGA82,786$ 2,763,705$
188,469$ 10,883$ 29,351$ -$ 2,192,066$ 7,545$
335,39222,635DARKE3,734$ 17,167$ 8,240$ -$ 683$ -$
-$ 177$ 8,067907DEFIANCE2,994$ 12,714$ 7,636$ -$
776$ -$ -$ 174$ 4,129674DELAWARE12,107$ 30,205$
15,227$ -$ 3,118$ -$ -$ 752$ 11,1091,642ERIE8,117$
37,903$ 18,826$ -$ 1,472$ -$ -$ 676$
16,9292,193FAIRFIELD12,661$ 59,682$ 24,744$ -$
4,481$ -$ -$ 1,072$ 29,3853,234FAYETTE2,339$
15,966$ 5,594$ -$ 597$ -$ -$ 21$
9,755645FRANKLIN71,679$ 355,984$ 149,554$ 1,893$
41,205$ -$ 1,086$ 4,758$ 157,48718,468FULTON2,985$
11,564$ 6,238$ -$ 756$ -$ -$ 182$
4,387661GALLIA2,401$ 18,017$ 8,693$ -$ 676$ -$ -$
59$ 8,588841GEAUGA6,206$ 24,127$ 10,108$ -$ 1,126$
-$ -$ 713$ 12,1791,364GREENE16,755$ 98,440$
53,133$ -$ 15,262$ -$ -$ 1,362$
28,6833,002GUERNSEY3,313$ 22,667$ 10,938$ -$ 770$
-$ -$ 112$ 10,8461,385HAMILTON50,316$ 322,653$
98,529$ 14,925$ 24,090$ -$ 2,081$ 5,287$
177,74113,237HANCOCK5,569$ 17,419$ 8,725$ -$
1,437$ -$ -$ 323$ 6,9351,063HARDIN2,157$ 9,865$
5,251$ -$ 651$ -$ -$ 46$ 3,917509HARRISON1,564$
8,270$ 3,775$ -$ 320$ -$ -$ 13$
4,163457HENRY2,275$ 6,330$ 3,261$ -$ 313$ -$ -$
258$ 2,498374HIGHLAND3,564$ 26,315$ 9,159$ -$
872$ -$ -$ 78$ 16,2061,119HOCKING2,807$ 13,665$
6,270$ -$ 423$ -$ -$ 86$ 6,886776HOLMES1,524$
14,254$ 3,127$ -$ 194$ -$ -$ 94$
10,838409HURON4,824$ 21,517$ 11,168$ -$ 1,178$ -$
-$ 285$ 8,8861,255JACKSON2,871$ 25,950$ 10,807$ -$
522$ -$ -$ 46$ 14,5761,013JEFFERSON6,627$ 29,235$
14,185$ -$ 1,466$ -$ -$ 693$ 12,8901,705KNOX4,923$
18,023$ 8,618$ -$ 1,525$ -$ -$ 269$
7,6101,127LAKE18,931$ 85,419$ 35,334$ -$ 5,287$ -$
-$ 1,506$ 43,2925,098LAWRENCE5,192$ 44,478$
19,028$ -$ 1,077$ -$ -$ 209$
24,1632,028LICKING15,060$ 60,874$ 28,866$ -$ 4,156$
-$ -$ 675$ 27,1773,937LOGAN4,030$ 15,378$ 7,833$ -
$ 1,083$ -$ -$ 385$ 6,077716LORAIN26,902$ 103,884$
43,446$ -$ 6,099$ -$ -$ 1,720$
52,6196,511LUCAS29,788$ 112,860$ 49,947$ -$ 8,315$
-$ -$ 2,134$ 52,4656,407MADISON3,909$ 13,739$
6,896$ -$ 941$ -$ -$ 131$
5,771636MAHONING19,810$ 93,063$ 41,093$ -$ 5,866$
-$ -$ 2,024$ 44,0805,895MARION5,073$ 21,560$
10,639$ -$ 1,164$ -$ -$ 146$
9,6121,291MEDINA13,677$ 48,443$ 23,468$ -$ 3,212$ -
$ -$ 1,070$ 20,6942,497MEIGS2,297$ 10,845$ 5,134$ -
$ 242$ -$ -$ 119$ 5,350640MERCER2,723$ 11,055$
5,971$ -$ 508$ -$ -$ 147$ 4,430678MIAMI8,574$
38,204$ 16,974$ -$ 2,633$ -$ -$ 544$
18,0531,785MONROE1,589$ 5,320$ 2,787$ -$ 129$ -$
-$ 127$ 2,277418MONTGOMERY45,329$ 307,521$
117,023$ 376$ 21,327$ -$ 4,798$ 2,789$
161,20911,844MORGAN1,571$ 7,474$ 4,068$ -$ 257$ -
$ -$ 33$ 3,116405MORROW3,078$ 11,683$ 4,976$ -$
632$ -$ -$ 94$ 5,982855MUSKINGUM6,866$ 31,630$
16,200$ -$ 1,900$ -$ -$ 208$
13,3212,200NOBLE1,196$ 3,519$ 1,615$ -$ 136$ -$ -$
30$ 1,738274OTTAWA3,605$ 15,860$ 8,689$ -$ 808$ -
$ -$ 247$ 6,1161,020PAULDING1,746$ 5,228$ 2,318$
-$ 239$ -$ -$ 22$ 2,648323PERRY3,058$ 14,687$
7,539$ -$ 962$ -$ -$ 58$ 6,129785PICKAWAY5,242$
31,667$ 12,059$ -$ 1,412$ -$ -$ 116$
18,0791,314PIKE2,303$ 22,691$ 7,196$ -$ 455$ -$ -$
81$ 14,959830PORTAGE11,745$ 53,425$ 24,155$ -$
5,424$ -$ -$ 534$ 23,3113,177PREBLE3,495$ 18,998$
7,815$ -$ 973$ -$ -$ 89$ 10,121879PUTNAM1,953$
5,902$ 3,016$ -$ 411$ -$ -$ 179$
2,297358RICHLAND10,935$ 50,194$ 21,129$ -$ 2,882$
-$ -$ 610$ 25,5733,882ROSS7,276$ 96,960$ 20,879$
6,911$ 1,813$ -$ 2,358$ 226$
64,7732,590SANDUSKY4,827$ 16,095$ 7,762$ -$ 890$
-$ -$ 378$ 7,0641,094SCIOTO6,424$ 46,308$ 21,179$ -
$ 1,627$ -$ -$ 745$ 22,7562,156SENECA4,375$
16,868$ 8,776$ -$ 1,323$ -$ -$ 172$
6,5981,153SHELBY3,512$ 12,425$ 5,490$ -$ 773$ -$ -
$ 134$ 6,027743STARK30,385$ 133,041$ 60,371$ -$
7,716$ -$ -$ 1,654$ 63,3017,702SUMMIT40,814$
179,409$ 74,145$ -$ 13,791$ -$ -$ 3,489$
87,98310,382TRUMBULL20,129$ 86,350$ 38,657$ -$
3,877$ -$ -$ 1,328$ 42,4875,844TUSCARAWAS7,509$
36,812$ 18,042$ -$ 1,762$ -$ -$ 559$
16,4482,511UNION3,835$ 10,320$ 5,002$ -$ 747$ -$ -
$ 177$ 4,395623VAN WERT2,173$ 7,609$ 3,672$ -$
253$ -$ -$ 46$ 3,637513VINTON1,136$ 10,907$
4,014$ -$ 411$ -$ -$ 39$ 6,443444WARREN16,471$
56,427$ 23,866$ -$ 5,911$ -$ -$ 1,042$
25,6082,710WASHINGTON6,047$ 26,126$ 13,461$ -$
1,329$ -$ -$ 268$ 11,0671,696WAYNE8,126$ 33,825$
14,862$ -$ 1,648$ -$ -$ 450$
16,8661,917WILLIAMS3,113$ 12,877$ 6,645$ -$ 873$ -
$ -$ 120$ 5,239713WOOD9,121$ 26,976$ 12,917$ -$
3,353$ -$ -$ 572$ 10,1341,521WYANDOT1,707$ 6,715$
3,477$ -$ 383$ -$ -$ 43$ 2,812412OHIO
(Totals)877,894$ 6,643,911$ 1,837,567$ 34,987$
296,446$ -$ 2,202,389$ 59,096$ 2,213,426223,944CONG.
DIST (01)47,571$ 258,702$ 88,400$ -$ 21,688$ -$ -$
4,040$ 144,57411,444CONG. DIST (02)54,327$ 366,474$
119,260$ 21,836$ 17,937$ -$ 4,439$ 4,434$
198,56815,270CONG. DIST (03)42,969$ 273,785$ 115,702$
1,893$ 31,878$ -$ 1,086$ 2,052$ 121,17313,143CONG.
DIST (04)60,184$ 228,517$ 109,682$ -$ 14,101$ -$ -$
3,336$ 101,39813,344CONG. DIST (05)52,984$ 176,544$
87,921$ -$ 13,005$ -$ -$ 3,246$ 72,37110,394CONG.
DIST (06)62,850$ 334,248$ 157,165$ -$ 13,248$ -$ -$
3,466$ 160,36819,451CONG. DIST (07)56,922$ 252,455$
112,723$ -$ 14,307$ -$ -$ 3,003$ 122,42115,166CONG.
DIST (08)56,930$ 263,803$ 116,768$ -$ 17,328$ -$ -$
2,861$ 126,84612,648CONG. DIST (09)52,702$ 253,281$
104,768$ -$ 14,734$ -$ -$ 3,702$ 130,07713,420CONG.
DIST (10)64,176$ 419,507$ 174,959$ 376$ 37,100$ -$
4,798$ 4,168$ 198,10615,403CONG. DIST (11)44,995$
2,622,349$ 143,804$ 10,883$ 22,964$ -$ 2,192,066$
3,406$ 249,22815,011CONG. DIST (12)54,506$ 192,782$
88,780$ -$ 14,832$ -$ -$ 3,402$ 85,76712,568CONG.
DIST (13)60,599$ 287,593$ 126,029$ -$ 19,102$ -$ -$
4,380$ 138,08217,530CONG. DIST (14)54,590$ 221,475$
91,502$ -$ 13,026$ -$ -$ 4,897$ 112,05013,548CONG.
DIST (15)57,447$ 294,702$ 119,149$ -$ 19,250$ -$ -$
3,783$ 152,52013,905CONG. DIST (16)54,142$ 197,695$
80,953$ -$ 11,946$ -$ -$ 4,919$ 99,87511,699OHIO
(Totals)877,894$ 6,643,911$ 1,837,567$ 34,987$
296,446$ -$ 2,202,389$ 59,096$ 2,213,426223,944Notes:*
Veteran population estimates, as of September 30, 2013, are
produced by the VA Office of the Actuary (VetPop 2011).#
Prior to FY 08, "Loan Guaranty" expenditures were included in
the Education & Vocational Rehabilitation and Employment
(E&VRE) programs. Currently, all "Loan Guaranty"
expenditures are attributed to Travis County, TX, where all
Loan Guaranty payments are processed. VA will continue to
improve data collection for future GDX reports to better
distribute loan expenditures at the state, county and
congressional district levels.** Unique patients are patients who
received treatment at a VA health care facility. Data are
provided by the Allocation Resource Center (ARC).Expenditure
data sources: USASpending.gov for Compensation & Pension
(C&P) and Education and Vocational Rehabilitation and
Employment (EVRE) Benefits; Veterans Benefits
Administration Insurance Center for the Insurance costs; the VA
Financial Management System (FMS) for Construction, Medical
Research, General Operating Expenses, and certain C&P and
Readjustment data; and the Allocation Resource Center (ARC)
for Medical Care costs.1. Expenditures are rounded to the
nearest thousand dollars. For example, $500 to $1,000 are
rounded to $1; $0 to $499 are rounded to $0; and "$ -" = 0 or no
expenditures.2. The Compensation & Pension expenditures
include dollars for the following programs: veterans'
compensation for service-connected disabilities; dependency
and indemnity compensation for service-connected deaths;
veterans' pension for nonservice-connected disabilities; and
burial and other benefits to veterans and their survivors.3.
Medical Care expenditures include dollars for medical services,
medical administration, facility maintenance, educational
support, research support, and other overhead items. Medical
Care expenditures do not include dollars for construction or
other non-medical support.4. Medical Care expenditures are
based on where patients live instead of where care is
delivered.5. A star symbol (*) in the Unique Patients column
denotes that there were less than 10 Unique Patients.
&"Arial,Bold"&11FY13 GEOGRAPHIC DISTRIBUTION OF
VA EXPENDITURES (GDX)
&8&P of &N
OKFY13 Summary of Expenditures by StateExpenditures in
$000sCounty/ Congressional DistrictVeteran Population*Total
ExpenditureCompensation & PensionConstructionEducation &
Vocational Rehabilitation/ EmploymentLoan Guaranty#General
Operating ExpensesInsurance & IndemnitiesMedical
CareUnique Patients**ADAIR1,416$ 13,387$ 8,928$ -$
216$ -$ -$ 22$ 4,221505ALFALFA811$ 2,130$ 1,122$
-$ 48$ -$ -$ 12$ 94884ATOKA1,368$ 7,617$ 4,913$
-$ 115$ -$ -$ 8$ 2,581339BEAVER386$ 1,122$ 724$
-$ 20$ -$ -$ 10$ 36876BECKHAM1,663$ 6,687$
4,301$ -$ 207$ -$ -$ 210$ 1,969302BLAINE954$
4,377$ 3,023$ -$ 104$ -$ -$ 18$
1,232203BRYAN3,857$ 27,297$ 17,376$ -$ 987$ -$ -$
52$ 8,8811,215CADDO2,409$ 18,976$ 12,842$ -$ 481$
-$ -$ 96$ 5,556628CANADIAN11,409$ 57,744$ 36,828$
-$ 4,163$ -$ -$ 504$ 16,2492,198CARTER4,309$
29,989$ 19,728$ -$ 649$ -$ -$ 225$
9,3871,123CHEROKEE4,080$ 37,897$ 21,535$ -$ 1,373$
-$ -$ 214$ 14,7751,518CHOCTAW1,429$ 11,020$
7,118$ -$ 175$ -$ -$ 45$ 3,682427CIMARRON194$
746$ 449$ -$ 26$ -$ -$ 1$ 27059CLEVELAND27,077$
164,881$ 106,888$ -$ 16,666$ -$ -$ 1,941$
39,3865,039COAL502$ 3,872$ 2,795$ -$ 66$ -$ -$
18$ 992132COMANCHE18,527$ 213,763$ 162,515$ 464$
18,198$ -$ 661$ 1,563$ 30,3636,265COTTON637$
5,256$ 4,328$ -$ 164$ -$ -$ 20$ 744160CRAIG1,262$
9,858$ 5,698$ -$ 150$ -$ -$ 86$
3,924473CREEK7,340$ 39,484$ 25,973$ -$ 1,380$ -$ -
$ 401$ 11,7311,779CUSTER2,160$ 14,940$ 8,097$ -$
654$ -$ -$ 70$ 6,119521DELAWARE4,316$ 31,327$
16,848$ -$ 380$ -$ -$ 131$ 13,9681,672DEWEY334$
2,180$ 1,369$ -$ 44$ -$ -$ 17$ 75175ELLIS416$
1,646$ 1,095$ -$ 47$ -$ -$ 3$
50071GARFIELD5,733$ 26,020$ 17,658$ -$ 1,816$ -$ -
$ 270$ 6,2761,047GARVIN2,084$ 23,657$ 17,502$ -$
374$ -$ -$ 59$ 5,723634GRADY4,651$ 27,464$
18,307$ -$ 1,088$ -$ -$ 241$ 7,8281,082GRANT438$
1,694$ 998$ -$ 58$ -$ -$ 1$ 63789GREER619$
4,087$ 2,831$ -$ 21$ -$ -$ 5$ 1,230143HARMON269$
1,425$ 1,043$ -$ 65$ -$ -$ 2$ 31564HARPER327$
1,426$ 953$ -$ 23$ -$ -$ 5$ 44568HASKELL968$
13,739$ 7,838$ -$ 112$ -$ -$ 232$
5,557533HUGHES1,297$ 12,185$ 8,005$ -$ 216$ -$ -$
32$ 3,932423JACKSON3,118$ 24,368$ 18,709$ -$
1,718$ -$ -$ 581$ 3,360616JEFFERSON707$ 4,492$
3,271$ -$ 46$ -$ -$ 4$ 1,171181JOHNSTON902$
9,184$ 5,783$ -$ 212$ -$ -$ 2$ 3,187295KAY4,488$
23,543$ 13,861$ -$ 794$ -$ -$ 220$
8,6681,091KINGFISHER944$ 3,965$ 2,825$ -$ 199$ -$
-$ 58$ 883131KIOWA1,064$ 7,082$ 4,931$ -$ 115$ -
$ -$ 30$ 2,006254LATIMER894$ 15,931$ 11,014$ -$
162$ -$ -$ 46$ 4,709464LE FLORE4,225$ 39,823$
23,138$ -$ 613$ -$ -$ 176$
15,8961,974LINCOLN3,337$ 23,004$ 14,432$ -$ 606$ -
$ -$ 198$ 7,767883LOGAN4,866$ 18,048$ 10,928$ -$
740$ -$ -$ 293$ 6,088880LOVE755$ 4,560$ 3,089$ -$
87$ -$ -$ 81$ 1,303196MCCLAIN2,895$ 30,169$
22,057$ -$ 1,038$ -$ -$ 104$
6,969833MCCURTAIN2,639$ 18,852$ 12,404$ -$ 375$ -
$ -$ 58$ 6,014751MCINTOSH2,372$ 31,894$ 17,808$ -
$ 391$ -$ -$ 114$ 13,5811,200MAJOR607$ 1,966$
1,250$ -$ 109$ -$ -$ 30$ 57793MARSHALL1,383$
10,608$ 7,083$ -$ 133$ -$ -$ 53$
3,340443MAYES3,411$ 31,860$ 17,921$ -$ 915$ -$ -$
150$ 12,8751,328MURRAY1,263$ 12,983$ 8,078$ -$
173$ -$ -$ 17$ 4,715451MUSKOGEE6,451$ 212,285$
51,590$ 211$ 2,560$ -$ 118,433$ 232$
39,2603,098NOBLE896$ 4,437$ 2,751$ -$ 174$ -$ -$
25$ 1,487201NOWATA978$ 6,380$ 4,114$ -$ 154$ -$
-$ 34$ 2,078252OKFUSKEE1,018$ 7,086$ 4,692$ -$
120$ -$ -$ 93$ 2,181225OKLAHOMA59,410$ 462,080$
267,159$ 4,645$ 33,013$ -$ 2,494$ 4,660$
150,10914,859OKMULGEE3,568$ 34,244$ 19,465$ -$
833$ -$ -$ 246$ 13,6991,440OSAGE4,218$ 15,027$
7,739$ -$ 134$ -$ -$ 179$ 6,9751,041OTTAWA3,309$
22,477$ 15,303$ -$ 647$ -$ -$ 203$
6,325942PAWNEE1,520$ 10,412$ 5,838$ -$ 175$ -$ -$
48$ 4,351395PAYNE4,817$ 29,094$ 16,924$ -$ 3,499$
-$ -$ 324$ 8,3471,067PITTSBURG4,856$ 36,955$
22,996$ -$ 940$ -$ -$ 137$
12,8821,473PONTOTOC2,691$ 23,370$ 16,356$ -$ 852$
-$ -$ 185$ 5,978919POTTAWATOMIE7,330$ 49,899$
33,766$ -$ 1,874$ -$ -$ 409$
13,8501,669PUSHMATAHA1,162$ 11,712$ 8,216$ -$
136$ -$ -$ 49$ 3,310428ROGER MILLS278$ 1,440$
940$ -$ 38$ -$ -$ 2$ 46155ROGERS9,255$ 51,430$
32,002$ -$ 2,025$ -$ -$ 292$
17,1112,362SEMINOLE2,180$ 17,631$ 11,477$ -$ 289$
-$ -$ 77$ 5,788611SEQUOYAH3,944$ 39,051$ 24,013$
-$ 690$ -$ -$ 93$ 14,2551,607STEPHENS4,059$
36,131$ 25,109$ -$ 808$ -$ -$ 119$
10,0951,277TEXAS1,042$ 3,538$ 1,612$ -$ 132$ -$ -$
77$ 1,717235TILLMAN727$ 4,615$ 2,911$ -$ 219$ -$
-$ 29$ 1,456191TULSA47,965$ 266,228$ 163,028$ -$
19,762$ -$ -$ 3,174$ 80,26311,586WAGONER7,454$
50,185$ 29,547$ -$ 1,924$ -$ -$ 175$
18,5392,015WASHINGTON4,921$ 28,139$ 19,701$ -$
953$ -$ -$ 255$ 7,2291,186WASHITA1,006$ 4,862$
3,533$ -$ 137$ -$ -$ 19$ 1,173182WOODS716$
2,779$ 1,565$ -$ 268$ -$ -$ 63$
883139WOODWARD1,512$ 6,678$ 3,821$ -$ 162$ -$ -
$ 30$ 2,666265OKLAHOMA (Totals)340,395$ 2,568,390$
1,544,376$ 5,320$ 131,030$ -$ 121,588$ 19,958$
746,11890,731CONG. DIST (01)62,567$ 353,208$ 217,683$
-$ 22,946$ -$ -$ 3,820$ 108,75915,295CONG. DIST
(02)69,215$ 742,561$ 375,256$ 211$ 14,486$ -$
118,433$ 2,763$ 231,41325,167CONG. DIST (03)67,152$
353,975$ 223,983$ -$ 17,511$ -$ -$ 3,589$
108,89214,397CONG. DIST (04)80,651$ 636,390$ 443,015$
464$ 44,367$ -$ 661$ 5,068$ 142,81520,762CONG.
DIST (05)60,809$ 482,255$ 284,438$ 4,645$ 31,719$ -$
2,494$ 4,719$ 154,24015,110OKLAHOMA (Totals)340,395$
2,568,390$ 1,544,376$ 5,320$ 131,030$ -$ 121,588$
19,958$ 746,11890,731Notes:* Veteran population estimates,
as of September 30, 2013, are produced by the VA Office of the
Actuary (VetPop 2011).# Prior to FY 08, "Loan Guaranty"
expenditures were included in the Education & Vocational
Rehabilitation and Employment (E&VRE) programs.
Currently, all "Loan Guaranty" expenditures are attributed to
Travis County, TX, where all Loan Guaranty payments are
processed. VA will continue to improve data collection for
future GDX reports to better distribute loan expenditures at the
state, county and congressional district levels.** Unique
patients are patients who received treatment at a VA health care
facility. Data are provided by the Allocation Resource Center
(ARC).Expenditure data sources: USASpending.gov for
Compensation & Pension (C&P) and Education and Vocational
Rehabilitation and Employment (EVRE) Benefits; Veterans
Benefits Administration Insurance Center for the Insurance
costs; the VA Financial Management System (FMS) for
Construction, Medical Research, General Operating Expenses,
and certain C&P and Readjustment data; and the Allocation
Resource Center (ARC) for Medical Care costs.1. Expenditures
are rounded to the nearest thousand dollars. For example, $500
to $1,000 are rounded to $1; $0 to $499 are rounded to $0; and
"$ -" = 0 or no expenditures.2. The Compensation & Pension
expenditures include dollars for the following programs:
veterans' compensation for service-connected disabilities;
dependency and indemnity compensation for service-connected
deaths; veterans' pension for nonservice-connected disabilities;
and burial and other benefits to veterans and their survivors.3.
Medical Care expenditures include dollars for medical services,
medical administration, facility maintenance, educational
support, research support, and other overhead items. Medical
Care expenditures do not include dollars for construction or
other non-medical support.4. Medical Care expenditures are
based on where patients live instead of where care is
delivered.5. A star symbol (*) in the Unique Patients column
denotes that there were less than 10 Unique Patients.
&"Arial,Bold"&11FY13 GEOGRAPHIC DISTRIBUTION OF
VA EXPENDITURES (GDX)
&8&P of &N
ORFY13 Summary of Expenditures by StateExpenditures in
$000sCounty/ Congressional DistrictVeteran Population*Total
ExpenditureCompensation & PensionConstructionEducation &
Vocational Rehabilitation/ EmploymentLoan Guaranty#General
Operating ExpensesInsurance & IndemnitiesMedical
CareUnique Patients**BAKER1,936$ 14,456$ 7,570$ -$
271$ -$ -$ 91$ 6,525838BENTON5,694$ 26,428$
14,214$ -$ 4,734$ -$ -$ 732$
6,7481,137CLACKAMAS34,848$ 167,406$ 80,115$ -$
11,291$ -$ -$ 2,269$ 73,7327,073CLATSOP4,125$
24,663$ 12,521$ -$ 977$ -$ -$ 253$
10,9121,146COLUMBIA5,874$ 35,090$ 16,693$ -$
1,704$ -$ -$ 307$ 16,3871,578COOS8,018$ 70,624$
40,187$ -$ 1,661$ -$ -$ 310$
28,4652,789CROOK2,458$ 15,044$ 7,507$ -$ 467$ -$ -
$ 130$ 6,9401,017CURRY2,955$ 25,968$ 16,566$ -$
281$ -$ -$ 140$ 8,9811,290DESCHUTES14,739$
85,024$ 44,073$ -$ 7,819$ -$ -$ 1,155$
31,9784,779DOUGLAS13,004$ 186,546$ 92,649$ 5,553$
2,306$ -$ 890$ 895$ 84,2536,920GILLIAM244$ 1,276$
726$ -$ 31$ -$ -$ 12$ 50777GRANT743$ 4,532$
2,432$ -$ 78$ -$ -$ 159$ 1,863299HARNEY942$
6,053$ 2,946$ -$ 60$ -$ -$ 28$ 3,018340HOOD
RIVER1,665$ 7,223$ 4,366$ -$ 307$ -$ -$ 58$
2,492320JACKSON20,551$ 221,062$ 88,303$ 23,120$
6,672$ -$ 3,655$ 1,499$ 97,8138,448JEFFERSON2,077$
13,834$ 7,911$ -$ 504$ -$ -$ 81$
5,339644JOSEPHINE9,512$ 78,706$ 45,791$ -$ 2,198$ -
$ -$ 958$ 29,7593,634KLAMATH6,908$ 57,780$
36,963$ -$ 2,747$ -$ -$ 385$ 17,6852,903LAKE916$
7,024$ 4,246$ -$ 186$ -$ -$ 36$
2,556336LANE30,208$ 207,410$ 119,947$ -$ 12,122$ -$
-$ 2,252$ 73,0899,803LINCOLN5,136$ 37,517$ 21,261$
-$ 600$ -$ -$ 430$ 15,2251,779LINN11,757$ 77,844$
44,319$ -$ 4,889$ -$ -$ 796$
27,8403,129MALHEUR2,404$ 11,945$ 5,805$ -$ 672$ -
$ -$ 95$ 5,373642MARION23,914$ 140,293$ 75,082$ -
$ 8,129$ -$ -$ 1,667$ 55,4165,805MORROW1,019$
5,692$ 2,630$ -$ 135$ -$ -$ 33$
2,895311MULTNOMAH43,528$ 369,946$ 118,732$ 8,028$
27,454$ -$ 30,753$ 3,822$ 181,15812,287POLK7,132$
35,817$ 19,677$ -$ 2,750$ -$ -$ 346$
13,0451,537SHERMAN282$ 1,404$ 786$ -$ 57$ -$ -$
12$ 55093TILLAMOOK2,515$ 21,541$ 11,646$ -$ 357$
-$ -$ 142$ 9,396901UMATILLA5,932$ 43,348$ 21,196$
-$ 1,298$ -$ -$ 284$ 20,5702,232UNION2,446$
19,111$ 9,068$ -$ 1,049$ -$ -$ 148$
8,8471,037WALLOWA869$ 6,435$ 3,520$ -$ 75$ -$ -$
19$ 2,821359WASCO3,170$ 16,368$ 7,602$ -$ 483$ -$
-$ 159$ 8,124862WASHINGTON35,265$ 192,802$
89,410$ -$ 20,577$ -$ -$ 2,658$
80,1577,901WHEELER239$ 1,022$ 626$ -$ -$ -$ -$
2$ 39475YAMHILL9,328$ 45,893$ 23,204$ -$ 3,230$ -
$ -$ 867$ 18,5931,869OREGON (Totals)322,355$
2,283,129$ 1,100,287$ 36,702$ 128,169$ -$ 35,298$
23,228$ 959,44596,190CONG. DIST (01)57,414$ 339,693$
148,925$ -$ 28,130$ -$ -$ 4,581$ 158,05813,221CONG.
DIST (02)75,373$ 584,278$ 284,756$ 23,120$ 24,180$ -
$ 3,655$ 5,061$ 243,50627,732CONG. DIST (03)49,581$
368,408$ 130,823$ 8,028$ 28,447$ -$ 30,753$ 3,821$
166,53713,292CONG. DIST (04)74,539$ 623,646$ 344,866$
5,553$ 26,146$ -$ 890$ 5,372$ 240,81826,406CONG.
DIST (05)65,448$ 367,103$ 190,917$ -$ 21,266$ -$ -$
4,393$ 150,52715,539OREGON (Totals)322,355$ 2,283,129$
1,100,287$ 36,702$ 128,169$ -$ 35,298$ 23,228$
959,44596,190Notes:* Veteran population estimates, as of
September 30, 2013, are produced by the VA Office of the
Actuary (VetPop 2011).# Prior to FY 08, "Loan Guaranty"
expenditures were included in the Education & Vocational
Rehabilitation and Employment (E&VRE) programs.
Currently, all "Loan Guaranty" expenditures are attributed to
Travis County, TX, where all Loan Guaranty payments are
processed. VA will continue to improve data collection for
future GDX reports to better distribute loan expenditures at the
state, county and congressional district levels.** Unique
patients are patients who received treatment at a VA health care
facility. Data are provided by the Allocation Resource Center
(ARC).Expenditure data sources: USASpending.gov for
Compensation & Pension (C&P) and Education and Vocational
Rehabilitation and Employment (EVRE) Benefits; Veterans
Benefits Administration Insurance Center for the Insurance
costs; the VA Financial Management System (FMS) for
Construction, Medical Research, General Operating Expenses,
and certain C&P and Readjustment data; and the Allocation
Resource Center (ARC) for Medical Care costs.1. Expenditures
are rounded to the nearest thousand dollars. For example, $500
to $1,000 are rounded to $1; $0 to $499 are rounded to $0; and
"$ -" = 0 or no expenditures.2. The Compensation & Pension
expenditures include dollars for the following programs:
veterans' compensation for service-connected disabilities;
dependency and indemnity compensation for service-connected
deaths; veterans' pension for nonservice-connected disabilities;
and burial and other benefits to veterans and their survivors.3.
Medical Care expenditures include dollars for medical services,
medical administration, facility maintenance, educational
support, research support, and other overhead items. Medical
Care expenditures do not include dollars for construction or
other non-medical support.4. Medical Care expenditures are
based on where patients live instead of where care is
delivered.5. A star symbol (*) in the Unique Patients column
denotes that there were less than 10 Unique Patients.
&"Arial,Bold"&11FY13 GEOGRAPHIC DISTRIBUTION OF
VA EXPENDITURES (GDX)
&8&P of &N
PAFY13 Summary of Expenditures by StateExpenditures in
$000sCounty/ Congressional DistrictVeteran Population*Total
ExpenditureCompensation & PensionConstructionEducation &
Vocational Rehabilitation/ EmploymentLoan Guaranty#General
Operating ExpensesInsurance & IndemnitiesMedical
CareUnique Patients**ADAMS9,349$ 26,646$ 14,081$ -$
2,773$ -$ -$ 533$ 9,2601,456ALLEGHENY92,864$
587,774$ 172,956$ 19,512$ 43,525$ -$ 26,922$
11,110$ 313,74821,167ARMSTRONG6,276$ 33,905$
13,115$ -$ 1,079$ -$ -$ 542$
19,1702,066BEAVER17,381$ 69,283$ 30,906$ -$ 5,807$
-$ -$ 1,086$ 31,4845,374BEDFORD4,138$ 23,735$
10,522$ -$ 689$ -$ -$ 178$ 12,3461,511BERKS28,691$
109,541$ 50,633$ -$ 8,233$ -$ -$ 2,526$
48,1506,825BLAIR12,468$ 94,168$ 38,389$ 163$ 4,367$
-$ 955$ 1,012$ 49,2824,895BRADFORD6,082$ 23,916$
13,123$ -$ 1,137$ -$ -$ 283$
9,3731,699BUCKS43,267$ 135,519$ 73,989$ 275$
14,976$ -$ 2,657$ 4,972$ 38,6506,862BUTLER15,223$
101,087$ 29,852$ 5,608$ 5,449$ -$ 1,158$ 1,215$
57,8065,382CAMBRIA13,921$ 68,263$ 36,443$ -$ 4,897$
-$ -$ 869$ 26,0544,161CAMERON612$ 1,847$ 1,070$ -
$ 124$ -$ -$ 29$ 624150CARBON6,519$ 28,803$
16,488$ -$ 1,509$ -$ -$ 602$
10,2041,438CENTRE9,395$ 40,472$ 16,922$ -$ 12,000$
-$ -$ 650$ 10,9002,049CHESTER30,722$ 200,183$
65,050$ -$ 10,429$ -$ 1,495$ 3,515$
119,6947,215CLARION3,605$ 15,163$ 6,018$ -$ 853$ -
$ 17$ 334$ 7,9411,264CLEARFIELD7,245$ 37,084$
16,116$ -$ 2,412$ -$ -$ 468$
18,0882,443CLINTON3,594$ 17,209$ 9,617$ -$ 1,321$ -
$ -$ 39$ 6,2331,047COLUMBIA5,640$ 22,234$ 12,875$
-$ 1,442$ -$ -$ 416$ 7,5011,327CRAWFORD8,241$
42,671$ 18,657$ -$ 2,129$ -$ -$ 617$
21,2683,026CUMBERLAND21,275$ 91,146$ 52,191$ -$
13,311$ -$ -$ 2,145$ 23,4983,911DAUPHIN22,403$
98,552$ 46,269$ -$ 10,009$ -$ -$ 2,163$
40,1114,659DELAWARE35,178$ 154,866$ 73,952$ -$
13,549$ -$ -$ 4,933$ 62,4326,931ELK3,002$ 12,642$
6,573$ -$ 522$ -$ -$ 467$ 5,0811,070ERIE21,693$
150,445$ 54,465$ 5,298$ 9,512$ -$ 680$ 1,270$
79,2208,495FAYETTE12,200$ 64,703$ 34,590$ -$ 3,179$
-$ -$ 825$ 26,1093,302FOREST664$ 3,455$ 1,881$ -$
88$ -$ -$ 65$ 1,421249FRANKLIN13,382$ 53,388$
27,523$ -$ 4,876$ -$ -$ 1,048$
19,9402,625FULTON1,336$ 5,441$ 2,620$ -$ 252$ -$ -
$ 107$ 2,463275GREENE3,733$ 16,131$ 9,314$ -$
823$ -$ -$ 95$ 5,898751HUNTINGDON4,304$ 19,439$
8,687$ -$ 1,165$ -$ -$ 211$
9,3761,097INDIANA6,745$ 33,969$ 17,233$ -$ 4,827$ -
$ -$ 516$ 11,3941,663JEFFERSON3,922$ 17,271$
8,979$ -$ 1,287$ -$ -$ 369$
6,6361,271JUNIATA1,786$ 5,289$ 2,764$ -$ 307$ -$ -
$ 73$ 2,145366LACKAWANNA16,878$ 81,879$ 45,061$
-$ 4,332$ -$ -$ 1,574$ 30,9123,683LANCASTER35,883$
138,890$ 58,386$ -$ 11,295$ -$ -$ 2,646$
66,5638,487LAWRENCE7,360$ 37,795$ 16,708$ -$
2,310$ -$ -$ 322$ 18,4562,565LEBANON11,903$
121,258$ 31,006$ 17,498$ 4,530$ -$ 5,029$ 862$
62,3334,711LEHIGH24,170$ 71,240$ 40,408$ -$ 6,702$
-$ -$ 1,743$ 22,3864,144LUZERNE27,229$ 179,672$
78,285$ 785$ 5,747$ -$ 1,271$ 2,564$
91,0217,511LYCOMING11,172$ 37,531$ 21,634$ -$
4,237$ -$ -$ 408$ 11,2522,680MCKEAN4,339$ 19,717$
10,856$ -$ 677$ -$ -$ 331$
7,8531,506MERCER10,147$ 43,225$ 19,576$ -$ 3,373$
-$ -$ 708$ 19,5673,470MIFFLIN4,308$ 14,590$ 8,130$
-$ 878$ -$ -$ 88$ 5,4941,138MONROE12,986$ 58,514$
28,978$ -$ 4,017$ -$ -$ 1,285$
24,2342,364MONTGOMERY48,746$ 168,824$ 86,731$ -$
18,393$ -$ -$ 6,441$ 57,2609,207MONTOUR1,475$
5,862$ 3,691$ -$ 631$ -$ -$ 241$
1,299285NORTHAMPTON22,740$ 69,271$ 40,447$ -$
6,254$ -$ -$ 1,618$
20,9513,660NORTHUMBERLAND8,854$ 28,235$ 16,701$
-$ 1,852$ -$ -$ 418$ 9,2641,843PERRY4,134$ 18,349$
9,163$ -$ 1,362$ -$ -$ 169$
7,654814PHILADELPHIA74,238$ 683,830$ 229,935$ 269$
47,914$ -$ 118,075$ 4,333$ 283,30419,965PIKE5,774$
28,014$ 13,420$ -$ 1,744$ -$ -$ 350$
12,5001,291POTTER1,737$ 9,433$ 5,194$ -$ 311$ -$ -
$ 35$ 3,893586SCHUYLKILL14,186$ 66,834$ 33,040$ -
$ 3,818$ -$ -$ 1,312$ 28,6653,850SNYDER2,683$
7,977$ 4,121$ -$ 630$ -$ -$ 138$
3,089485SOMERSET6,623$ 31,741$ 16,545$ -$ 2,038$ -
$ -$ 392$ 12,7661,964SULLIVAN810$ 3,362$ 1,170$ -
$ 96$ -$ -$ 9$ 2,087210SUSQUEHANNA3,912$
17,490$ 9,185$ -$ 779$ -$ -$ 163$
7,363879TIOGA4,322$ 22,357$ 11,036$ -$ 874$ -$ -$
250$ 10,1971,301UNION3,453$ 8,371$ 5,863$ -$ 944$
-$ -$ 181$ 1,383497VENANGO5,429$ 24,331$ 10,857$
-$ 1,421$ -$ -$ 372$ 11,6812,004WARREN4,262$
21,481$ 9,841$ -$ 893$ -$ -$ 307$
10,4401,626WASHINGTON18,216$ 68,757$ 32,334$ -$
5,077$ -$ -$ 1,432$ 29,9134,002WAYNE4,875$ 21,145$
11,877$ -$ 1,082$ -$ -$ 362$
7,8241,031WESTMORELAND34,028$ 133,137$ 61,203$ -$
10,393$ -$ -$ 3,152$ 58,3898,270WYOMING2,467$
11,823$ 6,421$ -$ 682$ -$ -$ 175$
4,546491YORK37,449$ 121,178$ 57,920$ -$ 14,922$ -$
-$ 2,727$ 45,6097,512PENNSYLVANIA (Totals)953,644$
4,782,351$ 2,029,589$ 49,407$ 359,065$ -$ 158,258$
82,386$ 2,103,647232,054CONG. DIST (01)32,950$
221,094$ 96,251$ -$ 19,223$ -$ -$ 1,953$
103,6678,034CONG. DIST (02)36,022$ 469,050$ 142,340$
269$ 29,675$ -$ 118,075$ 3,000$ 175,69110,826CONG.
DIST (03)58,773$ 353,958$ 131,096$ 10,906$ 20,244$ -
$ 1,838$ 4,084$ 185,79021,332CONG. DIST (04)60,840$
214,281$ 107,806$ -$ 26,404$ -$ -$ 4,562$
75,50811,795CONG. DIST (05)60,101$ 284,941$ 129,670$
-$ 26,085$ -$ 17$ 4,076$ 125,09319,362CONG. DIST
(06)48,028$ 232,451$ 81,310$ 17,498$ 13,786$ -$
5,029$ 4,821$ 110,00711,495CONG. DIST (07)46,522$
151,717$ 67,715$ -$ 12,432$ -$ -$ 6,180$
65,3908,820CONG. DIST (08)48,385$ 147,903$ 80,379$
275$ 16,331$ -$ 2,657$ 5,354$ 42,9087,707CONG. DIST
(09)62,424$ 334,995$ 161,240$ 163$ 22,258$ -$ 955$
4,530$ 145,85017,379CONG. DIST (10)62,844$ 238,286$
127,858$ -$ 15,765$ -$ -$ 3,169$ 91,49514,174CONG.
DIST (11)62,050$ 285,077$ 143,109$ 785$ 21,102$ -$
1,271$ 4,948$ 113,86313,876CONG. DIST (12)62,495$
272,719$ 117,648$ -$ 21,220$ -$ -$ 5,868$
127,98416,511CONG. DIST (13)39,513$ 161,717$ 75,869$
-$ 15,984$ -$ -$ 4,242$ 65,6228,223CONG. DIST
(14)53,430$ 438,886$ 126,476$ 19,512$ 31,414$ -$
26,922$ 5,729$ 228,83313,824CONG. DIST (15)52,868$
182,968$ 91,191$ -$ 15,158$ -$ -$ 4,022$
72,59610,557CONG. DIST (16)46,698$ 274,958$ 106,467$
-$ 18,928$ -$ 1,495$ 3,851$ 144,21611,794CONG. DIST
(17)58,561$ 302,506$ 153,116$ -$ 16,536$ -$ -$
6,115$ 126,73813,364CONG. DIST (18)61,139$ 214,846$
90,048$ -$ 16,520$ -$ -$ 5,881$
102,39712,981PENNSYLVANIA (Totals)953,644$ 4,782,351$
2,029,589$ 49,407$ 359,065$ -$ 158,258$ 82,386$
2,103,647232,054Notes:* Veteran population estimates, as of
September 30, 2013, are produced by the VA Office of the
Actuary (VetPop 2011).# Prior to FY 08, "Loan Guaranty"
expenditures were included in the Education & Vocational
Rehabilitation and Employment (E&VRE) programs.
Currently, all "Loan Guaranty" expenditures are attributed to
Travis County, TX, where all Loan Guaranty payments are
processed. VA will continue to improve data collection for
future GDX reports to better distribute loan expenditures at the
state, county and congressional district levels.** Unique
patients are patients who received treatment at a VA health care
facility. Data are provided by the Allocation Resource Center
(ARC).Expenditure data sources: USASpending.gov for
Compensation & Pension (C&P) and Education and Vocational
Rehabilitation and Employment (EVRE) Benefits; Veterans
Benefits Administration Insurance Center for the Insurance
costs; the VA Financial Management System (FMS) for
Construction, Medical Research, General Operating Expenses,
and certain C&P and Readjustment data; and the Allocation
Resource Center (ARC) for Medical Care costs.1. Expenditures
are rounded to the nearest thousand dollars. For example, $500
to $1,000 are rounded to $1; $0 to $499 are rounded to $0; and
"$ -" = 0 or no expenditures.2. The Compensation & Pension
expenditures include dollars for the following programs:
veterans' compensation for service-connected disabilities;
dependency and indemnity compensation for service-connected
deaths; veterans' pension for nonservice-connected disabilities;
and burial and other benefits to veterans and their survivors.3.
Medical Care expenditures include dollars for medical services,
medical administration, facility maintenance, educational
support, research support, and other overhead items. Medical
Care expenditures do not include dollars for construction or
other non-medical support.4. Medical Care expenditures are
based on where patients live instead of where care is
delivered.5. A star symbol (*) in the Unique Patients column
denotes that there were less than 10 Unique Patients.
&"Arial,Bold"&11FY13 GEOGRAPHIC DISTRIBUTION OF
VA EXPENDITURES (GDX)
&8&P of &N
RIFY13 Summary of Expenditures by StateExpenditures in
$000sCounty/ Congressional DistrictVeteran Population*Total
ExpenditureCompensation & PensionConstructionEducation &
Vocational Rehabilitation/ EmploymentLoan Guaranty#General
Operating ExpensesInsurance & IndemnitiesMedical
CareUnique Patients**BRISTOL3,765$ 24,833$ 9,803$ -$
1,391$ -$ -$ 481$ 13,1591,054KENT13,603$ 84,361$
39,573$ -$ 7,204$ -$ -$ 978$
36,6074,010NEWPORT7,599$ 41,403$ 22,005$ -$ 5,514$
-$ -$ 1,014$ 12,8701,572PROVIDENCE33,941$ 279,743$
98,634$ 2,867$ 16,778$ -$ 19,476$ 2,892$
139,09711,302WASHINGTON10,298$ 43,998$ 23,974$ -$
4,638$ -$ -$ 564$ 14,8222,194RHODE ISLAND
(Totals)69,206$ 474,338$ 193,988$ 2,867$ 35,525$ -$
19,476$ 5,928$ 216,55520,132CONG. DIST (01)32,908$
214,503$ 91,248$ -$ 17,016$ -$ -$ 3,201$
103,0389,713CONG. DIST (02)36,298$ 259,835$ 102,740$
2,867$ 18,509$ -$ 19,476$ 2,727$
113,51710,419RHODE ISLAND (Totals)69,206$ 474,338$
193,988$ 2,867$ 35,525$ -$ 19,476$ 5,928$
216,55520,132Notes:* Veteran population estimates, as of
September 30, 2013, are produced by the VA Office of the
Actuary (VetPop 2011).# Prior to FY 08, "Loan Guaranty"
expenditures were included in the Education & Vocational
Rehabilitation and Employment (E&VRE) programs.
Currently, all "Loan Guaranty" expenditures are attributed to
Travis County, TX, where all Loan Guaranty payments are
processed. VA will continue to improve data collection for
future GDX reports to better distribute loan expenditures at the
state, county and congressional district levels.** Unique
patients are patients who received treatment at a VA health care
facility. Data are provided by the Allocation Resource Center
(ARC).Expenditure data sources: USASpending.gov for
Compensation & Pension (C&P) and Education and Vocational
Rehabilitation and Employment (EVRE) Benefits; Veterans
Benefits Administration Insurance Center for the Insurance
costs; the VA Financial Management System (FMS) for
Construction, Medical Research, General Operating Expenses,
and certain C&P and Readjustment data; and the Allocation
Resource Center (ARC) for Medical Care costs.1. Expenditures
are rounded to the nearest thousand dollars. For example, $500
to $1,000 are rounded to $1; $0 to $499 are rounded to $0; and
"$ -" = 0 or no expenditures.2. The Compensation & Pension
expenditures include dollars for the following programs:
veterans' compensation for service-connected disabilities;
dependency and indemnity compensation for service-connected
deaths; veterans' pension for nonservice-connected disabilities;
and burial and other benefits to veterans and their survivors.3.
Medical Care expenditures include dollars for medical services,
medical administration, facility maintenance, educational
support, research support, and other overhead items. Medical
Care expenditures do not include dollars for construction or
other non-medical support.4. Medical Care expenditures are
based on where patients live instead of where care is
delivered.5. A star symbol (*) in the Unique Patients column
denotes that there were less than 10 Unique Patients.
&"Arial,Bold"&11FY13 GEOGRAPHIC DISTRIBUTION OF
VA EXPENDITURES (GDX)
&8&P of &N
SCFY13 Summary of Expenditures by StateExpenditures in
$000sCounty/ Congressional DistrictVeteran Population*Total
ExpenditureCompensation & PensionConstructionEducation &
Vocational Rehabilitation/ EmploymentLoan Guaranty#General
Operating ExpensesInsurance & IndemnitiesMedical
CareUnique Patients**ABBEVILLE2,217$ 14,383$ 8,252$ -
$ 325$ -$ -$ 73$ 5,733730AIKEN15,645$ 96,042$
44,288$ -$ 5,087$ -$ -$ 842$
45,8264,858ALLENDALE725$ 4,845$ 2,309$ -$ 161$ -$
-$ 3$ 2,372214ANDERSON16,569$ 79,623$ 48,569$ -$
3,663$ -$ -$ 739$ 26,6524,392BAMBERG1,587$ 8,518$
4,687$ -$ 417$ -$ -$ 14$ 3,400406BARNWELL1,793$
11,528$ 6,123$ -$ 477$ -$ -$ 70$
4,858531BEAUFORT19,757$ 94,984$ 57,073$ 53$
10,730$ -$ 1,056$ 1,875$ 24,1974,121BERKELEY24,134$
148,391$ 75,864$ -$ 16,414$ -$ -$ 1,223$
54,8906,256CALHOUN1,504$ 7,430$ 3,158$ -$ 254$ -$
-$ 52$ 3,965438CHARLESTON29,660$ 272,889$
110,033$ 2,044$ 21,471$ -$ 3,045$ 2,823$
133,47310,490CHEROKEE4,346$ 22,180$ 13,013$ -$
2,005$ -$ -$ 173$ 6,9901,156CHESTER2,421$ 20,207$
11,269$ -$ 504$ -$ -$ 122$
8,312915CHESTERFIELD3,232$ 20,754$ 11,877$ -$ 627$
-$ -$ 222$ 8,028979CLARENDON2,650$ 23,934$
14,321$ -$ 714$ -$ -$ 114$
8,7861,130COLLETON3,718$ 29,758$ 14,887$ -$ 1,067$
-$ -$ 178$ 13,6261,353DARLINGTON5,730$ 32,727$
19,602$ -$ 1,472$ -$ -$ 335$
11,3181,632DILLON2,028$ 13,806$ 7,981$ -$ 793$ -$
-$ 127$ 4,906631DORCHESTER17,851$ 135,809$
74,818$ -$ 18,462$ -$ -$ 1,409$
41,1194,707EDGEFIELD1,948$ 16,059$ 8,114$ -$ 861$
-$ -$ 108$ 6,975691FAIRFIELD2,051$ 16,195$ 8,909$
-$ 513$ -$ -$ 142$ 6,630613FLORENCE10,318$
67,151$ 39,884$ 51$ 3,790$ -$ 675$ 706$
22,0453,344GEORGETOWN5,930$ 32,873$ 16,385$ -$
1,307$ -$ -$ 461$ 14,7201,813GREENVILLE34,363$
154,916$ 95,795$ -$ 14,014$ -$ -$ 2,063$
43,0447,463GREENWOOD5,102$ 38,217$ 23,818$ -$
1,563$ -$ -$ 380$ 12,4571,699HAMPTON1,689$
10,863$ 6,030$ -$ 779$ -$ -$ 159$
3,896503HORRY28,659$ 175,460$ 104,165$ -$ 8,895$ -
$ -$ 2,041$ 60,3599,385JASPER1,759$ 10,523$ 6,198$
-$ 900$ -$ -$ 141$ 3,284555KERSHAW6,277$ 60,728$
36,705$ -$ 5,408$ -$ -$ 393$
18,2232,234LANCASTER6,749$ 35,893$ 22,099$ -$
1,135$ -$ -$ 386$ 12,2721,834LAURENS5,452$ 31,093$
19,887$ -$ 926$ -$ -$ 419$ 9,8601,447LEE1,600$
10,615$ 5,818$ -$ 387$ -$ -$ 107$
4,304463LEXINGTON25,550$ 157,854$ 87,395$ -$
12,683$ -$ -$ 1,855$ 55,9206,424MCCORMICK1,165$
9,144$ 4,729$ -$ 233$ -$ -$ 207$
3,974368MARION2,629$ 18,599$ 10,247$ -$ 982$ -$ -
$ 72$ 7,299888MARLBORO1,807$ 12,556$ 7,509$ -$
535$ -$ -$ 115$ 4,397617NEWBERRY2,909$ 17,944$
11,119$ -$ 1,035$ -$ -$ 111$ 5,679731OCONEE7,195$
31,834$ 21,243$ -$ 1,476$ -$ -$ 549$
8,5671,453ORANGEBURG6,453$ 57,823$ 29,533$ -$
2,451$ -$ -$ 392$ 25,4472,707PICKENS9,017$ 46,162$
29,342$ -$ 4,157$ -$ -$ 324$
12,3382,121RICHLAND35,222$ 471,570$ 225,436$ 409$
47,733$ -$ 58,470$ 3,381$ 136,14114,458SALUDA1,471$
8,745$ 3,871$ -$ 191$ -$ -$ 66$
4,617437SPARTANBURG23,039$ 114,565$ 69,071$ -$
6,815$ -$ -$ 1,102$ 37,5775,451SUMTER12,223$
116,043$ 70,079$ -$ 12,245$ -$ -$ 829$
32,8904,158UNION1,945$ 11,699$ 7,201$ -$ 421$ -$ -
$ 287$ 3,790609WILLIAMSBURG2,464$ 20,125$ 10,475$
-$ 1,044$ -$ -$ 136$ 8,471922YORK20,414$ 83,267$
48,602$ -$ 6,227$ -$ -$ 984$ 27,4544,743SOUTH
CAROLINA (Totals)420,968$ 2,876,324$ 1,557,784$
2,557$ 223,348$ -$ 63,246$ 28,310$
1,001,079123,070CONG. DIST (01)77,469$ 498,483$
245,821$ 2,097$ 52,380$ -$ 4,101$ 6,441$
187,64220,064CONG. DIST (02)63,670$ 439,076$ 229,995$
-$ 36,963$ -$ -$ 4,484$ 167,63319,028CONG. DIST
(03)54,781$ 300,049$ 183,241$ -$ 15,519$ -$ -$
3,054$ 98,23614,526CONG. DIST (04)51,912$ 237,920$
145,385$ -$ 18,290$ -$ -$ 2,966$ 71,27911,459CONG.
DIST (05)60,006$ 369,761$ 219,635$ -$ 26,934$ -$ -$
3,368$ 119,82416,900CONG. DIST (06)53,733$ 666,297$
321,123$ 460$ 55,342$ -$ 59,145$ 4,041$
226,18622,174CONG. DIST (07)59,397$ 364,738$ 212,583$
-$ 17,919$ -$ -$ 3,957$ 130,27818,919SOUTH
CAROLINA (Totals)420,968$ 2,876,324$ 1,557,784$
2,557$ 223,348$ -$ 63,246$ 28,310$
1,001,079123,070Notes:* Veteran population estimates, as of
September 30, 2013, are produced by the VA Office of the
Actuary (VetPop 2011).# Prior to FY 08, "Loan Guaranty"
expenditures were included in the Education & Vocational
Rehabilitation and Employment (E&VRE) programs.
Currently, all "Loan Guaranty" expenditures are attributed to
Travis County, TX, where all Loan Guaranty payments are
processed. VA will continue to improve data collection for
future GDX reports to better distribute loan expenditures at the
state, county and congressional district levels.** Unique
patients are patients who received treatment at a VA health care
facility. Data are provided by the Allocation Resource Center
(ARC).Expenditure data sources: USASpending.gov for
Compensation & Pension (C&P) and Education and Vocational
Rehabilitation and Employment (EVRE) Benefits; Veterans
Benefits Administration Insurance Center for the Insurance
costs; the VA Financial Management System (FMS) for
Construction, Medical Research, General Operating Expenses,
and certain C&P and Readjustment data; and the Allocation
Resource Center (ARC) for Medical Care costs.1. Expenditures
are rounded to the nearest thousand dollars. For example, $500
to $1,000 are rounded to $1; $0 to $499 are rounded to $0; and
"$ -" = 0 or no expenditures.2. The Compensation & Pension
expenditures include dollars for the following programs:
veterans' compensation for service-connected disabilities;
dependency and indemnity compensation for service-connected
deaths; veterans' pension for nonservice-connected disabilities;
and burial and other benefits to veterans and their survivors.3.
Medical Care expenditures include dollars for medical services,
medical administration, facility maintenance, educational
support, research support, and other overhead items. Medical
Care expenditures do not include dollars for construction or
other non-medical support.4. Medical Care expenditures are
based on where patients live instead of where care is
delivered.5. A star symbol (*) in the Unique Patients column
denotes that there were less than 10 Unique Patients.
&"Arial,Bold"&11FY13 GEOGRAPHIC DISTRIBUTION OF
VA EXPENDITURES (GDX)
&8&P of &N
SDFY13 Summary of Expenditures by StateExpenditures in
$000sCounty/ Congressional DistrictVeteran Population*Total
ExpenditureCompensation & PensionConstructionEducation &
Vocational Rehabilitation/ EmploymentLoan Guaranty#General
Operating ExpensesInsurance & IndemnitiesMedical
CareUnique Patients**AURORA281$ 1,596$ 836$ -$ 73$
-$ -$ 2$ 685100BEADLE1,630$ 6,591$ 2,930$ -$
111$ -$ -$ 86$ 3,464472BENNETT196$ 1,817$ 595$ -
$ -$ -$ -$ 1$ 1,222101BON HOMME760$ 4,686$
1,298$ -$ 130$ -$ -$ 78$ 3,179275BROOKINGS2,159$
10,032$ 4,166$ -$ 1,556$ -$ -$ 163$
4,148647BROWN2,862$ 14,912$ 6,463$ -$ 900$ -$ -$
105$ 7,4451,307BRULE463$ 1,979$ 848$ -$ 97$ -$ -$
29$ 1,005135BUFFALO157$ 914$ 494$ -$ 38$ -$ -$
6$ 37631BUTTE967$ 10,959$ 3,778$ -$ 190$ -$ -$
20$ 6,971502CAMPBELL127$ 468$ 257$ -$ 6$ -$ -$
1$ 20560CHARLES MIX816$ 4,770$ 1,715$ -$ 194$ -$
-$ 138$ 2,724268CLARK295$ 1,858$ 939$ -$ 13$ -$
-$ 13$ 893115CLAY1,006$ 5,522$ 2,084$ -$ 1,031$ -
$ -$ 71$ 2,336300CODINGTON2,283$ 11,261$ 5,071$
-$ 709$ -$ -$ 62$ 5,418914CORSON326$ 2,628$
1,107$ -$ 31$ -$ -$ 6$ 1,485142CUSTER991$ 9,814$
3,262$ -$ 211$ -$ -$ 86$ 6,256525DAVISON1,523$
7,556$ 3,223$ -$ 671$ -$ -$ 50$ 3,612501DAY618$
3,249$ 1,608$ -$ 21$ -$ -$ 116$ 1,504273DEUEL478$
2,162$ 944$ -$ 89$ -$ -$ 68$ 1,061163DEWEY485$
3,791$ 1,287$ -$ 26$ -$ -$ 9$
2,468208DOUGLAS346$ 1,199$ 532$ -$ 21$ -$ -$
18$ 62892EDMUNDS319$ 1,433$ 578$ -$ 71$ -$ -$
5$ 779165FALL RIVER1,137$ 31,910$ 8,343$ -$ 215$
-$ 546$ 58$ 22,748978FAULK220$ 858$ 334$ -$ 9$
-$ -$ 3$ 51394GRANT768$ 3,763$ 1,898$ -$ 115$ -$
-$ 37$ 1,713266GREGORY438$ 3,067$ 1,187$ -$ 54$
-$ -$ 6$ 1,819185HAAKON155$ 882$ 243$ -$ 26$ -
$ -$ -$ 61372HAMLIN458$ 2,304$ 1,036$ -$ 50$ -$
-$ 20$ 1,199190HAND350$ 1,213$ 568$ -$ 16$ -$ -$
26$ 604139HANSON305$ 1,902$ 1,024$ -$ 28$ -$ -$
6$ 844139HARDING92$ 326$ 174$ -$ -$ -$ -$ 1$
15229HUGHES1,468$ 7,873$ 3,194$ -$ 319$ -$ -$
168$ 4,194696HUTCHINSON619$ 3,134$ 1,264$ -$
119$ -$ -$ 40$ 1,712225HYDE147$ 552$ 259$ -$
26$ -$ -$ -$ 26754JACKSON229$ 1,730$ 576$ -$ 8$
-$ -$ -$ 1,14689JERAULD233$ 809$ 424$ -$ 40$ -$
-$ 2$ 34373JONES110$ 275$ 59$ -$ 1$ -$ -$ -$
21635KINGSBURY545$ 3,213$ 1,397$ -$ 99$ -$ -$
34$ 1,683202LAKE867$ 6,509$ 2,602$ -$ 489$ -$ -$
235$ 3,183377LAWRENCE2,339$ 23,878$ 7,406$ -$
793$ -$ -$ 178$ 15,5011,300LINCOLN3,531$ 18,583$
7,173$ -$ 1,692$ -$ -$ 158$ 9,5611,120LYMAN350$
1,540$ 638$ -$ 41$ -$ -$ 12$ 849112MCCOOK480$
3,462$ 1,085$ -$ 177$ -$ -$ 100$
2,100189MCPHERSON274$ 988$ 454$ -$ 18$ -$ -$
2$ 514124MARSHALL395$ 2,046$ 745$ -$ 17$ -$ -$
86$ 1,197158MEADE3,577$ 47,567$ 11,553$ 1,605$
1,745$ -$ 3,088$ 298$ 29,2791,612MELLETTE155$
803$ 308$ -$ 31$ -$ -$ 1$ 46355MINER275$ 1,059$
450$ -$ 11$ -$ -$ 229$ 37063MINNEHAHA14,689$
113,020$ 39,665$ 371$ 5,773$ -$ 6,758$ 1,049$
59,4044,824MOODY680$ 3,537$ 1,259$ -$ 140$ -$ -$
18$ 2,121174PENNINGTON12,433$ 112,361$ 47,255$ -$
10,268$ -$ -$ 1,094$ 53,7445,468PERKINS301$ 1,990$
638$ -$ 43$ -$ -$ 46$ 1,263150POTTER272$ 1,402$
575$ -$ 30$ -$ -$ 1$ 796124ROBERTS770$ 6,311$
2,802$ -$ 132$ -$ -$ 37$ 3,341347SANBORN297$
1,149$ 457$ -$ 36$ -$ -$ 1$ 65473SHANNON721$
9,189$ 3,415$ -$ 196$ -$ -$ 9$ 5,568314SPINK702$
2,936$ 1,261$ -$ 38$ -$ -$ 105$
1,531265STANLEY226$ 1,267$ 483$ -$ 59$ -$ -$ 5$
720126SULLY136$ 338$ 107$ -$ 19$ -$ -$ 7$
20552TODD602$ 3,716$ 1,548$ -$ 84$ -$ -$ 4$
2,080166TRIPP516$ 3,273$ 1,180$ -$ 39$ -$ -$ 6$
2,048268TURNER817$ 4,366$ 1,814$ -$ 149$ -$ -$
15$ 2,387285UNION1,101$ 6,676$ 2,776$ -$ 389$ -$
-$ 162$ 3,349378WALWORTH535$ 3,304$ 1,156$ -$
110$ -$ -$ 16$ 2,022284YANKTON2,078$ 9,653$
4,305$ -$ 535$ -$ -$ 50$ 4,763536ZIEBACH206$
554$ 243$ -$ -$ -$ -$ 4$ 30738SOUTH DAKOTA
(Totals)75,687$ 564,489$ 209,347$ 1,976$ 30,364$ -$
10,392$ 5,461$ 306,94929,744CONG. DIST (01)75,687$
564,489$ 209,347$ 1,976$ 30,364$ -$ 10,392$ 5,461$
306,94929,744SOUTH DAKOTA (Totals)75,687$ 564,489$
209,347$ 1,976$ 30,364$ -$ 10,392$ 5,461$
306,94929,744Notes:* Veteran population estimates, as of
September 30, 2013, are produced by the VA Office of the
Actuary (VetPop 2011).# Prior to FY 08, "Loan Guaranty"
expenditures were included in the Education & Vocational
Rehabilitation and Employment (E&VRE) programs.
Currently, all "Loan Guaranty" expenditures are attributed to
Travis County, TX, where all Loan Guaranty payments are
processed. VA will continue to improve data collection for
future GDX reports to better distribute loan expenditures at the
state, county and congressional district levels.** Unique
patients are patients who received treatment at a VA health care
facility. Data are provided by the Allocation Resource Center
(ARC).Expenditure data sources: USASpending.gov for
Compensation & Pension (C&P) and Education and Vocational
Rehabilitation and Employment (EVRE) Benefits; Veterans
Benefits Administration Insurance Center for the Insurance
costs; the VA Financial Management System (FMS) for
Construction, Medical Research, General Operating Expenses,
and certain C&P and Readjustment data; and the Allocation
Resource Center (ARC) for Medical Care costs.1. Expenditures
are rounded to the nearest thousand dollars. For example, $500
to $1,000 are rounded to $1; $0 to $499 are rounded to $0; and
"$ -" = 0 or no expenditures.2. The Compensation & Pension
expenditures include dollars for the following programs:
veterans' compensation for service-connected disabilities;
dependency and indemnity compensation for service-connected
deaths; veterans' pension for nonservice-connected disabilities;
and burial and other benefits to veterans and their survivors.3.
Medical Care expenditures include dollars for medical services,
medical administration, facility maintenance, educational
support, research support, and other overhead items. Medical
Care expenditures do not include dollars for construction or
other non-medical support.4. Medical Care expenditures are
based on where patients live instead of where care is
delivered.5. A star symbol (*) in the Unique Patients column
denotes that there were less than 10 Unique Patients.
&"Arial,Bold"&11FY13 GEOGRAPHIC DISTRIBUTION OF
VA EXPENDITURES (GDX)
&8&P of &N
TNFY13 Summary of Expenditures by StateExpenditures in
$000sCounty/ Congressional DistrictVeteran Population*Total
ExpenditureCompensation & PensionConstructionEducation &
Vocational Rehabilitation/ EmploymentLoan Guaranty#General
Operating ExpensesInsurance & IndemnitiesMedical
CareUnique Patients**ANDERSON7,922$ 29,308$ 18,631$
-$ 1,960$ -$ -$ 346$ 8,3711,484BEDFORD3,254$
20,317$ 8,833$ -$ 750$ -$ -$ 150$
10,5841,037BENTON1,859$ 12,089$ 6,464$ -$ 311$ -$
-$ 4$ 5,309480BLEDSOE914$ 4,953$ 2,562$ -$ 78$ -
$ -$ 227$ 2,086305BLOUNT12,283$ 49,261$ 32,272$ -
$ 3,849$ -$ -$ 1,262$ 11,8782,208BRADLEY8,453$
34,131$ 20,874$ -$ 2,232$ -$ -$ 437$
10,5881,607CAMPBELL3,190$ 26,955$ 19,628$ -$ 461$
-$ -$ 268$ 6,598959CANNON1,049$ 7,800$ 3,953$ -$
298$ -$ -$ 63$ 3,486361CARROLL2,998$ 13,051$
7,422$ -$ 903$ -$ -$ 143$ 4,583516CARTER5,858$
59,360$ 23,023$ -$ 965$ -$ -$ 226$
35,1462,837CHEATHAM3,334$ 19,914$ 9,449$ -$ 1,762$
-$ -$ 263$ 8,439741CHESTER1,241$ 5,417$ 3,087$ -$
334$ -$ -$ 46$ 1,950264CLAIBORNE2,370$ 18,626$
12,305$ -$ 992$ -$ -$ 226$ 5,103660CLAY685$
3,863$ 1,732$ -$ 75$ -$ -$ 7$ 2,049193COCKE3,129$
26,296$ 14,414$ -$ 519$ -$ -$ 80$
11,2841,160COFFEE5,046$ 32,617$ 16,184$ -$ 1,605$ -
$ -$ 466$ 14,3631,576CROCKETT1,039$ 5,690$ 3,271$
-$ 139$ -$ -$ 31$ 2,250235CUMBERLAND6,900$
30,167$ 17,096$ -$ 685$ -$ -$ 353$
12,0332,010DAVIDSON39,006$ 318,747$ 107,843$ 576$
27,265$ -$ 47,809$ 2,708$ 132,5479,600DECATUR1,105$
6,054$ 3,485$ -$ 163$ -$ -$ 76$ 2,329289DE
KALB1,432$ 7,965$ 3,521$ -$ 285$ -$ -$ 69$
4,090362DICKSON4,579$ 26,126$ 14,012$ -$ 1,768$ -$
-$ 342$ 10,003966DYER2,968$ 14,772$ 9,221$ -$ 578$
-$ -$ 61$ 4,912784FAYETTE4,001$ 13,277$ 5,324$ -$
513$ -$ -$ 278$ 7,162673FENTRESS1,240$ 10,500$
6,369$ -$ 163$ -$ -$ 14$ 3,954543FRANKLIN3,792$
20,421$ 10,237$ -$ 724$ -$ -$ 416$
9,0451,089GIBSON4,221$ 21,491$ 13,769$ -$ 1,356$ -$
-$ 103$ 6,263886GILES2,445$ 13,814$ 7,605$ -$ 728$
-$ -$ 328$ 5,152593GRAINGER1,880$ 10,286$ 6,441$
-$ 339$ -$ -$ 54$ 3,452509GREENE6,302$ 43,806$
19,987$ -$ 1,151$ -$ -$ 355$
22,3142,264GRUNDY994$ 7,074$ 3,533$ -$ 145$ -$ -$
35$ 3,361330HAMBLEN5,514$ 33,480$ 18,379$ -$
1,241$ -$ -$ 182$ 13,6771,538HAMILTON27,245$
119,457$ 69,483$ 990$ 8,772$ -$ 1,980$ 1,895$
36,3375,663HANCOCK523$ 3,453$ 1,784$ -$ 35$ -$ -$
15$ 1,619125HARDEMAN2,213$ 12,319$ 5,216$ -$
356$ -$ -$ 116$ 6,631453HARDIN2,463$ 11,662$
6,570$ -$ 324$ -$ -$ 32$ 4,735641HAWKINS5,641$
35,942$ 19,549$ -$ 706$ -$ -$ 616$
15,0711,904HAYWOOD1,115$ 6,105$ 3,038$ -$ 247$ -$
-$ 20$ 2,800280HENDERSON2,097$ 10,736$ 5,475$ -$
385$ -$ -$ 524$ 4,352501HENRY3,483$ 20,959$
12,343$ -$ 950$ -$ -$ 104$ 7,561809HICKMAN2,191$
11,181$ 5,234$ -$ 377$ -$ -$ 95$
5,475463HOUSTON939$ 6,013$ 3,398$ -$ 233$ -$ -$
54$ 2,327227HUMPHREYS1,911$ 9,801$ 5,501$ -$
372$ -$ -$ 115$ 3,813380JACKSON941$ 4,791$ 2,186$
-$ 132$ -$ -$ 33$ 2,440343JEFFERSON5,109$ 26,889$
16,443$ -$ 1,145$ -$ -$ 145$
9,1561,302JOHNSON1,712$ 16,215$ 7,864$ -$ 173$ -$
-$ 61$ 8,116729KNOX35,204$ 147,921$ 88,500$ -$
15,635$ -$ 136$ 2,510$ 41,1396,739LAKE540$ 2,578$
1,382$ -$ 41$ -$ -$ 2$ 1,153119LAUDERDALE1,939$
10,870$ 5,912$ -$ 445$ -$ -$ 7$
4,506488LAWRENCE2,837$ 20,955$ 12,415$ -$ 898$ -$
-$ 71$ 7,571851LEWIS909$ 7,233$ 3,254$ -$ 197$ -$
-$ 6$ 3,777320LINCOLN3,103$ 13,661$ 7,835$ -$
743$ -$ -$ 203$ 4,881584LOUDON5,486$ 20,547$
14,056$ -$ 1,358$ -$ -$ 231$ 4,903881MCMINN4,447$
23,787$ 14,741$ -$ 1,048$ -$ -$ 110$
7,8881,043MCNAIRY2,523$ 13,535$ 8,036$ -$ 398$ -$
-$ 68$ 5,032605MACON1,495$ 7,578$ 3,793$ -$ 111$
-$ -$ 22$ 3,651365MADISON6,725$ 37,527$ 21,704$ -
$ 1,912$ -$ -$ 319$ 13,5921,594MARION2,318$
9,030$ 4,374$ -$ 209$ -$ -$ 81$
4,366579MARSHALL2,248$ 14,914$ 7,057$ -$ 489$ -$
-$ 103$ 7,264684MAURY7,173$ 35,247$ 18,902$ -$
2,678$ -$ -$ 325$ 13,3421,491MEIGS1,198$ 6,359$
4,335$ -$ 174$ -$ -$ 25$ 1,825258MONROE3,619$
18,909$ 13,066$ -$ 683$ -$ -$ 160$
5,000817MONTGOMERY25,992$ 284,733$ 174,816$ -$
52,954$ -$ -$ 1,372$ 55,5918,012MOORE621$ 2,023$
958$ -$ 30$ -$ -$ 53$ 982142MORGAN1,795$ 7,631$
4,984$ -$ 232$ -$ -$ 70$ 2,346462OBION2,708$
13,105$ 7,465$ -$ 561$ -$ -$ 274$
4,804726OVERTON1,772$ 10,322$ 5,720$ -$ 455$ -$ -
$ 23$ 4,124577PERRY734$ 5,674$ 2,969$ -$ 156$ -$
-$ 3$ 2,546215PICKETT529$ 3,048$ 1,813$ -$ 50$ -$
-$ 2$ 1,182178POLK1,507$ 7,598$ 4,835$ -$ 219$ -$
-$ 81$ 2,463336PUTNAM5,452$ 33,518$ 19,283$ -$
2,255$ -$ -$ 464$ 11,5161,805RHEA2,764$ 13,605$
9,297$ -$ 352$ -$ -$ 52$ 3,904617ROANE5,613$
25,203$ 16,992$ -$ 1,061$ -$ -$ 335$
6,8161,135ROBERTSON5,548$ 31,841$ 18,205$ -$
2,851$ -$ -$ 220$ 10,5651,091RUTHERFORD21,128$
174,901$ 55,596$ -$ 15,879$ -$ 1,524$ 1,706$
100,1965,828SCOTT1,546$ 10,365$ 7,258$ -$ 243$ -$
-$ 92$ 2,772460SEQUATCHIE1,182$ 9,481$ 7,038$ -$
216$ -$ -$ 59$ 2,168304SEVIER7,635$ 46,589$
27,962$ -$ 1,879$ -$ -$ 303$
16,4452,233SHELBY59,516$ 446,471$ 177,218$ 2,781$
34,417$ -$ 3,600$ 4,790$ 223,66617,634SMITH1,550$
6,182$ 3,218$ -$ 400$ -$ -$ 79$
2,485300STEWART2,007$ 14,525$ 10,054$ -$ 766$ -$
-$ 156$ 3,549511SULLIVAN15,364$ 114,256$ 59,561$ -
$ 3,127$ -$ -$ 1,197$ 50,3715,256SUMNER13,592$
61,701$ 32,889$ -$ 4,445$ -$ -$ 523$
23,8442,569TIPTON6,161$ 37,184$ 19,451$ -$ 4,379$ -
$ -$ 606$ 12,7471,348TROUSDALE687$ 3,634$ 1,413$
-$ 119$ -$ -$ 43$ 2,059165UNICOI2,063$ 19,385$
7,970$ -$ 345$ -$ -$ 462$ 10,609861UNION1,357$
5,614$ 3,261$ -$ 313$ -$ -$ 41$ 1,999343VAN
BUREN548$ 2,848$ 1,079$ -$ 91$ -$ -$ 22$
1,656169WARREN2,616$ 20,564$ 9,573$ -$ 507$ -$ -$
206$ 10,2771,126WASHINGTON11,927$ 150,739$ 54,542$
2,096$ 4,507$ -$ 7,966$ 528$
81,1005,514WAYNE1,391$ 6,942$ 3,501$ -$ 199$ -$ -
$ 113$ 3,129321WEAKLEY2,636$ 12,809$ 6,165$ -$
972$ -$ -$ 461$ 5,210604WHITE2,237$ 13,995$ 7,514$
-$ 484$ -$ -$ 47$ 5,949770WILLIAMSON11,136$
38,748$ 21,291$ -$ 3,240$ -$ -$ 1,031$
13,1851,442WILSON9,601$ 51,678$ 24,352$ -$ 3,485$ -
$ -$ 545$ 23,2962,231TENNESSEE (Totals)521,267$
3,320,710$ 1,652,616$ 6,443$ 236,754$ -$ 63,014$
33,644$ 1,328,239135,582CONG. DIST (01)66,689$
554,839$ 258,252$ 2,096$ 14,870$ -$ 7,966$ 4,111$
267,54424,727CONG. DIST (02)61,683$ 272,350$ 169,846$
-$ 23,164$ -$ 136$ 4,344$ 74,86012,133CONG. DIST
(03)60,497$ 279,407$ 175,175$ 990$ 15,493$ -$ 1,980$
3,479$ 82,29112,999CONG. DIST (04)57,384$ 370,341$
161,145$ -$ 23,932$ -$ 1,524$ 3,944$
179,79715,246CONG. DIST (05)45,974$ 361,065$ 129,541$
576$ 30,467$ -$ 47,809$ 3,264$ 149,40711,109CONG.
DIST (06)60,741$ 325,093$ 171,096$ -$ 18,248$ -$ -$
2,978$ 132,77215,658CONG. DIST (07)68,195$ 501,562$
293,786$ -$ 63,162$ -$ -$ 4,331$ 140,28317,005CONG.
DIST (08)58,490$ 260,206$ 136,494$ -$ 16,873$ -$ -$
4,585$ 102,25411,811CONG. DIST (09)41,614$ 395,846$
157,282$ 2,781$ 30,545$ -$ 3,600$ 2,607$
199,03114,894TENNESSEE (Totals)521,267$ 3,320,710$
1,652,616$ 6,443$ 236,754$ -$ 63,014$ 33,644$
1,328,239135,582Notes:* Veteran population estimates, as of
September 30, 2013, are produced by the VA Office of the
Actuary (VetPop 2011).# Prior to FY 08, "Loan Guaranty"
expenditures were included in the Education & Vocational
Rehabilitation and Employment (E&VRE) programs.
Currently, all "Loan Guaranty" expenditures are attributed to
Travis County, TX, where all Loan Guaranty payments are
processed. VA will continue to improve data collection for
future GDX reports to better distribute loan expenditures at the
state, county and congressional district levels.** Unique
patients are patients who received treatment at a VA health care
facility. Data are provided by the Allocation Resource Center
(ARC).Expenditure data sources: USASpending.gov for
Compensation & Pension (C&P) and Education and Vocational
Rehabilitation and Employment (EVRE) Benefits; Veterans
Benefits Administration Insurance Center for the Insurance
costs; the VA Financial Management System (FMS) for
Construction, Medical Research, General Operating Expenses,
and certain C&P and Readjustment data; and the Allocation
Resource Center (ARC) for Medical Care costs.1. Expenditures
are rounded to the nearest thousand dollars. For example, $500
to $1,000 are rounded to $1; $0 to $499 are rounded to $0; and
"$ -" = 0 or no expenditures.2. The Compensation & Pension
expenditures include dollars for the following programs:
veterans' compensation for service-connected disabilities;
dependency and indemnity compensation for service-connected
deaths; veterans' pension for nonservice-connected disabilities;
and burial and other benefits to veterans and their survivors.3.
Medical Care expenditures include dollars for medical services,
medical administration, facility maintenance, educational
support, research support, and other overhead items. Medical
Care expenditures do not include dollars for construction or
other non-medical support.4. Medical Care expenditures are
based on where patients live instead of where care is
delivered.5. A star symbol (*) in the Unique Patients column
denotes that there were less than 10 Unique Patients.
&"Arial,Bold"&11FY13 GEOGRAPHIC DISTRIBUTION OF
VA EXPENDITURES (GDX)
&8&P of &N
TXFY13 Summary of Expenditures by StateExpenditures in
$000sCounty/ Congressional DistrictVeteran Population*Total
ExpenditureCompensation & PensionConstructionEducation &
Vocational Rehabilitation/ EmploymentLoan Guaranty#General
Operating ExpensesInsurance & IndemnitiesMedical
CareUnique Patients**ANDERSON5,048$ 28,121$ 16,286$
-$ 828$ -$ -$ 128$ 10,8791,307ANDREWS787$ 2,581$
1,418$ -$ 193$ -$ -$ 1$ 969149ANGELINA6,160$
42,046$ 24,600$ -$ 1,531$ -$ -$ 247$
15,6682,151ARANSAS3,062$ 14,405$ 9,156$ -$ 407$ -$
-$ 315$ 4,527632ARCHER793$ 2,463$ 1,552$ -$ 69$
-$ -$ 24$ 818181ARMSTRONG207$ 1,274$ 325$ -$
29$ -$ -$ 7$ 91473ATASCOSA3,484$ 29,214$ 16,654$
-$ 1,130$ -$ -$ 230$ 11,201916AUSTIN2,288$ 8,846$
5,326$ -$ 637$ -$ -$ 48$ 2,835397BAILEY342$
1,564$ 803$ -$ 26$ -$ -$ 87$ 64981BANDERA2,665$
22,852$ 12,622$ -$ 615$ -$ -$ 103$
9,512912BASTROP7,737$ 40,418$ 22,562$ -$ 1,995$ -$
-$ 349$ 15,5121,733BAYLOR359$ 1,638$ 1,043$ -$
55$ -$ -$ 21$ 51984BEE2,521$ 10,906$ 7,073$ -$
520$ -$ -$ 86$ 3,228451BELL47,939$ 662,146$
359,571$ 12,114$ 86,129$ -$ 6,135$ 4,073$
194,12420,405BEXAR154,509$ 1,573,026$ 912,148$
5,790$ 185,806$ -$ 12,183$ 14,655$
442,44244,738BLANCO1,434$ 6,057$ 3,280$ -$ 258$ -$
-$ 90$ 2,429277BORDEN67$ 117$ 3$ -$ -$ -$ -$
1$ 11314BOSQUE1,972$ 13,632$ 6,888$ -$ 411$ -$ -
$ 108$ 6,224553BOWIE9,034$ 54,924$ 35,141$ -$
1,963$ -$ -$ 479$ 17,3402,404BRAZORIA25,633$
119,722$ 62,232$ -$ 11,663$ -$ -$ 487$
45,3394,774BRAZOS8,925$ 51,631$ 27,437$ -$ 9,045$ -
$ -$ 763$ 14,3852,114BREWSTER740$ 3,976$ 1,885$ -
$ 323$ -$ -$ 26$ 1,742184BRISCOE124$ 848$ 366$
-$ 8$ -$ -$ 3$ 47046BROOKS429$ 2,824$ 1,914$ -$
48$ -$ -$ 1$ 860117BROWN3,123$ 26,376$ 12,395$ -
$ 1,161$ -$ -$ 210$ 12,6101,277BURLESON1,348$
9,300$ 4,874$ -$ 309$ -$ -$ 59$
4,058476BURNET4,351$ 24,389$ 11,904$ -$ 578$ -$ -
$ 573$ 11,3341,058CALDWELL3,145$ 17,632$ 10,669$
-$ 775$ -$ -$ 408$ 5,780702CALHOUN1,687$ 10,178$
6,578$ -$ 318$ -$ -$ 107$ 3,175409CALLAHAN1,358$
9,725$ 5,509$ -$ 324$ -$ -$ 194$
3,698418CAMERON17,285$ 153,142$ 80,830$ -$ 9,163$
-$ 2,676$ 732$ 59,7415,951CAMP1,087$ 6,387$ 4,067$
-$ 216$ -$ -$ 11$ 2,092242CARSON541$ 2,966$
1,532$ -$ 55$ -$ -$ 3$ 1,376161CASS2,914$ 20,879$
12,316$ -$ 618$ -$ -$ 306$ 7,639924CASTRO348$
1,307$ 632$ -$ 40$ -$ -$ 14$
621115CHAMBERS3,489$ 9,732$ 5,195$ -$ 726$ -$ -$
60$ 3,751480CHEROKEE3,649$ 18,183$ 10,062$ -$
462$ -$ -$ 132$ 7,528872CHILDRESS526$ 2,578$
1,342$ -$ 67$ -$ -$ 3$ 1,166156CLAY1,184$ 4,091$
2,750$ -$ 46$ -$ -$ 85$ 1,211253COCHRAN201$
727$ 508$ -$ 26$ -$ -$ -$ 19348COKE331$ 1,865$
993$ -$ 60$ -$ -$ -$ 81299COLEMAN778$ 5,300$
2,794$ -$ 120$ -$ -$ 76$ 2,310300COLLIN53,007$
179,054$ 101,002$ -$ 23,470$ -$ -$ 3,313$
51,2697,031COLLINGSWORTH252$ 992$ 472$ -$ 18$ -
$ -$ 31$ 47062COLORADO1,674$ 6,942$ 3,678$ -$
229$ -$ -$ 223$ 2,812324COMAL15,416$ 106,413$
70,291$ -$ 8,909$ -$ -$ 1,612$
25,6003,016COMANCHE1,065$ 8,556$ 4,837$ -$ 139$ -
$ -$ 55$ 3,525394CONCHO257$ 1,631$ 762$ -$ 37$
-$ -$ 20$ 81282COOKE3,084$ 12,349$ 6,388$ -$
362$ -$ -$ 210$ 5,390715CORYELL11,618$ 121,495$
78,519$ -$ 13,028$ -$ -$ 391$
29,5563,696COTTLE122$ 1,024$ 493$ -$ 74$ -$ -$ 7$
45057CRANE282$ 888$ 572$ -$ 59$ -$ -$ 1$
25743CROCKETT290$ 924$ 399$ -$ 51$ -$ -$ 6$
46836CROSBY377$ 1,865$ 952$ -$ 77$ -$ -$ 31$
806109CULBERSON175$ 1,141$ 870$ -$ 28$ -$ -$ -$
24361DALLAM414$ 2,668$ 1,501$ -$ 49$ -$ -$ -$
1,117143DALLAS106,374$ 780,140$ 325,092$ 1,208$
75,093$ -$ 11,697$ 9,093$ 357,95629,479DAWSON720$
2,998$ 1,883$ -$ 3$ -$ -$ 4$ 1,107187DEAF
SMITH703$ 4,352$ 1,698$ -$ 120$ -$ -$ 5$
2,530284DELTA585$ 3,546$ 1,699$ -$ 157$ -$ -$ 2$
1,687183DENTON44,004$ 177,572$ 96,903$ -$ 28,528$
-$ -$ 2,060$ 50,0817,422DE WITT1,673$ 7,471$ 4,385$
-$ 120$ -$ -$ 75$ 2,891361DICKENS210$ 1,286$
810$ -$ 5$ -$ -$ 6$ 46562DIMMIT466$ 2,932$
1,870$ -$ 107$ -$ -$ 1$ 954148DONLEY362$ 2,160$
966$ -$ 45$ -$ -$ -$ 1,149127DUVAL724$ 4,143$
2,637$ -$ 75$ -$ -$ 58$ 1,373174EASTLAND1,495$
11,007$ 6,315$ -$ 289$ -$ -$ 16$
4,387486ECTOR7,486$ 36,223$ 19,081$ -$ 1,552$ -$ -
$ 621$ 14,9691,932EDWARDS134$ 1,502$ 459$ -$ 18$
-$ -$ 6$ 1,01844ELLIS12,607$ 70,666$ 36,244$ -$
5,640$ -$ -$ 329$ 28,4532,701EL PASO46,595$
525,113$ 299,686$ -$ 74,433$ -$ 2,882$ 3,283$
144,82920,861ERATH2,173$ 12,455$ 6,969$ -$ 1,546$ -
$ -$ 98$ 3,842532FALLS1,272$ 14,935$ 6,705$ -$
278$ -$ -$ 168$ 7,783579FANNIN3,095$ 45,029$
14,900$ -$ 740$ -$ 492$ 125$
28,7731,580FAYETTE1,849$ 12,236$ 6,652$ -$ 323$ -$
-$ 168$ 5,094637FISHER369$ 2,208$ 1,384$ -$ 28$ -
$ -$ 12$ 783103FLOYD319$ 1,597$ 896$ -$ 138$ -$
-$ 11$ 552120FOARD102$ 865$ 491$ -$ 30$ -$ -$
6$ 33738FORT BEND32,580$ 151,325$ 80,226$ -$
15,242$ -$ -$ 1,574$ 54,2825,826FRANKLIN939$
4,785$ 2,406$ -$ 136$ -$ -$ 22$
2,221214FREESTONE1,485$ 10,038$ 5,149$ -$ 276$ -$
-$ 89$ 4,524489FRIO749$ 5,147$ 3,131$ -$ 209$ -$
-$ 11$ 1,796187GAINES537$ 2,364$ 1,354$ -$ 50$ -$
-$ 2$ 957127GALVESTON23,364$ 120,031$ 62,596$ -$
12,765$ -$ -$ 1,099$ 43,5715,203GARZA322$ 1,006$
536$ -$ 94$ -$ -$ 25$ 35173GILLESPIE2,753$
17,091$ 8,564$ -$ 369$ -$ -$ 179$
7,979740GLASSCOCK86$ 368$ 64$ -$ -$ -$ -$ 2$
30229GOLIAD624$ 3,177$ 2,017$ -$ 48$ -$ -$ 68$
1,045138GONZALES1,423$ 6,577$ 3,740$ -$ 335$ -$ -
$ 42$ 2,460256GRAY1,784$ 9,329$ 3,843$ -$ 107$ -$
-$ 79$ 5,300573GRAYSON11,318$ 75,070$ 43,904$ -$
3,061$ -$ -$ 715$ 27,3903,682GREGG9,119$ 50,328$
29,257$ -$ 3,488$ -$ -$ 420$
17,1622,298GRIMES2,665$ 11,164$ 5,918$ -$ 356$ -$
-$ 43$ 4,847519GUADALUPE19,768$ 174,722$ 117,113$
-$ 25,183$ -$ -$ 1,894$ 30,5324,226HALE1,685$
16,184$ 5,513$ -$ 849$ -$ -$ 173$
9,649528HALL265$ 1,372$ 688$ -$ 23$ -$ -$ -$
66177HAMILTON746$ 4,865$ 2,791$ -$ 172$ -$ -$
22$ 1,881208HANSFORD256$ 810$ 324$ -$ 32$ -$ -$
2$ 45176HARDEMAN298$ 1,737$ 1,120$ -$ 62$ -$ -
$ 82$ 47375HARDIN5,385$ 20,681$ 12,219$ -$ 1,262$
-$ -$ 170$ 7,0301,196HARRIS186,604$ 1,258,362$
516,643$ 7,224$ 138,287$ -$ 74,905$ 12,381$
508,92343,483HARRISON5,020$ 29,039$ 15,288$ -$
1,186$ -$ -$ 235$ 12,3301,496HARTLEY465$ 924$
198$ -$ 41$ -$ -$ 6$ 67865HASKELL369$ 2,881$
1,400$ -$ 40$ -$ -$ 4$ 1,438118HAYS12,746$
76,050$ 41,306$ -$ 12,446$ -$ -$ 1,105$
21,1932,531HEMPHILL234$ 438$ 157$ -$ -$ -$ -$ -$
28146HENDERSON8,769$ 43,048$ 20,531$ -$ 1,114$ -$
-$ 385$ 21,0192,120HIDALGO23,105$ 197,550$ 107,941$
-$ 12,506$ -$ -$ 1,164$ 75,9397,955HILL3,020$
24,213$ 13,144$ -$ 619$ -$ -$ 150$
10,3001,080HOCKLEY1,300$ 6,984$ 4,086$ -$ 443$ -$
-$ 21$ 2,434371HOOD5,979$ 28,675$ 16,243$ -$
1,265$ -$ -$ 250$ 10,9161,460HOPKINS2,700$ 15,455$
8,299$ -$ 746$ -$ -$ 131$ 6,279776HOUSTON2,235$
12,661$ 7,845$ -$ 351$ -$ -$ 18$
4,447590HOWARD2,626$ 32,078$ 12,936$ 56$ 522$ -$
724$ 166$ 17,6741,418HUDSPETH145$ 1,490$ 648$ -$
21$ -$ -$ 1$ 82061HUNT8,071$ 48,204$ 22,333$ -$
3,438$ -$ -$ 384$ 22,0492,202HUTCHINSON1,821$
12,007$ 4,764$ -$ 353$ -$ -$ 123$
6,768682IRION163$ 784$ 583$ -$ 48$ -$ -$ 34$
11932JACK651$ 2,653$ 1,563$ -$ 173$ -$ -$ 41$
877113JACKSON1,176$ 4,121$ 2,491$ -$ 269$ -$ -$
132$ 1,229211JASPER2,873$ 15,190$ 8,244$ -$ 460$ -
$ -$ 103$ 6,384794JEFF DAVIS197$ 1,217$ 651$ -$
61$ -$ -$ 10$ 49447JEFFERSON18,852$ 86,327$
49,598$ -$ 5,354$ -$ -$ 456$ 30,9184,778JIM
HOGG272$ 1,757$ 1,282$ -$ 9$ -$ -$ 1$ 46584JIM
WELLS2,474$ 14,984$ 10,649$ -$ 560$ -$ -$ 154$
3,620583JOHNSON13,701$ 64,120$ 35,870$ -$ 5,481$ -
$ -$ 437$ 22,3312,710JONES1,487$ 7,571$ 4,415$ -$
365$ -$ -$ 68$ 2,722396KARNES978$ 6,393$ 3,841$
-$ 152$ -$ -$ 100$ 2,300208KAUFMAN7,246$ 51,238$
25,757$ -$ 3,309$ -$ -$ 266$
21,9062,026KENDALL3,662$ 28,737$ 19,056$ -$ 2,162$
-$ -$ 356$ 7,163749KENEDY26$ 119$ 60$ -$ 35$ -$
-$ -$ 23*KENT83$ 319$ 194$ -$ -$ -$ -$ 20$
10513KERR4,665$ 66,518$ 25,251$ -$ 1,083$ -$ 67$
814$ 39,3032,628KIMBLE400$ 2,179$ 1,304$ -$ 99$ -
$ -$ 31$ 746113KING21$ 50$ 39$ -$ -$ -$ -$ 1$
10*KINNEY439$ 4,821$ 1,938$ -$ 52$ -$ -$ 3$
2,829143KLEBERG2,104$ 13,515$ 8,865$ -$ 1,224$ -$
-$ 39$ 3,387423KNOX232$ 995$ 462$ -$ -$ -$ -$
28$ 50474LAMAR4,400$ 27,256$ 14,674$ -$ 956$ -$
-$ 166$ 11,4611,411LAMB814$ 4,006$ 2,304$ -$ 161$
-$ -$ 17$ 1,523253LAMPASAS3,703$ 38,301$ 26,726$
-$ 2,544$ -$ -$ 113$ 8,9181,295LA SALLE289$ 1,377$
867$ -$ 84$ -$ -$ 7$ 41965LAVACA1,480$ 8,541$
5,808$ -$ 146$ -$ -$ 40$ 2,547343LEE1,091$ 6,768$
3,637$ -$ 176$ -$ -$ 40$ 2,915323LEON1,622$
12,906$ 6,784$ -$ 226$ -$ -$ 55$
5,842545LIBERTY5,774$ 36,028$ 19,736$ -$ 1,622$ -$
-$ 277$ 14,3931,473LIMESTONE1,615$ 15,631$ 6,535$
-$ 355$ -$ -$ 39$ 8,702629LIPSCOMB194$ 882$
247$ -$ 33$ -$ -$ 1$ 60081LIVE OAK1,139$ 3,983$
2,066$ -$ 54$ -$ -$ 18$ 1,845211LLANO2,838$
15,824$ 9,008$ -$ 264$ -$ -$ 211$
6,341679LOVING11$ 61$ 15$ -$ -$ -$ -$ -$
46*LUBBOCK15,912$ 107,214$ 60,089$ -$ 12,126$ -$
-$ 1,305$ 33,6945,381LYNN290$ 1,659$ 762$ -$ 54$
-$ -$ 6$ 83778MCCULLOCH645$ 3,930$ 1,869$ -$
130$ -$ -$ 4$ 1,927226MCLENNAN16,697$ 270,299$
102,392$ 12$ 9,736$ -$ 71,923$ 1,259$
84,9766,870MCMULLEN79$ 221$ 110$ -$ 4$ -$ -$
20$ 8814MADISON977$ 4,216$ 2,209$ -$ 158$ -$ -$
31$ 1,818214MARION1,426$ 8,378$ 3,964$ -$ 131$ -$
-$ 225$ 4,057400MARTIN236$ 1,581$ 737$ -$ 43$ -$
-$ 1$ 80083MASON318$ 2,564$ 1,116$ -$ 58$ -$ -$
66$ 1,32479MATAGORDA2,382$ 15,245$ 8,122$ -$
501$ -$ -$ 36$ 6,587633MAVERICK1,323$ 8,043$
5,287$ -$ 473$ -$ -$ 86$ 2,196302MEDINA4,899$
31,625$ 19,547$ -$ 1,676$ -$ -$ 384$
10,0171,080MENARD274$ 1,366$ 760$ -$ 25$ -$ -$
4$ 57865MIDLAND8,699$ 38,683$ 19,947$ -$ 1,908$ -
$ -$ 604$ 16,2251,946MILAM2,125$ 16,959$ 7,892$ -$
300$ -$ -$ 149$ 8,618593MILLS418$ 3,153$ 1,620$ -
$ 38$ -$ -$ 6$ 1,490139MITCHELL723$ 3,153$
1,650$ -$ 57$ -$ -$ 44$ 1,401167MONTAGUE1,797$
9,751$ 6,424$ -$ 232$ -$ -$ 36$
3,060536MONTGOMERY38,226$ 155,904$ 85,474$ -$
15,599$ -$ -$ 2,427$ 52,4036,810MOORE882$ 4,021$
1,624$ -$ 218$ -$ -$ 98$ 2,082301MORRIS1,183$
9,609$ 5,298$ -$ 208$ -$ -$ 97$
4,006398MOTLEY125$ 1,108$ 668$ -$ 3$ -$ -$ 1$
43550NACOGDOCHES4,026$ 23,504$ 14,157$ -$ 1,950$
-$ -$ 197$ 7,2001,036NAVARRO3,454$ 26,008$
12,512$ -$ 1,006$ -$ -$ 250$
12,2391,056NEWTON1,152$ 6,811$ 3,623$ -$ 257$ -$
-$ 50$ 2,881446NOLAN1,010$ 7,809$ 3,665$ -$ 230$
-$ -$ 18$ 3,897353NUECES28,208$ 172,085$ 110,450$
-$ 16,396$ -$ -$ 1,355$ 43,8836,178OCHILTREE426$
1,691$ 629$ -$ 57$ -$ -$ 53$ 95294OLDHAM160$
1,380$ 613$ -$ 52$ -$ -$ 4$ 71269ORANGE6,524$
44,448$ 29,802$ -$ 2,131$ -$ -$ 149$
12,3652,107PALO PINTO2,661$ 12,664$ 8,063$ -$ 466$
-$ -$ 101$ 4,035546PANOLA1,791$ 10,351$ 5,030$ -$
421$ -$ -$ 114$ 4,785488PARKER11,075$ 51,024$
30,796$ -$ 3,358$ -$ -$ 607$
16,2632,366PARMER427$ 1,687$ 889$ -$ 37$ -$ -$
23$ 738129PECOS1,062$ 2,626$ 1,394$ -$ 150$ -$ -$
22$ 1,060147POLK3,935$ 38,513$ 20,770$ -$ 510$ -$
-$ 467$ 16,7651,740POTTER7,639$ 81,440$ 25,969$
859$ 2,306$ -$ 746$ 521$ 51,0393,449PRESIDIO318$
1,814$ 1,149$ -$ 153$ -$ -$ 1$ 51173RAINS1,146$
9,608$ 4,132$ -$ 126$ -$ -$ 20$
5,330375RANDALL9,480$ 66,682$ 27,760$ -$ 3,770$ -$
-$ 542$ 34,6103,609REAGAN148$ 925$ 433$ -$ 13$ -
$ -$ 2$ 47632REAL338$ 3,658$ 1,150$ -$ 50$ -$ -
$ 12$ 2,446155RED RIVER1,234$ 7,317$ 3,783$ -$
282$ -$ -$ 42$ 3,209331REEVES535$ 2,728$ 1,443$ -
$ 54$ -$ -$ 80$ 1,150155REFUGIO628$ 4,590$
2,586$ -$ 36$ -$ -$ 9$ 1,959171ROBERTS63$ 60$
37$ -$ -$ -$ -$ 2$ 21*ROBERTSON1,264$ 9,934$
4,199$ -$ 114$ -$ -$ 107$ 5,514406ROCKWALL5,910$
31,510$ 16,978$ -$ 3,656$ -$ -$ 304$
10,5721,057RUNNELS893$ 4,614$ 3,070$ -$ 119$ -$ -
$ 3$ 1,423234RUSK4,088$ 18,186$ 10,086$ -$ 465$ -
$ -$ 164$ 7,472951SABINE1,213$ 8,741$ 5,461$ -$
141$ -$ -$ 55$ 3,083446SAN AUGUSTINE858$ 4,752$
2,535$ -$ 94$ -$ -$ 70$ 2,053261SAN JACINTO3,316$
12,797$ 5,187$ -$ 337$ -$ -$ 73$ 7,199725SAN
PATRICIO6,245$ 37,643$ 26,072$ -$ 2,670$ -$ -$
172$ 8,7281,198SAN SABA455$ 2,219$ 1,014$ -$ 40$
-$ -$ 37$ 1,128134SCHLEICHER150$ 908$ 537$ -$
21$ -$ -$ 53$ 29630SCURRY909$ 4,884$ 2,566$ -$
138$ -$ -$ 52$ 2,128242SHACKELFORD187$ 1,533$
850$ -$ 26$ -$ -$ 100$ 55848SHELBY1,518$ 9,060$
4,711$ -$ 204$ -$ -$ 46$ 4,099456SHERMAN147$
548$ 152$ -$ 14$ -$ -$ 17$ 36439SMITH16,355$
81,245$ 50,323$ -$ 5,354$ -$ -$ 652$
24,9163,770SOMERVELL541$ 2,277$ 1,314$ -$ 179$ -$
-$ 14$ 769126STARR803$ 8,281$ 5,572$ -$ 328$ -$
-$ 24$ 2,357329STEPHENS967$ 3,098$ 1,569$ -$ 35$
-$ -$ 37$ 1,458166STERLING78$ 459$ 169$ -$ -$ -$
-$ 3$ 28823STONEWALL116$ 461$ 206$ -$ 5$ -$ -$
4$ 24633SUTTON244$ 750$ 514$ -$ 15$ -$ -$ 2$
22050SWISHER526$ 3,950$ 1,564$ -$ 49$ -$ -$ 28$
2,309181TARRANT118,214$ 629,050$ 339,594$ -$
85,064$ -$ 274$ 7,872$ 196,24726,434TAYLOR11,863$
98,610$ 60,550$ -$ 12,238$ -$ -$ 961$
24,8613,345TERRELL103$ 761$ 521$ -$ 34$ -$ -$ -$
20527TERRY730$ 2,826$ 1,797$ -$ 77$ -$ -$ 37$
915150THROCKMORTON186$ 591$ 454$ -$ 29$ -$ -$
10$ 9825TITUS1,859$ 9,006$ 4,989$ -$ 420$ -$ -$
47$ 3,549375TOM GREEN9,836$ 67,272$ 40,764$ -$
6,689$ -$ -$ 1,055$ 18,7632,515TRAVIS52,364$
1,759,581$ 168,368$ 2,763$ 50,887$ 1,385,063$ 35,922$
6,004$ 110,57413,356TRINITY1,760$ 11,812$ 6,288$ -$
310$ -$ -$ 114$ 5,100538TYLER2,138$ 11,321$ 6,271$
-$ 212$ -$ -$ 39$ 4,799617UPSHUR3,076$ 18,347$
9,766$ -$ 616$ -$ -$ 126$ 7,8391,009UPTON252$
1,082$ 637$ -$ 21$ -$ -$ 25$ 39969UVALDE1,567$
9,753$ 5,462$ -$ 482$ -$ -$ 52$ 3,758411VAL
VERDE3,299$ 22,786$ 14,450$ -$ 1,759$ -$ -$ 396$
6,181759VAN ZANDT5,024$ 27,312$ 13,092$ -$ 799$ -
$ -$ 166$ 13,2561,276VICTORIA6,489$ 36,346$
21,323$ -$ 1,411$ -$ -$ 513$
13,0981,470WALKER4,717$ 20,868$ 10,687$ -$ 3,202$
-$ -$ 188$ 6,791825WALLER2,586$ 8,708$ 3,294$ -$
647$ -$ -$ 110$ 4,657500WARD787$ 3,616$ 2,185$ -
$ 38$ -$ -$ 25$ 1,368185WASHINGTON2,480$
11,591$ 7,256$ -$ 404$ -$ -$ 217$
3,714597WEBB6,406$ 50,712$ 32,723$ -$ 3,131$ -$ -$
206$ 14,6522,332WHARTON2,567$ 13,347$ 6,171$ -$
349$ -$ -$ 111$ 6,716575WHEELER386$ 2,443$
1,225$ -$ 43$ -$ -$ 8$ 1,167127WICHITA12,838$
85,761$ 63,583$ -$ 7,940$ -$ -$ 861$
13,3782,845WILBARGER964$ 4,827$ 3,433$ -$ 173$ -$
-$ 91$ 1,130189WILLACY840$ 8,964$ 4,685$ -$ 304$
-$ -$ 34$ 3,941320WILLIAMSON36,489$ 187,499$
107,988$ -$ 25,073$ -$ -$ 2,285$
52,1527,417WILSON4,892$ 37,817$ 23,459$ -$ 2,746$ -
$ -$ 327$ 11,2851,228WINKLER522$ 1,822$ 970$ -$
17$ -$ -$ 15$ 81990WISE5,262$ 24,637$ 14,191$ -$
950$ -$ -$ 368$ 9,1281,273WOOD5,678$ 26,357$
14,947$ -$ 603$ -$ -$ 159$ 10,6471,273YOAKUM350$
1,397$ 882$ -$ 47$ -$ -$ 10$ 45877YOUNG1,524$
4,965$ 3,132$ -$ 223$ -$ -$ 97$
1,514302ZAPATA568$ 3,503$ 1,971$ -$ 21$ -$ -$ 3$
1,509157ZAVALA276$ 2,381$ 1,304$ -$ 94$ -$ -$ 2$
981100TEXAS (Totals)1,667,740$ 12,943,393$ 6,091,910$
30,026$ 1,118,114$ 1,385,063$ 220,626$ 110,750$
3,986,903434,255CONG. DIST (01)53,293$ 290,690$
168,866$ -$ 15,191$ -$ -$ 2,300$ 104,33314,096CONG.
DIST (02)38,925$ 173,854$ 76,471$ -$ 20,451$ -$ -$
3,018$ 73,9157,124CONG. DIST (03)46,256$ 146,516$
82,393$ -$ 19,146$ -$ -$ 3,087$ 41,8905,848CONG.
DIST (04)62,690$ 407,354$ 215,735$ -$ 19,584$ -$
492$ 3,353$ 168,19117,899CONG. DIST (05)47,956$
281,763$ 136,900$ -$ 16,378$ -$ -$ 2,412$
126,07312,463CONG. DIST (06)49,664$ 282,205$ 148,908$
-$ 31,732$ -$ -$ 3,019$ 98,54511,769CONG. DIST
(07)31,290$ 115,672$ 50,219$ -$ 13,440$ -$ -$ 3,303$
48,7095,207CONG. DIST (08)58,556$ 247,429$ 131,918$ -
$ 21,961$ -$ -$ 3,077$ 90,47411,164CONG. DIST
(09)27,701$ 286,006$ 127,944$ -$ 31,839$ -$ -$
1,444$ 124,7798,709CONG. DIST (10)43,248$ 1,624,526$
100,833$ 2,763$ 20,588$ 1,385,063$ 35,922$ 3,932$
75,4269,285CONG. DIST (11)54,054$ 306,498$ 169,947$ -
$ 16,141$ -$ -$ 3,710$ 116,70014,265CONG. DIST
(12)57,273$ 276,347$ 152,471$ -$ 32,879$ -$ 274$
3,723$ 86,99912,429CONG. DIST (13)53,845$ 352,694$
178,208$ 859$ 17,381$ -$ 746$ 3,231$
152,26816,627CONG. DIST (14)56,366$ 276,016$ 148,460$
-$ 24,917$ -$ -$ 1,742$ 100,89612,614CONG. DIST
(15)33,881$ 295,817$ 179,577$ -$ 28,643$ -$ -$
2,479$ 85,1199,478CONG. DIST (16)44,336$ 496,114$
282,974$ -$ 70,282$ -$ 2,882$ 3,180$
136,79619,780CONG. DIST (17)43,433$ 446,278$ 189,695$
12$ 26,251$ -$ 71,923$ 3,176$ 155,22214,448CONG.
DIST (18)29,722$ 393,288$ 138,874$ 7,224$ 37,172$ -$
74,905$ 1,665$ 133,45010,278CONG. DIST (19)44,912$
315,874$ 173,334$ 56$ 28,023$ -$ 724$ 3,289$
110,44914,034CONG. DIST (20)58,201$ 680,519$ 386,289$
5,790$ 78,688$ -$ 12,183$ 3,920$ 193,64917,107CONG.
DIST (21)67,445$ 489,979$ 271,535$ -$ 45,743$ -$ 67$
7,543$ 165,09016,831CONG. DIST (22)42,771$ 170,665$
87,293$ -$ 17,461$ -$ -$ 1,842$ 64,0707,028CONG.
DIST (23)46,903$ 351,118$ 206,443$ -$ 34,752$ -$ -$
4,041$ 105,88212,490CONG. DIST (24)39,330$ 139,473$
69,014$ -$ 17,521$ -$ -$ 3,028$ 49,9096,584CONG.
DIST (25)64,887$ 451,043$ 260,859$ -$ 46,060$ -$ -$
4,244$ 139,88017,176CONG. DIST (26)47,710$ 182,907$
99,528$ -$ 28,531$ -$ -$ 2,232$ 52,6168,135CONG.
DIST (27)57,965$ 331,592$ 205,801$ -$ 22,910$ -$ -$
3,154$ 99,72712,759CONG. DIST (28)41,267$ 354,210$
211,276$ -$ 32,699$ -$ -$ 3,689$ 106,54613,106CONG.
DIST (29)21,947$ 160,342$ 71,549$ -$ 19,151$ -$ -$
739$ 68,9025,673CONG. DIST (30)33,682$ 414,166$
170,020$ 1,208$ 39,273$ -$ 11,697$ 1,855$
190,11313,352CONG. DIST (31)79,197$ 794,686$ 436,078$
12,114$ 103,658$ -$ 6,135$ 6,251$
230,44925,128CONG. DIST (32)35,883$ 156,854$ 68,298$
-$ 15,787$ -$ -$ 3,643$ 69,1276,934CONG. DIST
(33)21,974$ 208,717$ 104,674$ -$ 25,573$ -$ -$
1,672$ 76,7977,145CONG. DIST (34)33,599$ 255,597$
144,317$ -$ 14,790$ -$ 2,676$ 1,330$
92,4849,843CONG. DIST (35)45,337$ 504,718$ 295,513$ -
$ 64,605$ -$ -$ 3,920$ 140,68014,422CONG. DIST
(36)52,241$ 281,865$ 149,698$ -$ 18,912$ -$ -$
2,508$ 110,74813,025TEXAS (Totals)1,667,740$
12,943,393$ 6,091,910$ 30,026$ 1,118,114$ 1,385,063$
220,626$ 110,750$ 3,986,903434,255Notes:* Veteran
population estimates, as of September 30, 2013, are produced by
the VA Office of the Actuary (VetPop 2011).# Prior to FY 08,
"Loan Guaranty" expenditures were included in the Education &
Vocational Rehabilitation and Employment (E&VRE) programs.
Currently, all "Loan Guaranty" expenditures are attributed to
Travis County, TX, where all Loan Guaranty payments are
processed. VA will continue to improve data collection for
future GDX reports to better distribute loan expenditures at the
state, county and congressional district levels.** Unique
patients are patients who received treatment at a VA health care
facility. Data are provided by the Allocation Resource Center
(ARC).Expenditure data sources: USASpending.gov for
Compensation & Pension (C&P) and Education and Vocational
Rehabilitation and Employment (EVRE) Benefits; Veterans
Benefits Administration Insurance Center for the Insurance
costs; the VA Financial Management System (FMS) for
Construction, Medical Research, General Operating Expenses,
and certain C&P and Readjustment data; and the Allocation
Resource Center (ARC) for Medical Care costs.1. Expenditures
are rounded to the nearest thousand dollars. For example, $500
to $1,000 are rounded to $1; $0 to $499 are rounded to $0; and
"$ -" = 0 or no expenditures.2. The Compensation & Pension
expenditures include dollars for the following programs:
veterans' compensation for service-connected disabilities;
dependency and indemnity compensation for service-connected
deaths; veterans' pension for nonservice-connected disabilities;
and burial and other benefits to veterans and their survivors.3.
Medical Care expenditures include dollars for medical services,
medical administration, facility maintenance, educational
support, research support, and other overhead items. Medical
Care expenditures do not include dollars for construction or
other non-medical support.4. Medical Care expenditures are
based on where patients live instead of where care is
delivered.5. A star symbol (*) in the Unique Patients column
denotes that there were less than 10 Unique Patients.
&"Arial,Bold"&11FY13 GEOGRAPHIC DISTRIBUTION OF
VA EXPENDITURES (GDX)
&8&P of &N
UTFY13 Summary of Expenditures by StateExpenditures in
$000sCounty/ Congressional DistrictVeteran Population*Total
ExpenditureCompensation & PensionConstructionEducation &
Vocational Rehabilitation/ EmploymentLoan Guaranty#General
Operating ExpensesInsurance & IndemnitiesMedical
CareUnique Patients**BEAVER477$ 1,568$ 709$ -$ 118$
-$ -$ 2$ 74085BOX ELDER2,724$ 12,337$ 5,353$ -$
852$ -$ -$ 235$ 5,897588CACHE4,606$ 17,628$
8,879$ -$ 3,322$ -$ -$ 489$ 4,939702CARBON1,744$
9,869$ 4,625$ -$ 265$ -$ -$ 158$
4,821402DAGGETT120$ 698$ 222$ -$ 9$ -$ -$ 2$
46541DAVIS20,978$ 113,709$ 58,039$ -$ 16,618$ -$ -
$ 1,435$ 37,6173,939DUCHESNE971$ 6,275$ 2,636$ -$
165$ -$ -$ 56$ 3,417402EMERY738$ 2,676$ 1,042$ -
$ 52$ -$ -$ 39$ 1,543154GARFIELD448$ 1,462$ 781$
-$ 24$ -$ -$ 30$ 62795GRAND692$ 4,444$ 1,616$ -
$ 3$ -$ -$ 19$ 2,806260IRON2,720$ 14,089$ 6,204$
-$ 1,864$ -$ -$ 165$ 5,856570JUAB640$ 3,790$
1,562$ -$ 99$ -$ -$ 19$ 2,110156KANE671$ 3,206$
1,804$ -$ 65$ -$ -$ 100$ 1,237158MILLARD828$
3,322$ 1,421$ -$ 105$ -$ -$ 40$
1,756142MORGAN612$ 2,885$ 1,779$ -$ 233$ -$ -$
22$ 851127PIUTE138$ 618$ 355$ -$ 8$ -$ -$ 1$
25436RICH122$ 601$ 307$ -$ 16$ -$ -$ 14$
26434SALT LAKE50,134$ 410,113$ 116,685$ 6,163$
33,010$ -$ 53,145$ 3,864$ 197,24713,869SAN JUAN603$
2,829$ 1,194$ -$ 73$ -$ -$ 14$
1,548151SANPETE1,695$ 8,463$ 3,549$ -$ 398$ -$ -$
60$ 4,455385SEVIER1,491$ 6,593$ 3,509$ -$ 331$ -$
-$ 44$ 2,709307SUMMIT1,962$ 7,200$ 3,043$ -$ 487$
-$ -$ 254$ 3,417351TOOELE4,660$ 24,585$ 10,794$ -$
1,711$ -$ -$ 150$ 11,932971UINTAH2,074$ 7,155$
2,971$ -$ 172$ -$ -$ 17$ 3,995501UTAH18,951$
77,156$ 35,826$ -$ 11,495$ -$ -$ 1,242$
28,5933,393WASATCH1,025$ 4,059$ 1,716$ -$ 266$ -$
-$ 88$ 1,989207WASHINGTON11,037$ 48,313$ 26,494$
-$ 3,650$ -$ -$ 564$ 17,6052,461WAYNE221$ 579$
349$ -$ 10$ -$ -$ 7$ 21336WEBER17,691$ 91,295$
47,462$ -$ 10,552$ -$ -$ 906$ 32,3743,539UTAH
(Totals)150,771$ 887,516$ 350,923$ 6,163$ 85,974$ -$
53,145$ 10,033$ 381,27934,062CONG. DIST (01)46,274$
220,874$ 110,802$ -$ 26,733$ -$ -$ 2,956$
80,3829,023CONG. DIST (02)41,773$ 335,631$ 116,008$
6,163$ 25,574$ -$ 51,303$ 2,675$ 133,90710,370CONG.
DIST (03)30,783$ 131,040$ 53,788$ -$ 14,121$ -$
1,841$ 2,286$ 59,0045,992CONG. DIST (04)31,941$
199,971$ 70,325$ -$ 19,545$ -$ -$ 2,115$
107,9868,677UTAH (Totals)150,771$ 887,516$ 350,923$
6,163$ 85,974$ -$ 53,145$ 10,033$
381,27934,062Notes:* Veteran population estimates, as of
September 30, 2013, are produced by the VA Office of the
Actuary (VetPop 2011).# Prior to FY 08, "Loan Guaranty"
expenditures were included in the Education & Vocational
Rehabilitation and Employment (E&VRE) programs.
Currently, all "Loan Guaranty" expenditures are attributed to
Travis County, TX, where all Loan Guaranty payments are
processed. VA will continue to improve data collection for
future GDX reports to better distribute loan expenditures at the
state, county and congressional district levels.** Unique
patients are patients who received treatment at a VA health care
facility. Data are provided by the Allocation Resource Center
(ARC).Expenditure data sources: USASpending.gov for
Compensation & Pension (C&P) and Education and Vocational
Rehabilitation and Employment (EVRE) Benefits; Veterans
Benefits Administration Insurance Center for the Insurance
costs; the VA Financial Management System (FMS) for
Construction, Medical Research, General Operating Expenses,
and certain C&P and Readjustment data; and the Allocation
Resource Center (ARC) for Medical Care costs.1. Expenditures
are rounded to the nearest thousand dollars. For example, $500
to $1,000 are rounded to $1; $0 to $499 are rounded to $0; and
"$ -" = 0 or no expenditures.2. The Compensation & Pension
expenditures include dollars for the following programs:
veterans' compensation for service-connected disabilities;
dependency and indemnity compensation for service-connected
deaths; veterans' pension for nonservice-connected disabilities;
and burial and other benefits to veterans and their survivors.3.
Medical Care expenditures include dollars for medical services,
medical administration, facility maintenance, educational
support, research support, and other overhead items. Medical
Care expenditures do not include dollars for construction or
other non-medical support.4. Medical Care expenditures are
based on where patients live instead of where care is
delivered.5. A star symbol (*) in the Unique Patients column
denotes that there were less than 10 Unique Patients.
&"Arial,Bold"&11FY13 GEOGRAPHIC DISTRIBUTION OF
VA EXPENDITURES (GDX)
&8&P of &N
VAFY13 Summary of Expenditures by StateExpenditures in
$000sCounty/ Congressional DistrictVeteran Population*Total
ExpenditureCompensation & PensionConstructionEducation &
Vocational Rehabilitation/ EmploymentLoan Guaranty#General
Operating ExpensesInsurance & IndemnitiesMedical
CareUnique Patients**ACCOMACK3,980$ 12,855$ 7,737$
-$ 854$ -$ -$ 172$ 4,093620ALBEMARLE7,618$
21,699$ 12,033$ -$ 3,267$ -$ -$ 776$
5,623960ALLEGHANY1,838$ 7,408$ 1,979$ -$ 140$ -$
-$ 84$ 5,205527AMELIA1,223$ 8,146$ 3,141$ -$ 241$
-$ -$ 25$ 4,739328AMHERST2,929$ 14,087$ 6,521$ -$
882$ -$ -$ 113$ 6,572756APPOMATTOX1,237$ 7,137$
3,341$ -$ 230$ -$ -$ 153$
3,413375ARLINGTON14,552$ 65,634$ 31,496$ -$
22,495$ -$ -$ 1,798$ 9,8451,173AUGUSTA7,722$
24,042$ 9,767$ -$ 930$ -$ -$ 595$
12,7511,571BATH492$ 2,118$ 1,141$ -$ 35$ -$ -$
62$ 881113BEDFORD7,695$ 40,676$ 15,919$ -$ 1,812$
-$ -$ 701$ 22,2432,004BLAND795$ 4,239$ 2,352$ -$
69$ -$ -$ 18$ 1,800215BOTETOURT3,537$ 21,058$
7,420$ -$ 440$ -$ -$ 216$
12,983971BRUNSWICK1,756$ 9,141$ 4,280$ -$ 320$ -$
-$ 40$ 4,500425BUCHANAN1,256$ 10,399$ 7,419$ -$
210$ -$ -$ 28$ 2,743367BUCKINGHAM1,389$ 5,839$
2,610$ -$ 48$ -$ -$ 24$ 3,157275CAMPBELL4,954$
20,836$ 7,909$ -$ 667$ -$ -$ 366$
11,8931,347CAROLINE3,629$ 18,753$ 8,540$ -$ 1,637$
-$ -$ 208$ 8,368707CARROLL2,470$ 14,587$ 5,549$ -
$ 428$ -$ -$ 132$ 8,477994CHARLES CITY761$
4,163$ 1,338$ -$ 170$ -$ -$ 9$
2,646203CHARLOTTE1,026$ 7,109$ 3,807$ -$ 306$ -$
-$ 18$ 2,978333CHESTERFIELD32,414$ 174,332$
81,310$ -$ 19,293$ -$ -$ 2,923$
70,8066,524CLARKE1,577$ 6,608$ 2,734$ -$ 648$ -$ -
$ 146$ 3,080282CRAIG476$ 4,091$ 1,827$ -$ 98$ -$
-$ 29$ 2,137173CULPEPER4,518$ 16,129$ 8,414$ -$
1,466$ -$ 1,393$ 181$ 4,675540CUMBERLAND711$
3,641$ 1,290$ -$ 85$ -$ -$ 22$
2,244229DICKENSON988$ 10,110$ 5,433$ -$ 260$ -$
-$ 51$ 4,366403DINWIDDIE3,116$ 15,406$ 5,436$ -$
696$ -$ -$ 172$ 9,103750ESSEX1,036$ 5,232$ 2,556$
-$ 286$ -$ -$ 150$ 2,241232FAIRFAX84,306$
367,401$ 211,536$ -$ 107,085$ -$ -$ 9,756$
39,0245,987FAUQUIER8,129$ 20,039$ 10,514$ -$ 3,305$
-$ -$ 591$ 5,629593FLOYD1,064$ 7,329$ 2,828$ -$
114$ -$ -$ 71$ 4,316417FLUVANNA3,163$ 8,473$
4,571$ -$ 1,013$ -$ -$ 142$
2,746428FRANKLIN5,101$ 35,612$ 14,034$ -$ 911$ -$
-$ 83$ 20,5841,623FREDERICK8,464$ 35,622$ 15,506$
-$ 2,642$ -$ -$ 682$ 16,7921,701GILES1,372$ 9,779$
4,477$ -$ 248$ -$ -$ 159$
4,895405GLOUCESTER5,490$ 25,625$ 15,609$ -$ 3,945$
-$ -$ 731$ 5,339677GOOCHLAND1,925$ 7,458$ 3,032$
-$ 465$ -$ -$ 139$ 3,822345GRAYSON1,366$ 7,091$
2,894$ -$ 87$ -$ -$ 90$ 4,019560GREENE1,938$
6,608$ 3,242$ -$ 929$ -$ -$ 68$
2,370289GREENSVILLE1,353$ 7,789$ 2,949$ -$ 263$ -
$ -$ 109$ 4,468242HALIFAX3,016$ 19,642$ 10,584$ -
$ 414$ -$ -$ 127$ 8,518926HANOVER9,958$ 30,966$
14,360$ -$ 2,759$ -$ -$ 440$
13,4071,230HENRICO23,002$ 112,458$ 45,166$ -$
10,211$ -$ -$ 1,550$ 55,5314,912HENRY4,833$ 27,018$
8,403$ -$ 756$ -$ -$ 355$
17,5041,774HIGHLAND319$ 1,115$ 613$ -$ 37$ -$ -$
4$ 46167ISLE OF WIGHT4,836$ 23,120$ 13,918$ -$
4,610$ -$ -$ 307$ 4,284649JAMES CITY10,028$
55,215$ 36,233$ -$ 10,871$ -$ -$ 823$
7,2881,115KING AND QUEEN758$ 3,104$ 1,305$ -$
123$ -$ -$ 141$ 1,535138KING GEORGE4,158$ 15,030$
8,660$ -$ 2,935$ -$ -$ 132$ 3,303446KING
WILLIAM1,482$ 6,205$ 3,018$ -$ 450$ -$ -$ 59$
2,679263LANCASTER1,848$ 6,141$ 3,181$ -$ 176$ -$
-$ 226$ 2,559255LEE2,035$ 15,508$ 8,393$ -$ 297$ -
$ -$ 63$ 6,755634LOUDOUN25,105$ 72,450$ 40,662$
-$ 19,595$ -$ -$ 1,999$ 10,1931,507LOUISA3,772$
13,733$ 6,429$ -$ 792$ -$ -$ 501$
6,011543LUNENBURG1,556$ 8,327$ 3,071$ -$ 199$ -$
-$ 51$ 5,006358MADISON1,263$ 3,598$ 2,133$ -$
210$ -$ -$ 56$ 1,199180MATHEWS1,281$ 4,775$
3,120$ -$ 299$ -$ -$ 53$
1,303165MECKLENBURG3,168$ 20,710$ 9,390$ -$ 842$
-$ -$ 476$ 10,002860MIDDLESEX1,500$ 6,919$ 3,482$
-$ 414$ -$ -$ 165$ 2,858257MONTGOMERY5,959$
29,088$ 11,729$ -$ 3,737$ -$ -$ 158$
13,4641,177NELSON1,524$ 6,674$ 4,113$ -$ 387$ -$ -
$ 143$ 2,031273NEW KENT1,717$ 10,710$ 6,128$ -$
983$ -$ -$ 115$ 3,485370NORTHAMPTON1,221$
4,492$ 2,657$ -$ 249$ -$ -$ 61$
1,525199NORTHUMBERLAND1,914$ 5,027$ 2,373$ -$
187$ -$ -$ 311$ 2,156266NOTTOWAY1,644$ 9,932$
4,640$ -$ 610$ -$ -$ 42$ 4,641449ORANGE4,199$
16,247$ 10,005$ -$ 2,119$ -$ -$ 204$
3,917595PAGE2,167$ 9,940$ 4,356$ -$ 469$ -$ -$
125$ 4,990565PATRICK1,462$ 10,405$ 4,249$ -$ 252$
-$ -$ 198$ 5,706608PITTSYLVANIA5,555$ 28,121$
10,814$ -$ 1,072$ -$ -$ 113$
16,1231,909POWHATAN3,264$ 10,490$ 5,008$ -$ 788$
-$ -$ 150$ 4,543421PRINCE EDWARD1,501$ 10,390$
4,960$ -$ 867$ -$ -$ 90$ 4,473464PRINCE
GEORGE5,473$ 33,879$ 16,851$ -$ 5,960$ -$ -$ 234$
10,8341,208PRINCE WILLIAM46,988$ 249,030$ 140,407$
1,930$ 75,121$ -$ 2,227$ 2,203$
27,1424,411PULASKI3,433$ 16,377$ 7,231$ -$ 512$ -$
-$ 123$ 8,511927RAPPAHANNOCK780$ 1,641$ 821$ -$
115$ -$ -$ 15$ 69092RICHMOND1,077$ 4,918$ 2,082$
-$ 150$ -$ -$ 37$ 2,649155ROANOKE8,961$ 57,152$
22,696$ -$ 2,346$ -$ -$ 775$
31,3352,541ROCKBRIDGE1,935$ 11,000$ 3,319$ -$ 258$
-$ -$ 138$ 7,285568ROCKINGHAM5,676$ 19,348$
8,739$ -$ 1,008$ -$ -$ 275$
9,3251,423RUSSELL2,174$ 9,169$ 5,594$ -$ 236$ -$ -
$ 26$ 3,312475SCOTT2,016$ 12,842$ 6,747$ -$ 242$
-$ -$ 65$ 5,788599SHENANDOAH4,265$ 19,814$
9,087$ -$ 986$ -$ -$ 635$ 9,1061,104SMYTH2,759$
17,587$ 9,062$ -$ 270$ -$ -$ 66$
8,189890SOUTHAMPTON2,247$ 6,865$ 3,454$ -$ 627$
-$ -$ 97$ 2,687337SPOTSYLVANIA16,492$ 76,772$
42,718$ -$ 15,164$ -$ -$ 706$
18,1852,593STAFFORD22,414$ 123,646$ 73,043$ -$
36,700$ -$ -$ 552$ 13,3512,553SURRY735$ 3,410$
2,050$ -$ 189$ -$ -$ 16$ 1,155157SUSSEX1,215$
5,716$ 2,963$ -$ 441$ -$ -$ 61$
2,252258TAZEWELL3,475$ 30,347$ 18,103$ -$ 699$ -$
-$ 180$ 11,3661,302WARREN4,142$ 16,490$ 7,018$ -$
1,236$ -$ -$ 223$ 8,014802WASHINGTON4,543$
27,553$ 15,023$ -$ 779$ -$ -$ 141$
11,6101,503WESTMORELAND2,004$ 8,149$ 3,740$ -$
472$ -$ -$ 499$ 3,438349WISE2,875$ 21,101$ 13,353$
-$ 560$ -$ -$ 42$ 7,146955WYTHE2,700$ 15,914$
8,135$ -$ 377$ -$ -$ 84$ 7,319839YORK9,790$
53,964$ 31,808$ -$ 14,221$ -$ -$ 1,276$
6,6591,198ALEXANDRIA (CITY)11,862$ 58,141$ 28,399$
93$ 17,576$ -$ -$ 1,300$ 10,7731,202BRISTOL
(CITY)1,439$ 9,834$ 4,932$ -$ 275$ -$ -$ 112$
4,514591BUENA VISTA (CITY)580$ 3,233$ 1,509$ -$
125$ -$ -$ 5$ 1,594165CHARLOTTESVILLE
(CITY)2,357$ 10,760$ 3,923$ -$ 4,543$ -$ -$ 231$
2,062269CHESAPEAKE (CITY)34,445$ 211,019$ 116,481$
-$ 59,329$ -$ -$ 2,732$ 32,4774,475COLONIAL
HEIGHTS (CITY)1,943$ 22,159$ 13,927$ -$ 2,581$ -$
-$ 231$ 5,420509COVINGTON (CITY)689$ 6,611$
4,348$ -$ 170$ -$ -$ 76$ 2,016209DANVILLE
(CITY)3,939$ 29,425$ 15,242$ 11$ 1,672$ -$ 97$
180$ 12,2221,427EMPORIA (CITY)401$ 3,348$ 1,588$ -$
142$ -$ -$ 51$ 1,567137FAIRFAX (CITY)2,248$
13,163$ 7,494$ -$ 4,626$ -$ -$ 261$ 782121FALLS
CHURCH (CITY)1,052$ 3,521$ 1,929$ -$ 992$ -$ -$
134$ 46678FRANKLIN (CITY)1,033$ 5,998$ 3,754$ -$
722$ -$ -$ 26$ 1,496158FREDERICKSBURG
(CITY)2,155$ 13,463$ 6,771$ -$ 3,334$ -$ -$ 107$
3,251512GALAX (CITY)493$ 6,257$ 3,973$ -$ 274$ -$
-$ 19$ 1,991205HAMPTON (CITY)33,589$ 223,563$
96,877$ 5,211$ 36,714$ -$ 4,276$ 1,213$
79,2715,881HARRISONBURG (CITY)2,129$ 10,708$ 5,855$
-$ 1,644$ -$ -$ 248$ 2,961398HOPEWELL
(CITY)3,200$ 25,088$ 14,005$ -$ 2,919$ -$ -$ 267$
7,897834LEXINGTON (CITY)546$ 4,779$ 3,566$ -$ 565$
-$ -$ 54$ 59479LYNCHBURG (CITY)5,527$ 36,014$
16,581$ -$ 7,100$ -$ -$ 489$ 11,8451,511MANASSAS
(CITY)3,001$ 12,658$ 6,591$ -$ 3,347$ -$ -$ 200$
2,521230MANASSAS PARK (CITY)1,199$ 1,286$ 88$ -$
16$ -$ -$ 15$ 1,167101MARTINSVILLE (CITY)1,246$
11,328$ 6,455$ -$ 873$ -$ -$ 59$ 3,941408NEWPORT
NEWS (CITY)26,138$ 187,702$ 96,306$ -$ 45,719$ -$
-$ 1,459$ 44,2185,178NORFOLK (CITY)35,204$ 195,267$
90,006$ -$ 61,939$ -$ -$ 2,103$ 41,2195,157NORTON
(CITY)289$ 2,081$ 1,549$ -$ 100$ -$ -$ 2$
43096PETERSBURG (CITY)3,810$ 50,579$ 28,883$ -$
5,021$ -$ -$ 350$ 16,3241,310POQUOSON (CITY)1,309$
7,852$ 4,924$ -$ 1,188$ -$ -$ 120$
1,619158PORTSMOUTH (CITY)13,872$ 82,031$ 41,596$ -
$ 18,667$ -$ -$ 311$ 21,4582,385RADFORD
(CITY)886$ 6,062$ 3,406$ -$ 820$ -$ -$ 45$
1,791198RICHMOND (CITY)13,282$ 135,577$ 35,659$
6,159$ 11,112$ -$ 7,850$ 988$ 73,8094,657ROANOKE
(CITY)8,749$ 139,197$ 29,557$ 1,058$ 3,468$ -$
42,378$ 672$ 62,0643,485SALEM (CITY)2,760$ 44,802$
10,630$ 8,299$ 1,399$ -$ 2,908$ 169$
21,399848STAUNTON (CITY)2,100$ 12,385$ 7,456$ -$
799$ -$ -$ 183$ 3,947602SUFFOLK (CITY)13,291$
78,158$ 43,994$ -$ 21,292$ -$ -$ 699$
12,1731,878VIRGINIA BEACH (CITY)65,201$ 433,416$
230,804$ -$ 146,261$ -$ -$ 5,633$
50,7188,581WAYNESBORO (CITY)1,966$ 10,403$ 6,132$
-$ 603$ -$ -$ 125$ 3,544433WILLIAMSBURG
(CITY)930$ 1,841$ 535$ -$ 112$ -$ -$ 270$
923132WINCHESTER (CITY)1,963$ 9,301$ 3,784$ -$
791$ -$ -$ 106$ 4,620529VIRGINIA (Totals)840,398$
4,653,545$ 2,291,200$ 22,761$ 874,229$ -$ 61,129$
60,779$ 1,343,447142,605CONG. DIST (01)99,112$
477,248$ 271,443$ 1,930$ 107,066$ -$ 2,227$ 6,830$
87,75212,200CONG. DIST (02)113,418$ 644,819$ 333,490$
196,915$ -$ 8,432$ 105,98215,466CONG. DIST
(03)90,048$ 744,379$ 325,009$ 11,369$ 135,378$ -$
12,126$ 3,922$ 256,57521,105CONG. DIST (04)95,698$
566,008$ 297,830$ 111,126$ -$ 6,842$
150,21016,498CONG. DIST (05)65,972$ 318,338$ 144,190$
11$ 22,163$ -$ 97$ 4,187$ 147,68915,359CONG. DIST
(06)64,410$ 412,458$ 149,842$ 1,058$ 22,819$ -$
42,378$ 5,068$ 191,29417,063CONG. DIST (07)70,285$
276,393$ 132,350$ 32,206$ -$ 1,393$ 4,821$
105,62310,598CONG. DIST (08)56,115$ 306,485$ 165,937$
93$ 93,768$ -$ 6,681$ 40,0055,286CONG. DIST
(09)58,695$ 398,422$ 189,486$ 8,299$ 14,664$ -$
2,908$ 2,711$ 180,35318,526CONG. DIST (10)62,432$
207,596$ 108,833$ 47,471$ -$ 5,355$
45,9385,478CONG. DIST (11)64,214$ 301,400$ 172,790$
90,654$ -$ 5,931$ 32,0265,026VIRGINIA (Totals)840,398$
4,653,545$ 2,291,200$ 22,761$ 874,229$ -$ 61,129$
60,779$ 1,343,447142,605Notes:* Veteran population
estimates, as of September 30, 2013, are produced by the VA
Office of the Actuary (VetPop 2011).# Prior to FY 08, "Loan
Guaranty" expenditures were included in the Education &
Vocational Rehabilitation and Employment (E&VRE) programs.
Currently, all "Loan Guaranty" expenditures are attributed to
Travis County, TX, where all Loan Guaranty payments are
processed. VA will continue to improve data collection for
future GDX reports to better distribute loan expenditures at the
state, county and congressional district levels.** Unique
patients are patients who received treatment at a VA health care
facility. Data are provided by the Allocation Resource Center
(ARC).Expenditure data sources: USASpending.gov for
Compensation & Pension (C&P) and Education and Vocational
Rehabilitation and Employment (EVRE) Benefits; Veterans
Benefits Administration Insurance Center for the Insurance
costs; the VA Financial Management System (FMS) for
Construction, Medical Research, General Operating Expenses,
and certain C&P and Readjustment data; and the Allocation
Resource Center (ARC) for Medical Care costs.1. Expenditures
are rounded to the nearest thousand dollars. For example, $500
to $1,000 are rounded to $1; $0 to $499 are rounded to $0; and
"$ -" = 0 or no expenditures.2. The Compensation & Pension
expenditures include dollars for the following programs:
veterans' compensation for service-connected disabilities;
dependency and indemnity compensation for service-connected
deaths; veterans' pension for nonservice-connected disabilities;
and burial and other benefits to veterans and their survivors.3.
Medical Care expenditures include dollars for medical services,
medical administration, facility maintenance, educational
support, research support, and other overhead items. Medical
Care expenditures do not include dollars for construction or
other non-medical support.4. Medical Care expenditures are
based on where patients live instead of where care is
delivered.5. A star symbol (*) in the Unique Patients column
denotes that there were less than 10 Unique Patients.
&"Arial,Bold"&11FY13 GEOGRAPHIC DISTRIBUTION OF
VA EXPENDITURES (GDX)
&8&P of &N
VTFY13 Summary of Expenditures by StateExpenditures in
$000sCounty/ Congressional DistrictVeteran Population*Total
ExpenditureCompensation & PensionConstructionEducation &
Vocational Rehabilitation/ EmploymentLoan Guaranty#General
Operating ExpensesInsurance & IndemnitiesMedical
CareUnique Patients**ADDISON2,415$ 9,773$ 5,072$ -$
712$ -$ -$ 91$ 3,899660BENNINGTON3,543$ 18,331$
7,759$ -$ 387$ -$ -$ 292$
9,8931,222CALEDONIA2,653$ 16,172$ 6,937$ -$ 905$ -
$ -$ 334$ 7,996905CHITTENDEN9,703$ 41,289$
20,232$ -$ 7,062$ -$ -$ 658$ 13,3362,314ESSEX730$
5,436$ 2,949$ -$ 167$ -$ -$ 1$
2,319313FRANKLIN3,947$ 16,464$ 8,361$ -$ 1,441$ -$
-$ 192$ 6,4701,120GRAND ISLE669$ 2,526$ 1,563$ -$
236$ -$ -$ 48$ 678171LAMOILLE1,924$ 7,765$
3,899$ -$ 786$ -$ -$ 124$ 2,955453ORANGE2,432$
16,346$ 6,523$ -$ 829$ -$ -$ 83$
8,912903ORLEANS2,367$ 14,704$ 7,410$ -$ 655$ -$ -
$ 87$ 6,551906RUTLAND5,418$ 28,319$ 12,908$ -$
1,955$ -$ -$ 370$ 13,0871,652WASHINGTON4,855$
23,652$ 10,767$ -$ 3,222$ -$ -$ 387$
9,2761,134WINDHAM3,425$ 20,429$ 8,373$ -$ 725$ -$
-$ 397$ 10,9351,124WINDSOR4,731$ 52,762$ 15,531$
1,105$ 1,215$ -$ 3,992$ 276$ 30,6432,048VERMONT
(Totals)48,812$ 273,966$ 118,286$ 1,105$ 20,296$ -$
3,992$ 3,340$ 126,94914,925CONG. DIST (01)48,812$
273,966$ 118,286$ 1,105$ 20,296$ -$ 3,992$ 3,340$
126,94914,925VERMONT (Totals)48,812$ 273,966$
118,286$ 1,105$ 20,296$ -$ 3,992$ 3,340$
126,94914,925Notes:* Veteran population estimates, as of
September 30, 2013, are produced by the VA Office of the
Actuary (VetPop 2011).# Prior to FY 08, "Loan Guaranty"
expenditures were included in the Education & Vocational
Rehabilitation and Employment (E&VRE) programs.
Currently, all "Loan Guaranty" expenditures are attributed to
Travis County, TX, where all Loan Guaranty payments are
processed. VA will continue to improve data collection for
future GDX reports to better distribute loan expenditures at the
state, county and congressional district levels.** Unique
patients are patients who received treatment at a VA health care
facility. Data are provided by the Allocation Resource Center
(ARC).Expenditure data sources: USASpending.gov for
Compensation & Pension (C&P) and Education and Vocational
Rehabilitation and Employment (EVRE) Benefits; Veterans
Benefits Administration Insurance Center for the Insurance
costs; the VA Financial Management System (FMS) for
Construction, Medical Research, General Operating Expenses,
and certain C&P and Readjustment data; and the Allocation
Resource Center (ARC) for Medical Care costs.1. Expenditures
are rounded to the nearest thousand dollars. For example, $500
to $1,000 are rounded to $1; $0 to $499 are rounded to $0; and
"$ -" = 0 or no expenditures.2. The Compensation & Pension
expenditures include dollars for the following programs:
veterans' compensation for service-connected disabilities;
dependency and indemnity compensation for service-connected
deaths; veterans' pension for nonservice-connected disabilities;
and burial and other benefits to veterans and their survivors.3.
Medical Care expenditures include dollars for medical services,
medical administration, facility maintenance, educational
support, research support, and other overhead items. Medical
Care expenditures do not include dollars for construction or
other non-medical support.4. Medical Care expenditures are
based on where patients live instead of where care is
delivered.5. A star symbol (*) in the Unique Patients column
denotes that there were less than 10 Unique Patients.
&"Arial,Bold"&11FY13 GEOGRAPHIC DISTRIBUTION OF
VA EXPENDITURES (GDX)
&8&P of &N
WAFY13 Summary of Expenditures by StateExpenditures in
$000sCounty/ Congressional DistrictVeteran Population*Total
ExpenditureCompensation & PensionConstructionEducation &
Vocational Rehabilitation/ EmploymentLoan Guaranty#General
Operating ExpensesInsurance & IndemnitiesMedical
CareUnique Patients**ADAMS901$ 3,300$ 2,026$ -$
240$ -$ -$ 40$ 994145ASOTIN2,316$ 11,248$ 6,648$
-$ 526$ -$ -$ 33$ 4,042670BENTON15,114$ 60,283$
32,716$ -$ 5,584$ -$ -$ 933$
21,0513,172CHELAN5,817$ 22,409$ 13,652$ -$ 1,287$ -
$ -$ 364$ 7,1041,180CLALLAM9,532$ 46,442$ 28,518$
-$ 1,809$ -$ -$ 920$ 15,1951,755CLARK38,765$
218,079$ 96,844$ -$ 18,384$ -$ -$ 1,826$
101,0249,523COLUMBIA437$ 2,637$ 1,186$ -$ 78$ -$
-$ 2$ 1,370179COWLITZ11,011$ 56,056$ 30,358$ -$
2,498$ -$ -$ 508$ 22,6922,493DOUGLAS3,270$ 9,589$
6,368$ -$ 472$ -$ -$ 82$ 2,666567FERRY977$ 5,540$
3,268$ -$ 68$ -$ -$ 3$ 2,201302FRANKLIN4,054$
18,157$ 9,604$ -$ 1,756$ -$ -$ 302$
6,494911GARFIELD236$ 1,077$ 615$ -$ -$ -$ -$ 4$
45967GRANT5,923$ 24,591$ 15,104$ -$ 1,306$ -$ -$
234$ 7,9471,180GRAYS HARBOR7,825$ 37,172$ 23,326$
-$ 1,429$ -$ -$ 173$ 12,2441,559ISLAND13,846$
82,262$ 55,025$ -$ 12,601$ -$ -$ 991$
13,6451,824JEFFERSON3,684$ 18,023$ 11,557$ -$ 669$
-$ -$ 291$ 5,505692KING118,429$ 666,274$ 247,420$
35,080$ 62,927$ -$ 66,626$ 11,591$
242,63019,276KITSAP38,633$ 209,090$ 137,044$ -$
27,545$ -$ -$ 1,899$ 42,6025,125KITTITAS2,987$
14,030$ 7,274$ -$ 2,347$ -$ -$ 181$
4,228527KLICKITAT2,433$ 12,455$ 6,084$ -$ 419$ -$
-$ 152$ 5,799590LEWIS8,625$ 50,222$ 26,284$ -$
1,897$ -$ -$ 343$ 21,6982,216LINCOLN1,337$ 7,040$
4,257$ -$ 290$ -$ -$ 48$ 2,445335MASON8,442$
42,087$ 27,064$ -$ 2,137$ -$ -$ 582$
12,3051,499OKANOGAN3,906$ 22,391$ 14,778$ -$ 435$
-$ -$ 209$ 6,9701,016PACIFIC2,801$ 14,547$ 7,907$ -
$ 226$ -$ -$ 111$ 6,303706PEND OREILLE1,583$
11,297$ 6,098$ -$ 126$ -$ -$ 47$
5,027543PIERCE90,360$ 664,183$ 385,581$ -$ 86,532$
-$ 140$ 6,825$ 185,10521,336SAN JUAN1,735$ 4,259$
2,892$ -$ 55$ -$ -$ 188$ 1,125194SKAGIT12,659$
54,698$ 33,742$ -$ 4,376$ -$ -$ 1,039$
15,5411,974SKAMANIA1,250$ 4,797$ 2,080$ -$ 180$ -$
-$ 32$ 2,505310SNOHOMISH57,612$ 240,608$ 131,547$
-$ 30,918$ -$ -$ 3,661$ 74,4827,965SPOKANE48,793$
285,254$ 146,954$ 3,252$ 23,714$ -$ 547$ 3,339$
107,44912,316STEVENS5,112$ 28,509$ 16,739$ -$ 540$
-$ -$ 263$ 10,9671,605THURSTON32,270$ 222,257$
142,182$ -$ 33,673$ -$ -$ 2,170$
44,2326,473WAHKIAKUM505$ 2,314$ 1,179$ -$ 77$ -$
-$ 10$ 1,048124WALLA WALLA4,256$ 61,177$ 16,203$
17,342$ 2,188$ -$ 436$ 267$
24,7411,854WHATCOM16,395$ 66,025$ 42,656$ -$
6,634$ -$ -$ 1,073$ 15,6622,441WHITMAN2,903$
11,416$ 4,867$ -$ 3,435$ -$ -$ 279$
2,835400YAKIMA15,535$ 72,313$ 40,890$ -$ 4,415$ -$
-$ 901$ 26,1073,417WASHINGTON (Totals)602,272$
3,384,110$ 1,788,537$ 55,674$ 343,793$ -$ 67,749$
41,915$ 1,086,440118,461CONG. DIST (01)49,051$
177,691$ 98,204$ -$ 20,029$ -$ -$ 3,892$
55,5676,452CONG. DIST (02)64,062$ 299,227$ 179,392$ -
$ 37,656$ -$ -$ 4,560$ 77,6209,207CONG. DIST
(03)67,106$ 370,632$ 178,558$ -$ 25,533$ -$ -$
3,039$ 163,50216,350CONG. DIST (04)47,391$ 208,547$
119,676$ -$ 14,113$ -$ -$ 2,656$ 72,10110,276CONG.
DIST (05)67,689$ 423,656$ 206,255$ 20,595$ 30,884$ -
$ 983$ 4,282$ 160,65818,148CONG. DIST (06)88,846$
524,263$ 326,809$ -$ 56,779$ -$ -$ 5,078$
135,59615,338CONG. DIST (07)41,086$ 332,319$ 96,912$
35,080$ 24,531$ -$ 66,626$ 4,360$ 104,8116,760CONG.
DIST (08)53,189$ 232,249$ 123,037$ -$ 27,461$ -$ -$
3,421$ 78,3299,217CONG. DIST (09)41,179$ 222,016$
102,269$ -$ 25,832$ -$ -$ 4,294$ 89,6227,562CONG.
DIST (10)82,671$ 593,510$ 357,426$ -$ 80,975$ -$
140$ 6,334$ 148,63519,151WASHINGTON (Totals)602,272$
3,384,111$ 1,788,537$ 55,674$ 343,793$ -$ 67,749$
41,915$ 1,086,440118,461Notes:* Veteran population
estimates, as of September 30, 2013, are produced by the VA
Office of the Actuary (VetPop 2011).# Prior to FY 08, "Loan
Guaranty" expenditures were included in the Education &
Vocational Rehabilitation and Employment (E&VRE) programs.
Currently, all "Loan Guaranty" expenditures are attributed to
Travis County, TX, where all Loan Guaranty payments are
processed. VA will continue to improve data collection for
future GDX reports to better distribute loan expenditures at the
state, county and congressional district levels.** Unique
patients are patients who received treatment at a VA health care
facility. Data are provided by the Allocation Resource Center
(ARC).Expenditure data sources: USASpending.gov for
Compensation & Pension (C&P) and Education and Vocational
Rehabilitation and Employment (EVRE) Benefits; Veterans
Benefits Administration Insurance Center for the Insurance
costs; the VA Financial Management System (FMS) for
Construction, Medical Research, General Operating Expenses,
and certain C&P and Readjustment data; and the Allocation
Resource Center (ARC) for Medical Care costs.1. Expenditures
are rounded to the nearest thousand dollars. For example, $500
to $1,000 are rounded to $1; $0 to $499 are rounded to $0; and
"$ -" = 0 or no expenditures.2. The Compensation & Pension
expenditures include dollars for the following programs:
veterans' compensation for service-connected disabilities;
dependency and indemnity compensation for service-connected
deaths; veterans' pension for nonservice-connected disabilities;
and burial and other benefits to veterans and their survivors.3.
Medical Care expenditures include dollars for medical services,
medical administration, facility maintenance, educational
support, research support, and other overhead items. Medical
Care expenditures do not include dollars for construction or
other non-medical support.4. Medical Care expenditures are
based on where patients live instead of where care is
delivered.5. A star symbol (*) in the Unique Patients column
denotes that there were less than 10 Unique Patients.
&"Arial,Bold"&11FY13 GEOGRAPHIC DISTRIBUTION OF
VA EXPENDITURES (GDX)
&8&P of &N
WIFY13 Summary of Expenditures by StateExpenditures in
$000sCounty/ Congressional DistrictVeteran Population*Total
ExpenditureCompensation & PensionConstructionEducation &
Vocational Rehabilitation/ EmploymentLoan Guaranty#General
Operating ExpensesInsurance & IndemnitiesMedical
CareUnique Patients**ADAMS2,180$ 17,093$ 5,362$ -$
142$ -$ -$ 210$ 11,3791,023ASHLAND1,314$ 7,327$
4,045$ -$ 311$ -$ -$ 141$ 2,830415BARRON3,724$
19,861$ 10,041$ -$ 703$ -$ -$ 330$
8,7881,309BAYFIELD1,701$ 7,860$ 3,950$ -$ 139$ -$
-$ 102$ 3,669536BROWN16,967$ 76,301$ 39,863$ -$
5,403$ -$ -$ 1,204$ 29,8315,271BUFFALO1,142$ 5,341$
3,140$ -$ 144$ -$ -$ 21$ 2,037404BURNETT1,764$
11,266$ 5,123$ -$ 143$ -$ -$ 35$
5,965659CALUMET2,962$ 11,908$ 4,394$ -$ 217$ -$ -
$ 252$ 7,0461,078CHIPPEWA5,284$ 27,309$ 12,216$ -$
1,179$ -$ -$ 387$ 13,5271,699CLARK1,985$ 14,782$
8,104$ -$ 325$ -$ -$ 70$ 6,283911COLUMBIA4,907$
25,794$ 10,259$ -$ 1,264$ -$ -$ 261$
14,0101,310CRAWFORD1,305$ 6,961$ 3,265$ -$ 204$ -
$ -$ 26$ 3,466420DANE28,566$ 155,441$ 52,168$
599$ 12,844$ -$ 3,003$ 3,901$
82,9276,686DODGE6,900$ 27,912$ 11,207$ -$ 1,495$ -$
-$ 297$ 14,9131,723DOOR2,598$ 10,744$ 5,128$ -$
336$ -$ -$ 323$ 4,957812DOUGLAS4,386$ 27,212$
14,283$ -$ 1,863$ -$ -$ 297$ 10,7681,361DUNN3,159$
16,466$ 8,192$ -$ 1,382$ -$ -$ 154$ 6,737749EAU
CLAIRE7,267$ 31,794$ 15,248$ -$ 2,733$ -$ -$ 778$
13,0351,780FLORENCE560$ 8,216$ 2,211$ -$ 68$ -$ -
$ 15$ 5,922278FOND DU LAC7,992$ 30,245$ 13,724$ -
$ 2,191$ -$ -$ 477$ 13,8542,030FOREST922$ 9,773$
4,796$ -$ 127$ -$ -$ 40$ 4,811487GRANT3,256$
18,596$ 6,951$ -$ 1,128$ -$ -$ 231$
10,286942GREEN2,585$ 13,068$ 5,389$ -$ 640$ -$ -$
191$ 6,848699GREEN LAKE1,493$ 8,656$ 3,778$ -$
271$ -$ -$ 220$ 4,387438IOWA1,379$ 7,525$ 3,048$
-$ 234$ -$ -$ 64$ 4,179437IRON796$ 4,758$ 1,926$
-$ 74$ -$ -$ 31$ 2,728325JACKSON1,923$ 14,254$
6,025$ -$ 369$ -$ -$ 133$ 7,727757JEFFERSON6,014$
28,460$ 11,522$ -$ 1,601$ -$ -$ 379$
14,9581,591JUNEAU2,317$ 18,512$ 7,271$ -$ 707$ -$
-$ 246$ 10,2881,026KENOSHA12,201$ 76,577$ 28,919$
-$ 6,772$ -$ -$ 1,038$ 39,8483,258KEWAUNEE1,437$
7,933$ 4,443$ -$ 230$ -$ -$ 104$ 3,156555LA
CROSSE9,036$ 51,346$ 24,915$ -$ 5,011$ -$ -$ 623$
20,7973,305LAFAYETTE989$ 4,915$ 2,267$ -$ 207$ -$
-$ 130$ 2,311303LANGLADE1,872$ 12,929$ 6,796$ -$
332$ -$ -$ 216$ 5,586743LINCOLN2,604$ 18,734$
10,511$ -$ 646$ -$ -$ 504$
7,0721,038MANITOWOC6,737$ 29,228$ 15,431$ -$
1,614$ -$ -$ 582$ 11,6012,084MARATHON10,390$
40,674$ 20,872$ -$ 2,492$ -$ -$ 638$
16,6733,066MARINETTE4,303$ 36,164$ 15,707$ -$ 742$
-$ -$ 147$ 19,5671,896MARQUETTE1,739$ 10,605$
4,777$ -$ 200$ -$ -$ 79$ 5,549565MENOMINEE356$
1,799$ 1,193$ -$ 104$ -$ -$ 1$
50177MILWAUKEE51,063$ 509,291$ 137,348$ 6,752$
26,180$ -$ 64,933$ 5,178$
268,90115,176MONROE5,074$ 117,772$ 24,558$ 4,872$
3,105$ -$ 2,056$ 242$ 82,9372,692OCONTO3,348$
19,255$ 9,510$ -$ 491$ -$ -$ 91$
9,1621,313ONEIDA3,682$ 22,222$ 11,690$ -$ 722$ -$
-$ 488$ 9,3221,455OUTAGAMIE12,666$ 54,541$ 27,694$
-$ 4,216$ -$ -$ 804$ 21,8283,671OZAUKEE6,184$
21,359$ 10,186$ -$ 1,657$ -$ -$ 777$
8,7391,054PEPIN528$ 3,918$ 1,809$ -$ 127$ -$ -$
47$ 1,935203PIERCE2,848$ 15,197$ 7,498$ -$ 1,303$ -
$ -$ 119$ 6,277616POLK3,741$ 23,070$ 9,930$ -$
712$ -$ -$ 126$ 12,3011,213PORTAGE4,777$ 24,346$
12,378$ -$ 1,739$ -$ -$ 477$ 9,7521,736PRICE1,499$
6,862$ 3,639$ -$ 230$ -$ -$ 52$
2,941486RACINE14,215$ 77,721$ 32,034$ -$ 4,676$ -$
-$ 1,087$ 39,9243,264RICHLAND1,352$ 8,999$ 3,230$
-$ 190$ -$ -$ 38$ 5,541498ROCK12,713$ 57,808$
23,454$ -$ 3,763$ -$ -$ 852$ 29,7393,257RUSK1,525$
7,542$ 4,275$ -$ 145$ -$ -$ 93$ 3,029448ST.
CROIX5,994$ 27,851$ 12,376$ -$ 2,305$ -$ -$ 263$
12,9071,371SAUK4,449$ 24,624$ 10,483$ -$ 763$ -$ -
$ 354$ 13,0241,453SAWYER1,891$ 11,663$ 5,754$ -$
379$ -$ -$ 120$ 5,410615SHAWANO3,396$ 18,527$
9,010$ -$ 697$ -$ -$ 204$
8,6171,280SHEBOYGAN8,671$ 27,265$ 12,502$ -$
1,937$ -$ -$ 683$ 12,1431,865TAYLOR1,461$ 6,723$
3,748$ -$ 238$ -$ -$ 150$
2,587426TREMPEALEAU2,087$ 12,361$ 6,468$ -$ 532$
-$ -$ 94$ 5,267751VERNON2,173$ 13,924$ 6,809$ -$
592$ -$ -$ 236$ 6,287827VILAS2,632$ 14,433$ 7,269$
-$ 256$ -$ -$ 262$ 6,646951WALWORTH7,111$
37,714$ 15,427$ -$ 2,215$ -$ -$ 933$
19,1391,716WASHBURN1,543$ 13,773$ 6,975$ -$ 408$
-$ -$ 53$ 6,337613WASHINGTON9,012$ 36,763$
15,855$ -$ 2,406$ -$ -$ 772$
17,7311,874WAUKESHA27,116$ 111,900$ 48,192$ -$
8,696$ -$ -$ 3,305$ 51,7074,856WAUPACA5,269$
40,716$ 23,751$ -$ 701$ -$ -$ 340$
15,9241,667WAUSHARA2,447$ 14,099$ 6,597$ -$ 202$
-$ -$ 67$ 7,233874WINNEBAGO13,639$ 51,725$
26,374$ -$ 3,954$ -$ -$ 883$ 20,5133,588WOOD6,301$
33,543$ 17,229$ -$ 1,555$ -$ -$ 330$
14,4292,516WISCONSIN (Totals)409,419$ 2,421,849$
972,511$ 12,224$ 133,679$ -$ 69,991$ 34,398$
1,199,045118,371CONG. DIST (01)51,739$ 268,110$
105,328$ -$ 18,779$ -$ -$ 4,467$ 139,53612,249CONG.
DIST (02)44,223$ 236,667$ 85,883$ 599$ 16,650$ -$
3,003$ 5,174$ 125,35811,316CONG. DIST (03)55,916$
394,048$ 156,626$ 4,872$ 20,566$ -$ 2,056$ 3,833$
206,09419,598CONG. DIST (04)34,456$ 413,743$ 107,124$
6,752$ 20,419$ -$ 64,933$ 3,341$ 211,17510,997CONG.
DIST (05)49,907$ 235,419$ 92,610$ -$ 15,760$ -$ -$
5,280$ 121,77010,768CONG. DIST (06)57,179$ 232,752$
108,756$ -$ 13,942$ -$ -$ 4,212$ 105,84314,665CONG.
DIST (07)61,794$ 359,972$ 173,822$ -$ 14,170$ -$ -$
4,579$ 167,40120,944CONG. DIST (08)54,206$ 281,138$
142,363$ -$ 13,393$ -$ -$ 3,513$
121,86917,834WISCONSIN (Totals)409,419$ 2,421,849$
972,511$ 12,224$ 133,679$ -$ 69,991$ 34,398$
1,199,045118,371Notes:* Veteran population estimates, as of
September 30, 2013, are produced by the VA Office of the
Actuary (VetPop 2011).# Prior to FY 08, "Loan Guaranty"
expenditures were included in the Education & Vocational
Rehabilitation and Employment (E&VRE) programs.
Currently, all "Loan Guaranty" expenditures are attributed to
Travis County, TX, where all Loan Guaranty payments are
processed. VA will continue to improve data collection for
future GDX reports to better distribute loan expenditures at the
state, county and congressional district levels.** Unique
patients are patients who received treatment at a VA health care
facility. Data are provided by the Allocation Resource Center
(ARC).Expenditure data sources: USASpending.gov for
Compensation & Pension (C&P) and Education and Vocational
Rehabilitation and Employment (EVRE) Benefits; Veterans
Benefits Administration Insurance Center for the Insurance
costs; the VA Financial Management System (FMS) for
Construction, Medical Research, General Operating Expenses,
and certain C&P and Readjustment data; and the Allocation
Resource Center (ARC) for Medical Care costs.1. Expenditures
are rounded to the nearest thousand dollars. For example, $500
to $1,000 are rounded to $1; $0 to $499 are rounded to $0; and
"$ -" = 0 or no expenditures.2. The Compensation & Pension
expenditures include dollars for the following programs:
veterans' compensation for service-connected disabilities;
dependency and indemnity compensation for service-connected
deaths; veterans' pension for nonservice-connected disabilities;
and burial and other benefits to veterans and their survivors.3.
Medical Care expenditures include dollars for medical services,
medical administration, facility maintenance, educational
support, research support, and other overhead items. Medical
Care expenditures do not include dollars for construction or
other non-medical support.4. Medical Care expenditures are
based on where patients live instead of where care is
delivered.5. A star symbol (*) in the Unique Patients column
denotes that there were less than 10 Unique Patients.
&"Arial,Bold"&11FY13 GEOGRAPHIC DISTRIBUTION OF
VA EXPENDITURES (GDX)
&8&P of &N
WVFY13 Summary of Expenditures by StateExpenditures in
$000sCounty/ Congressional DistrictVeteran Population*Total
ExpenditureCompensation & PensionConstructionEducation &
Vocational Rehabilitation/ EmploymentLoan Guaranty#General
Operating ExpensesInsurance & IndemnitiesMedical
CareUnique Patients**BARBOUR1,200$ 10,726$ 5,145$ -$
214$ -$ -$ 30$ 5,337546BERKELEY12,478$ 372,726$
43,645$ 1,888$ 5,046$ -$ 237,433$ 600$
84,1144,190BOONE1,883$ 12,512$ 8,023$ -$ 122$ -$ -
$ 56$ 4,310533BRAXTON1,479$ 12,860$ 5,621$ -$
144$ -$ -$ 119$ 6,976621BROOKE2,484$ 8,151$
3,837$ -$ 439$ -$ -$ 284$ 3,592513CABELL8,933$
93,208$ 31,295$ 13$ 3,189$ -$ 18,780$ 443$
39,4883,151CALHOUN694$ 4,987$ 3,036$ -$ 59$ -$ -$
26$ 1,867220CLAY756$ 7,911$ 4,075$ -$ 76$ -$ -$
72$ 3,688375DODDRIDGE672$ 4,510$ 1,946$ -$ 109$
-$ -$ 13$ 2,441255FAYETTE4,674$ 50,365$ 25,001$ -$
774$ -$ -$ 209$ 24,3811,804GILMER566$ 4,497$
2,009$ -$ 211$ -$ -$ 36$ 2,241257GRANT1,092$
5,744$ 3,082$ -$ 156$ -$ -$ 67$
2,438377GREENBRIER3,192$ 27,479$ 13,229$ -$ 602$
-$ -$ 142$ 13,5071,379HAMPSHIRE2,406$ 15,233$
6,706$ -$ 301$ -$ -$ 202$ 8,025706HANCOCK3,380$
13,088$ 6,316$ -$ 735$ -$ -$ 229$
5,807773HARDY1,257$ 7,131$ 3,891$ -$ 103$ -$ -$
56$ 3,080421HARRISON7,149$ 74,641$ 27,687$ 845$
1,892$ -$ 1,134$ 472$ 42,6113,248JACKSON2,695$
13,365$ 8,109$ -$ 495$ -$ -$ 88$
4,673638JEFFERSON5,952$ 48,409$ 16,441$ -$ 5,534$
-$ -$ 251$ 26,1831,558KANAWHA17,473$ 92,219$
49,179$ -$ 3,501$ -$ -$ 1,627$
37,9125,087LEWIS1,559$ 16,688$ 7,369$ -$ 272$ -$ -$
87$ 8,960807LINCOLN1,374$ 13,308$ 6,716$ -$ 169$
-$ -$ 94$ 6,329592LOGAN2,536$ 24,417$ 15,853$ -$
279$ -$ -$ 62$ 8,224918MCDOWELL1,311$ 15,027$
9,207$ -$ 44$ -$ -$ 3$ 5,773541MARION5,993$
43,728$ 20,802$ -$ 1,655$ -$ -$ 322$
20,9492,099MARSHALL3,216$ 11,504$ 5,789$ -$ 424$
-$ -$ 183$ 5,109762MASON2,280$ 13,842$ 7,292$ -$
291$ -$ -$ 126$ 6,133682MERCER5,855$ 60,119$
31,784$ -$ 1,431$ -$ -$ 344$
26,5602,120MINERAL3,235$ 18,553$ 9,969$ -$ 384$ -$
-$ 201$ 7,999983MINGO1,508$ 15,616$ 9,842$ -$
169$ -$ -$ 92$ 5,513618MONONGALIA6,820$ 32,582$
15,961$ -$ 4,782$ -$ -$ 445$
11,3941,522MONROE1,190$ 14,760$ 8,461$ -$ 296$ -$
-$ 15$ 5,988553MORGAN1,706$ 13,715$ 5,628$ -$
440$ -$ -$ 61$ 7,587585NICHOLAS2,204$ 22,230$
12,218$ -$ 334$ -$ -$ 38$ 9,639976OHIO4,079$
16,143$ 8,529$ -$ 792$ -$ -$ 352$
6,4701,105PENDLETON1,007$ 4,855$ 2,221$ -$ 196$ -$
-$ 34$ 2,405282PLEASANTS654$ 3,407$ 1,618$ -$
101$ -$ -$ 17$ 1,671177POCAHONTAS901$ 7,373$
3,611$ -$ 75$ -$ -$ 284$ 3,403333PRESTON3,166$
21,686$ 11,570$ -$ 633$ -$ -$ 125$
9,3591,026PUTNAM5,219$ 27,099$ 13,643$ -$ 1,106$ -
$ -$ 176$ 12,1751,373RALEIGH7,495$ 102,259$
39,440$ 3,486$ 1,575$ -$ 1,119$ 582$
56,0583,610RANDOLPH2,901$ 23,579$ 10,875$ -$ 648$
-$ -$ 86$ 11,9711,100RITCHIE992$ 8,695$ 4,353$ -$
100$ -$ -$ 11$ 4,232430ROANE1,433$ 9,169$ 4,992$
-$ 125$ -$ -$ 129$ 3,923480SUMMERS1,323$ 12,744$
6,955$ -$ 220$ -$ -$ 91$ 5,477537TAYLOR1,718$
12,645$ 5,466$ 88$ 309$ -$ 1,032$ 136$
5,613586TUCKER687$ 4,183$ 2,079$ -$ 89$ -$ -$
14$ 2,001269TYLER1,040$ 4,905$ 2,435$ -$ 28$ -$ -
$ 117$ 2,325237UPSHUR2,344$ 21,049$ 8,847$ -$
406$ -$ -$ 101$ 11,695971WAYNE3,283$ 44,750$
18,665$ 206$ 821$ -$ 2,062$ 79$
22,9171,695WEBSTER880$ 7,973$ 4,072$ -$ 53$ -$ -$
59$ 3,789361WETZEL1,629$ 9,094$ 4,904$ -$ 183$ -$
-$ 29$ 3,978466WIRT529$ 3,168$ 1,995$ -$ 147$ -$
-$ 3$ 1,023183WOOD9,103$ 44,533$ 26,508$ -$
1,890$ -$ -$ 313$ 15,8232,439WYOMING1,807$
16,097$ 7,750$ -$ 174$ -$ -$ 37$ 8,135663WEST
VIRGINIA (Totals)173,389$ 1,601,256$ 625,689$ 6,525$
44,341$ -$ 261,560$ 9,871$ 653,27058,733CONG. DIST
(01)58,873$ 353,060$ 170,089$ 855$ 15,132$ -$ 2,166$
3,386$ 161,43218,076CONG. DIST (02)61,888$ 694,155$
196,210$ 1,965$ 18,593$ -$ 237,433$ 3,724$
236,23119,593CONG. DIST (03)52,627$ 554,040$ 259,390$
3,705$ 10,617$ -$ 21,961$ 2,761$ 255,60721,064WEST
VIRGINIA (Totals)173,389$ 1,601,256$ 625,689$ 6,525$
44,341$ -$ 261,560$ 9,871$ 653,27058,733Notes:*
Veteran population estimates, as of September 30, 2013, are
produced by the VA Office of the Actuary (VetPop 2011).#
Prior to FY 08, "Loan Guaranty" expenditures were included in
the Education & Vocational Rehabilitation and Employment
(E&VRE) programs. Currently, all "Loan Guaranty"
expenditures are attributed to Travis County, TX, where all
Loan Guaranty payments are processed. VA will continue to
improve data collection for future GDX reports to better
distribute loan expenditures at the state, county and
congressional district levels.** Unique patients are patients who
received treatment at a VA health care facility. Data are
provided by the Allocation Resource Center (ARC).Expenditure
data sources: USASpending.gov for Compensation & Pension
(C&P) and Education and Vocational Rehabilitation and
Employment (EVRE) Benefits; Veterans Benefits
Administration Insurance Center for the Insurance costs; the VA
Financial Management System (FMS) for Construction, Medical
Research, General Operating Expenses, and certain C&P and
Readjustment data; and the Allocation Resource Center (ARC)
for Medical Care costs.1. Expenditures are rounded to the
nearest thousand dollars. For example, $500 to $1,000 are
rounded to $1; $0 to $499 are rounded to $0; and "$ -" = 0 or no
expenditures.2. The Compensation & Pension expenditures
include dollars for the following programs: veterans'
compensation for service-connected disabilities; dependency
and indemnity compensation for service-connected deaths;
veterans' pension for nonservice-connected disabilities; and
burial and other benefits to veterans and their survivors.3.
Medical Care expenditures include dollars for medical services,
medical administration, facility maintenance, educational
support, research support, and other overhead items. Medical
Care expenditures do not include dollars for construction or
other non-medical support.4. Medical Care expenditures are
based on where patients live instead of where care is
delivered.5. A star symbol (*) in the Unique Patients column
denotes that there were less than 10 Unique Patients.
&"Arial,Bold"&11FY13 GEOGRAPHIC DISTRIBUTION OF
VA EXPENDITURES (GDX)
&8&P of &N
WYFY13 Summary of Expenditures by StateExpenditures in
$000sCounty/ Congressional DistrictVeteran Population*Total
ExpenditureCompensation & PensionConstructionEducation &
Vocational Rehabilitation/ EmploymentLoan Guaranty#General
Operating ExpensesInsurance & IndemnitiesMedical
CareUnique Patients**ALBANY2,533$ 15,907$ 6,215$ -$
3,855$ -$ -$ 280$ 5,558688BIG HORN1,097$ 4,354$
1,821$ -$ 156$ -$ -$ 44$ 2,334390CAMPBELL3,774$
12,573$ 4,333$ -$ 556$ -$ -$ 173$
7,5121,047CARBON1,661$ 7,502$ 2,991$ -$ 154$ -$ -$
27$ 4,330395CONVERSE1,296$ 4,358$ 1,882$ -$ 152$
-$ -$ 25$ 2,300346CROOK669$ 4,086$ 1,104$ -$ 80$
-$ -$ 26$ 2,876282FREMONT3,567$ 17,576$ 7,867$ -$
497$ -$ -$ 472$ 8,7401,297GOSHEN1,215$ 7,536$
3,540$ -$ 235$ -$ -$ 50$ 3,709439HOT SPRINGS611$
3,037$ 1,238$ -$ 96$ -$ -$ 14$
1,689242JOHNSON848$ 8,921$ 2,686$ -$ 39$ -$ -$
73$ 6,124489LARAMIE15,056$ 111,083$ 45,812$ 1,157$
6,116$ -$ 968$ 849$ 56,1814,591LINCOLN1,385$
4,773$ 1,899$ -$ 138$ -$ -$ 45$
2,691389NATRONA6,691$ 26,693$ 12,039$ -$ 1,172$ -$
-$ 345$ 13,1362,093NIOBRARA251$ 1,242$ 474$ -$
21$ -$ -$ 10$ 73896PARK2,823$ 14,171$ 6,330$ -$
398$ -$ -$ 192$ 7,2511,021PLATTE1,060$ 6,478$
2,646$ -$ 221$ -$ -$ 40$ 3,572407SHERIDAN3,138$
59,008$ 11,472$ 6,107$ 810$ -$ 488$ 102$
40,0292,021SUBLETTE641$ 2,221$ 813$ -$ 96$ -$ -$
39$ 1,273176SWEETWATER3,952$ 14,401$ 5,854$ -$
401$ -$ -$ 182$ 7,9641,015TETON1,202$ 1,952$
1,065$ -$ 131$ -$ -$ 44$ 712173UINTA1,494$ 8,033$
3,011$ -$ 263$ -$ -$ 34$ 4,726425WASHAKIE811$
2,953$ 1,127$ -$ 92$ -$ -$ 6$ 1,727259WESTON742$
4,751$ 1,338$ -$ 71$ -$ -$ 60$ 3,283302WYOMING
(Totals)56,518$ 343,611$ 127,557$ 7,264$ 15,751$ -$
1,456$ 3,131$ 188,45318,583CONG. DIST (01)56,518$
343,611$ 127,557$ 7,264$ 15,751$ -$ 1,456$ 3,131$
188,45318,583WYOMING (Totals)56,518$ 343,611$
127,557$ 7,264$ 15,751$ -$ 1,456$ 3,131$
188,45318,583Notes:* Veteran population estimates, as of
September 30, 2013, are produced by the VA Office of the
Actuary (VetPop 2011).# Prior to FY 08, "Loan Guaranty"
expenditures were included in the Education & Vocational
Rehabilitation and Employment (E&VRE) programs.
Currently, all "Loan Guaranty" expenditures are attributed to
Travis County, TX, where all Loan Guaranty payments are
processed. VA will continue to improve data collection for
future GDX reports to better distribute loan expenditures at the
state, county and congressional district levels.** Unique
patients are patients who received treatment at a VA health care
facility. Data are provided by the Allocation Resource Center
(ARC).Expenditure data sources: USASpending.gov for
Compensation & Pension (C&P) and Education and Vocational
Rehabilitation and Employment (EVRE) Benefits; Veterans
Benefits Administration Insurance Center for the Insurance
costs; the VA Financial Management System (FMS) for
Construction, Medical Research, General Operating Expenses,
and certain C&P and Readjustment data; and the Allocation
Resource Center (ARC) for Medical Care costs.1. Expenditures
are rounded to the nearest thousand dollars. For example, $500
to $1,000 are rounded to $1; $0 to $499 are rounded to $0; and
"$ -" = 0 or no expenditures.2. The Compensation & Pension
expenditures include dollars for the following programs:
veterans' compensation for service-connected disabilities;
dependency and indemnity compensation for service-connected
deaths; veterans' pension for nonservice-connected disabilities;
and burial and other benefits to veterans and their survivors.3.
Medical Care expenditures include dollars for medical services,
medical administration, facility maintenance, educational
support, research support, and other overhead items. Medical
Care expenditures do not include dollars for construction or
other non-medical support.4. Medical Care expenditures are
based on where patients live instead of where care is
delivered.5. A star symbol (*) in the Unique Patients column
denotes that there were less than 10 Unique Patients.
&"Arial,Bold"&11FY13 GEOGRAPHIC DISTRIBUTION OF
VA EXPENDITURES (GDX)
&8&P of &N
PRFY13 Summary of Expenditures by StateExpenditures in
$000sCounty/ Congressional DistrictVeteran Population*Total
ExpenditureCompensation & PensionsConstructionEducation &
Vocational Rehabilitation/ EmploymentLoan Guaranty#General
Operating ExpensesInsurance & IndemnitiesMedical
CareUnique Patients**ADJUNTAS$ 5,995$ 3,904$ -$ 94$
-$ -$ 3$ 1,994282AGUADA$ 10,219$ 6,383$ -$ 599$
-$ -$ -$ 3,237474AGUADILLA$ 29,560$ 18,390$ -$
1,673$ -$ -$ 75$ 9,4221,195AGUAS BUENAS$ 7,404$
3,462$ -$ 344$ -$ -$ -$ 3,598312AIBONITO$ 13,229$
8,331$ -$ 339$ -$ -$ 37$ 4,522457ANASCO$ 6,017$
3,527$ -$ 163$ -$ -$ -$ 2,327383ARECIBO$ 31,922$
18,829$ -$ 866$ -$ -$ 37$ 12,1891,520ARROYO$
6,215$ 3,163$ -$ 341$ -$ -$ -$
2,710314BARCELONETA$ 6,658$ 3,909$ -$ 257$ -$ -$
9$ 2,483318BARRANQUITAS$ 12,775$ 8,487$ -$ 296$
-$ -$ 32$ 3,960380BAYAMON$ 110,870$ 52,171$
1,706$ 2,997$ -$ 2,300$ 222$ 51,4743,970CABO ROJO$
17,532$ 9,407$ -$ 538$ -$ -$ 13$
7,5751,001CAGUAS$ 62,586$ 29,325$ -$ 2,055$ -$ -$
78$ 31,1282,426CAMUY$ 9,254$ 5,329$ -$ 331$ -$ -
$ 2$ 3,592434CANOVANAS$ 14,637$ 7,386$ -$ 479$
-$ -$ 10$ 6,762524CAROLINA$ 81,100$ 35,033$ -$
1,884$ -$ -$ 175$ 44,0083,154CATANO$ 6,499$
3,015$ -$ 209$ -$ -$ 1$ 3,274277CAYEY$ 30,460$
18,550$ -$ 772$ -$ -$ 36$ 11,102972CEIBA$ 7,686$
3,803$ -$ 310$ -$ -$ 210$ 3,363339CIALES$ 5,877$
3,827$ -$ 100$ -$ -$ -$ 1,950219CIDRA$ 12,825$
6,486$ -$ 498$ -$ -$ 7$ 5,834538COAMO$ 19,459$
11,416$ -$ 859$ -$ -$ 7$ 7,178877COMERIO$ 6,395$
3,316$ -$ 116$ -$ -$ -$ 2,963234COROZAL$ 11,991$
6,035$ -$ 362$ -$ -$ 12$ 5,582414CULEBRA$ 869$
273$ -$ 13$ -$ -$ 3$ 57930DORADO$ 14,874$
5,804$ -$ 495$ -$ -$ 5$ 8,570580FAJARDO$ 21,371$
9,437$ -$ 589$ -$ -$ 22$ 11,324775FLORIDA$ 3,355$
2,038$ -$ 128$ -$ -$ -$ 1,189143GUANICA$ 5,583$
3,133$ -$ 260$ -$ -$ 8$ 2,182366GUAYAMA$
14,730$ 8,439$ -$ 595$ -$ -$ 3$
5,692715GUAYANILLA$ 8,123$ 4,739$ -$ 369$ -$ -$
25$ 2,991442GUAYNABO$ 35,455$ 15,211$ -$ 1,531$
-$ -$ 120$ 18,5921,377GURABO$ 14,860$ 6,539$ -$
631$ -$ -$ 9$ 7,681624HATILLO$ 10,283$ 5,167$ -$
357$ -$ -$ 2$ 4,757538HORMIGUEROS$ 6,371$
3,744$ -$ 233$ -$ -$ 1$ 2,392399HUMACAO$
19,499$ 10,364$ -$ 537$ -$ -$ 41$
8,558770ISABELA$ 17,694$ 10,802$ -$ 701$ -$ -$
29$ 6,162773JAYUYA$ 4,657$ 3,034$ -$ 104$ -$ -$
1$ 1,517188JUANA DIAZ$ 17,679$ 9,226$ -$ 893$ -$
-$ 18$ 7,5421,059JUNCOS$ 11,682$ 6,171$ -$ 476$ -
$ -$ 32$ 5,003490LAJAS$ 9,132$ 5,504$ -$ 324$ -$
-$ 1$ 3,302504LARES$ 7,664$ 4,687$ -$ 270$ -$ -$
10$ 2,697337LAS MARIAS$ 1,185$ 717$ -$ 73$ -$ -$
-$ 39596LAS PIEDRAS$ 11,547$ 5,986$ -$ 344$ -$ -
$ -$ 5,217453LOIZA$ 6,631$ 2,631$ -$ 70$ -$ -$
6$ 3,924298LUQUILLO$ 9,340$ 4,597$ -$ 312$ -$ -$
4$ 4,426386MANATI$ 12,550$ 7,909$ -$ 302$ -$ -$
11$ 4,328512MARICAO$ 906$ 612$ -$ 68$ -$ -$ -$
22762MAUNABO$ 4,597$ 2,524$ -$ 57$ -$ -$ -$
2,016155MAYAGUEZ$ 25,186$ 14,114$ -$ 960$ -$ -$
31$ 10,0821,528MOCA$ 8,814$ 5,121$ -$ 541$ -$ -$
12$ 3,140436MOROVIS$ 7,414$ 4,292$ -$ 202$ -$ -$
1$ 2,919309NAGUABO$ 8,904$ 4,394$ -$ 320$ -$ -$
1$ 4,190403NARANJITO$ 12,391$ 6,273$ -$ 143$ -$
-$ 1$ 5,973346OROCOVIS$ 7,056$ 4,324$ -$ 175$ -$
-$ 2$ 2,555257PATILLAS$ 5,727$ 3,631$ -$ 208$ -$
-$ 3$ 1,884249PENUELAS$ 9,019$ 5,156$ -$ 291$ -$
-$ 27$ 3,544455PONCE$ 64,813$ 37,511$ -$ 3,128$ -
$ -$ 85$ 24,0903,784QUEBRADILLAS$ 10,192$ 6,052$
-$ 435$ -$ -$ -$ 3,705431RINCON$ 4,402$ 2,484$ -$
174$ -$ -$ -$ 1,744236RIO GRANDE$ 19,149$ 8,659$
-$ 675$ -$ -$ 6$ 9,808796SABANA GRANDE$ 10,067$
6,327$ -$ 545$ -$ -$ 10$ 3,185574SALINAS$ 11,686$
6,703$ -$ 381$ -$ -$ 60$ 4,541571SAN GERMAN$
11,975$ 6,863$ -$ 639$ -$ -$ 79$ 4,395699SAN
JUAN$ 175,478$ 64,218$ 6,050$ 4,792$ -$ 17,612$
676$ 82,1305,373SAN LORENZO$ 11,532$ 5,473$ -$
479$ -$ -$ 16$ 5,564500SAN SEBASTIAN$ 10,966$
6,420$ -$ 368$ -$ -$ 7$ 4,171547SANTA ISABEL$
7,274$ 4,303$ -$ 415$ -$ -$ 7$ 2,549429TOA ALTA$
23,122$ 10,600$ -$ 1,078$ -$ -$ 16$ 11,429919TOA
BAJA$ 41,270$ 20,045$ -$ 1,225$ -$ -$ 63$
19,9371,597TRUJILLO ALTO$ 25,052$ 9,865$ -$ 552$ -
$ -$ 25$ 14,610973UTUADO$ 11,029$ 5,781$ -$ 403$
-$ -$ 3$ 4,842458VEGA ALTA$ 12,491$ 5,884$ -$
357$ -$ -$ 23$ 6,227505VEGA BAJA$ 19,782$ 10,998$
-$ 533$ -$ -$ 16$ 8,235790VIEQUES$ 4,228$ 2,047$
-$ 68$ -$ -$ -$ 2,114226VILLALBA$ 6,530$ 4,047$
-$ 299$ -$ -$ -$ 2,183344YABUCOA$ 9,480$ 4,979$
-$ 272$ -$ -$ -$ 4,230378YAUCO$ 14,949$ 8,546$ -
$ 669$ -$ -$ 6$ 5,728810Puerto Rico Totals99,928$
1,387,777$ 697,879$ 7,756$ 46,541$ -$ 19,912$ 2,496$
613,19358,009CONG. DIST (01)99,928$ 1,387,777$
697,879$ 7,756$ 46,541$ -$ 19,912$ 2,496$
613,19358,009Puerto Rico (Totals)99,928$ 1,387,777$
697,879$ 7,756$ 46,541$ -$ 19,912$ 2,496$
613,19358,009Notes:* Veteran population estimates, as of
September 30, 2013, are produced by the VA Office of the
Actuary (VetPop 2011).# Prior to FY 08, "Loan Guaranty"
expenditures were included in the Education & Vocational
Rehabilitation and Employment (E&VRE) programs.
Currently, all "Loan Guaranty" expenditures are attributed to
Travis County, TX, where all Loan Guaranty payments are
processed. VA will continue to improve data collection for
future GDX reports to better distribute loan expenditures at the
state, county and congressional district levels.** Unique
patients are patients who received treatment at a VA health care
facility. Data are provided by the Allocation Resource Center
(ARC).Expenditure data sources: USASpending.gov for
Compensation & Pension (C&P) and Education and Vocational
Rehabilitation and Employment (EVRE) Benefits; Veterans
Benefits Administration Insurance Center for the Insurance
costs; the VA Financial Management System (FMS) for
Construction, Medical Research, General Operating Expenses,
and certain C&P and Readjustment data; and the Allocation
Resource Center (ARC) for Medical Care costs.1. Expenditures
are rounded to the nearest thousand dollars. For example, $500
to $1,000 are rounded to $1; $0 to $499 are rounded to $0; and
"$ -" = 0 or no expenditures.2. The Compensation & Pension
expenditures include dollars for the following programs:
veterans' compensation for service-connected disabilities;
dependency and indemnity compensation for service-connected
deaths; veterans' pension for nonservice-connected disabilities;
and burial and other benefits to veterans and their survivors.3.
Medical Care expenditures include dollars for medical services,
medical administration, facility maintenance, educational
support, research support, and other overhead items. Medical
Care expenditures do not include dollars for construction or
other non-medical support.4. Medical Care expenditures are
based on where patients live instead of where care is
delivered.5. A star symbol (*) in the Unique Patients column
denotes that there were less than 10 Unique Patients.
&"Arial,Bold"&11FY13 GEOGRAPHIC DISTRIBUTION OF
VA EXPENDITURES (GDX)
&8&P of &N
GUFY13 Summary of Expenditures by StateExpenditures in
$000sCounty/ Congressional DistrictVeteran Population*Total
ExpenditureCompensation & PensionConstructionEducation &
Vocational Rehabilitation/ EmploymentLoan Guaranty#General
Operating ExpensesInsurance & IndemnitiesMedical
CareUnique Patients**Guam9,055$ 66,330$ 46,193$ -$
10,629$ -$ -$ 495$9,012Guam (Totals)9,055$ 66,330$
46,193$ -$ 10,629$ -$ -$ 495$ 9,012Notes:* Veteran
population estimates, as of September 30, 2013, are produced by
the VA Office of the Actuary (VetPop 2011).# Prior to FY 08,
"Loan Guaranty" expenditures were included in the Education &
Vocational Rehabilitation and Employment (E&VRE) programs.
Currently, all "Loan Guaranty" expenditures are attributed to
Travis County, TX, where all Loan Guaranty payments are
processed. VA will continue to improve data collection for
future GDX reports to better distribute loan expenditures at the
state, county and congressional district levels.** Unique
patients are patients who received treatment at a VA health care
facility. Data are provided by the Allocation Resource Center
(ARC).Expenditure data sources: USASpending.gov for
Compensation & Pension (C&P) and Education and Vocational
Rehabilitation and Employment (EVRE) Benefits; Veterans
Benefits Administration Insurance Center for the Insurance
costs; the VA Financial Management System (FMS) for
Construction, Medical Research, General Operating Expenses,
and certain C&P and Readjustment data; and the Allocation
Resource Center (ARC) for Medical Care costs.1. Expenditures
are rounded to the nearest thousand dollars. For example, $500
to $1,000 are rounded to $1; $0 to $499 are rounded to $0; and
"$ -" = 0 or no expenditures.2. The Compensation & Pension
expenditures include dollars for the following programs:
veterans' compensation for service-connected disabilities;
dependency and indemnity compensation for service-connected
deaths; veterans' pension for nonservice-connected disabilities;
and burial and other benefits to veterans and their survivors.3.
Medical Care expenditures include dollars for medical services,
medical administration, facility maintenance, educational
support, research support, and other overhead items. Medical
Care expenditures do not include dollars for construction or
other non-medical support.4. Medical Care expenditures are
based on where patients live instead of where care is
delivered.5. A star symbol (*) in the Unique Patients column
denotes that there were less than 10 Unique Patients.
&"Arial,Bold"&11FY13 GEOGRAPHIC DISTRIBUTION OF
VA EXPENDITURES (GDX)
&8&P of &N
Data DescriptionIntroductionEach Fiscal Year (FY), the
Department of Veterans Affairs’ (VA’s) Office of Policy and
Planning (OPP) publishes the Geographic Distribution of VA
Expenditures (GDX) report. This report provides the estimated
dollar expenditures for major VA programs at the state, county,
and Congressional District levels. Expenditure data are grouped
by the following categories: Compensation and Pension,
Education and Vocational Rehabilitation and Employment,
Insurance and Indemnities, Construction, General Operating
Expenses, Loan Guaranty, and Medical Care. Veteran
population estimates at the state, county and Congressional
District level and the number of unique patients who used VA
healthcare services are also included in the report. The
following information provides a brief description of the data
included in the report, the methods used for data collection, and
the sources of the data.Veteran PopulationAs of FY 2012, the
estimated Veteran population data by state and county are based
on the VA VetPop2011 model. This model is VA’s source for
official estimates and projections of the Veteran population.
Compensation and Pension The Compensation and Pension
(C&P) category includes expenditures for the following
categories: compensation payments, pension payments,
Dependency and Indemnity Compensation, and burial
allowances. Most expenditures reported in this category reflect
monthly payments made to individuals. Retroactive payments
and one-time payments are also included. Data is obtained from
USASpending.gov. Education and Vocational Rehabilitation and
Employment Education and Vocational Rehabilitation and
Employment (E&VRE) are separate programs, but are combined
into one category for display purposes in GDX. Expenditures in
this category include: automobile and adaptive equipment,
specially adapted housing, Survivors’ and Dependents’
Educational Assistance (Chapter 35), Vocational Rehabilitation
for Disabled Veterans (Chapter 31), Post-Vietnam Era Veterans’
Educational Assistance (Chapter 32), Montgomery G.I. Bill for
Selected Reserves (Chapter 1606), Reserve Educational
Assistance Program (Chapter 1607), Montgomery G.I. Bill
(Chapter 30), and Post-9/11 Veterans Educational Assistance
(Chapter 33). Expenditure data for E&VRE are also obtained
from USASpending.gov. Insurance and Indemnities The data
reported for this category are provided by the VA Regional
Office and Insurance Center (RO&IC) in Philadelphia,
Pennsylvania. This category consists of VA expenditures for
death claims, matured endowments, dividends, cash surrender
payments, total disability income provision payments, and total
and permanent disability benefits payments. It includes
Veterans Group Life Insurance, National Service Life
Insurance, Service Disabled Veterans Life Insurance, United
States Government Life Insurance, Veterans Reopened
Insurance, and Veterans Special Life Insurance. It does not
include Traumatic Injury Protection Under Servicemembers'
Group Life Insurance, Family Servicemembers' Group Life
Insurance, or Servicemembers' Group Life Insurance. The
RO&IC provides OPP with monthly extracts of payments to
recipients by zip code for the purposes of aggregating these
monthly payments by state, county, and Congressional
District.Construction and Related Costs The Construction
expenditures category includes funding for Major Projects,
Minor Projects, Grants for Construction of State Extended Care
Facilities, and Grants for Construction of State Veterans
Cemeteries. The source of the Construction data is the
Financial Management System (FMS).General Operating
Expenses General Operating Expenses (GOE) represent the
costs necessary to provide administration and oversight for the
benefits provided by VA. This includes costs for overhead and
human resources. This category does not include payments
made directly to beneficiaries. The source of the GOE data is
FMS.Loan GuarantyPrior to FY 2008, Loan Guaranty
expenditures were included in the E&VRE category. Currently,
all Loan Guaranty expenditures are attributed to Travis, Texas,
where all payments are processed. VA will continue to improve
data collection for future GDX reports to better distribute loan
expenditures at the state, county and Congressional District
levels.Medical Expenditures Medical expenditures data come
from both the Allocation Resource Center (ARC) and FMS. The
specific programs reported for this category are: medical care,
General Post Fund, medical and prosthetic research, and
miscellaneous accounts.Unique Patients The count of unique
patients is based on the home residence of the patient. The
number of patients, along with associated county and
Congressional District codes, are provided by the ARC.
Movies Sample Presentation
SCM 315 – Business Decision Models
Data
Data for these visualizations are from two sources:
Data comprises all major motion picture releases from 2011 and
most of 2012
Box Office Mojo
http://www.boxofficemojo.com/
Contains all movie release data including:
Theaters
Opening gross
Total gross
Any much more …
IMDB
http://www.imdb.com/
Obtained top three billed starts for each film
Google
Obtained ‘Bacon Number’ for each actor (number of movie
connections between the actor and Kevin Bacon)
Opening Gross vs. Total Gross
Visualization:
Each data point is a different movie
Each movie is colored based on the MPAA rating of the film
The x-axis denotes the total box office gross of the film
The y-axis denotes the opening weekend box office gross of the
film
The trend lines are separate for each MPAA rating
Reasoning:
This graph was created to determine variability between a films
opening weekend gross vs. its total gross
They are expected to be correlated, but it will be interesting to
see if there are outliers
The movies are color coded by MPAA rating to determine if
that has any impact on the correlation
Opening Gross vs. Total Gross
Conclusions:
It is clearly evident that a movie’s total gross is highly
correlated with its opening gross (i.e. if it makes more initially
it will make more over its life)
Only a small subset of movies make over $100 million in total
gross
Due to the higher slope, PG-13 movies tend to make more of its
total earning in its opening week/weekend
This is not overly surprising as this is driven by many high
profile movies (Avengers, Pirates of the Caribbean, etc.) which
are more likely to be seen in the opening week than less high
profile movies
It appears that children's movies have the longest lifespans as
they tend to make the lowest percentage on their opening
weekend
Examples are Puss in Boots, Brave, Kung Fu Panda 2
Average Gross by Date Including 3D Percentages
Visualization:
Each bar represents the count of the number of films released
that month (height shown on the left y-axis)
Each bar is colored based on the percentage of releases that
month which were in 3D
The line shows the average box office gross per film release
during that month (height shown on the right y-axis)
The reference lines show the yearly average box office gross for
each film
Reasoning:
This graph was made to primarily observe if summer movies
tend to make more
These months tend to have the blockbuster movies
The bars were added to provide clarity on the scale of films
released each month
The bars were color coded to see if higher percentage of 3D
movies are also released in the summer
Average Gross by Date Including 3D Percentages
Conclusions:
From 2011 to 2012, the average gross per film increased by $10
million
Typically, the highest average movie grosses take place in the
summer (May, June, and July).
These months also have the highest percentage of 3D releases in
general (coinciding with the big blockbuster action movies)
The summer months also tend to have the lowest number of
releases
This trend is not very consistent, more data would be needed to
see if it holds up
Top 30 Actors and Actresses Based on % Sequels
Top 30 Actors and Actresses based on % Sequels
Visualization:
Each bubble is one of the top 30 top-billed actors or actresses
based on the total gross of their movies
The larger the bubble, the more that actors/actresses movies
grossed (as given by the label)
The bubbles are shaded based on the percentage of their movies
which were sequels
Reasoning:
The chart was made to simply observe which actors/actresses
are in the highest grossing movies
The shading was added to observe how frequently the top
grossing actors are tied with franchise movies
Top 30 Actors and Actresses based on % Sequels
Conclusions:
You can see the top actors/actresses are all associated with
sequels of various types:
Robert Downey Jr.: Avengers/Iron Man
Christian Bale: Batman
Johnny Depp: Pirates of the Caribbean
Daniel Radcliffe: Harry Potter
Nearly none of the actors/actresses associated with sequels are
women
Women do not appear to earn top billing in franchise films
(minus one outlier of Jennifer Lawrence)
Other than top performers, most of the top 30 are all around the
$200 million
Movie Gross vs. Budget by Movie Type
Visualization:
Each dot on the graph represents a different movie
The x-axis represents the genre of movie
The left y-axis represents the total gross of the movie
A box and whisker plot is overlaid to determine the quartiles for
each genre of movie
The bars represent the median movie budget of that genre of
movie (right y-axis)
Reasoning:
The main reason for this graph is to compare the median budget
to the median gross as well as to compare if this relationship
varies based on the genre
Movie Gross vs. Budget by Movie Type
Conclusions:
Adventure movies have the highest statistical measures
Highest median, 75% quartile and max
However adventure movies also have the highest median budget
The median budget exceeds the median gross implying
adventure movies can be risky
The two riskiest categories (Adventure and Action) also have
the highest earning potential.
Least risky movies are Romantic Comedies and Musicals as
their median budget is less than the 25% quartile of their
overall gross
However the upside of these movies is minimal
Distributors Gross by Genre/Rating and Season Releases
Distributors Gross by Genre/ Rating and Season Releases
Visualization:
This dashboard features two graphs
Graph 1:
Shows total distributor gross as the height of each bar
The bar is split by the genre of the film
Graph 2:
Shows the percentage of movies released during each season
based on genre
Both graphs are controlled by the filter which allows control for
the MPAA rating of the movies included in both graphs
Reasoning:
This dashboard will interactively allow for the inspection of
different distributors based on MPAA rating to see if there is a
correlation between different distributors and different types of
movies.
The second graph will permit observations regarding when
different types of movies are released and if they follow
traditional assumptions
Distributors Gross by Genre/ Rating (All) and Season Releases
Distributors Gross by Genre/ Rating (G) and Season Releases
Distributors Gross by Genre/ Rating (PG) and Season Releases
Distributors Gross by Genre/ Rating (PG-13) and Season
Releases
Distributors Gross by Genre/ Rating (R) and Season Releases
Distributors Gross by Genre/ Rating and Season Releases
Conclusions:
Overall, the WB was the highest grossing distributor fueled
primarily by their PG13 movies
They also have the highest total grossing R movies as well by
are closely matched with Universal
Paramount has the highest grossing PG movies while the WB is
only 6th on the list
PG movies are heavily dominated by Adventure type movies
while R movies are dominated by Comedy movies
There are only a small handful of G movies released every year
In general, Adventure movies (the blockbusters) are released
during the Spring and Summer periods
Drama movies are most prevalent during the Fall and Holiday
seasons which coincide the typical Oscar release dates for films
$0M$50M$100M$150M$200M$250M$300M$350M$400M$450
M$500M$550M$600M$650M
Gross
$0M
$20M
$40M
$60M
$80M
$100M
$120M
$140M
$160M
$180M
$200M
$220M
O
p
e
n
i
n
g
G
r
o
s
s
Cars 2
Brave
Dr. Seuss' The Lorax
Kung Fu Panda 2
Puss in Boots
Captain America: The First Avenger
Cowboys & Aliens
Green Lantern
Harry Potter and the Deathly Hallows: Part II
MIB 3
Mission: Impossible - Ghost Protocol
Pirates of the Caribbean: On Stranger Tides
Sherlock Holmes: A Game of Shadows
The Amazing Spider-Man
The Avengers
The Dark Knight Rises
The Help
The Hunger Games
The Twilight Saga: Breaking Dawn, Part 1
Thor
Transformers: Dark of the Moon
Paranormal Activity 3
MPAA Rate
G
PG
PG-13
R
Wide Release Date
20112012
F
e
b
r
u
a
r
y
2
0
1
1
M
a
r
c
h
2
0
1
1
A
p
r
i
l
2
0
1
1
M
a
y
2
0
1
1
J
u
n
e
2
0
1
1
J
u
l
y
2
0
1
1
A
u
g
u
s
t
2
0
1
1
S
e
p
t
e
m
b
e
r
2
0
.
.
O
c
t
o
b
e
r
2
0
1
1
N
o
v
e
m
b
e
r
2
0
1
1
D
e
c
e
m
b
e
r
2
0
1
1
J
a
n
u
a
r
y
2
0
1
2
F
e
b
r
u
a
r
y
2
0
1
2
M
a
r
c
h
2
0
1
2
A
p
r
i
l
2
0
1
2
M
a
y
2
0
1
2
J
u
n
e
2
0
1
2
J
u
l
y
2
0
1
2
A
u
g
u
s
t
2
0
1
2
0
2
4
6
8
10
12
14
16
18
N
u
m
b
e
r
o
f
M
o
v
i
e
s
$0M
$20M
$40M
$60M
$80M
$100M
$120M
$140M
$160M
A
v
g
.
G
r
o
s
s
30.0%
12.5%
50.0%37.5%
18.2%
23.1%
12.5%
50.0%
15.4%
8.3%
9.1%
Average Yearly Gross
18.2%
33.3%
10.0%
25.0%
30.8%
50.0%
7.7%
7.1%
Average Yearly Gross
7.1%50.0%
Avg. 3D Percentage
Measure Names
Avg. Gross
Zac Efron
$274M
Will Smith
$179M
Vin Diesel
$210M
Tom Cruise
$209M
Shia LaBeouf
$352M
Robert pattinson
$340M
Robert Downey Jr.
$809M
Ray Romano
$158M
Owen Wilson
$244M
Matt Damon
$214M
Mark Wahlberg
$284M
Kristen Wiig
$169M
Kelly Macdonald
$234M
Jonah Hill
$169M
Johnny Depp
$457M
Jesse Eisenberg
$181M
Jennifer Lawrence
$408M
James McAvoy
$193M
James Franco
$195M
Jack Black
$165M
Emma Stone
$170M
Daniel Radcliffe
$435M
Daniel Craig
$224M
Christian Bale
$442M
Chris Hemsworth
$181M
Chris Evans
$177M
Bradley Cooper
$344M
Ben Stiller
$250M
Andrew Garfield
$261M
Adam Sandler
$214M
0.0%100.0%
Avg. Sequel Status
Genre
AdventureActionThriller/SuspenseComedyRomantic
ComedyDramaHorrorMusical
$0M
$100M
$200M
$300M
$400M
$500M
$600M
$700M
G
r
o
s
s
$0M
$100M
$200M
$300M
$400M
$500M
$600M
$700M
M
e
d
i
a
n
B
u
d
g
e
t
Distributor
W
B
P
a
r
U
n
i
v
e
r
s
a
l
S
o
n
y
F
o
x
W
a
l
t
D
i
s
n
e
y
L
i
o
n
s
g
a
t
e
S
u
m
m
i
t
E
n
t
e
r
.
.
S
c
r
e
e
n
G
e
m
s
D
W
R
e
l
a
t
i
v
i
t
y
M
e
.
.
F
o
c
u
s
T
r
i
S
t
a
r
P
i
c
W
e
i
n
s
t
e
i
n
C
o
.
.
F
o
x
S
e
a
r
c
h
l
i
g
h
t
F
i
l
m
D
i
s
t
r
i
c
t
C
B
S
D
i
m
e
n
s
i
o
n
F
i
l
m
s
O
p
e
n
R
o
a
d
F
i
l
m
s
$0.0B
$0.5B
$1.0B
$1.5B
$2.0B
$2.5B
$3.0B
G
r
o
s
s
WinterSpringSummerFallHoliday
23.69%
17.29%
42.59%
25.34%
17.67%
13.19%
29.21%
22.44%
25.87%
13.04%
13.19%
10.02%
19.51%
25.63%
11.62%
29.34%
23.41%
13.45%
25.74%
5.09%
9.80%
8.57%
8.91%
3.09%
2.43%
1.29%
5.26%
0.67%
9.98%
Genre
Action
Adventure
Comedy
Drama
Horror
Musical
Romantic Comedy
Thriller/Suspense
MPAA Rate
Null
G
PG
PG-13
R
Distributor
FoxWaltDisneyPar
$0.0B
G
r
o
s
s
WinterSpringSummerHoliday
100.0%100.0%100.0%100.0%
Genre
Adventure
Comedy
Musical
MPAA Rate
Null
G
PG
PG-13
R
Distributor
ParFoxWaltDisneySonyUniversalWBRelativityMediaFocusTriSt
arPicDimension
Films
WeinsteinCom..
$0.0B
$0.5B
G
r
o
s
s
WinterSpringSummerFallHoliday
16.25%
83.75%
26.79%
57.88%
86.86%
31.03%
17.09%
48.80%
15.11%
32.54%
52.35%
9.86%
5.46%
9.01%
4.13%
3.08%
Genre
Adventure
Comedy
Drama
Musical
Romantic Comedy
Thriller/Suspense
MPAA Rate
Null
G
PG
PG-13
R
Distributor
W
B
P
a
r
S
o
n
y
W
a
l
t
D
i
s
n
e
y
U
n
i
v
e
r
s
a
l
L
i
o
n
s
g
a
t
e
F
o
x
S
u
m
m
i
t
E
n
t
e
r
.
.
D
W
S
c
r
e
e
n
G
e
m
s
T
r
i
S
t
a
r
P
i
c
F
o
c
u
s
C
B
S
W
e
i
n
s
t
e
i
n
C
o
.
.
F
o
x
S
e
a
r
c
h
l
i
g
h
t
R
e
l
a
t
i
v
i
t
y
M
e
.
.
D
i
m
e
n
s
i
o
n
F
i
l
m
s
F
i
l
m
D
i
s
t
r
i
c
t
$0.0B
$0.5B
$1.0B
$1.5B
G
r
o
s
s
WinterSpringSummerFallHoliday
22.71%
24.39%
13.95%
18.96%
40.48%
17.92%
10.99%
20.58%
42.41%
41.95%
33.23%
40.89%
39.63%
45.83%
2.67%2.85%
9.73%
6.42%
3.61%
2.93%
6.37%
5.26%
8.90%
0.98%
8.68%
5.98%
8.56%
Genre
Action
Adventure
Comedy
Drama
Horror
Musical
Romantic Comedy
Thriller/Suspense
MPAA Rate
Null
G
PG
PG-13
R
Distributor
W
B
U
n
i
v
e
r
s
a
l
S
o
n
y
P
a
r
F
o
x
L
i
o
n
s
g
a
t
e
R
e
l
a
t
i
v
i
t
y
M
e
.
.
S
c
r
e
e
n
G
e
m
s
F
i
l
m
D
i
s
t
r
i
c
t
F
o
x
S
e
a
r
c
h
l
i
g
h
t
O
p
e
n
R
o
a
d
F
i
l
m
s
W
e
i
n
s
t
e
i
n
C
o
.
.
F
o
c
u
s
S
u
m
m
i
t
E
n
t
e
r
.
.
D
i
m
e
n
s
i
o
n
F
i
l
m
s
C
B
S
$0.0B
$0.5B
G
r
o
s
s
WinterSpringSummerFallHoliday
32.13%
10.28%
34.73%
18.92%
15.02%
51.48%
12.38%
78.00%
26.17%
12.18%27.43%
26.48%
25.48%
33.43%
20.34%
20.76%
7.75%
2.67%
3.38%
5.86%
8.72%
3.22%
5.79%
Genre
Action
Adventure
Comedy
Drama
Horror
Musical
Romantic Comedy
Thriller/Suspense
MPAA Rate
Null
G
PG
PG-13
R
Chats idea:
1. State level expenditures: timeline 2000-2013 totals and how
the increased & changed over time
0. Map for the states by county with highest veteran rate.
Comparing unique patient
0. GOE & Construction (Dashboard)
0. AZ chart, compares other areas with same population
0. Progression of time???? Increase in veterans etc.
Data link:
https://catalog.data.gov/dataset/geographic-distribution-of-va-
expenditures-fy2013
data descriptions and information
Unique patient: “A unique patient means that even if a patient is
seen multiple times during the EHR reporting period they are
only counted once."
GOE: n expense incurred in carrying out an organization's day-
to-day activities, but not directly associated with production.
Operating expenses include such things as payroll, sales
commissions, employee benefits and pension contributions,
transportation and travel, amortization and depreciation, rent,
repairs, and taxes.
Introduction
Each Fiscal Year (FY), the Department of Veterans Affairs’
(VA’s) Office of Policy and Planning (OPP) publishes the
Geographic Distribution of VA Expenditures (GDX) report.
This report provides the estimated dollar expenditures for
major VA programs at the state, county, and Congressional
District levels. Expenditure data are grouped by the following
categories: Compensation and Pension, Education and
Vocational Rehabilitation and Employment, Insurance and
Indemnities, Construction, General Operating Expenses, Loan
Guaranty, and Medical Care. Veteran population estimates at
the state, county and Congressional District level and the
number of unique patients who used VA healthcare services are
also included in the report. The following information provides
a brief description of the data included in the report, the
methods used for data collection, and the sources of the data.
Veteran Population
As of FY 2012, the estimated Veteran population data by state
and county are based on the VA VetPop2011 model. This
model is VA’s source for official estimates and projections of
the Veteran population.
Compensation and Pension
The Compensation and Pension (C&P) category includes
expenditures for the following categories: compensation
payments, pension payments, Dependency and Indemnity
Compensation, and burial allowances. Most expenditures
reported in this category reflect monthly payments made to
individuals. Retroactive payments and one-time payments are
also included. Data is obtained from USASpending.gov.
Education and Vocational Rehabilitation and Employment
(E&VRE) are separate programs, but are combined into one
category for display purposes in GDX. Expenditures in this
category include: automobile and adaptive equipment, specially
adapted housing, Survivors’ and Dependents’ Educational
Assistance (Chapter 35), Vocational Rehabilitation for Disabled
Veterans (Chapter 31), Post-Vietnam Era Veterans’ Educational
Assistance (Chapter 32), Montgomery G.I. Bill for Selected
Reserves (Chapter 1606), Reserve Educational Assistance
Program (Chapter 1607), Montgomery G.I. Bill (Chapter 30),
and Post-9/11 Veterans Educational Assistance (Chapter 33).
Expenditure data for E&VRE are also obtained from
USASpending.gov.
Insurance and Indemnities
The data reported for this category are provided by the VA
Regional Office and Insurance Center (RO&IC) in Philadelphia,
Pennsylvania. This category consists of VA expenditures for
death claims, matured endowments, dividends, cash surrender
payments, total disability income provision payments, and total
and permanent disability benefits payments. It includes
Veterans Group Life Insurance, National Service Life
Insurance, Service Disabled Veterans Life Insurance, United
States Government Life Insurance, Veterans Reopened
Insurance, and Veterans Special Life Insurance. It does not
include Traumatic Injury Protection Under Servicemembers'
Group Life Insurance, Family Servicemembers' Group Life
Insurance, or Servicemembers' Group Life Insurance. The
RO&IC provides OPP with monthly extracts of payments to
recipients by zip code for the purposes of aggregating these
monthly payments by state, county, and Congressional District.
Construction and Related Costs
The Construction expenditures category includes funding for
Major Projects, Minor Projects, Grants for Construction of State
Extended Care Facilities, and Grants for Construction of State
Veterans Cemeteries. The source of the Construction data is the
Financial Management System (FMS).
General Operating Expenses
General Operating Expenses (GOE) represent the costs
necessary to provide administration and oversight for the
benefits provided by VA. This includes costs for overhead and
human resources. This category does not include payments
made directly to beneficiaries. The source of the GOE data is
FMS.
Loan Guaranty
Prior to FY 2008, Loan Guaranty expenditures were included in
the E&VRE category. Currently, all Loan Guaranty
expenditures are attributed to Travis, Texas, where all payments
are processed. VA will continue to improve data collection for
future GDX reports to better distribute loan expenditures at the
state, county and Congressional District levels.
Medical Expenditures
Medical expenditures data come from both the Allocation
Resource Center (ARC) and FMS. The specific programs
reported for this category are: medical care, General Post Fund,
medical and prosthetic research, and miscellaneous accounts.
Unique Patients
The count of unique patients is based on the home residence of
the patient. The number of patients, along with associated
county and Congressional District codes, are provided by the
ARC.
SCM 315: Visualization Project Rubric 1
Background: The purpose of this project is to introduce you to
Tableau and its various capabilities. As a
group, you are to find your own set of data and you will create
five different
graphs/dashboards that each relate to the same topic. You will
present your work to your lab
session as well as submit an annotated PowerPoint presentation
that fully details your work.
Data
Requirements:
You are not permitted to use data from:
Otherwise, data can come from any source you wish.
All graphs and dashboards must relate to a common topic. This
topic can be as broad or as
narrow as your group wants. For example, you can have a
project which focus on only one
sports team/season or you can have a project that covers an
entire league over multiple years.
Common topics include sports, movies, universities, Olympics,
demographics, crime statistics,
and global economic indicators. You can combine data from
different sources if needed.
Visualization
Requirements:
As a group, you must create five graphs or dashboards.
Each graph must ensure the following:
l
has a professional look
Each dashboard must ensure the following:
Excel graphs
legends, etc. and they
each have a professional look
Across all the graphs, you must ensure the following:
interactive component
controlled from the dashboard.
to make a dashboard)
can be of the same type. For example, at most two of the
standard graphs (not graphs
in the dashboard) can be bar graphs even if you use a basic bar
graph in a dashboard
somewhere else.
changing only one
element
example, you don’t graph the
count of children in each US state, you graph the percentage of
children in each US
state)
example, if you graph a map
of the US, do not zoom out to take a full screenshot of the 48
states, Alaska, and
Hawaii. This creates a lot of blank, unused space. Instead, take
three separate
screenshots).
SCM 315: Visualization Project Rubric 2
Presentation
Requirements:
Your team will provide a 5 minute presentation. You are
recommended to use a PowerPoint
presentation with the following slides:
graph/dashboard
For any interactive graphs/dashboards (e.g. ones which use the
“Page” feature or dashboard
with a filter which would like to demonstrate), you are allowed
to switch from PowerPoint (or
similar software) to Tableau when you present to show the
interactivity. Therefore, a group
member must bring a computer to use during the presentation
and they must ensure they can
open all files/graphs.
One of the most important aspects of the presentation is the 5
minute time limit. We must fit
in every presentation (8 to 9) in only one lab session so if you
have to cut out some key details
(such as an additional conclusion from your graph), that is fine.
The grader either will ask
during the Q&A session after your presentation if something is
unclear or will be able to read it
in the ‘Annotated PowerPoint’ (see the next section).
IMPORTANT: For either the Presentation or Annotated
PowerPoint, do not alter the
height/width ratio of figures/graphs/dashboards.
Annotated
PowerPoint
Requirements:
Starting from the PowerPoint created for the presentation,
create the following Annotated
PowerPoint. This file will just serve as a hard-copy version of
your presentation. It should
contain the following (some of which is the same as your
presentation PowerPoint).
m Name, Names of Team Members)
o Explanation of data sources (use citations)
o Explanation of information obtained from each data source
o Explanation of any data your team excluded from your
analysis
er visualizations (more can be used if
needed)
o Explanation of visual and why you selected that visualization
type
o Visualization
o Observations/conclusions you obtain from that visualization
An important aspect of this project is identifying any obvious or
easily evident patterns, trends,
and conclusions in each graph. If there is anything that stands
out which you do not state as a
conclusion, points will be deducted. It is highly recommended
to be as thorough as possible on
the annotated powerpoint.
SCM 315: Visualization Project Rubric 3
General
Expectations:
The project is due by 11:59 PM the day before your Week 6 lab
session. The annotated
PowerPoint is the only document that will be submitted.
Grading will be determined as
follows:
graded based on its
complexity (beyond Excel), its use of proper
axis/legends/number formats, its
professionalism, and your ability to indicate any obvious
conclusions/trends/patterns.
Each dashboard will be graded based its use of proper
axis/legends/number formats,
its professionalism, and your ability to indicate any obvious
conclusions/trends/patterns
on your ability to stay
within the five minute time limit and
graded based on following the
rules/guidelines provided in the “Annotated PowerPoint
Requirements” section of the
rubric.
’s ability to follow the other rules listed under
“Visualization Requirements”
is worth 25 points.
Frequently
Asked
Questions:
What are common topics for the project?
There are a lot of common topics students use on this project.
They include sports,
census data, college data, movies, crime statistics, and
demographic data. There is no
restrictions on the data you can use and there is no
limit/requirement on the scope. For
instance, you can have an entire presentation on football
worldwide or a presentation on
one player or match. If you are having trouble thinking of a
topic, focus instead on
looking up data sources and using your favorite from what you
find.
Can I ask the TA if this is a good topic?
You can ask, but the only criteria for a good topic is whether or
not the data exists for
that topic. If you think you have enough data, try to make the
visualizations. If you can't
make 5 which fit all the requirements, try to find more to add to
your existing data set.
When I make a graph and add labels, why are not all of the
labels showing up?
Tableau adds labels and tries to fit as many as it can such that
the labels do not overlap.
You do have some control over this, but I recommend just
letting the default options
control the displayed labels. Only change it if you really need
certain labels to be shown
on the visualization.
How do I zoom on maps?
There are control in the upper left of the screen to zoom in and
out of maps. However,
these jumps in zoom tend to be quite dramatic. On a PC, you
can hold the CTRL key and
scroll to have finer control over the zooming.
SCM 315: Visualization Project Rubric 4
What are examples of "beyond Excel"?
Simple bar, line, scatter, and pie charts are not permitted. You
have plenty of options to
modify your graphs to make it go beyond Excel (adding colors
or size differences, making
multiple simple graphs into an appropriate dashboard, etc.).
Do we have to have one conclusion per visualization or one
overall conclusion for the
project?
You should have at least one conclusion per visualization (see
the sample annotated
PowerPoint). However, the annotated PowerPoint can contain
any
conclusions/discussions you would like so long as they are
supported by the
graph/dashboard. You are encouraged to be thorough to ensure
you don’t miss any
obvious patterns, trends, and conclusions.
How do we share files between group members?
To share Tableau files, you have to send the Tableau file (.twb)
as well as the data it is
based off of. This is either the Excel file (if you chose to
"Connect Live") or the Tableau
Data Extract(.tde - if you told Tableau to save its own version
of the data).
How do I get visuals into PowerPoint?
In the top menu, there are two drop down menus (one for
Worksheets and one for
Dashboards). Whichever you are trying to insert into
Powerpoint, select the appropriate
menu and there is a copy feature. You can then paste this image
into PowerPoint for
professional images.
How can we get feedback on our visualizations?
If you want feedback, either come see me in office hours or
send screenshots of your
visualizations via email. If you send them via email, note I will
not go in depth on my
feedback. DO NOT send me .twb files via email. I can't open
these files unless you send
the data as well and I am not going to be opening and analyzing
such workbooks via
email.
Are the annotated PowerPoint and presentation two seperate
documents?
Yes, your annotated PowerPoint and presentation are two
separate files. The annotated
PowerPoint should be much longer and text based than the
presentation file. The
presentation file should simply be one or two introduction slides
and then one or more
slides per visualization with minimal text.
SCM 315: Visualization Project Rubric 5
If we use the page feature, how should we present that in the
presentation and annotated
PowerPoint?
If you use the page feature, you can open Tableau while
presenting to show the
animation. In your annotated PowerPoint, copy and paste each
'page' into the annotated
PowerPoint document. There is not limit to the annotated
PowerPoint length so this
shouldn't be a problem. If this will make your annotated
PowerPoint extremely long, talk
with the instructor about how to show the page visualization in
the annotated
PowerPoint.

State Level ExpendituresStateVeteran PopulationTotal ExpenditureC.docx

  • 1.
    State Level ExpendituresStateVeteranPopulation*Total ExpenditureCompensation & PensionConstructionEducation & Vocational Rehabilitation/ EmploymentLoan Guaranty#General Operating ExpensesInsurance & IndemnitiesMedical CareUnique Patients **Totals21,882,153$ 142,822,345$ 63,574,737$ 1,330,053$ 11,949,205$ 1,385,063$ 6,889,908$ 1,699,587$ 55,993,7925,690,384Alabama414,963$ 2,824,088$ 1,580,861$ 1,922$ 189,414$ -$ 33,885$ 29,857$ 988,150108,175Alaska74,671$ 501,604$ 211,260$ 616$ 61,850$ -$ 6,686$ 3,441$ 217,75117,304Arizona 527,400$ 3,220,905$ 1,409,346$ 21,201$ 343,820$ -$ 108,885$ 36,145$ 1,301,507137,362Arkansas 250,095$ 1,946,615$ 924,671$ 7,938$ 79,063$ -$ 31,331$ 13,484$ 890,12786,763California1,795,455$ 12,707,536$ 5,397,860$ 145,008$ 1,599,760$ -$ 192,392$ 162,956$ 5,209,559444,432Colorado 390,824$ 2,594,677$ 1,212,143$ 112,614$ 324,347$ -$ 62,854$ 32,483$ 850,23590,822Connecticut 207,759$ 1,078,567$ 365,638$ 8,332$ 96,416$ -$ 13,794$ 24,195$ 570,19251,360Delaware 78,016$ 362,617$ 169,963$ 859$ 34,331$ -$ 3,895$ 5,595$ 147,97414,676District of Columbia 31,166$ 2,295,599$ 78,699$ 153,310$ 31,054$ -$ 1,825,604$ 2,785$ 204,1468,800Florida 1,520,563$ 10,430,774$ 4,728,273$ 131,870$ 892,555$ - $ 146,088$ 139,645$ 4,392,344479,193Georgia 774,464$ 4,670,709$ 2,482,164$ 3,359$ 453,034$ -$ 109,242$ 48,822$ 1,574,087179,821Hawaii 116,947$ 754,680$ 337,919$ 1,690$ 142,729$ -$ 16,013$ 13,109$ 243,22023,825Idaho 138,108$ 746,018$ 334,504$ 11,690$ 51,513$ -$ 7,807$ 8,006$ 332,49939,928Illinois 744,710$ 3,854,717$ 1,450,236$ 18,558$ 311,330$ -$
  • 2.
    51,835$ 65,139$ 1,957,618180,384Indiana 490,380$2,477,767$ 1,092,855$ 8,783$ 150,033$ -$ 48,931$ 27,941$ 1,149,224128,499Iowa 233,815$ 1,192,889$ 505,601$ 79$ 74,079$ -$ 10,585$ 18,891$ 583,65372,191Kansas 223,708$ 1,237,985$ 529,023$ 743$ 103,950$ -$ 27,158$ 17,340$ 559,77158,097Kentucky 339,334$ 2,229,580$ 1,087,772$ 7,129$ 139,199$ -$ 37,983$ 18,871$ 938,626101,096Louisiana 315,342$ 2,202,388$ 1,016,206$ 202,777$ 120,767$ -$ 26,501$ 19,941$ 816,19586,890Maine 127,694$ 873,125$ 467,398$ 7$ 42,577$ -$ 18,277$ 9,459$ 335,40839,358Maryland 443,076$ 2,453,557$ 1,047,226$ 7,521$ 333,943$ -$ 24,725$ 42,512$ 997,63082,183Massachusetts374,809$ 2,371,613$ 985,894$ 20,552$ 192,975$ -$ 32,546$ 41,235$ 1,098,41284,345Michigan660,773$ 3,361,961$ 1,675,388$ 6,185$ 208,565$ -$ 51,291$ 43,961$ 1,376,571146,804Minnesota360,754$ 2,336,965$ 986,609$ 15,600$ 133,629$ -$ 82,027$ 33,370$ 1,085,731113,577Mississippi225,469$ 1,470,950$ 666,715$ 12,230$ 88,010$ -$ 29,313$ 13,394$ 661,28869,676Missouri 497,874$ 3,025,845$ 1,386,280$ 34,423$ 189,473$ -$ 146,126$ 32,796$ 1,236,747137,008Montana 101,597$ 646,509$ 290,869$ 8$ 38,237$ -$ 7,765$ 7,072$ 302,55835,189Nebraska 138,773$ 1,023,761$ 487,975$ 9,837$ 63,597$ -$ 36,470$ 12,589$ 413,29447,275Nevada 225,933$ 1,573,091$ 641,969$ 19,641$ 95,562$ -$ 13,505$ 14,516$ 787,89965,443New Hampshire 110,778$ 613,805$ 268,735$ 1,282$ 50,861$ -$ 6,142$ 8,473$ 278,31228,604New Jersey 425,094$ 1,927,021$ 906,744$ 6,578$ 196,113$ -$ 15,868$ 51,994$ 749,72477,179New Mexico 170,699$ 1,312,943$ 686,222$ 26,571$ 67,315$ -$
  • 3.
    12,586$ 12,750$ 507,49949,981NewYork 885,796$ 5,621,911$ 2,063,566$ 17,521$ 493,102$ -$ 120,558$ 94,116$ 2,833,048231,161North Carolina 769,384$ 5,067,823$ 2,712,319$ 21,238$ 399,186$ -$ 91,538$ 53,714$ 1,789,827205,006North Dakota 56,213$ 334,755$ 149,596$ 2,623$ 22,770$ -$ 6,479$ 3,770$ 149,51818,526Ohio 877,894$ 6,643,911$ 1,837,567$ 34,987$ 296,446$ -$ 2,202,389$ 59,096$ 2,213,426223,944Oklahoma 340,395$ 2,568,390$ 1,544,376$ 5,320$ 131,030$ -$ 121,588$ 19,958$ 746,11890,731Oregon 322,355$ 2,283,129$ 1,100,287$ 36,702$ 128,169$ -$ 35,298$ 23,228$ 959,44596,190Pennsylvania 953,644$ 4,782,351$ 2,029,589$ 49,407$ 359,065$ -$ 158,258$ 82,386$ 2,103,647232,054Rhode Island 69,206$ 474,338$ 193,988$ 2,867$ 35,525$ -$ 19,476$ 5,928$ 216,55520,132South Carolina 420,968$ 2,876,324$ 1,557,784$ 2,557$ 223,348$ -$ 63,246$ 28,310$ 1,001,079123,070South Dakota 75,687$ 564,489$ 209,347$ 1,976$ 30,364$ -$ 10,392$ 5,461$ 306,94929,744Tennessee 521,267$ 3,320,710$ 1,652,616$ 6,443$ 236,754$ -$ 63,014$ 33,644$ 1,328,239135,582Texas 1,667,740$ 12,943,393$ 6,091,910$ 30,026$ 1,118,114$ 1,385,063$ 220,626$ 110,750$ 3,986,903434,255Utah 150,771$ 887,516$ 350,923$ 6,163$ 85,974$ -$ 53,145$ 10,033$ 381,27934,062Vermont 48,812$ 273,966$ 118,286$ 1,105$ 20,296$ -$ 3,992$ 3,340$ 126,94914,925Virginia 840,398$ 4,653,545$ 2,291,200$ 22,761$ 874,229$ -$ 61,129$ 60,779$ 1,343,447142,605Washington 602,272$ 3,384,110$ 1,788,537$ 55,674$ 343,793$ -$ 67,749$ 41,915$ 1,086,440118,461West Virginia 173,389$ 1,601,256$ 625,689$ 6,525$ 44,341$ -$ 261,560$ 9,871$ 653,27058,733Wisconsin 409,419$ 2,421,849$ 972,511$ 12,224$ 133,679$ -$
  • 4.
    69,991$ 34,398$ 1,199,045118,371Wyoming 56,518$343,611$ 127,557$ 7,264$ 15,751$ -$ 1,456$ 3,131$ 188,45318,583Puerto Rico 99,928$ 1,387,777$ 697,879$ 7,756$ 46,541$ -$ 19,912$ 2,496$ 613,19358,009Guam9,055$ 66,330$ 46,193$ -$ 10,629$ -$ -$ 495$ 9,0120Totals21,882,153$ 142,822,345$ 63,574,737$ 1,330,053$ 11,949,205$ 1,385,063$ 6,889,908$ 1,699,587$ 55,993,7925,690,384Notes:* Veteran population estimates, as of September 30, 2013, are produced by the VA Office of the Actuary (VetPop 2011).# Prior to FY 08, "Loan Guaranty" expenditures were included in the Education & Vocational Rehabilitation and Employment (E&VRE) programs. Currently, all "Loan Guaranty" expenditures are attributed to Travis County, TX, where all Loan Guaranty payments are processed. VA will continue to improve data collection for future GDX reports to better distribute loan expenditures at the state, county and congressional district levels.** Unique patients are patients who received treatment at a VA health care facility. Data are provided by the Allocation Resource Center (ARC).Expenditure data sources: USASpending.gov for Compensation & Pension (C&P) and Education and Vocational Rehabilitation and Employment (EVRE) Benefits; Veterans Benefits Administration Insurance Center for the Insurance costs; the VA Financial Management System (FMS) for Construction, Medical Research, General Operating Expenses, and certain C&P and Readjustment data; and the Allocation Resource Center (ARC) for Medical Care costs.1. Expenditures are rounded to the nearest thousand dollars. For example, $500 to $1,000 are rounded to $1; $0 to $499 are rounded to $0; and "$ -" = 0 or no expenditures.2. The Compensation & Pension expenditures include dollars for the following programs: veterans' compensation for service-connected disabilities; dependency and indemnity compensation for service-connected deaths; veterans' pension for nonservice-connected disabilities; and burial and other benefits to veterans and their survivors.3.
  • 5.
    Medical Care expendituresinclude dollars for medical services, medical administration, facility maintenance, educational support, research support, and other overhead items. Medical Care expenditures do not include dollars for construction or other non-medical support.4. Medical Care expenditures are based on where patients live instead of where care is delivered.5. A star symbol (*) in the Unique Patients column denotes that there were less than 10 Unique Patients.. &"Arial,Bold"&11FY13 GEOGRAPHIC DISTRIBUTION OF VA EXPENDITURES (GDX) &8&P of &N AKFY13 Summary of Expenditures by StateExpenditures in $000sCounty/ Congressional DistrictVeteran Population*Total ExpenditureCompensation & PensionConstructionEducation & Vocational Rehabilitation/ EmploymentLoan Guaranty#General Operating ExpensesInsurance & IndemnitiesMedical CareUnique Patients**ALEUTIANS EAST159$ 154$ 38$ -$ 31$ -$ -$ 3$ 8212ALEUTIANS WEST385$ 154$ 116$ -$ 1$ -$ -$ -$ 3711ANCHORAGE30,663$ 252,992$ 99,940$ 383$ 33,941$ -$ 6,686$ 1,661$ 110,3818,346BETHEL1,032$ 1,169$ 651$ -$ 96$ -$ -$ -$ 42364BRISTOL BAY149$ 323$ 227$ -$ -$ -$ -$ - $ 9614DENALI254$ 1,493$ 480$ -$ 147$ -$ -$ 21$ 84548DILLINGHAM317$ 528$ 265$ -$ 52$ -$ -$ -$ 21130FAIRBANKS N. STAR12,819$ 75,424$ 35,639$ -$ 12,835$ -$ -$ 560$ 26,3902,354HAINES284$ 1,094$ 542$ -$ 30$ -$ -$ 1$ 52141HOONAH-ANGOON209$ 650$ 340$ -$ 13$ -$ -$ 16$ 28138JUNEAU2,347$ 11,564$ 5,441$ -$ 1,374$ -$ -$ 260$ 4,489434KENAI PENINSULA5,513$ 39,419$ 15,015$ -$ 1,587$ -$ -$ 229$ 22,5891,643KETCHIKAN GATEWAY1,517$ 4,064$ 2,160$ -$ 352$ -$ -$ 20$ 1,532149KODIAK ISLAND1,424$ 5,142$ 2,490$ -$ 1,025$ -$ -$ 71$ 1,557144LAKE AND PENINSULA135$ 111$ 93$ -$ 5$ -
  • 6.
    $ -$ -$12*MATANUSKA SUSITNA10,876$ 84,368$ 36,825$ -$ 9,083$ -$ -$ 491$ 37,9703,074NOME688$ 864$ 446$ -$ 78$ -$ -$ -$ 33940NORTH SLOPE389$ 362$ 246$ -$ 2$ -$ -$ 1$ 11325NORTHWEST ARCTIC485$ 271$ 174$ -$ 32$ -$ -$ -$ 65*PETERSBURG427$ 1,110$ 721$ -$ 30$ -$ -$ 6$ 35344PRINCE OF WALES-HYDER572$ 2,364$ 871$ -$ 15$ -$ -$ 22$ 1,455105SITKA858$ 2,762$ 1,309$ 233$ 257$ -$ -$ 39$ 923108SKAGWAY90$ 161$ 38$ -$ -$ -$ -$ -$ 12314SOUTHEAST FAIRBANKS761$ 5,891$ 3,338$ -$ 395$ -$ -$ 17$ 2,142218VALDEZ CORDOVA1,127$ 5,610$ 1,950$ -$ 208$ -$ -$ 11$ 3,441192WADE HAMPTON288$ 862$ 574$ -$ 16$ -$ - $ -$ 27129WRANGELL285$ 801$ 361$ -$ 12$ -$ -$ 11$ 41639YAKUTAT92$ 176$ 94$ -$ 22$ -$ -$ -$ 60*YUKON KOYUKUK528$ 1,721$ 873$ -$ 214$ -$ -$ -$ 63471ALASKA (Totals)74,671$ 501,604$ 211,260$ 616$ 61,850$ -$ 6,686$ 3,441$ 217,75117,304CONG. DIST (01)74,671$ 501,604$ 211,260$ 616$ 61,850$ -$ 6,686$ 3,441$ 217,75117,304ALASKA (Totals)74,671$ 501,604$ 211,260$ 616$ 61,850$ -$ 6,686$ 3,441$ 217,75117,304Notes:* Veteran population estimates, as of September 30, 2013, are produced by the VA Office of the Actuary (VetPop 2011).# Prior to FY 08, "Loan Guaranty" expenditures were included in the Education & Vocational Rehabilitation and Employment (E&VRE) programs. Currently, all "Loan Guaranty" expenditures are attributed to Travis County, TX, where all Loan Guaranty payments are processed. VA will continue to improve data collection for future GDX reports to better distribute loan expenditures at the state, county and congressional district levels.** Unique patients are patients who received treatment at a VA health care facility. Data are provided by the Allocation Resource Center (ARC).Expenditure data sources: USASpending.gov for Compensation & Pension (C&P) and Education and Vocational Rehabilitation and Employment (EVRE) Benefits; Veterans
  • 7.
    Benefits Administration InsuranceCenter for the Insurance costs; the VA Financial Management System (FMS) for Construction, Medical Research, General Operating Expenses, and certain C&P and Readjustment data; and the Allocation Resource Center (ARC) for Medical Care costs.1. Expenditures are rounded to the nearest thousand dollars. For example, $500 to $1,000 are rounded to $1; $0 to $499 are rounded to $0; and "$ -" = 0 or no expenditures.2. The Compensation & Pension expenditures include dollars for the following programs: veterans' compensation for service-connected disabilities; dependency and indemnity compensation for service-connected deaths; veterans' pension for nonservice-connected disabilities; and burial and other benefits to veterans and their survivors.3. Medical Care expenditures include dollars for medical services, medical administration, facility maintenance, educational support, research support, and other overhead items. Medical Care expenditures do not include dollars for construction or other non-medical support.4. Medical Care expenditures are based on where patients live instead of where care is delivered.5. A star symbol (*) in the Unique Patients column denotes that there were less than 10 Unique Patients. &"Arial,Bold"&11FY13 GEOGRAPHIC DISTRIBUTION OF VA EXPENDITURES (GDX) &8&P of &N ALFY13 Summary of Expenditures by StateExpenditures in $000sCounty/ Congressional DistrictVeteran Population*Total ExpenditureCompensation & PensionConstructionEducation & Vocational Rehabilitation/ EmploymentLoan Guaranty#General Operating ExpensesInsurance & IndemnitiesMedical CareUnique Patients**AUTAUGA6,044$ 43,947$ 26,671$ - $ 5,011$ -$ -$ 363$ 11,9011,339BALDWIN20,214$ 85,654$ 52,417$ -$ 6,755$ -$ -$ 1,802$ 24,6804,357BARBOUR2,391$ 14,452$ 9,476$ -$ 358$ -$ -$ 196$ 4,423583BIBB1,316$ 12,198$ 6,648$ -$ 402$
  • 8.
    -$ -$ 66$5,082506BLOUNT4,819$ 19,784$ 9,254$ -$ 564$ -$ -$ 53$ 9,9131,021BULLOCK880$ 7,628$ 4,397$ -$ 223$ -$ -$ 120$ 2,887218BUTLER1,906$ 11,696$ 6,748$ -$ 677$ -$ -$ 88$ 4,183431CALHOUN12,022$ 81,383$ 54,324$ -$ 3,937$ - $ -$ 733$ 22,3903,224CHAMBERS3,143$ 22,772$ 14,142$ -$ 815$ -$ -$ 103$ 7,712816CHEROKEE2,198$ 11,634$ 6,624$ -$ 292$ -$ -$ 236$ 4,482490CHILTON3,327$ 25,393$ 15,038$ -$ 870$ -$ -$ 261$ 9,224886CHOCTAW1,027$ 8,903$ 6,086$ -$ 140$ -$ -$ 10$ 2,668327CLARKE1,816$ 12,597$ 7,593$ -$ 649$ -$ -$ 17$ 4,338520CLAY1,249$ 6,469$ 4,069$ -$ 110$ -$ -$ 9$ 2,281300CLEBURNE1,029$ 5,771$ 3,404$ -$ 145$ -$ - $ 17$ 2,205265COFFEE7,141$ 59,158$ 42,710$ -$ 5,808$ -$ -$ 740$ 9,9011,727COLBERT4,862$ 30,986$ 21,005$ -$ 1,406$ -$ -$ 236$ 8,3401,328CONECUH1,255$ 8,358$ 5,551$ -$ 179$ -$ -$ 353$ 2,273315COOSA1,050$ 6,925$ 4,700$ -$ 171$ -$ -$ 37$ 2,016234COVINGTON3,605$ 23,256$ 15,653$ -$ 676$ -$ -$ 186$ 6,741824CRENSHAW917$ 8,290$ 4,643$ -$ 409$ -$ -$ 182$ 3,057281CULLMAN7,170$ 38,250$ 22,692$ -$ 1,817$ -$ -$ 230$ 13,5111,468DALE7,154$ 53,965$ 38,234$ -$ 4,527$ -$ -$ 666$ 10,5401,885DALLAS2,951$ 24,062$ 12,730$ -$ 859$ -$ -$ 114$ 10,3601,005DE KALB4,439$ 24,799$ 14,549$ -$ 962$ -$ -$ 211$ 9,0771,010ELMORE9,329$ 65,158$ 42,087$ -$ 5,567$ -$ -$ 692$ 16,8122,084ESCAMBIA3,135$ 18,536$ 12,540$ -$ 406$ -$ -$ 308$ 5,282805ETOWAH9,136$ 61,231$ 38,469$ - $ 1,876$ -$ -$ 290$ 20,5972,497FAYETTE1,365$ 11,380$ 5,504$ -$ 294$ -$ -$ 26$ 5,555553FRANKLIN1,841$ 11,325$ 7,233$ -$ 428$ -$ -$ 84$ 3,579398GENEVA2,708$ 22,678$ 15,814$ -$ 829$ -$ -$ 195$ 5,840875GREENE561$ 6,113$ 3,088$ -$ 46$ -$ -$ 21$ 2,958261HALE962$ 13,006$ 6,298$
  • 9.
    -$ 310$ -$-$ 31$ 6,366475HENRY1,789$ 10,880$ 7,405$ -$ 398$ -$ -$ 66$ 3,011443HOUSTON9,070$ 61,670$ 40,752$ -$ 4,042$ -$ -$ 787$ 16,0892,813JACKSON4,079$ 18,695$ 10,872$ -$ 694$ - $ -$ 77$ 7,051842JEFFERSON49,524$ 390,095$ 170,081$ 256$ 19,142$ -$ 4,117$ 5,002$ 191,49715,277LAMAR1,252$ 8,612$ 5,043$ -$ 397$ -$ -$ 45$ 3,127455LAUDERDALE7,662$ 41,987$ 26,741$ - $ 2,308$ -$ -$ 1,171$ 11,7671,736LAWRENCE2,278$ 9,232$ 5,595$ -$ 308$ -$ -$ 220$ 3,109495LEE10,728$ 88,866$ 53,125$ -$ 10,378$ -$ -$ 1,121$ 24,2422,694LIMESTONE8,546$ 37,830$ 23,728$ - $ 4,941$ -$ -$ 262$ 8,8991,464LOWNDES744$ 6,370$ 3,182$ -$ 211$ -$ -$ 32$ 2,946270MACON1,692$ 31,945$ 11,413$ -$ 554$ -$ 783$ 129$ 19,065905MADISON38,639$ 195,782$ 128,828$ -$ 26,066$ -$ -$ 2,393$ 38,4957,115MARENGO1,457$ 14,479$ 8,573$ -$ 350$ -$ -$ 43$ 5,513660MARION2,355$ 13,515$ 7,111$ -$ 648$ -$ -$ 11$ 5,744659MARSHALL7,379$ 39,168$ 24,022$ -$ 2,009$ -$ -$ 274$ 12,8631,738MOBILE33,382$ 193,962$ 107,826$ -$ 17,448$ -$ 116$ 2,288$ 66,2848,820MONROE1,549$ 11,298$ 6,296$ -$ 278$ -$ -$ 176$ 4,548471MONTGOMERY20,064$ 231,901$ 107,831$ 110$ 17,743$ -$ 26,627$ 1,567$ 78,0226,432MORGAN9,808$ 49,062$ 32,208$ -$ 2,858$ -$ -$ 583$ 13,4131,873PERRY729$ 6,412$ 3,683$ -$ 194$ -$ -$ 50$ 2,485199PICKENS1,572$ 17,744$ 8,589$ -$ 355$ -$ -$ 48$ 8,752732PIKE2,268$ 19,927$ 10,470$ -$ 3,197$ -$ -$ 178$ 6,082612RANDOLPH1,759$ 10,947$ 6,869$ -$ 388$ -$ -$ 82$ 3,607468RUSSELL5,405$ 67,888$ 41,600$ 5$ 10,261$ -$ 700$ 742$ 14,5792,087SAINT CLAIR7,877$ 39,804$ 19,590$ -$ 1,353$ -$ -$ 379$ 18,4831,712SHELBY14,467$ 70,649$ 38,474$ -$ 5,202$ -$ -$ 1,661$ 25,3112,717SUMTER766$ 7,482$ 4,448$ -
  • 10.
    $ 245$ -$-$ 35$ 2,754302TALLADEGA7,062$ 36,982$ 20,174$ -$ 1,495$ -$ -$ 132$ 15,1811,789TALLAPOOSA3,667$ 30,973$ 17,371$ -$ 629$ -$ -$ 609$ 12,3631,181TUSCALOOSA14,116$ 134,799$ 48,233$ 1,550$ 5,931$ -$ 1,541$ 723$ 76,8225,180WALKER6,178$ 42,400$ 25,829$ -$ 920$ -$ -$ 156$ 15,4951,706WASHINGTON1,602$ 7,160$ 4,294$ -$ 288$ -$ -$ 25$ 2,553322WILCOX660$ 5,798$ 3,180$ -$ 253$ -$ -$ 72$ 2,293193WINSTON1,878$ 12,015$ 7,028$ -$ 414$ -$ -$ 41$ 4,532505ALABAMA (Totals)414,963$ 2,824,088$ 1,580,861$ 1,922$ 189,414$ -$ 33,885$ 29,857$ 988,150108,175CONG. DIST (01)60,557$ 320,282$ 185,582$ -$ 25,362$ -$ 116$ 4,612$ 104,60914,965CONG. DIST (02)70,677$ 565,021$ 336,634$ 110$ 42,766$ -$ 26,627$ 5,928$ 152,95518,405CONG. DIST (03)60,516$ 452,632$ 261,823$ 5$ 31,877$ -$ 1,484$ 4,544$ 152,89916,658CONG. DIST (04)54,897$ 328,313$ 193,749$ -$ 12,616$ -$ -$ 2,094$ 119,85414,199CONG. DIST (05)68,734$ 343,316$ 222,353$ -$ 36,864$ -$ -$ 4,486$ 79,61313,025CONG. DIST (06)52,659$ 257,675$ 128,842$ -$ 13,400$ -$ -$ 5,316$ 110,11811,322CONG. DIST (07)46,923$ 556,850$ 251,877$ 1,806$ 26,529$ -$ 5,658$ 2,878$ 268,10219,601ALABAMA (Totals)414,963$ 2,824,088$ 1,580,861$ 1,922$ 189,414$ -$ 33,885$ 29,857$ 988,150108,175Notes:* Veteran population estimates, as of September 30, 2013, are produced by the VA Office of the Actuary (VetPop 2011).# Prior to FY 08, "Loan Guaranty" expenditures were included in the Education & Vocational Rehabilitation and Employment (E&VRE) programs. Currently, all "Loan Guaranty" expenditures are attributed to Travis County, TX, where all Loan Guaranty payments are processed. VA will continue to improve data collection for future GDX reports to better distribute loan expenditures at the state, county and congressional district levels.** Unique
  • 11.
    patients are patientswho received treatment at a VA health care facility. Data are provided by the Allocation Resource Center (ARC).Expenditure data sources: USASpending.gov for Compensation & Pension (C&P) and Education and Vocational Rehabilitation and Employment (EVRE) Benefits; Veterans Benefits Administration Insurance Center for the Insurance costs; the VA Financial Management System (FMS) for Construction, Medical Research, General Operating Expenses, and certain C&P and Readjustment data; and the Allocation Resource Center (ARC) for Medical Care costs.1. Expenditures are rounded to the nearest thousand dollars. For example, $500 to $1,000 are rounded to $1; $0 to $499 are rounded to $0; and "$ -" = 0 or no expenditures.2. The Compensation & Pension expenditures include dollars for the following programs: veterans' compensation for service-connected disabilities; dependency and indemnity compensation for service-connected deaths; veterans' pension for nonservice-connected disabilities; and burial and other benefits to veterans and their survivors.3. Medical Care expenditures include dollars for medical services, medical administration, facility maintenance, educational support, research support, and other overhead items. Medical Care expenditures do not include dollars for construction or other non-medical support.4. Medical Care expenditures are based on where patients live instead of where care is delivered.5. A star symbol (*) in the Unique Patients column denotes that there were less than 10 Unique Patients. &"Arial,Bold"&11FY13 GEOGRAPHIC DISTRIBUTION OF VA EXPENDITURES (GDX) &8&P of &N ARFY13 Summary of Expenditures by StateExpenditures in $000sCounty/ Congressional DistrictVeteran Population*Total ExpenditureCompensation & PensionConstructionEducation & Vocational Rehabilitation/ EmploymentLoan Guaranty#General Operating ExpensesInsurance & IndemnitiesMedical
  • 12.
    CareUnique Patients**ARKANSAS1,518$ 9,190$4,254$ -$ 202$ -$ -$ 100$ 4,634455ASHLEY1,723$ 11,218$ 5,979$ -$ 252$ -$ -$ 140$ 4,846491BAXTER5,820$ 31,431$ 16,832$ -$ 904$ -$ -$ 204$ 13,4921,987BENTON18,612$ 105,916$ 48,098$ -$ 4,489$ -$ -$ 1,081$ 52,2486,149BOONE3,607$ 24,959$ 13,202$ -$ 817$ -$ -$ 220$ 10,7211,371BRADLEY1,082$ 5,635$ 3,003$ -$ 126$ -$ -$ 19$ 2,488250CALHOUN511$ 2,420$ 960$ -$ 63$ -$ -$ 22$ 1,374126CARROLL2,721$ 15,615$ 7,693$ -$ 302$ -$ -$ 157$ 7,4641,007CHICOT935$ 7,932$ 3,785$ -$ 167$ -$ -$ 87$ 3,893320CLARK1,607$ 11,722$ 5,530$ -$ 660$ -$ -$ 69$ 5,463488CLAY1,488$ 10,675$ 5,820$ -$ 133$ -$ -$ 61$ 4,661551CLEBURNE3,175$ 24,359$ 11,780$ -$ 390$ -$ -$ 32$ 12,1571,071CLEVELAND732$ 6,184$ 3,195$ -$ 184$ -$ -$ 29$ 2,777254COLUMBIA1,597$ 11,369$ 5,966$ -$ 488$ -$ -$ 168$ 4,746471CONWAY1,796$ 14,690$ 7,020$ -$ 514$ -$ -$ 29$ 7,128662CRAIGHEAD7,189$ 36,446$ 21,555$ -$ 2,629$ -$ -$ 207$ 12,0541,992CRAWFORD5,709$ 42,047$ 23,672$ -$ 1,472$ -$ -$ 160$ 16,7432,350CRITTENDEN3,697$ 25,728$ 9,829$ -$ 2,183$ -$ -$ 114$ 13,6031,108CROSS1,111$ 9,060$ 4,406$ -$ 367$ -$ -$ 101$ 4,186399DALLAS737$ 5,073$ 1,981$ -$ 203$ -$ -$ 15$ 2,874204DESHA1,016$ 9,325$ 4,257$ -$ 167$ -$ -$ 27$ 4,873366DREW1,568$ 10,118$ 4,967$ -$ 328$ -$ -$ 109$ 4,714473FAULKNER9,819$ 71,204$ 32,671$ -$ 4,912$ -$ -$ 414$ 33,2072,773FRANKLIN1,709$ 14,198$ 7,341$ -$ 427$ - $ -$ 380$ 6,051713FULTON1,199$ 9,700$ 5,434$ -$ 257$ -$ -$ 22$ 3,986498GARLAND10,357$ 74,953$ 37,883$ -$ 1,955$ -$ -$ 760$ 34,3543,718GRANT1,472$ 12,656$ 5,947$ -$ 381$ -$ - $ 25$ 6,303484GREENE3,065$ 26,182$ 14,863$ -$ 840$ -$ -$ 168$ 10,3111,263HEMPSTEAD1,435$ 8,865$
  • 13.
    4,855$ -$ 187$-$ -$ 71$ 3,752432HOT SPRING3,161$ 19,480$ 9,194$ -$ 476$ -$ -$ 81$ 9,7291,000HOWARD961$ 6,657$ 3,204$ -$ 111$ -$ -$ 23$ 3,318302INDEPENDENCE3,163$ 20,500$ 10,357$ -$ 457$ -$ -$ 173$ 9,513882IZARD1,454$ 10,077$ 5,711$ -$ 144$ -$ -$ 51$ 4,171544JACKSON1,217$ 9,137$ 4,340$ -$ 238$ -$ -$ 55$ 4,504394JEFFERSON6,361$ 59,003$ 30,067$ -$ 1,941$ -$ -$ 256$ 26,7392,374JOHNSON1,863$ 13,850$ 7,261$ -$ 424$ -$ -$ 157$ 6,007735LAFAYETTE656$ 3,786$ 1,598$ -$ 48$ -$ -$ 55$ 2,085190LAWRENCE1,374$ 9,432$ 5,712$ -$ 264$ -$ -$ 14$ 3,442443LEE741$ 3,603$ 1,700$ -$ 53$ -$ -$ 11$ 1,838165LINCOLN1,239$ 6,061$ 2,831$ -$ 186$ -$ -$ 51$ 2,993267LITTLE RIVER1,041$ 6,702$ 3,714$ -$ 165$ -$ -$ 2$ 2,820359LOGAN2,117$ 15,266$ 8,666$ -$ 444$ -$ -$ 61$ 6,095821LONOKE7,666$ 72,523$ 40,763$ -$ 6,402$ -$ -$ 545$ 24,8132,396MADISON1,111$ 10,782$ 4,040$ -$ 109$ -$ -$ 105$ 6,527548MARION2,650$ 15,620$ 8,328$ -$ 117$ -$ -$ 81$ 7,094865MILLER3,619$ 19,954$ 10,584$ -$ 608$ -$ -$ 30$ 8,732972MISSISSIPPI3,361$ 21,633$ 12,380$ -$ 477$ - $ -$ 75$ 8,701937MONROE729$ 5,777$ 2,431$ -$ 94$ -$ -$ 4$ 3,248254MONTGOMERY922$ 7,770$ 4,168$ -$ 80$ -$ -$ 33$ 3,489428NEVADA845$ 5,504$ 2,695$ -$ 240$ -$ -$ 36$ 2,533244NEWTON756$ 5,243$ 2,706$ -$ 78$ -$ -$ 113$ 2,346320OUACHITA2,450$ 16,103$ 8,572$ -$ 494$ -$ -$ 143$ 6,894777PERRY961$ 9,897$ 4,295$ - $ 139$ -$ -$ 11$ 5,452373PHILLIPS1,357$ 11,179$ 5,064$ -$ 214$ -$ -$ 130$ 5,770501PIKE978$ 5,547$ 2,519$ -$ 130$ -$ -$ 17$ 2,880318POINSETT1,876$ 11,156$ 5,371$ -$ 468$ -$ -$ 164$ 5,153598POLK2,063$ 19,061$ 10,308$ -$ 375$ -$ -$ 60$ 8,3181,078POPE5,182$ 34,202$ 16,157$ -$ 2,010$ -$ -$ 201$ 15,8331,546PRAIRIE854$ 6,469$ 2,586$ -$
  • 14.
    111$ -$ -$11$ 3,760272PULASKI32,336$ 397,687$ 154,821$ 366$ 18,944$ -$ 27,681$ 2,846$ 193,03012,629RANDOLPH1,527$ 14,035$ 7,841$ -$ 353$ -$ -$ 46$ 5,795635SAINT FRANCIS1,807$ 12,431$ 6,278$ -$ 395$ -$ -$ 21$ 5,737540SALINE10,551$ 66,238$ 31,341$ -$ 3,022$ -$ -$ 642$ 31,2333,086SCOTT1,006$ 7,185$ 4,045$ -$ 246$ -$ -$ 62$ 2,832395SEARCY840$ 7,741$ 3,995$ -$ 118$ -$ -$ 19$ 3,609333SEBASTIAN10,498$ 70,236$ 38,818$ 373$ 3,305$ -$ 865$ 561$ 26,3154,199SEVIER1,111$ 6,340$ 3,275$ -$ 109$ -$ -$ 16$ 2,941303SHARP2,127$ 16,516$ 9,726$ -$ 279$ -$ -$ 47$ 6,463789STONE1,171$ 10,848$ 6,111$ -$ 210$ -$ -$ 152$ 4,375493UNION3,504$ 19,339$ 9,415$ -$ 566$ -$ -$ 106$ 9,2531,026VAN BUREN1,946$ 14,308$ 7,591$ -$ 224$ -$ -$ 70$ 6,422703WASHINGTON13,170$ 122,002$ 44,417$ 7,199$ 5,571$ -$ 2,786$ 638$ 61,3905,503WHITE6,691$ 55,217$ 28,458$ -$ 2,383$ -$ -$ 411$ 23,9652,091WOODRUFF590$ 3,887$ 2,147$ -$ 50$ -$ -$ 61$ 1,630151YELL1,485$ 11,760$ 6,287$ -$ 190$ - $ -$ 48$ 5,235558ARKANSAS (Totals)250,095$ 1,946,615$ 924,671$ 7,938$ 79,063$ -$ 31,331$ 13,484$ 890,12786,763CONG. DIST (01)63,364$ 454,371$ 238,843$ -$ 18,793$ -$ -$ 2,753$ 193,98220,647CONG. DIST (02)64,100$ 629,363$ 266,261$ 366$ 30,147$ -$ 27,681$ 4,424$ 300,48322,316CONG. DIST (03)59,097$ 408,408$ 187,749$ 7,572$ 17,176$ -$ 3,650$ 3,135$ 189,12521,871CONG. DIST (04)63,534$ 454,472$ 231,817$ 12,947$ -$ -$ 3,172$ 206,53621,929ARKANSAS (Totals)250,095$ 1,946,615$ 924,671$ 7,938$ 79,063$ -$ 31,331$ 13,484$ 890,12786,763Notes:* Veteran population estimates, as of September 30, 2013, are produced by the VA Office of the Actuary (VetPop 2011).# Prior to FY 08, "Loan Guaranty" expenditures were included in the Education & Vocational Rehabilitation and Employment (E&VRE) programs.
  • 15.
    Currently, all "LoanGuaranty" expenditures are attributed to Travis County, TX, where all Loan Guaranty payments are processed. VA will continue to improve data collection for future GDX reports to better distribute loan expenditures at the state, county and congressional district levels.** Unique patients are patients who received treatment at a VA health care facility. Data are provided by the Allocation Resource Center (ARC).Expenditure data sources: USASpending.gov for Compensation & Pension (C&P) and Education and Vocational Rehabilitation and Employment (EVRE) Benefits; Veterans Benefits Administration Insurance Center for the Insurance costs; the VA Financial Management System (FMS) for Construction, Medical Research, General Operating Expenses, and certain C&P and Readjustment data; and the Allocation Resource Center (ARC) for Medical Care costs.1. Expenditures are rounded to the nearest thousand dollars. For example, $500 to $1,000 are rounded to $1; $0 to $499 are rounded to $0; and "$ -" = 0 or no expenditures.2. The Compensation & Pension expenditures include dollars for the following programs: veterans' compensation for service-connected disabilities; dependency and indemnity compensation for service-connected deaths; veterans' pension for nonservice-connected disabilities; and burial and other benefits to veterans and their survivors.3. Medical Care expenditures include dollars for medical services, medical administration, facility maintenance, educational support, research support, and other overhead items. Medical Care expenditures do not include dollars for construction or other non-medical support.4. Medical Care expenditures are based on where patients live instead of where care is delivered.5. A star symbol (*) in the Unique Patients column denotes that there were less than 10 Unique Patients. &"Arial,Bold"&11FY13 GEOGRAPHIC DISTRIBUTION OF VA EXPENDITURES (GDX) &8&P of &N
  • 16.
    AZFY13 Summary ofExpenditures by StateExpenditures in $000sCounty/ Congressional DistrictVeteran Population*Total ExpenditureCompensation & PensionConstructionEducation & Vocational Rehabilitation/ EmploymentLoan Guaranty#General Operating ExpensesInsurance & IndemnitiesMedical CareUnique Patients**APACHE4,487$ 24,595$ 15,017$ -$ 1,215$ -$ -$ 87$ 8,2761,205COCHISE22,690$ 160,944$ 90,547$ -$ 13,726$ -$ -$ 1,865$ 54,8076,697COCONINO9,246$ 40,471$ 19,343$ -$ 4,958$ -$ -$ 733$ 15,4371,877GILA6,072$ 31,443$ 16,876$ -$ 597$ -$ -$ 313$ 13,6561,711GRAHAM2,922$ 15,139$ 7,038$ -$ 416$ -$ -$ 242$ 7,444722GREENLEE1,175$ 4,094$ 1,867$ -$ 80$ -$ -$ 3$ 2,144222LA PAZ2,764$ 12,674$ 5,655$ -$ 139$ -$ -$ 69$ 6,811745MARICOPA271,326$ 1,592,681$ 685,571$ 11,878$ 220,048$ -$ 106,391$ 20,108$ 548,68460,097MOHAVE25,433$ 135,355$ 66,775$ -$ 2,988$ -$ -$ 833$ 64,7607,837NAVAJO7,437$ 40,510$ 24,094$ -$ 1,552$ -$ -$ 217$ 14,6472,180PIMA89,642$ 658,189$ 269,328$ 5,375$ 50,432$ -$ 1,733$ 8,108$ 323,21329,087PINAL37,192$ 145,442$ 64,944$ -$ 11,006$ -$ -$ 1,202$ 68,2918,442SANTA CRUZ2,078$ 12,730$ 6,583$ -$ 822$ -$ -$ 86$ 5,239615YAVAPAI26,214$ 269,941$ 91,539$ 3,948$ 27,353$ -$ 762$ 1,731$ 144,60912,150YUMA18,721$ 76,696$ 44,169$ -$ 8,489$ -$ -$ 549$ 23,4893,775ARIZONA (Totals)527,400$ 3,220,905$ 1,409,346$ 21,201$ 343,820$ -$ 108,885$ 36,145$ 1,301,507137,362CONG. DIST (01)59,118$ 282,428$ 133,787$ 3,948$ 19,517$ -$ 762$ 3,512$ 120,90314,809CONG. DIST (02)84,042$ 567,635$ 260,478$ -$ 45,545$ -$ -$ 8,256$ 253,35625,834CONG. DIST (03)41,213$ 322,650$ 146,944$ -$ 32,196$ -$ -$ 1,723$ 141,78713,060CONG. DIST (04)88,475$ 658,971$ 230,460$ 11,878$ 41,886$ -$ 106,391$ 3,682$ 264,67427,820CONG. DIST (05)59,262$ 245,357$ 111,823$
  • 17.
    -$ 35,892$ -$-$ 3,253$ 94,38911,584CONG. DIST (06)52,731$ 241,815$ 111,892$ -$ 35,914$ -$ -$ 5,160$ 88,84910,210CONG. DIST (07)26,753$ 301,283$ 138,727$ 5,375$ 44,527$ -$ 1,733$ 1,621$ 109,2999,280CONG. DIST (08)71,813$ 320,569$ 144,011$ -$ 46,223$ -$ -$ 5,891$ 124,44414,554CONG. DIST (09)43,992$ 280,196$ 131,225$ -$ 42,119$ -$ -$ 3,047$ 103,80410,211ARIZONA (Totals)527,400$ 3,220,905$ 1,409,346$ 21,201$ 343,820$ -$ 108,885$ 36,145$ 1,301,507137,362Notes:* Veteran population estimates, as of September 30, 2013, are produced by the VA Office of the Actuary (VetPop 2011).# Prior to FY 08, "Loan Guaranty" expenditures were included in the Education & Vocational Rehabilitation and Employment (E&VRE) programs. Currently, all "Loan Guaranty" expenditures are attributed to Travis County, TX, where all Loan Guaranty payments are processed. VA will continue to improve data collection for future GDX reports to better distribute loan expenditures at the state, county and congressional district levels.** Unique patients are patients who received treatment at a VA health care facility. Data are provided by the Allocation Resource Center (ARC).Expenditure data sources: USASpending.gov for Compensation & Pension (C&P) and Education and Vocational Rehabilitation and Employment (EVRE) Benefits; Veterans Benefits Administration Insurance Center for the Insurance costs; the VA Financial Management System (FMS) for Construction, Medical Research, General Operating Expenses, and certain C&P and Readjustment data; and the Allocation Resource Center (ARC) for Medical Care costs.1. Expenditures are rounded to the nearest thousand dollars. For example, $500 to $1,000 are rounded to $1; $0 to $499 are rounded to $0; and "$ -" = 0 or no expenditures.2. The Compensation & Pension expenditures include dollars for the following programs: veterans' compensation for service-connected disabilities; dependency and indemnity compensation for service-connected deaths; veterans' pension for nonservice-connected disabilities;
  • 18.
    and burial andother benefits to veterans and their survivors.3. Medical Care expenditures include dollars for medical services, medical administration, facility maintenance, educational support, research support, and other overhead items. Medical Care expenditures do not include dollars for construction or other non-medical support.4. Medical Care expenditures are based on where patients live instead of where care is delivered.5. A star symbol (*) in the Unique Patients column denotes that there were less than 10 Unique Patients. &"Arial,Bold"&11FY13 GEOGRAPHIC DISTRIBUTION OF VA EXPENDITURES (GDX) &8&P of &N CAFY13 Summary of Expenditures by StateExpenditures in $000sCounty/ Congressional DistrictVeteran Population*Total ExpenditureCompensation & PensionConstructionEducation & Vocational Rehabilitation/ EmploymentLoan Guaranty#General Operating ExpensesInsurance & IndemnitiesMedical CareUnique Patients**ALAMEDA57,562$ 431,876$ 148,728$ 412$ 39,667$ -$ 36,087$ 6,375$ 200,60612,989ALPINE148$ 281$ 154$ -$ 23$ -$ -$ -$ 10526AMADOR4,246$ 17,622$ 9,130$ -$ 858$ -$ -$ 216$ 7,419841BUTTE17,399$ 102,264$ 54,609$ -$ 6,372$ -$ -$ 1,410$ 39,8735,127CALAVERAS5,498$ 31,370$ 14,115$ -$ 765$ -$ -$ 368$ 16,1211,535COLUSA1,159$ 6,358$ 3,271$ -$ 307$ -$ - $ 89$ 2,691258CONTRA COSTA53,232$ 328,845$ 131,229$ 19,678$ 29,244$ -$ 6,163$ 5,861$ 136,66911,346DEL NORTE2,507$ 20,092$ 12,606$ -$ 307$ -$ -$ 79$ 7,100824EL DORADO14,939$ 75,919$ 40,673$ -$ 3,952$ -$ -$ 1,407$ 29,8873,236FRESNO43,317$ 344,957$ 137,668$ 2,017$ 28,977$ -$ 2,589$ 2,941$ 170,76613,578GLENN1,801$ 8,216$ 4,743$ -$ 450$ -$ -$ 43$ 2,980477HUMBOLDT10,138$ 87,255$ 40,830$ -$ 2,727$
  • 19.
    -$ -$ 662$43,0364,329IMPERIAL7,560$ 47,842$ 20,525$ -$ 10,198$ -$ -$ 431$ 16,6871,845INYO1,505$ 6,631$ 3,793$ -$ 306$ -$ -$ 195$ 2,337307KERN46,473$ 239,584$ 132,746$ -$ 29,240$ -$ -$ 2,246$ 75,3518,529KINGS12,281$ 63,513$ 31,493$ - $ 12,951$ -$ -$ 559$ 18,5092,096LAKE6,499$ 56,895$ 24,740$ -$ 893$ -$ -$ 197$ 31,0652,435LASSEN3,524$ 15,254$ 8,024$ -$ 558$ -$ -$ 57$ 6,615839LOS ANGELES306,587$ 2,258,286$ 785,919$ 22,465$ 276,771$ -$ 44,287$ 30,188$ 1,098,65772,428MADERA8,187$ 55,851$ 25,386$ -$ 3,406$ -$ -$ 515$ 26,5442,527MARIN12,257$ 61,443$ 23,773$ -$ 3,489$ -$ -$ 2,710$ 31,4722,124MARIPOSA2,091$ 12,400$ 5,970$ -$ 224$ - $ -$ 146$ 6,061612MENDOCINO6,624$ 57,982$ 26,980$ -$ 1,015$ -$ -$ 645$ 29,3422,309MERCED11,174$ 74,930$ 36,479$ 208$ 4,709$ -$ 3,610$ 836$ 29,0883,054MODOC936$ 5,884$ 3,367$ -$ 144$ -$ -$ 29$ 2,344335MONO1,169$ 2,675$ 1,119$ -$ 62$ -$ -$ 69$ 1,425149MONTEREY19,255$ 169,451$ 87,483$ -$ 12,177$ -$ -$ 2,217$ 67,5746,432NAPA9,602$ 51,613$ 26,630$ -$ 3,164$ -$ -$ 1,056$ 20,7632,014NEVADA8,756$ 50,853$ 29,428$ -$ 1,858$ -$ -$ 1,370$ 18,1972,476ORANGE121,992$ 610,243$ 284,205$ -$ 93,466$ -$ -$ 14,129$ 218,44222,117PLACER29,314$ 136,234$ 77,884$ -$ 13,254$ -$ -$ 2,722$ 42,3745,644PLUMAS2,000$ 12,754$ 6,057$ -$ 266$ -$ -$ 137$ 6,294704RIVERSIDE131,854$ 913,653$ 434,732$ 681$ 143,147$ -$ 15,335$ 8,249$ 311,51034,944SACRAMENTO89,529$ 571,186$ 284,597$ - $ 62,077$ -$ -$ 6,296$ 218,21521,297SAN BENITO2,607$ 20,669$ 9,949$ -$ 1,207$ -$ -$ 161$ 9,352797SAN BERNARDINO111,221$ 731,278$ 333,887$ 4,840$ 85,501$ -$ 2,342$ 5,320$ 299,38827,254SAN
  • 20.
    DIEGO224,881$ 2,028,580$ 843,900$5,965$ 487,024$ - $ 65,337$ 21,727$ 604,62661,278SAN FRANCISCO25,267$ 311,906$ 66,088$ 5,915$ 20,438$ - $ 3,944$ 3,468$ 212,0537,335SAN JOAQUIN34,954$ 223,699$ 107,888$ -$ 18,639$ -$ -$ 2,132$ 95,0409,013SAN LUIS OBISPO20,490$ 88,191$ 50,558$ -$ 6,809$ -$ -$ 2,001$ 28,8234,649SAN MATEO27,318$ 239,156$ 58,492$ 15$ 13,417$ -$ 6,838$ 3,472$ 156,9226,772SANTA BARBARA22,818$ 119,647$ 65,163$ -$ 10,781$ -$ -$ 3,050$ 40,6535,259SANTA CLARA58,590$ 559,042$ 145,634$ 82,813$ 34,282$ -$ 5,861$ 8,047$ 282,40514,672SANTA CRUZ11,554$ 85,988$ 38,900$ -$ 4,335$ -$ -$ 1,680$ 41,0723,425SHASTA16,184$ 138,594$ 78,440$ -$ 5,415$ -$ -$ 899$ 53,8396,737SIERRA397$ 2,438$ 716$ -$ 41$ -$ -$ 1$ 1,680105SISKIYOU4,184$ 26,230$ 15,300$ -$ 715$ -$ -$ 137$ 10,0781,561SOLANO33,502$ 289,071$ 164,346$ -$ 33,385$ -$ -$ 3,228$ 88,1128,646SONOMA28,528$ 174,217$ 78,343$ -$ 9,377$ -$ -$ 3,432$ 83,0666,946STANISLAUS25,601$ 172,055$ 84,512$ -$ 12,472$ -$ -$ 1,434$ 73,6376,874SUTTER6,816$ 44,858$ 26,478$ -$ 3,761$ -$ -$ 269$ 14,3501,512TEHAMA5,588$ 31,004$ 14,574$ -$ 860$ -$ -$ 274$ 15,2961,825TRINITY1,504$ 10,040$ 5,049$ -$ 94$ -$ -$ 3$ 4,893543TULARE18,076$ 114,169$ 62,369$ -$ 10,550$ -$ -$ 900$ 40,3505,429TUOLUMNE6,174$ 40,504$ 19,331$ -$ 1,082$ -$ -$ 261$ 19,8292,138VENTURA42,229$ 221,942$ 112,391$ -$ 38,790$ -$ -$ 5,340$ 65,4208,390YOLO9,466$ 54,872$ 30,089$ -$ 7,149$ -$ -$ 898$ 16,7361,916YUBA6,390$ 49,175$ 26,375$ -$ 6,608$ -$ -$ 368$ 15,8231,573CALIFORNIA (Totals)1,795,455$ 12,707,536$ 5,397,860$ 145,008$ 1,599,760$ -$ 192,392$ 162,956$ 5,209,559444,432CONG. DIST (01)62,509$ 405,286$
  • 21.
    222,037$ -$ 18,390$-$ -$ 4,526$ 160,33320,546CONG. DIST (02)44,944$ 302,149$ 138,571$ -$ 11,142$ -$ -$ 5,465$ 146,97112,796CONG. DIST (03)52,654$ 376,557$ 206,320$ -$ 39,029$ -$ -$ 4,339$ 126,86812,971CONG. DIST (04)63,680$ 329,413$ 171,348$ -$ 20,348$ -$ -$ 5,181$ 132,53614,644CONG. DIST (05)44,296$ 325,875$ 162,519$ -$ 25,293$ -$ -$ 4,282$ 133,78211,369CONG. DIST (06)39,096$ 274,734$ 138,434$ -$ 30,435$ -$ -$ 2,406$ 103,4599,957CONG. DIST (07)48,656$ 297,709$ 144,457$ -$ 31,509$ -$ -$ 3,793$ 117,95010,948CONG. DIST (08)56,219$ 364,233$ 160,841$ -$ 40,305$ -$ -$ 2,927$ 160,16014,022CONG. DIST (09)35,627$ 230,033$ 109,029$ -$ 20,315$ -$ -$ 2,455$ 98,2349,372CONG. DIST (10)35,813$ 231,674$ 113,302$ -$ 17,446$ -$ -$ 1,907$ 99,0199,301CONG. DIST (11)36,326$ 220,435$ 85,978$ 19,678$ 19,160$ -$ 6,163$ 4,503$ 84,9547,332CONG. DIST (12)22,017$ 263,980$ 59,494$ 5,915$ 18,399$ -$ 3,944$ 2,986$ 173,2416,534CONG. DIST (13)26,490$ 215,166$ 67,953$ 412$ 18,124$ -$ 36,087$ 3,862$ 88,7276,628CONG. DIST (14)25,233$ 208,866$ 44,154$ -$ 10,655$ -$ -$ 3,186$ 150,8716,383CONG. DIST (15)27,973$ 180,703$ 69,908$ - $ 18,487$ -$ -$ 2,162$ 90,1465,519CONG. DIST (16)28,197$ 252,903$ 108,550$ 2,225$ 18,850$ -$ 6,198$ 1,797$ 115,2829,503CONG. DIST (17)20,505$ 143,305$ 48,808$ -$ 11,943$ -$ -$ 2,801$ 79,7534,754CONG. DIST (18)30,144$ 257,486$ 77,791$ 15$ 17,080$ -$ 6,838$ 5,290$ 150,4726,592CONG. DIST (19)21,637$ 276,050$ 61,773$ 82,813$ 14,540$ -$ 5,861$ 1,693$ 109,3706,307CONG. DIST (20)30,717$ 262,241$ 129,005$ -$ 17,102$ -$ -$ 3,681$ 112,45310,059CONG. DIST (21)26,081$ 153,546$ 75,918$ -$ 22,521$ -$ -$ 1,346$ 53,7625,478CONG. DIST (22)36,523$ 239,808$ 109,793$ -$ 21,079$ -$ -$ 2,300$ 106,63710,642CONG. DIST (23)49,431$ 228,777$ 122,859$ -$ 27,290$ -$ -$ 2,809$ 75,8189,293CONG.
  • 22.
    DIST (24)43,859$ 212,076$117,877$ -$ 18,333$ -$ -$ 5,141$ 70,72510,074CONG. DIST (25)32,247$ 140,002$ 55,909$ -$ 19,566$ -$ -$ 2,106$ 62,4216,528CONG. DIST (26)36,223$ 184,720$ 93,033$ -$ 32,113$ -$ -$ 5,046$ 54,5287,258CONG. DIST (27)25,022$ 84,045$ 30,140$ -$ 10,439$ -$ -$ 3,223$ 40,2433,653CONG. DIST (28)19,751$ 115,567$ 41,763$ -$ 14,707$ -$ -$ 2,462$ 56,6353,875CONG. DIST (29)13,951$ 163,363$ 60,053$ -$ 21,148$ -$ -$ 1,044$ 81,1184,350CONG. DIST (30)26,753$ 176,289$ 53,618$ -$ 18,881$ -$ -$ 4,039$ 99,7515,505CONG. DIST (31)33,232$ 270,630$ 122,802$ 4,840$ 31,447$ -$ 2,342$ 1,646$ 107,5548,711CONG. DIST (32)21,251$ 91,626$ 33,330$ -$ 11,738$ -$ -$ 1,237$ 45,3214,263CONG. DIST (33)30,853$ 327,263$ 94,020$ 22,465$ 33,110$ -$ 44,287$ 6,182$ 127,1995,781CONG. DIST (34)12,159$ 123,506$ 45,312$ -$ 15,957$ -$ -$ 994$ 61,2423,918CONG. DIST (35)22,029$ 123,839$ 55,799$ -$ 14,954$ -$ -$ 767$ 52,3185,084CONG. DIST (36)50,813$ 338,099$ 155,472$ 681$ 51,160$ -$ 15,335$ 3,892$ 111,55914,248CONG. DIST (37)21,203$ 256,753$ 94,321$ -$ 33,216$ -$ -$ 1,825$ 127,3906,938CONG. DIST (38)25,925$ 130,262$ 47,744$ -$ 16,784$ -$ -$ 1,654$ 64,0805,793CONG. DIST (39)26,453$ 104,000$ 46,785$ -$ 15,213$ -$ -$ 2,356$ 39,6464,345CONG. DIST (40)9,865$ 77,370$ 28,454$ -$ 10,020$ -$ -$ 390$ 38,5062,705CONG. DIST (41)31,740$ 298,857$ 142,177$ - $ 46,813$ -$ -$ 1,742$ 108,1258,101CONG. DIST (42)43,671$ 254,278$ 123,168$ -$ 40,556$ -$ -$ 2,156$ 88,39711,081CONG. DIST (43)25,238$ 203,521$ 74,600$ -$ 26,271$ -$ -$ 1,706$ 100,9436,461CONG. DIST (44)16,879$ 137,000$ 50,439$ -$ 17,763$ -$ -$ 552$ 68,2464,736CONG. DIST (45)30,863$ 122,766$ 53,183$ -$ 17,490$ -$ -$ 3,834$ 48,2595,141CONG. DIST (46)16,925$ 124,391$ 58,681$ -$ 19,298$ -$ -$ 1,493$ 44,9193,869CONG. DIST (47)31,795$ 297,459$
  • 23.
    117,702$ -$ 40,525$-$ -$ 3,445$ 135,7868,902CONG. DIST (48)34,336$ 171,895$ 79,787$ -$ 26,240$ -$ -$ 4,541$ 61,3276,084CONG. DIST (49)46,947$ 326,305$ 142,204$ -$ 78,562$ -$ -$ 6,087$ 99,45211,697CONG. DIST (50)52,961$ 424,928$ 187,154$ -$ 104,464$ -$ -$ 3,640$ 129,66913,322CONG. DIST (51)33,970$ 364,291$ 159,196$ -$ 90,227$ -$ -$ 2,656$ 112,21311,030CONG. DIST (52)53,543$ 406,321$ 176,296$ -$ 101,742$ -$ -$ 6,395$ 121,88812,918CONG. DIST (53)60,231$ 615,184$ 227,998$ 5,965$ 131,580$ -$ 65,337$ 5,004$ 179,30017,111CALIFORNIA (Totals)1,795,455$ 12,707,536$ 5,397,860$ 145,008$ 1,599,760$ -$ 192,392$ 162,956$ 5,209,559444,432Notes:* Veteran population estimates, as of September 30, 2013, are produced by the VA Office of the Actuary (VetPop 2011).# Prior to FY 08, "Loan Guaranty" expenditures were included in the Education & Vocational Rehabilitation and Employment (E&VRE) programs. Currently, all "Loan Guaranty" expenditures are attributed to Travis County, TX, where all Loan Guaranty payments are processed. VA will continue to improve data collection for future GDX reports to better distribute loan expenditures at the state, county and congressional district levels.** Unique patients are patients who received treatment at a VA health care facility. Data are provided by the Allocation Resource Center (ARC).Expenditure data sources: USASpending.gov for Compensation & Pension (C&P) and Education and Vocational Rehabilitation and Employment (EVRE) Benefits; Veterans Benefits Administration Insurance Center for the Insurance costs; the VA Financial Management System (FMS) for Construction, Medical Research, General Operating Expenses, and certain C&P and Readjustment data; and the Allocation Resource Center (ARC) for Medical Care costs.1. Expenditures are rounded to the nearest thousand dollars. For example, $500 to $1,000 are rounded to $1; $0 to $499 are rounded to $0; and "$ -" = 0 or no expenditures.2. The Compensation & Pension expenditures include dollars for the following programs:
  • 24.
    veterans' compensation forservice-connected disabilities; dependency and indemnity compensation for service-connected deaths; veterans' pension for nonservice-connected disabilities; and burial and other benefits to veterans and their survivors.3. Medical Care expenditures include dollars for medical services, medical administration, facility maintenance, educational support, research support, and other overhead items. Medical Care expenditures do not include dollars for construction or other non-medical support.4. Medical Care expenditures are based on where patients live instead of where care is delivered.5. A star symbol (*) in the Unique Patients column denotes that there were less than 10 Unique Patients. &"Arial,Bold"&11FY13 GEOGRAPHIC DISTRIBUTION OF VA EXPENDITURES (GDX) &8&P of &N COFY13 Summary of Expenditures by StateExpenditures in $000sCounty/ Congressional DistrictVeteran Population*Total ExpenditureCompensation & PensionConstructionEducation & Vocational Rehabilitation/ EmploymentLoan Guaranty#General Operating ExpensesInsurance & IndemnitiesMedical CareUnique Patients**ADAMS28,607$ 164,982$ 73,056$ - $ 22,153$ -$ -$ 1,136$ 68,6385,954ALAMOSA1,004$ 7,836$ 4,107$ -$ 334$ -$ -$ 58$ 3,338406ARAPAHOE42,056$ 234,403$ 110,054$ -$ 33,656$ -$ -$ 3,542$ 87,1528,700ARCHULETA959$ 7,496$ 4,153$ -$ 176$ -$ -$ 172$ 2,994427BACA359$ 1,643$ 774$ -$ 30$ -$ -$ 93$ 74691BENT549$ 6,242$ 3,031$ 157$ 87$ -$ -$ 2$ 2,966229BOULDER16,105$ 57,568$ 27,617$ -$ 11,227$ -$ -$ 2,044$ 16,6792,109BROOMFIELD3,196$ 16,368$ 9,131$ -$ 2,789$ -$ -$ 362$ 4,086558CHAFFEE1,886$ 6,957$ 4,115$ -$ 292$ -$ -$ 115$ 2,435473CHEYENNE150$ 522$ 223$ -$ -$ -$ -$ 1$ 29738CLEAR CREEK847$ 2,440$ 1,310$ -$ 43$ -$ -$
  • 25.
    48$ 1,040157CONEJOS567$ 4,392$3,012$ -$ 105$ -$ -$ 14$ 1,260223COSTILLA317$ 4,471$ 1,984$ -$ 67$ -$ -$ 21$ 2,398194CROWLEY545$ 2,801$ 1,700$ -$ 44$ -$ -$ 1$ 1,056128CUSTER491$ 3,251$ 2,232$ -$ 27$ -$ -$ 2$ 989165DELTA3,022$ 22,799$ 9,085$ -$ 362$ -$ -$ 102$ 13,2501,239DENVER30,437$ 392,751$ 86,526$ 110,541$ 26,210$ -$ 27,504$ 3,737$ 138,2338,953DOLORES184$ 799$ 553$ -$ -$ -$ -$ 26$ 21955DOUGLAS20,241$ 73,866$ 41,731$ -$ 12,743$ -$ -$ 1,386$ 18,0062,556EAGLE2,141$ 4,172$ 2,153$ -$ 252$ -$ -$ 166$ 1,601273ELBERT2,251$ 7,752$ 3,583$ -$ 771$ -$ -$ 92$ 3,306357EL PASO77,091$ 656,941$ 396,110$ -$ 140,152$ -$ -$ 7,936$ 112,74317,757FREMONT6,824$ 33,775$ 19,320$ - $ 1,512$ -$ -$ 321$ 12,6221,474GARFIELD3,541$ 15,785$ 6,253$ -$ 612$ -$ -$ 186$ 8,734964GILPIN414$ 2,373$ 1,519$ -$ 64$ -$ -$ 52$ 73996GRAND1,029$ 4,403$ 2,163$ -$ 31$ -$ -$ 29$ 2,181229GUNNISON957$ 3,883$ 1,506$ -$ 426$ -$ -$ 83$ 1,868210HINSDALE72$ 259$ 206$ -$ 3$ -$ -$ 3$ 4713HUERFANO956$ 7,408$ 4,368$ -$ 136$ -$ -$ 22$ 2,883338JACKSON159$ 588$ 354$ -$ -$ -$ -$ 4$ 23035JEFFERSON40,361$ 225,190$ 92,951$ 147$ 26,127$ -$ 34,675$ 3,783$ 67,5087,033KIOWA119$ 335$ 199$ -$ 34$ -$ -$ -$ 10223KIT CARSON647$ 2,259$ 887$ -$ 59$ -$ -$ 34$ 1,279178LAKE512$ 1,952$ 998$ -$ 180$ -$ -$ 60$ 71487LA PLATA4,157$ 16,719$ 9,373$ -$ 975$ -$ -$ 611$ 5,7601,085LARIMER21,358$ 116,926$ 58,554$ -$ 15,585$ -$ -$ 2,158$ 40,6295,233LAS ANIMAS1,391$ 10,746$ 6,233$ -$ 401$ -$ -$ 39$ 4,073536LINCOLN578$ 1,717$ 891$ -$ 44$ -$ -$ 25$ 75686LOGAN1,701$ 6,249$ 2,562$ -$ 331$ -$ -$ 151$ 3,205371MESA13,815$ 128,788$ 40,411$ 1,769$ 5,329$ -$ 676$ 619$ 79,9856,076MINERAL94$ 306$ 202$ -$ 16$ -$ -$ -$ 8830MOFFAT1,179$ 5,179$
  • 26.
    1,888$ -$ 236$-$ -$ 26$ 3,029320MONTEZUMA2,358$ 9,857$ 5,480$ -$ 315$ -$ -$ 81$ 3,981636MONTROSE3,554$ 22,821$ 9,146$ -$ 529$ -$ -$ 392$ 12,7541,376MORGAN1,719$ 6,834$ 3,411$ -$ 289$ -$ -$ 86$ 3,048424OTERO1,686$ 17,041$ 10,763$ -$ 422$ -$ -$ 42$ 5,815580OURAY416$ 1,254$ 370$ -$ 78$ -$ -$ 36$ 769112PARK1,772$ 9,685$ 5,512$ -$ 321$ -$ -$ 19$ 3,834407PHILLIPS311$ 936$ 422$ -$ 1$ -$ -$ 32$ 48173PITKIN903$ 1,707$ 776$ -$ 1$ -$ -$ 153$ 777103PROWERS779$ 4,537$ 2,519$ -$ 178$ -$ -$ 7$ 1,834263PUEBLO15,923$ 127,204$ 69,175$ -$ 7,004$ -$ -$ 727$ 50,2975,133RIO BLANCO568$ 2,814$ 1,201$ -$ 121$ -$ -$ 4$ 1,489164RIO GRANDE1,063$ 6,598$ 4,404$ -$ 106$ -$ -$ 33$ 2,056380ROUTT1,292$ 4,041$ 2,058$ -$ 278$ -$ -$ 104$ 1,602248SAGUACHE463$ 1,479$ 810$ -$ 8$ -$ -$ 32$ 629160SAN JUAN85$ 194$ 58$ -$ 16$ -$ -$ 1$ 11919SAN MIGUEL391$ 1,172$ 471$ -$ 55$ -$ -$ 16$ 62993SEDGWICK273$ 1,456$ 651$ -$ 38$ -$ -$ 11$ 75693SUMMIT1,252$ 3,021$ 1,596$ -$ 208$ -$ - $ 157$ 1,061159TELLER2,990$ 18,228$ 12,520$ -$ 1,376$ -$ -$ 150$ 4,182663WASHINGTON408$ 2,011$ 665$ -$ 56$ -$ -$ 2$ 1,28894WELD19,036$ 84,670$ 42,036$ -$ 9,223$ -$ -$ 1,122$ 32,2894,064YUMA713$ 1,828$ 1,020$ -$ 107$ -$ -$ 19$ 682119COLORADO (Totals)390,824$ 2,594,677$ 1,212,143$ 112,614$ 324,347$ -$ 62,854$ 32,483$ 850,23590,822CONG. DIST (01)38,739$ 431,643$ 105,011$ 110,541$ 31,671$ -$ 27,504$ 4,649$ 152,26810,538CONG. DIST (02)45,418$ 201,288$ 101,327$ -$ 27,253$ -$ -$ 4,997$ 67,7118,692CONG. DIST (03)60,484$ 413,936$ 186,101$ 1,769$ 17,666$ -$ 676$ 3,746$ 203,97820,488CONG. DIST (04)54,574$ 253,219$ 131,598$ 157$ 28,797$ -$ - $ 3,257$ 89,41010,907CONG. DIST (05)89,827$ 720,265$ 434,546$ -$ 143,475$ -$ -$ 8,527$
  • 27.
    133,71720,589CONG. DIST (06)50,353$270,698$ 127,254$ 38,859$ -$ 3,999$ 100,5869,924CONG. DIST (07)51,428$ 303,629$ 126,306$ 147$ 36,627$ -$ 34,675$ 3,309$ 102,5659,684COLORADO (Totals)390,824$ 2,594,677$ 1,212,143$ 112,614$ 324,347$ -$ 62,854$ 32,483$ 850,23590,822Notes:* Veteran population estimates, as of September 30, 2013, are produced by the VA Office of the Actuary (VetPop 2011).# Prior to FY 08, "Loan Guaranty" expenditures were included in the Education & Vocational Rehabilitation and Employment (E&VRE) programs. Currently, all "Loan Guaranty" expenditures are attributed to Travis County, TX, where all Loan Guaranty payments are processed. VA will continue to improve data collection for future GDX reports to better distribute loan expenditures at the state, county and congressional district levels.** Unique patients are patients who received treatment at a VA health care facility. Data are provided by the Allocation Resource Center (ARC).Expenditure data sources: USASpending.gov for Compensation & Pension (C&P) and Education and Vocational Rehabilitation and Employment (EVRE) Benefits; Veterans Benefits Administration Insurance Center for the Insurance costs; the VA Financial Management System (FMS) for Construction, Medical Research, General Operating Expenses, and certain C&P and Readjustment data; and the Allocation Resource Center (ARC) for Medical Care costs.1. Expenditures are rounded to the nearest thousand dollars. For example, $500 to $1,000 are rounded to $1; $0 to $499 are rounded to $0; and "$ -" = 0 or no expenditures.2. The Compensation & Pension expenditures include dollars for the following programs: veterans' compensation for service-connected disabilities; dependency and indemnity compensation for service-connected deaths; veterans' pension for nonservice-connected disabilities; and burial and other benefits to veterans and their survivors.3. Medical Care expenditures include dollars for medical services, medical administration, facility maintenance, educational support, research support, and other overhead items. Medical
  • 28.
    Care expenditures donot include dollars for construction or other non-medical support.4. Medical Care expenditures are based on where patients live instead of where care is delivered.5. A star symbol (*) in the Unique Patients column denotes that there were less than 10 Unique Patients. &"Arial,Bold"&11FY13 GEOGRAPHIC DISTRIBUTION OF VA EXPENDITURES (GDX) &8&P of &N CTFY13 Summary of Expenditures by StateExpenditures in $000sCounty/ Congressional DistrictVeteran Population*Total ExpenditureCompensation & PensionConstructionEducation & Vocational Rehabilitation/ EmploymentLoan Guaranty#General Operating ExpensesInsurance & IndemnitiesMedical CareUnique Patients**FAIRFIELD38,650$ 155,181$ 51,228$ -$ 14,442$ -$ -$ 7,106$ 82,4058,607HARTFORD51,906$ 254,624$ 95,704$ 6$ 22,027$ -$ 11,297$ 6,087$ 119,50412,970LITCHFIELD14,246$ 55,016$ 21,892$ -$ 4,063$ -$ -$ 988$ 28,0733,485MIDDLESEX11,714$ 52,009$ 18,892$ -$ 4,169$ -$ -$ 1,225$ 27,7232,653NEW HAVEN46,974$ 384,486$ 94,344$ 8,326$ 26,035$ -$ 2,497$ 4,897$ 248,38614,502NEW LONDON25,046$ 103,410$ 51,314$ -$ 15,973$ -$ -$ 2,460$ 33,6635,087TOLLAND9,810$ 36,391$ 14,874$ -$ 5,259$ -$ -$ 1,033$ 15,2262,098WINDHAM9,414$ 37,450$ 17,391$ -$ 4,448$ -$ -$ 398$ 15,2131,958CONNECTICUT (Totals)207,759$ 1,078,567$ 365,638$ 8,332$ 96,416$ -$ 13,794$ 24,195$ 570,19251,360CONG. DIST (01)41,676$ 215,828$ 80,387$ 6$ 18,278$ -$ 11,297$ 4,822$ 101,03810,911CONG. DIST (02)57,368$ 221,956$ 99,748$ -$ 29,347$ -$ -$ 5,209$ 87,65211,802CONG. DIST (03)39,579$ 354,985$ 89,346$ 8,326$ 24,351$ -$ 2,497$ 4,171$ 226,29412,494CONG. DIST (04)28,142$ 116,516$ 37,995$ -$ 10,705$ -$ -$ 5,868$ 61,9486,088CONG. DIST
  • 29.
    (05)40,994$ 169,282$ 58,162$-$ 13,735$ -$ -$ 4,126$ 93,25910,065CONNECTICUT (Totals)207,759$ 1,078,567$ 365,638$ 8,332$ 96,416$ -$ 13,794$ 24,195$ 570,19251,360Notes:* Veteran population estimates, as of September 30, 2013, are produced by the VA Office of the Actuary (VetPop 2011).# Prior to FY 08, "Loan Guaranty" expenditures were included in the Education & Vocational Rehabilitation and Employment (E&VRE) programs. Currently, all "Loan Guaranty" expenditures are attributed to Travis County, TX, where all Loan Guaranty payments are processed. VA will continue to improve data collection for future GDX reports to better distribute loan expenditures at the state, county and congressional district levels.** Unique patients are patients who received treatment at a VA health care facility. Data are provided by the Allocation Resource Center (ARC).Expenditure data sources: USASpending.gov for Compensation & Pension (C&P) and Education and Vocational Rehabilitation and Employment (EVRE) Benefits; Veterans Benefits Administration Insurance Center for the Insurance costs; the VA Financial Management System (FMS) for Construction, Medical Research, General Operating Expenses, and certain C&P and Readjustment data; and the Allocation Resource Center (ARC) for Medical Care costs.1. Expenditures are rounded to the nearest thousand dollars. For example, $500 to $1,000 are rounded to $1; $0 to $499 are rounded to $0; and "$ -" = 0 or no expenditures.2. The Compensation & Pension expenditures include dollars for the following programs: veterans' compensation for service-connected disabilities; dependency and indemnity compensation for service-connected deaths; veterans' pension for nonservice-connected disabilities; and burial and other benefits to veterans and their survivors.3. Medical Care expenditures include dollars for medical services, medical administration, facility maintenance, educational support, research support, and other overhead items. Medical Care expenditures do not include dollars for construction or other non-medical support.4. Medical Care expenditures are
  • 30.
    based on wherepatients live instead of where care is delivered.5. A star symbol (*) in the Unique Patients column denotes that there were less than 10 Unique Patients. &"Arial,Bold"&11FY13 GEOGRAPHIC DISTRIBUTION OF VA EXPENDITURES (GDX) &8&P of &N DCFY13 Summary of Expenditures by StateExpenditures in $000sCounty/ Congressional DistrictVeteran Population*Total ExpenditureCompensation & PensionConstructionEducation & Vocational Rehabilitation/ EmploymentLoan Guaranty#General Operating ExpensesInsurance & IndemnitiesMedical CareUnique Patients**DISTRICT OF COLUMBIA31,166$ 2,295,599$ 78,699$ 153,310$ 31,054$ -$ 1,825,604$ 2,785$ 204,1468,800DC (Totals)31,166$ 2,295,599$ 78,699$ 153,310$ 31,054$ -$ 1,825,604$ 2,785$ 204,1468,800CONG. DIST (01)31,166$ 2,295,599$ 78,699$ 153,310$ 31,054$ -$ 1,825,604$ 2,785$ 204,1468,800DC (Totals)31,166$ 2,295,599$ 78,699$ 153,310$ 31,054$ -$ 1,825,604$ 2,785$ 204,1468,800Notes:* Veteran population estimates, as of September 30, 2013, are produced by the VA Office of the Actuary (VetPop 2011).# Prior to FY 08, "Loan Guaranty" expenditures were included in the Education & Vocational Rehabilitation and Employment (E&VRE) programs. Currently, all "Loan Guaranty" expenditures are attributed to Travis County, TX, where all Loan Guaranty payments are processed. VA will continue to improve data collection for future GDX reports to better distribute loan expenditures at the state, county and congressional district levels.** Unique patients are patients who received treatment at a VA health care facility. Data are provided by the Allocation Resource Center (ARC).Expenditure data sources: USASpending.gov for Compensation & Pension (C&P) and Education and Vocational Rehabilitation and Employment (EVRE) Benefits; Veterans Benefits Administration Insurance Center for the Insurance
  • 31.
    costs; the VAFinancial Management System (FMS) for Construction, Medical Research, General Operating Expenses, and certain C&P and Readjustment data; and the Allocation Resource Center (ARC) for Medical Care costs.1. Expenditures are rounded to the nearest thousand dollars. For example, $500 to $1,000 are rounded to $1; $0 to $499 are rounded to $0; and "$ -" = 0 or no expenditures.2. The Compensation & Pension expenditures include dollars for the following programs: veterans' compensation for service-connected disabilities; dependency and indemnity compensation for service-connected deaths; veterans' pension for nonservice-connected disabilities; and burial and other benefits to veterans and their survivors.3. Medical Care expenditures include dollars for medical services, medical administration, facility maintenance, educational support, research support, and other overhead items. Medical Care expenditures do not include dollars for construction or other non-medical support.4. Medical Care expenditures are based on where patients live instead of where care is delivered.5. A star symbol (*) in the Unique Patients column denotes that there were less than 10 Unique Patients. &"Arial,Bold"&11FY13 GEOGRAPHIC DISTRIBUTION OF VA EXPENDITURES (GDX) &8&P of &N DEFY13 Summary of Expenditures by StateExpenditures in $000sCounty/ Congressional DistrictVeteran Population*Total ExpenditureCompensation & PensionConstructionEducation & Vocational Rehabilitation/ EmploymentLoan Guaranty#General Operating ExpensesInsurance & IndemnitiesMedical CareUnique Patients**KENT19,358$ 98,918$ 56,417$ -$ 15,470$ -$ -$ 1,225$ 25,8063,521NEW CASTLE36,166$ 192,800$ 74,158$ 859$ 15,158$ -$ 3,895$ 2,882$ 95,8497,432SUSSEX22,493$ 70,899$ 39,389$ -$ 3,703$ -$ -$ 1,488$ 26,3193,723DELAWARE (Totals)78,016$ 362,617$ 169,963$ 859$ 34,331$ -$ 3,895$ 5,595$
  • 32.
    147,97414,676CONG. DIST (01)78,016$362,617$ 169,963$ 859$ 34,331$ -$ 3,895$ 5,595$ 147,97414,676DELAWARE (Totals)78,016$ 362,617$ 169,963$ 859$ 34,331$ -$ 3,895$ 5,595$ 147,97414,676Notes:* Veteran population estimates, as of September 30, 2013, are produced by the VA Office of the Actuary (VetPop 2011).# Prior to FY 08, "Loan Guaranty" expenditures were included in the Education & Vocational Rehabilitation and Employment (E&VRE) programs. Currently, all "Loan Guaranty" expenditures are attributed to Travis County, TX, where all Loan Guaranty payments are processed. VA will continue to improve data collection for future GDX reports to better distribute loan expenditures at the state, county and congressional district levels.** Unique patients are patients who received treatment at a VA health care facility. Data are provided by the Allocation Resource Center (ARC).Expenditure data sources: USASpending.gov for Compensation & Pension (C&P) and Education and Vocational Rehabilitation and Employment (EVRE) Benefits; Veterans Benefits Administration Insurance Center for the Insurance costs; the VA Financial Management System (FMS) for Construction, Medical Research, General Operating Expenses, and certain C&P and Readjustment data; and the Allocation Resource Center (ARC) for Medical Care costs.1. Expenditures are rounded to the nearest thousand dollars. For example, $500 to $1,000 are rounded to $1; $0 to $499 are rounded to $0; and "$ -" = 0 or no expenditures.2. The Compensation & Pension expenditures include dollars for the following programs: veterans' compensation for service-connected disabilities; dependency and indemnity compensation for service-connected deaths; veterans' pension for nonservice-connected disabilities; and burial and other benefits to veterans and their survivors.4. Medical Care expenditures are based on where patients live instead of where care is delivered.5. A star symbol (*) in the Unique Patients column denotes that there were less than 10 Unique Patients.
  • 33.
    &"Arial,Bold"&11FY13 GEOGRAPHIC DISTRIBUTIONOF VA EXPENDITURES (GDX) &8&P of &N FLFY13 Summary of Expenditures by StateExpenditures in $000sCounty/ Congressional DistrictVeteran Population*Total ExpenditureCompensation & PensionConstructionEducation & Vocational Rehabilitation/ EmploymentLoan Guaranty#General Operating ExpensesInsurance & IndemnitiesMedical CareUnique Patients**ALACHUA17,505$ 209,158$ 56,996$ 623$ 12,225$ -$ 6,581$ 1,468$ 131,2657,419BAKER2,625$ 14,746$ 5,620$ -$ 719$ -$ -$ 105$ 8,302635BAY22,405$ 134,321$ 93,443$ -$ 11,614$ -$ -$ 2,241$ 27,0225,307BRADFORD4,033$ 24,398$ 6,945$ -$ 678$ -$ -$ 130$ 16,645966BREVARD65,116$ 432,556$ 248,823$ -$ 32,973$ -$ -$ 6,008$ 144,75121,585BROWARD84,388$ 522,109$ 237,590$ -$ 63,756$ -$ -$ 9,246$ 211,51724,071CALHOUN1,207$ 7,394$ 3,897$ -$ 257$ - $ -$ 101$ 3,139371CHARLOTTE19,138$ 112,140$ 62,019$ -$ 3,123$ -$ -$ 1,526$ 45,4726,491CITRUS26,022$ 121,138$ 58,373$ -$ 3,075$ -$ -$ 1,443$ 58,2467,693CLAY28,748$ 169,881$ 91,815$ -$ 27,625$ -$ -$ 2,458$ 47,9846,092COLLIER27,056$ 87,402$ 49,358$ -$ 4,787$ -$ -$ 3,056$ 30,2005,917COLUMBIA7,713$ 98,910$ 28,666$ -$ 1,607$ -$ -$ 486$ 68,1513,599DE SOTO2,412$ 12,549$ 6,475$ -$ 292$ -$ -$ 48$ 5,734715DIXIE1,599$ 19,246$ 6,111$ -$ 141$ -$ -$ 179$ 12,815849DUVAL97,642$ 525,661$ 249,926$ -$ 105,874$ -$ -$ 5,792$ 164,06921,901ESCAMBIA40,851$ 248,454$ 153,890$ 26$ 25,337$ -$ 1,681$ 3,263$ 64,25710,386FLAGLER11,480$ 55,295$ 30,327$ -$ 4,961$ -$ -$ 807$ 19,2003,357FRANKLIN1,487$ 5,592$ 2,926$ -$ 134$ -$ -$ 24$ 2,507377GADSDEN3,786$
  • 34.
    23,331$ 11,354$ -$1,184$ -$ -$ 247$ 10,5461,348GILCHRIST1,559$ 15,918$ 5,684$ -$ 385$ - $ -$ 84$ 9,765697GLADES971$ 5,305$ 1,365$ -$ 28$ -$ -$ 14$ 3,897360GULF1,772$ 8,331$ 5,794$ -$ 337$ -$ -$ 82$ 2,118427HAMILTON1,229$ 11,770$ 4,459$ -$ 191$ -$ -$ 6$ 7,113484HARDEE1,457$ 7,832$ 3,818$ -$ 266$ -$ -$ 65$ 3,683355HENDRY1,823$ 11,881$ 6,012$ -$ 561$ -$ -$ 15$ 5,292603HERNANDO21,501$ 145,603$ 77,800$ -$ 6,089$ -$ -$ 1,231$ 60,4837,832HIGHLANDS9,887$ 67,682$ 32,871$ -$ 1,630$ -$ -$ 880$ 32,3023,712HILLSBOROUGH92,584$ 911,730$ 339,886$ 23,950$ 96,756$ -$ 6,900$ 7,473$ 436,76531,247HOLMES2,008$ 15,529$ 11,483$ -$ 427$ -$ -$ 32$ 3,587599INDIAN RIVER14,122$ 73,022$ 40,464$ -$ 2,815$ -$ -$ 1,690$ 28,0534,724JACKSON4,970$ 30,586$ 17,663$ -$ 1,184$ -$ -$ 165$ 11,5731,591JEFFERSON1,429$ 7,625$ 4,000$ -$ 312$ -$ -$ 270$ 3,043462LAFAYETTE720$ 4,664$ 1,259$ -$ 71$ -$ -$ 6$ 3,329231LAKE32,329$ 185,979$ 96,116$ -$ 7,425$ -$ -$ 2,550$ 79,88711,246LEE53,892$ 269,168$ 136,912$ -$ 15,562$ -$ -$ 4,687$ 112,00717,910LEON18,510$ 93,813$ 42,816$ -$ 12,425$ -$ -$ 1,803$ 36,7695,133LEVY4,555$ 46,490$ 14,005$ -$ 818$ -$ - $ 320$ 31,3462,190LIBERTY644$ 2,503$ 1,424$ -$ 50$ -$ -$ 1$ 1,028158MADISON1,853$ 12,456$ 5,058$ -$ 360$ -$ -$ 264$ 6,775575MANATEE30,009$ 163,663$ 83,671$ -$ 9,002$ -$ -$ 2,852$ 68,1389,799MARION45,745$ 260,849$ 108,390$ -$ 8,325$ -$ -$ 3,415$ 140,71915,582MARTIN14,001$ 78,081$ 36,242$ -$ 2,377$ -$ -$ 2,278$ 37,1855,148MIAMI-DADE61,552$ 565,773$ 193,350$ 12,557$ 69,310$ -$ 3,119$ 3,824$ 283,61417,727MONROE7,887$ 47,807$ 21,189$ -$ 4,594$ -$ -$ 466$ 21,5582,479NASSAU8,744$ 38,731$
  • 35.
    19,776$ -$ 3,861$-$ -$ 538$ 14,5551,830OKALOOSA32,208$ 212,049$ 148,217$ -$ 28,834$ -$ -$ 4,899$ 30,0996,109OKEECHOBEE3,141$ 26,909$ 12,166$ -$ 414$ -$ -$ 55$ 14,2751,351ORANGE67,832$ 535,158$ 234,597$ -$ 81,344$ -$ 14$ 6,566$ 212,63621,998OSCEOLA17,152$ 140,667$ 69,464$ -$ 14,082$ -$ -$ 700$ 56,4226,092PALM BEACH76,947$ 575,963$ 217,606$ 325$ 34,841$ -$ 7,570$ 15,647$ 299,97432,712PASCO50,568$ 361,217$ 162,106$ -$ 21,456$ -$ -$ 3,632$ 174,02418,172PINELLAS86,504$ 983,756$ 309,891$ 94,239$ 38,122$ -$ 114,420$ 8,704$ 418,38032,921POLK53,918$ 301,135$ 146,151$ -$ 17,291$ -$ -$ 3,762$ 133,93114,781PUTNAM7,766$ 61,308$ 22,307$ -$ 1,598$ -$ -$ 381$ 37,0223,163SAINT JOHNS20,424$ 89,230$ 47,757$ -$ 8,961$ -$ 35$ 2,121$ 30,3574,789SAINT LUCIE22,893$ 161,357$ 75,632$ -$ 8,205$ -$ -$ 1,594$ 75,9279,125SANTA ROSA22,809$ 144,231$ 100,027$ -$ 17,250$ -$ -$ 1,935$ 25,0204,821SARASOTA38,130$ 183,846$ 100,138$ -$ 8,588$ -$ -$ 5,537$ 69,58312,047SEMINOLE30,363$ 193,037$ 91,037$ -$ 20,924$ -$ -$ 3,204$ 77,8728,790SUMTER14,557$ 87,274$ 42,398$ 151$ 761$ -$ 5,770$ 1,217$ 36,9766,276SUWANNEE4,625$ 40,475$ 13,773$ -$ 726$ -$ -$ 380$ 25,5961,875TAYLOR2,108$ 14,529$ 6,122$ -$ 285$ -$ -$ 197$ 7,924769UNION1,718$ 9,006$ 3,342$ -$ 243$ -$ -$ 7$ 5,414377VOLUSIA53,789$ 342,868$ 171,981$ -$ 40,020$ -$ -$ 4,668$ 126,20017,849WAKULLA3,338$ 14,980$ 8,074$ -$ 904$ -$ -$ 32$ 5,970889WALTON6,274$ 29,731$ 19,117$ -$ 1,645$ -$ -$ 635$ 8,3341,421WASHINGTON2,530$ 14,974$ 10,304$ -$ 535$ -$ -$ 129$ 4,005686FLORIDA (Totals)1,520,563$ 10,430,774$ 4,728,273$ 131,870$ 892,555$ -$ 146,088$ 139,645$ 4,392,344479,193CONG. DIST (01)103,294$ 645,506$
  • 36.
    429,425$ 26$ 73,369$-$ 1,681$ 10,748$ 130,25723,118CONG. DIST (02)65,422$ 364,646$ 212,017$ -$ 29,409$ -$ -$ 5,342$ 117,87717,850CONG. DIST (03)79,723$ 626,483$ 230,873$ 623$ 40,278$ -$ 6,581$ 6,763$ 341,36525,716CONG. DIST (04)83,393$ 360,345$ 170,593$ -$ 66,089$ -$ -$ 5,147$ 118,51516,135CONG. DIST (05)52,800$ 512,043$ 223,987$ -$ 76,086$ -$ -$ 3,748$ 208,22219,009CONG. DIST (06)78,226$ 438,467$ 219,755$ -$ 44,512$ -$ 35$ 6,950$ 167,21524,168CONG. DIST (07)52,587$ 372,960$ 174,978$ -$ 46,275$ -$ -$ 4,985$ 146,72215,714CONG. DIST (08)80,618$ 514,939$ 293,426$ -$ 37,222$ -$ -$ 7,732$ 176,55926,733CONG. DIST (09)42,715$ 328,351$ 152,506$ -$ 39,982$ -$ 14$ 2,773$ 133,07614,869CONG. DIST (10)57,903$ 330,217$ 154,761$ -$ 26,102$ -$ -$ 4,777$ 144,57817,368CONG. DIST (11)101,477$ 576,182$ 273,110$ 151$ 17,194$ -$ 5,770$ 6,332$ 273,62635,566CONG. DIST (12)70,391$ 467,047$ 203,561$ -$ 29,726$ -$ -$ 5,508$ 228,25224,039CONG. DIST (13)67,413$ 829,471$ 248,721$ 94,239$ 30,597$ -$ 114,420$ 6,747$ 334,74725,798CONG. DIST (14)47,593$ 600,009$ 223,762$ 23,950$ 57,343$ -$ 6,900$ 3,684$ 284,37018,465CONG. DIST (15)57,149$ 429,002$ 182,153$ -$ 39,413$ -$ -$ 3,992$ 203,44417,310CONG. DIST (16)67,750$ 344,755$ 182,382$ -$ 17,437$ -$ -$ 8,372$ 136,56321,747CONG. DIST (17)69,322$ 424,689$ 202,103$ -$ 20,225$ -$ -$ 5,706$ 196,65522,728CONG. DIST (18)55,155$ 376,842$ 165,182$ -$ 19,117$ -$ -$ 6,680$ 185,86321,179CONG. DIST (19)62,616$ 264,986$ 136,403$ -$ 15,117$ -$ -$ 6,545$ 106,92118,267CONG. DIST (20)28,913$ 301,097$ 129,118$ -$ 28,334$ -$ -$ 3,453$ 140,19211,467CONG. DIST (21)41,306$ 217,138$ 86,104$ -$ 17,236$ -$ -$ 8,207$ 105,59016,598CONG. DIST (22)43,231$ 262,016$ 104,445$ 325$ 21,961$ -$ 7,570$ 7,990$ 119,72613,615CONG. DIST (23)29,688$ 184,970$ 79,676$
  • 37.
    -$ 22,795$ -$-$ 3,089$ 79,4108,019CONG. DIST (24)19,005$ 294,165$ 103,268$ 12,557$ 35,592$ -$ 3,119$ 1,034$ 138,5967,806CONG. DIST (25)19,688$ 100,267$ 47,828$ -$ 8,966$ -$ -$ 1,115$ 42,3585,321CONG. DIST (26)25,163$ 145,203$ 55,874$ -$ 17,027$ -$ -$ 1,091$ 71,2116,387CONG. DIST (27)18,023$ 118,977$ 42,262$ -$ 15,149$ -$ -$ 1,135$ 60,4324,201FLORIDA (Totals)1,520,563$ 10,430,774$ 4,728,273$ 131,870$ 892,555$ -$ 146,088$ 139,645$ 4,392,344479,193Notes:* Veteran population estimates, as of September 30, 2013, are produced by the VA Office of the Actuary (VetPop 2011).# Prior to FY 08, "Loan Guaranty" expenditures were included in the Education & Vocational Rehabilitation and Employment (E&VRE) programs. Currently, all "Loan Guaranty" expenditures are attributed to Travis County, TX, where all Loan Guaranty payments are processed. VA will continue to improve data collection for future GDX reports to better distribute loan expenditures at the state, county and congressional district levels.** Unique patients are patients who received treatment at a VA health care facility. Data are provided by the Allocation Resource Center (ARC).Expenditure data sources: USASpending.gov for Compensation & Pension (C&P) and Education and Vocational Rehabilitation and Employment (EVRE) Benefits; Veterans Benefits Administration Insurance Center for the Insurance costs; the VA Financial Management System (FMS) for Construction, Medical Research, General Operating Expenses, and certain C&P and Readjustment data; and the Allocation Resource Center (ARC) for Medical Care costs.1. Expenditures are rounded to the nearest thousand dollars. For example, $500 to $1,000 are rounded to $1; $0 to $499 are rounded to $0; and "$ -" = 0 or no expenditures.2. The Compensation & Pension expenditures include dollars for the following programs: veterans' compensation for service-connected disabilities; dependency and indemnity compensation for service-connected deaths; veterans' pension for nonservice-connected disabilities;
  • 38.
    and burial andother benefits to veterans and their survivors.3. Medical Care expenditures include dollars for medical services, medical administration, facility maintenance, educational support, research support, and other overhead items. Medical Care expenditures do not include dollars for construction or other non-medical support.4. Medical Care expenditures are based on where patients live instead of where care is delivered.5. A star symbol (*) in the Unique Patients column denotes that there were less than 10 Unique Patients. &"Arial,Bold"&11FY13 GEOGRAPHIC DISTRIBUTION OF VA EXPENDITURES (GDX) &8&P of &N GAFY13 Summary of Expenditures by StateExpenditures in $000sCounty/ Congressional DistrictVeteran Population*Total ExpenditureCompensation & PensionConstructionEducation & Vocational Rehabilitation/ EmploymentLoan Guaranty#General Operating ExpensesInsurance & IndemnitiesMedical CareUnique Patients**APPLING1,245$ 6,105$ 3,100$ -$ 194$ -$ -$ 18$ 2,793363ATKINSON452$ 3,422$ 1,432$ -$ 122$ -$ -$ 15$ 1,852179BACON801$ 4,303$ 2,476$ -$ 114$ -$ -$ 55$ 1,659234BAKER330$ 1,074$ 609$ -$ 42$ -$ -$ 17$ 40568BALDWIN4,150$ 22,498$ 9,698$ -$ 1,054$ -$ -$ 106$ 11,640957BANKS1,072$ 5,966$ 3,714$ -$ 257$ - $ -$ 38$ 1,956266BARROW5,905$ 22,310$ 12,176$ -$ 2,116$ -$ -$ 146$ 7,8721,011BARTOW8,141$ 32,593$ 20,436$ -$ 2,465$ -$ -$ 478$ 9,2151,259BEN HILL1,263$ 9,959$ 5,484$ -$ 292$ -$ -$ 28$ 4,155426BERRIEN1,517$ 11,646$ 6,690$ -$ 832$ -$ -$ 34$ 4,090523BIBB12,325$ 78,328$ 40,885$ -$ 6,076$ - $ -$ 632$ 30,7353,805BLECKLEY1,076$ 7,268$ 3,544$ -$ 288$ -$ -$ 92$ 3,344241BRANTLEY1,374$ 8,338$ 4,320$ -$ 278$ -$ -$ 91$ 3,648425BROOKS1,431$ 9,531$ 3,578$ -$ 243$ -$ -$ 317$
  • 39.
    5,394551BRYAN3,905$ 26,878$ 16,087$-$ 6,272$ -$ - $ 70$ 4,449845BULLOCH5,024$ 22,100$ 11,201$ -$ 2,870$ -$ -$ 151$ 7,8791,026BURKE1,842$ 13,633$ 6,252$ -$ 505$ -$ -$ 142$ 6,734615BUTTS2,358$ 11,675$ 7,280$ -$ 704$ -$ -$ 77$ 3,615408CALHOUN445$ 2,597$ 1,546$ -$ 124$ -$ -$ 56$ 871141CAMDEN7,218$ 41,671$ 22,449$ -$ 8,330$ -$ -$ 174$ 10,7181,644CANDLER834$ 5,124$ 2,087$ - $ 185$ -$ -$ 37$ 2,814207CARROLL8,260$ 45,290$ 25,060$ -$ 3,510$ -$ -$ 395$ 16,3241,796CATOOSA5,267$ 19,026$ 11,000$ -$ 1,045$ -$ -$ 199$ 6,7811,127CHARLTON953$ 5,705$ 2,822$ - $ 188$ -$ -$ 81$ 2,614301CHATHAM28,174$ 151,704$ 83,094$ -$ 30,772$ -$ -$ 1,414$ 36,4256,254CHATTAHOOCHEE1,178$ 3,469$ 2,449$ -$ 252$ -$ -$ 32$ 735174CHATTOOGA1,983$ 8,859$ 6,236$ -$ 355$ -$ -$ 45$ 2,223378CHEROKEE17,894$ 63,098$ 38,907$ -$ 6,738$ -$ -$ 1,238$ 16,2152,192CLARKE6,201$ 29,273$ 17,077$ -$ 3,009$ - $ -$ 397$ 8,7891,154CLAY311$ 973$ 586$ -$ 37$ -$ -$ 40$ 31158CLAYTON22,434$ 128,639$ 65,966$ -$ 13,130$ -$ -$ 693$ 48,8505,530CLINCH565$ 2,377$ 1,285$ -$ 201$ -$ -$ 2$ 890151COBB48,898$ 205,122$ 110,986$ 474$ 29,651$ -$ 341$ 3,819$ 59,8517,780COFFEE2,454$ 16,584$ 8,410$ -$ 576$ -$ -$ 90$ 7,508855COLQUITT2,884$ 19,074$ 9,787$ -$ 721$ -$ -$ 208$ 8,358861COLUMBIA15,256$ 149,175$ 88,792$ -$ 21,401$ -$ -$ 1,677$ 37,3064,401COOK1,319$ 8,283$ 4,394$ -$ 377$ -$ -$ 95$ 3,417458COWETA11,908$ 47,970$ 29,817$ -$ 4,445$ -$ -$ 370$ 13,3372,095CRAWFORD1,024$ 3,825$ 1,587$ -$ 161$ -$ -$ 104$ 1,973326CRISP1,591$ 8,847$ 4,210$ -$ 499$ -$ -$ 316$ 3,822436DADE1,427$ 5,263$ 2,878$ -$ 332$ -$ -$ 17$ 2,036273DAWSON2,403$ 7,344$ 5,170$ -$ 443$ -$ -$ 18$ 1,713293DECATUR2,162$ 8,783$
  • 40.
    4,143$ -$ 569$-$ -$ 158$ 3,913626DEKALB40,518$ 443,244$ 145,539$ 995$ 32,435$ -$ 92,524$ 3,591$ 168,16012,376DODGE1,551$ 11,298$ 4,083$ -$ 641$ -$ -$ 86$ 6,487474DOOLY916$ 4,102$ 2,098$ -$ 138$ - $ -$ 48$ 1,817189DOUGHERTY7,354$ 54,532$ 33,779$ -$ 5,638$ -$ -$ 435$ 14,6802,439DOUGLAS12,184$ 64,227$ 36,911$ -$ 6,992$ -$ -$ 871$ 19,4522,364EARLY895$ 3,647$ 2,158$ -$ 181$ -$ -$ 28$ 1,280227ECHOLS247$ 1,319$ 233$ -$ 26$ -$ -$ 66$ 99488EFFINGHAM6,111$ 21,683$ 12,757$ -$ 2,667$ -$ -$ 112$ 6,146982ELBERT1,693$ 9,228$ 5,071$ -$ 216$ -$ -$ 55$ 3,886472EMANUEL1,351$ 13,391$ 5,515$ -$ 512$ -$ -$ 58$ 7,306552EVANS796$ 4,639$ 2,619$ -$ 198$ -$ -$ 72$ 1,750229FANNIN2,137$ 14,131$ 8,495$ -$ 240$ -$ -$ 186$ 5,209663FAYETTE11,522$ 54,635$ 38,636$ -$ 4,702$ -$ -$ 682$ 10,6151,650FLOYD7,041$ 29,574$ 19,766$ -$ 1,740$ -$ -$ 418$ 7,6491,260FORSYTH12,112$ 26,782$ 15,277$ -$ 1,871$ -$ -$ 784$ 8,8491,338FRANKLIN1,861$ 9,051$ 5,291$ -$ 361$ -$ -$ 75$ 3,324409FULTON49,217$ 328,480$ 159,394$ 97$ 39,714$ -$ 2,031$ 4,091$ 123,15412,197GILMER2,713$ 13,617$ 9,005$ -$ 243$ -$ -$ 120$ 4,249650GLASCOCK164$ 1,441$ 517$ -$ 43$ -$ -$ 5$ 87765GLYNN7,973$ 38,339$ 21,523$ -$ 2,330$ -$ -$ 700$ 13,7862,108GORDON3,718$ 14,667$ 9,569$ -$ 667$ -$ -$ 106$ 4,325648GRADY1,810$ 9,251$ 4,530$ -$ 636$ -$ -$ 48$ 4,037638GREENE1,448$ 6,883$ 4,071$ -$ 190$ -$ -$ 122$ 2,500324GWINNETT47,476$ 190,726$ 96,856$ -$ 25,190$ -$ -$ 2,794$ 65,8868,376HABERSHAM3,415$ 15,381$ 9,727$ -$ 695$ -$ -$ 135$ 4,824742HALL12,412$ 48,211$ 28,062$ -$ 2,811$ -$ - $ 811$ 16,5272,281HANCOCK699$ 5,652$ 2,952$ -$ 149$ -$ -$ 105$ 2,447192HARALSON2,208$ 10,463$ 5,689$ -$ 495$ -$ -$ 43$ 4,236473HARRIS4,160$
  • 41.
    20,578$ 14,347$ -$1,605$ -$ -$ 431$ 4,196762HART2,047$ 8,670$ 4,225$ -$ 157$ -$ -$ 69$ 4,218495HEARD875$ 4,389$ 1,970$ -$ 219$ -$ - $ 139$ 2,061225HENRY20,685$ 124,307$ 75,102$ -$ 16,974$ -$ -$ 1,125$ 31,1064,228HOUSTON20,820$ 131,967$ 84,923$ -$ 19,161$ -$ -$ 1,845$ 26,0384,474IRWIN660$ 2,620$ 1,531$ -$ 106$ -$ -$ 49$ 934186JACKSON5,140$ 22,109$ 13,946$ -$ 1,350$ -$ -$ 218$ 6,596907JASPER1,166$ 5,042$ 2,801$ -$ 269$ -$ -$ 85$ 1,887282JEFF DAVIS805$ 5,910$ 2,620$ -$ 163$ -$ -$ 36$ 3,091316JEFFERSON1,160$ 11,834$ 4,392$ -$ 334$ -$ -$ 57$ 7,052439JENKINS788$ 3,922$ 1,742$ -$ 106$ -$ -$ 3$ 2,071177JOHNSON581$ 4,778$ 1,772$ -$ 124$ -$ -$ 101$ 2,780172JONES2,300$ 9,191$ 3,539$ -$ 445$ -$ -$ 165$ 5,041619LAMAR1,853$ 7,440$ 4,599$ -$ 350$ -$ -$ 57$ 2,434326LANIER854$ 5,749$ 2,764$ - $ 581$ -$ -$ 14$ 2,390272LAURENS4,116$ 74,698$ 18,016$ 35$ 1,336$ -$ 11,048$ 327$ 43,9371,958LEE3,254$ 12,814$ 8,113$ -$ 1,408$ -$ -$ 204$ 3,089680LIBERTY10,917$ 89,873$ 54,898$ -$ 19,645$ -$ -$ 405$ 14,9252,805LINCOLN877$ 6,129$ 3,114$ -$ 100$ -$ -$ 55$ 2,859243LONG1,637$ 12,614$ 6,671$ -$ 2,352$ -$ -$ 133$ 3,458427LOWNDES12,870$ 73,597$ 39,958$ -$ 9,388$ - $ -$ 543$ 23,7083,057LUMPKIN2,465$ 10,152$ 5,794$ -$ 1,118$ -$ -$ 158$ 3,082453MCDUFFIE1,865$ 14,251$ 7,090$ -$ 579$ -$ -$ 30$ 6,553577MCINTOSH1,433$ 6,942$ 3,700$ -$ 291$ -$ - $ 63$ 2,888383MACON1,114$ 4,690$ 1,887$ -$ 246$ -$ -$ 27$ 2,530262MADISON2,310$ 12,362$ 7,776$ -$ 599$ -$ -$ 116$ 3,871542MARION886$ 4,771$ 2,706$ -$ 348$ -$ -$ 41$ 1,674194MERIWETHER1,992$ 8,194$ 4,417$ -$ 276$ -$ -$ 361$ 3,140382MILLER533$ 1,599$ 872$ -$ 60$ -$ -$ 1$ 666124MITCHELL1,690$ 6,358$ 3,648$ -$ 483$ -$ -$
  • 42.
    64$ 2,163381MONROE2,132$ 9,908$5,136$ -$ 485$ -$ -$ 149$ 4,139547MONTGOMERY609$ 4,810$ 2,012$ -$ 141$ -$ -$ 15$ 2,643199MORGAN1,234$ 6,416$ 4,027$ -$ 308$ -$ -$ 20$ 2,061302MURRAY2,463$ 11,752$ 7,504$ -$ 335$ -$ -$ 38$ 3,874555MUSCOGEE24,041$ 251,067$ 171,003$ -$ 30,071$ -$ -$ 2,478$ 47,5156,458NEWTON8,546$ 47,460$ 26,002$ -$ 3,754$ -$ -$ 458$ 17,2471,866OCONEE2,642$ 8,857$ 6,295$ -$ 542$ -$ - $ 145$ 1,875318OGLETHORPE1,020$ 4,799$ 2,011$ -$ 128$ -$ -$ 45$ 2,614313PAULDING11,793$ 40,654$ 20,598$ -$ 4,310$ -$ -$ 541$ 15,2051,761PEACH2,838$ 20,168$ 12,725$ -$ 2,171$ -$ -$ 198$ 5,074708PICKENS3,359$ 10,834$ 7,444$ -$ 548$ -$ -$ 217$ 2,624391PIERCE1,254$ 10,653$ 5,445$ -$ 318$ -$ -$ 77$ 4,814564PIKE1,509$ 6,811$ 3,946$ -$ 519$ -$ -$ 62$ 2,284295POLK2,886$ 13,174$ 9,026$ -$ 629$ -$ -$ 144$ 3,375544PULASKI868$ 5,614$ 3,134$ -$ 273$ -$ -$ 12$ 2,194208PUTNAM2,181$ 8,956$ 4,217$ -$ 326$ -$ -$ 76$ 4,337463QUITMAN292$ 2,587$ 1,203$ -$ 48$ -$ -$ 12$ 1,323101RABUN1,686$ 7,873$ 4,362$ -$ 161$ -$ -$ 68$ 3,281435RANDOLPH573$ 2,319$ 1,402$ -$ 148$ -$ -$ 57$ 712112RICHMOND22,212$ 288,957$ 135,534$ 1,759$ 20,634$ -$ 3,299$ 1,501$ 126,2319,679ROCKDALE8,389$ 45,974$ 25,540$ -$ 4,062$ -$ -$ 315$ 16,0581,778SCHLEY297$ 1,260$ 786$ -$ 88$ -$ -$ 5$ 38169SCREVEN1,197$ 6,314$ 2,379$ -$ 311$ -$ -$ 105$ 3,519303SEMINOLE913$ 4,242$ 2,112$ -$ 153$ -$ -$ 250$ 1,726237SPALDING5,047$ 28,049$ 16,484$ -$ 1,617$ - $ -$ 287$ 9,6621,170STEPHENS2,029$ 11,672$ 7,278$ -$ 415$ -$ -$ 76$ 3,903498STEWART364$ 2,148$ 1,428$ -$ 121$ -$ -$ 20$ 57983SUMTER2,021$ 12,280$ 7,750$ -$ 684$ -$ -$ 121$ 3,725511TALBOT632$ 4,741$ 3,423$ -$ 223$ -$ -$
  • 43.
    74$ 1,021151TALIAFERRO150$ 823$316$ -$ 24$ -$ -$ 1$ 48239TATTNALL2,352$ 12,689$ 7,093$ -$ 810$ -$ -$ 36$ 4,749522TAYLOR653$ 3,194$ 1,803$ -$ 139$ -$ -$ 21$ 1,230155TELFAIR865$ 8,494$ 3,113$ -$ 128$ -$ -$ 12$ 5,241305TERRELL887$ 3,213$ 1,699$ -$ 233$ -$ -$ 106$ 1,175208THOMAS3,592$ 24,404$ 12,392$ -$ 1,594$ -$ -$ 232$ 10,1851,231TIFT2,503$ 17,137$ 10,374$ -$ 783$ -$ -$ 233$ 5,746788TOOMBS1,796$ 14,096$ 6,150$ -$ 741$ -$ -$ 145$ 7,060667TOWNS1,370$ 8,442$ 4,656$ -$ 181$ -$ -$ 186$ 3,419458TREUTLEN478$ 3,605$ 1,183$ -$ 65$ -$ -$ 50$ 2,308139TROUP4,877$ 29,074$ 17,855$ -$ 1,355$ -$ -$ 349$ 9,5161,110TURNER649$ 3,885$ 2,558$ -$ 218$ -$ -$ 11$ 1,098205TWIGGS729$ 5,120$ 2,337$ -$ 163$ -$ -$ 57$ 2,563246UNION2,789$ 15,257$ 9,037$ -$ 308$ -$ -$ 257$ 5,654894UPSON2,341$ 12,592$ 6,970$ -$ 425$ -$ -$ 81$ 5,116598WALKER5,329$ 28,069$ 17,998$ -$ 1,099$ -$ -$ 228$ 8,7441,282WALTON6,676$ 36,650$ 23,375$ -$ 3,170$ - $ -$ 437$ 9,6681,184WARE3,351$ 24,677$ 12,389$ -$ 533$ -$ -$ 206$ 11,5501,203WARREN401$ 2,800$ 1,246$ -$ 99$ -$ -$ 19$ 1,436131WASHINGTON1,498$ 11,417$ 4,410$ -$ 301$ -$ -$ 33$ 6,673509WAYNE2,849$ 15,259$ 8,348$ -$ 769$ -$ -$ 80$ 6,062723WEBSTER208$ 705$ 418$ -$ 9$ -$ -$ 50$ 22827WHEELER530$ 4,639$ 1,637$ -$ 78$ -$ -$ 2$ 2,922176WHITE2,533$ 12,251$ 7,228$ -$ 442$ -$ -$ 52$ 4,529571WHITFIELD5,026$ 25,234$ 16,475$ -$ 1,153$ -$ -$ 321$ 7,2841,178WILCOX763$ 5,079$ 2,181$ -$ 139$ -$ -$ 162$ 2,597174WILKES987$ 5,201$ 2,619$ -$ 212$ -$ -$ 60$ 2,310242WILKINSON792$ 7,090$ 3,220$ -$ 215$ -$ -$ 55$ 3,601268WORTH1,809$ 7,414$ 4,120$ -$ 450$ -$ -$ 19$ 2,825502GEORGIA (Totals)774,464$ 4,670,709$ 2,482,164$ 3,359$ 453,034$ -$ 109,242$ 48,822$
  • 44.
    1,574,087179,821CONG. DIST (01)77,060$458,087$ 255,822$ -$ 74,581$ -$ -$ 3,718$ 123,96618,913CONG. DIST (02)62,636$ 465,920$ 288,900$ -$ 45,455$ -$ -$ 4,854$ 126,71117,635CONG. DIST (03)63,163$ 320,077$ 198,255$ -$ 26,740$ -$ -$ 3,933$ 91,14912,283CONG. DIST (04)49,369$ 430,542$ 162,870$ 995$ 34,077$ -$ 92,524$ 2,620$ 137,45713,329CONG. DIST (05)38,878$ 378,305$ 171,274$ 97$ 40,320$ -$ 2,031$ 1,992$ 162,59111,968CONG. DIST (06)39,406$ 118,476$ 56,099$ -$ 13,883$ -$ -$ 5,285$ 43,2085,291CONG. DIST (07)39,980$ 135,656$ 70,031$ -$ 17,034$ -$ -$ 2,657$ 45,9336,458CONG. DIST (08)66,492$ 409,732$ 225,530$ - $ 38,237$ -$ -$ 4,675$ 141,29117,487CONG. DIST (09)57,147$ 256,353$ 153,935$ -$ 11,798$ -$ -$ 3,006$ 87,61412,048CONG. DIST (10)54,788$ 295,586$ 156,328$ -$ 21,833$ -$ -$ 2,703$ 114,72111,302CONG. DIST (11)50,694$ 194,232$ 111,975$ 474$ 23,215$ -$ 341$ 3,707$ 54,5217,340CONG. DIST (12)64,407$ 632,329$ 299,620$ 1,793$ 49,055$ -$ 14,346$ 4,362$ 263,15322,242CONG. DIST (13)60,533$ 365,054$ 202,269$ -$ 44,464$ -$ -$ 3,148$ 115,17213,937CONG. DIST (14)49,911$ 210,360$ 129,257$ -$ 12,343$ -$ -$ 2,161$ 66,5999,588GEORGIA (Totals)774,464$ 4,670,709$ 2,482,164$ 3,359$ 453,034$ -$ 109,242$ 48,822$ 1,574,087179,821Notes:* Veteran population estimates, as of September 30, 2013, are produced by the VA Office of the Actuary (VetPop 2011).# Prior to FY 08, "Loan Guaranty" expenditures were included in the Education & Vocational Rehabilitation and Employment (E&VRE) programs. Currently, all "Loan Guaranty" expenditures are attributed to Travis County, TX, where all Loan Guaranty payments are processed. VA will continue to improve data collection for future GDX reports to better distribute loan expenditures at the state, county and congressional district levels.** Unique patients are patients who received treatment at a VA health care facility. Data are provided by the Allocation Resource Center
  • 45.
    (ARC).Expenditure data sources:USASpending.gov for Compensation & Pension (C&P) and Education and Vocational Rehabilitation and Employment (EVRE) Benefits; Veterans Benefits Administration Insurance Center for the Insurance costs; the VA Financial Management System (FMS) for Construction, Medical Research, General Operating Expenses, and certain C&P and Readjustment data; and the Allocation Resource Center (ARC) for Medical Care costs.1. Expenditures are rounded to the nearest thousand dollars. For example, $500 to $1,000 are rounded to $1; $0 to $499 are rounded to $0; and "$ -" = 0 or no expenditures.2. The Compensation & Pension expenditures include dollars for the following programs: veterans' compensation for service-connected disabilities; dependency and indemnity compensation for service-connected deaths; veterans' pension for nonservice-connected disabilities; and burial and other benefits to veterans and their survivors.3. Medical Care expenditures include dollars for medical services, medical administration, facility maintenance, educational support, research support, and other overhead items. Medical Care expenditures do not include dollars for construction or other non-medical support.4. Medical Care expenditures are based on where patients live instead of where care is delivered.5. A star symbol (*) in the Unique Patients column denotes that there were less than 10 Unique Patients. &"Arial,Bold"&11FY13 GEOGRAPHIC DISTRIBUTION OF VA EXPENDITURES (GDX) &8&P of &N HIFY13 Summary of Expenditures by StateExpenditures in $000sCounty/ Congressional DistrictVeteran Population*Total ExpenditureCompensation & PensionConstructionEducation & Vocational Rehabilitation/ EmploymentLoan Guaranty#General Operating ExpensesInsurance & IndemnitiesMedical CareUnique Patients**HAWAII15,760$ 94,387$ 50,429$ -$ 3,096$ -$ -$ 1,003$ 39,8583,802HONOLULU85,279$
  • 46.
    569,136$ 241,149$ 1,690$136,679$ -$ 16,013$ 10,635$ 162,97016,434KALAWAO5$ 4$ -$ -$ -$ -$ -$ -$ 4*KAUAI5,282$ 29,075$ 13,758$ -$ 876$ -$ -$ 540$ 13,9011,375MAUI10,622$ 62,079$ 32,583$ -$ 2,078$ -$ -$ 931$ 26,4872,213HAWAII (Totals)116,947$ 754,680$ 337,919$ 1,690$ 142,729$ -$ 16,013$ 13,109$ 243,22023,825CONG. DIST (01)61,532$ 414,681$ 173,760$ 1,690$ 98,484$ -$ 16,013$ 8,373$ 116,36111,738CONG. DIST (02)55,414$ 339,999$ 164,159$ -$ 44,245$ -$ -$ 4,736$ 126,85912,087HAWAII (Totals)116,947$ 754,680$ 337,919$ 1,690$ 142,729$ -$ 16,013$ 13,109$ 243,22023,825Notes:* Veteran population estimates, as of September 30, 2013, are produced by the VA Office of the Actuary (VetPop 2011).# Prior to FY 08, "Loan Guaranty" expenditures were included in the Education & Vocational Rehabilitation and Employment (E&VRE) programs. Currently, all "Loan Guaranty" expenditures are attributed to Travis County, TX, where all Loan Guaranty payments are processed. VA will continue to improve data collection for future GDX reports to better distribute loan expenditures at the state, county and congressional district levels.** Unique patients are patients who received treatment at a VA health care facility. Data are provided by the Allocation Resource Center (ARC).Expenditure data sources: USASpending.gov for Compensation & Pension (C&P) and Education and Vocational Rehabilitation and Employment (EVRE) Benefits; Veterans Benefits Administration Insurance Center for the Insurance costs; the VA Financial Management System (FMS) for Construction, Medical Research, General Operating Expenses, and certain C&P and Readjustment data; and the Allocation Resource Center (ARC) for Medical Care costs.1. Expenditures are rounded to the nearest thousand dollars. For example, $500 to $1,000 are rounded to $1; $0 to $499 are rounded to $0; and "$ -" = 0 or no expenditures.2. The Compensation & Pension expenditures include dollars for the following programs: veterans' compensation for service-connected disabilities;
  • 47.
    dependency and indemnitycompensation for service-connected deaths; veterans' pension for nonservice-connected disabilities; and burial and other benefits to veterans and their survivors.3. Medical Care expenditures include dollars for medical services, medical administration, facility maintenance, educational support, research support, and other overhead items. Medical Care expenditures do not include dollars for construction or other non-medical support.4. Medical Care expenditures are based on where patients live instead of where care is delivered.5. A star symbol (*) in the Unique Patients column denotes that there were less than 10 Unique Patients. &"Arial,Bold"&11FY13 GEOGRAPHIC DISTRIBUTION OF VA EXPENDITURES (GDX) &8&P of &N IAFY13 Summary of Expenditures by StateExpenditures in $000sCounty/ Congressional DistrictVeteran Population*Total ExpenditureCompensation & PensionConstructionEducation & Vocational Rehabilitation/ EmploymentLoan Guaranty#General Operating ExpensesInsurance & IndemnitiesMedical CareUnique Patients**ADAIR718$ 2,791$ 946$ -$ 137$ -$ -$ 20$ 1,688180ADAMS365$ 1,469$ 637$ -$ 37$ -$ -$ 58$ 737117ALLAMAKEE1,136$ 6,259$ 2,893$ -$ 123$ -$ -$ 58$ 3,186446APPANOOSE987$ 7,045$ 3,399$ -$ 145$ -$ -$ 30$ 3,470430AUDUBON560$ 2,807$ 1,339$ -$ 177$ -$ -$ 84$ 1,206172BENTON2,216$ 8,748$ 3,998$ -$ 372$ -$ -$ 118$ 4,260662BLACK HAWK10,392$ 38,598$ 19,434$ -$ 3,096$ -$ -$ 628$ 15,4402,442BOONE2,239$ 9,408$ 4,120$ -$ 721$ -$ -$ 196$ 4,371581BREMER1,765$ 6,829$ 3,640$ -$ 346$ -$ -$ 165$ 2,678462BUCHANAN1,603$ 6,088$ 2,770$ -$ 340$ -$ -$ 99$ 2,881424BUENA VISTA1,273$ 5,092$ 2,621$ -$ 353$ -$ -$ 109$ 2,010505BUTLER1,087$ 5,480$ 2,722$ -$ 265$ -$ -$ 16$ 2,477394CALHOUN959$
  • 48.
    4,625$ 1,732$ -$144$ -$ -$ 217$ 2,533386CARROLL1,517$ 6,207$ 2,937$ -$ 263$ -$ -$ 139$ 2,868624CASS1,188$ 6,023$ 3,032$ -$ 185$ -$ - $ 84$ 2,722377CEDAR1,521$ 5,852$ 2,127$ -$ 300$ - $ -$ 41$ 3,385448CERRO GORDO3,469$ 24,014$ 11,878$ -$ 859$ -$ -$ 613$ 10,6651,698CHEROKEE992$ 5,036$ 2,625$ -$ 65$ -$ - $ 81$ 2,264394CHICKASAW938$ 4,435$ 1,996$ -$ 161$ -$ -$ 113$ 2,164385CLARKE640$ 5,237$ 2,006$ -$ 132$ -$ -$ 17$ 3,081312CLAY1,302$ 6,645$ 2,724$ -$ 245$ -$ -$ 106$ 3,571539CLAYTON1,592$ 7,670$ 3,071$ -$ 242$ -$ -$ 217$ 4,140564CLINTON4,405$ 19,934$ 8,623$ -$ 2,906$ -$ -$ 518$ 7,8861,311CRAWFORD1,288$ 6,200$ 2,806$ -$ 111$ -$ -$ 32$ 3,251411DALLAS4,220$ 17,605$ 6,719$ -$ 1,084$ -$ -$ 325$ 9,4771,054DAVIS617$ 2,850$ 1,548$ -$ 133$ -$ -$ 7$ 1,162191DECATUR597$ 3,735$ 1,574$ -$ 135$ -$ -$ 6$ 2,020198DELAWARE1,245$ 4,614$ 2,186$ -$ 166$ -$ -$ 211$ 2,050384DES MOINES3,651$ 16,474$ 7,220$ -$ 686$ -$ -$ 384$ 8,184984DICKINSON1,380$ 7,690$ 3,197$ -$ 177$ -$ -$ 246$ 4,069681DUBUQUE6,787$ 34,085$ 17,139$ -$ 2,514$ -$ -$ 593$ 13,8392,389EMMET793$ 4,943$ 1,822$ -$ 220$ -$ -$ 78$ 2,824322FAYETTE1,442$ 9,420$ 3,184$ -$ 806$ - $ -$ 109$ 5,321578FLOYD1,320$ 7,182$ 3,613$ -$ 150$ -$ -$ 86$ 3,333547FRANKLIN812$ 3,688$ 1,608$ -$ 114$ -$ -$ 17$ 1,949323FREMONT760$ 3,647$ 1,997$ -$ 150$ -$ -$ 98$ 1,402182GREENE729$ 3,436$ 1,357$ -$ 124$ -$ -$ 209$ 1,747239GRUNDY945$ 3,552$ 1,665$ -$ 138$ -$ -$ 150$ 1,599275GUTHRIE988$ 5,509$ 2,420$ -$ 263$ -$ -$ 42$ 2,783333HAMILTON1,130$ 6,491$ 3,135$ -$ 329$ -$ -$ 110$ 2,917488HANCOCK908$ 4,114$ 2,325$ -$ 78$ -$ -$ 51$ 1,660389HARDIN1,569$ 7,338$ 3,476$ -$ 353$ -$ -$ 113$
  • 49.
    3,396531HARRISON1,308$ 6,762$ 3,540$-$ 183$ -$ - $ 108$ 2,930354HENRY1,406$ 9,357$ 3,981$ -$ 616$ -$ -$ 138$ 4,623495HOWARD693$ 4,265$ 1,957$ -$ 122$ -$ -$ 88$ 2,099316HUMBOLDT799$ 3,666$ 1,663$ -$ 78$ -$ -$ 58$ 1,867394IDA681$ 2,718$ 1,586$ -$ 77$ -$ -$ 63$ 992207IOWA1,245$ 6,534$ 2,507$ -$ 185$ -$ -$ 247$ 3,595377JACKSON1,826$ 8,363$ 3,820$ -$ 359$ -$ -$ 189$ 3,994597JASPER3,066$ 13,421$ 5,580$ -$ 524$ -$ -$ 337$ 6,980799JEFFERSON1,121$ 6,227$ 2,506$ -$ 277$ -$ -$ 76$ 3,368387JOHNSON7,298$ 38,861$ 12,041$ - $ 4,932$ -$ -$ 804$ 21,0831,826JONES2,050$ 9,182$ 3,446$ -$ 253$ -$ -$ 65$ 5,418604KEOKUK861$ 5,432$ 2,087$ -$ 211$ -$ -$ 50$ 3,085370KOSSUTH1,305$ 5,590$ 2,473$ -$ 246$ -$ -$ 51$ 2,820611LEE3,382$ 14,837$ 7,067$ 50$ 647$ -$ - $ 116$ 6,957865LINN17,837$ 70,221$ 29,744$ -$ 5,166$ -$ -$ 1,182$ 34,1284,603LOUISA827$ 4,045$ 1,489$ -$ 107$ -$ -$ 35$ 2,414267LUCAS633$ 3,617$ 1,397$ -$ 187$ -$ -$ 29$ 2,004260LYON628$ 4,014$ 1,628$ -$ 139$ -$ -$ 78$ 2,169248MADISON1,083$ 7,857$ 3,055$ -$ 285$ -$ -$ 71$ 4,446386MAHASKA1,482$ 8,312$ 3,748$ -$ 463$ -$ - $ 50$ 4,050501MARION2,709$ 20,286$ 8,634$ -$ 638$ -$ -$ 82$ 10,932938MARSHALL3,892$ 30,971$ 12,468$ -$ 572$ -$ -$ 288$ 17,6431,390MILLS1,306$ 9,012$ 4,882$ -$ 645$ -$ -$ 137$ 3,348339MITCHELL852$ 4,524$ 2,355$ -$ 173$ -$ -$ 91$ 1,905386MONONA1,015$ 5,202$ 1,798$ -$ 148$ -$ -$ 152$ 3,104259MONROE602$ 5,580$ 2,359$ -$ 221$ -$ -$ 38$ 2,963246MONTGOMERY882$ 5,929$ 2,635$ -$ 205$ -$ -$ 92$ 2,997282MUSCATINE3,112$ 13,265$ 5,284$ -$ 623$ -$ -$ 193$ 7,164748O'BRIEN1,040$ 5,912$ 2,483$ -$ 229$ -$ -$ 109$ 3,091433OSCEOLA534$ 1,933$ 728$ -$ 53$ -$ -$ 66$ 1,085192PAGE1,429$ 7,062$ 3,073$ -$ 175$ -$ -$
  • 50.
    67$ 3,746418PALO ALTO783$4,778$ 2,521$ -$ 200$ - $ -$ 9$ 2,047361PLYMOUTH2,102$ 7,196$ 2,541$ -$ 362$ -$ -$ 111$ 4,183637POCAHONTAS804$ 3,252$ 1,540$ -$ 107$ -$ -$ 62$ 1,542314POLK28,021$ 200,078$ 68,696$ 29$ 14,238$ -$ 10,585$ 2,296$ 104,2338,701POTTAWATTAMIE7,897$ 50,405$ 22,797$ - $ 2,631$ -$ -$ 621$ 24,3572,280POWESHIEK1,417$ 6,119$ 2,431$ -$ 204$ -$ -$ 203$ 3,281385RINGGOLD459$ 1,810$ 923$ -$ 32$ -$ -$ 28$ 827134SAC967$ 4,378$ 2,547$ -$ 80$ -$ -$ 93$ 1,659395SCOTT14,535$ 59,317$ 26,831$ -$ 6,684$ -$ -$ 981$ 24,8213,400SHELBY1,129$ 5,454$ 2,518$ -$ 113$ -$ -$ 108$ 2,715354SIOUX1,578$ 6,707$ 3,054$ -$ 290$ -$ -$ 153$ 3,211627STORY5,521$ 19,419$ 8,444$ -$ 3,077$ -$ -$ 480$ 7,4181,035TAMA1,449$ 6,933$ 2,988$ -$ 236$ -$ -$ 69$ 3,640483TAYLOR609$ 2,724$ 1,250$ -$ 54$ -$ -$ 48$ 1,372166UNION1,053$ 5,964$ 2,392$ -$ 194$ -$ -$ 35$ 3,343358VAN BUREN646$ 3,747$ 1,580$ -$ 110$ -$ -$ 41$ 2,016231WAPELLO3,173$ 15,664$ 6,340$ -$ 731$ -$ -$ 122$ 8,471959WARREN3,600$ 21,076$ 8,868$ -$ 1,754$ -$ -$ 146$ 10,3081,178WASHINGTON1,462$ 9,318$ 3,846$ -$ 351$ -$ -$ 333$ 4,788526WAYNE537$ 2,621$ 1,229$ -$ 74$ -$ -$ 3$ 1,314155WEBSTER3,225$ 14,301$ 6,650$ -$ 891$ -$ -$ 230$ 6,5311,349WINNEBAGO819$ 4,841$ 2,496$ -$ 242$ -$ -$ 69$ 2,034328WINNESHIEK1,239$ 5,087$ 2,534$ -$ 386$ -$ -$ 147$ 2,020384WOODBURY8,148$ 31,663$ 14,208$ - $ 2,704$ -$ -$ 593$ 14,1572,320WORTH674$ 3,867$ 1,907$ -$ 88$ -$ -$ 65$ 1,807268WRIGHT1,015$ 4,349$ 2,196$ -$ 160$ -$ -$ 102$ 1,890413IOWA (Totals)233,815$ 1,192,889$ 505,601$ 79$ 74,079$ -$ 10,585$ 18,891$ 583,65372,191CONG. DIST (01)61,352$ 278,356$ 124,458$ -$ 15,749$ -$ -$ 4,838$ 133,31018,141CONG. DIST (02)59,272$ 295,057$ 122,509$
  • 51.
    50$ 21,834$ -$-$ 4,427$ 146,23616,849CONG. DIST (03)54,576$ 348,964$ 134,325$ 29$ 22,070$ -$ 10,585$ 4,164$ 177,79016,486CONG. DIST (04)58,614$ 270,513$ 124,309$ -$ 14,426$ -$ -$ 5,461$ 126,31720,715IOWA (Totals)233,815$ 1,192,889$ 505,601$ 79$ 74,079$ -$ 10,585$ 18,891$ 583,65372,191Notes:* Veteran population estimates, as of September 30, 2013, are produced by the VA Office of the Actuary (VetPop 2011).# Prior to FY 08, "Loan Guaranty" expenditures were included in the Education & Vocational Rehabilitation and Employment (E&VRE) programs. Currently, all "Loan Guaranty" expenditures are attributed to Travis County, TX, where all Loan Guaranty payments are processed. VA will continue to improve data collection for future GDX reports to better distribute loan expenditures at the state, county and congressional district levels.** Unique patients are patients who received treatment at a VA health care facility. Data are provided by the Allocation Resource Center (ARC).Expenditure data sources: USASpending.gov for Compensation & Pension (C&P) and Education and Vocational Rehabilitation and Employment (EVRE) Benefits; Veterans Benefits Administration Insurance Center for the Insurance costs; the VA Financial Management System (FMS) for Construction, Medical Research, General Operating Expenses, and certain C&P and Readjustment data; and the Allocation Resource Center (ARC) for Medical Care costs.1. Expenditures are rounded to the nearest thousand dollars. For example, $500 to $1,000 are rounded to $1; $0 to $499 are rounded to $0; and "$ -" = 0 or no expenditures.2. The Compensation & Pension expenditures include dollars for the following programs: veterans' compensation for service-connected disabilities; dependency and indemnity compensation for service-connected deaths; veterans' pension for nonservice-connected disabilities; and burial and other benefits to veterans and their survivors.3. Medical Care expenditures include dollars for medical services, medical administration, facility maintenance, educational support, research support, and other overhead items. Medical
  • 52.
    Care expenditures donot include dollars for construction or other non-medical support.4. Medical Care expenditures are based on where patients live instead of where care is delivered.5. A star symbol (*) in the Unique Patients column denotes that there were less than 10 Unique Patients. &"Arial,Bold"&11FY13 GEOGRAPHIC DISTRIBUTION OF VA EXPENDITURES (GDX) &8&P of &N IDFY13 Summary of Expenditures by StateExpenditures in $000sCounty/ Congressional DistrictVeteran Population*Total ExpenditureCompensation & PensionConstructionEducation & Vocational Rehabilitation/ EmploymentLoan Guaranty#General Operating ExpensesInsurance & IndemnitiesMedical CareUnique Patients**ADA34,225$ 240,887$ 89,032$ 11,690$ 19,260$ -$ 7,807$ 2,681$ 110,41810,890ADAMS474$ 3,092$ 1,394$ -$ 59$ -$ -$ 2$ 1,636176BANNOCK6,361$ 34,073$ 16,320$ -$ 3,375$ -$ -$ 550$ 13,8281,878BEAR LAKE542$ 2,071$ 909$ -$ 33$ -$ -$ 11$ 1,118114BENEWAH1,067$ 5,354$ 3,135$ -$ 142$ -$ -$ 71$ 2,006304BINGHAM2,991$ 11,816$ 6,012$ -$ 772$ -$ - $ 74$ 4,958756BLAINE1,419$ 2,466$ 1,281$ -$ 120$ -$ -$ 131$ 934196BOISE828$ 5,283$ 2,201$ -$ 50$ - $ -$ 4$ 3,027354BONNER4,839$ 23,543$ 11,802$ -$ 677$ -$ -$ 296$ 10,7681,514BONNEVILLE7,603$ 28,996$ 14,704$ -$ 2,203$ -$ -$ 465$ 11,6241,602BOUNDARY1,180$ 6,435$ 4,037$ -$ 104$ - $ -$ 21$ 2,272388BUTTE260$ 1,061$ 537$ -$ 15$ -$ -$ 16$ 49470CAMAS118$ 495$ 248$ -$ 10$ -$ -$ 2$ 23521CANYON14,571$ 87,168$ 36,103$ -$ 6,801$ - $ -$ 919$ 43,3464,923CARIBOU644$ 1,823$ 929$ -$ 50$ -$ -$ 5$ 839114CASSIA1,333$ 5,551$ 2,443$ -$ 206$ -$ -$ 240$ 2,661370CLARK74$ 148$ 81$ -$ 5$ -$ -$ 1$ 6210CLEARWATER1,141$ 7,315$ 3,865$ -$
  • 53.
    70$ -$ -$9$ 3,371430CUSTER505$ 2,067$ 940$ -$ 15$ -$ -$ 59$ 1,053148ELMORE8,898$ 32,308$ 18,900$ -$ 3,752$ -$ -$ 250$ 9,4051,226FRANKLIN691$ 2,339$ 1,150$ -$ 191$ -$ - $ 19$ 979144FREMONT1,152$ 3,118$ 1,549$ -$ 112$ -$ -$ 16$ 1,441235GEM1,604$ 12,822$ 4,862$ -$ 467$ -$ -$ 102$ 7,391698GOODING1,230$ 4,488$ 2,151$ -$ 188$ -$ -$ 14$ 2,135302IDAHO1,780$ 9,734$ 4,446$ -$ 162$ -$ -$ 11$ 5,115656JEFFERSON1,295$ 7,038$ 3,721$ -$ 444$ -$ - $ 69$ 2,804370JEROME1,605$ 5,477$ 2,610$ -$ 235$ -$ -$ 56$ 2,576363KOOTENAI14,304$ 80,543$ 43,123$ -$ 4,170$ -$ -$ 512$ 32,7384,370LATAH2,891$ 11,756$ 5,020$ -$ 2,687$ -$ -$ 133$ 3,916503LEMHI907$ 6,143$ 3,151$ -$ 38$ -$ -$ 69$ 2,885409LEWIS474$ 4,653$ 3,016$ -$ 94$ -$ -$ 39$ 1,504179LINCOLN316$ 1,174$ 424$ -$ 49$ -$ -$ 12$ 688115MADISON975$ 4,407$ 2,013$ -$ 765$ -$ -$ 29$ 1,599196MINIDOKA1,244$ 4,915$ 2,341$ -$ 190$ -$ -$ 98$ 2,285381NEZ PERCE4,117$ 22,814$ 11,107$ -$ 1,267$ -$ -$ 433$ 10,0071,366ONEIDA313$ 1,441$ 720$ -$ 22$ -$ -$ 12$ 688113OWYHEE891$ 5,326$ 1,959$ -$ 184$ -$ -$ 11$ 3,172330PAYETTE2,337$ 11,718$ 4,205$ -$ 460$ -$ -$ 130$ 6,923715POWER660$ 1,620$ 847$ -$ 101$ -$ -$ 12$ 660135SHOSHONE1,766$ 7,550$ 4,234$ -$ 93$ -$ -$ 17$ 3,206455TETON370$ 1,184$ 621$ -$ 63$ -$ -$ 73$ 42778TWIN FALLS6,282$ 23,845$ 11,713$ -$ 1,527$ -$ -$ 291$ 10,3151,697VALLEY903$ 4,744$ 2,176$ -$ 97$ -$ -$ 24$ 2,447282WASHINGTON926$ 5,218$ 2,471$ -$ 187$ -$ -$ 18$ 2,541352IDAHO (Totals)138,108$ 746,018$ 334,504$ 11,690$ 51,513$ -$ 7,807$ 8,006$ 332,49939,928CONG. DIST (01)71,240$ 396,723$ 182,128$ -$ 24,905$ -$ -$ 3,794$ 185,89622,799CONG. DIST (02)66,869$ 349,295$ 152,376$ 11,690$ 26,608$ -$ 7,807$ 4,211$ 146,60317,129IDAHO
  • 54.
    (Totals)138,108$ 746,018$ 334,504$11,690$ 51,513$ -$ 7,807$ 8,006$ 332,49939,928Notes:* Veteran population estimates, as of September 30, 2013, are produced by the VA Office of the Actuary (VetPop 2011).# Prior to FY 08, "Loan Guaranty" expenditures were included in the Education & Vocational Rehabilitation and Employment (E&VRE) programs. Currently, all "Loan Guaranty" expenditures are attributed to Travis County, TX, where all Loan Guaranty payments are processed. VA will continue to improve data collection for future GDX reports to better distribute loan expenditures at the state, county and congressional district levels.** Unique patients are patients who received treatment at a VA health care facility. Data are provided by the Allocation Resource Center (ARC).Expenditure data sources: USASpending.gov for Compensation & Pension (C&P) and Education and Vocational Rehabilitation and Employment (EVRE) Benefits; Veterans Benefits Administration Insurance Center for the Insurance costs; the VA Financial Management System (FMS) for Construction, Medical Research, General Operating Expenses, and certain C&P and Readjustment data; and the Allocation Resource Center (ARC) for Medical Care costs.1. Expenditures are rounded to the nearest thousand dollars. For example, $500 to $1,000 are rounded to $1; $0 to $499 are rounded to $0; and "$ -" = 0 or no expenditures.2. The Compensation & Pension expenditures include dollars for the following programs: veterans' compensation for service-connected disabilities; dependency and indemnity compensation for service-connected deaths; veterans' pension for nonservice-connected disabilities; and burial and other benefits to veterans and their survivors.3. Medical Care expenditures include dollars for medical services, medical administration, facility maintenance, educational support, research support, and other overhead items. Medical Care expenditures do not include dollars for construction or other non-medical support.4. Medical Care expenditures are based on where patients live instead of where care is delivered.5. A star symbol (*) in the Unique Patients column
  • 55.
    denotes that therewere less than 10 Unique Patients. &"Arial,Bold"&11FY13 GEOGRAPHIC DISTRIBUTION OF VA EXPENDITURES (GDX) &8&P of &N ILFY13 Summary of Expenditures by StateExpenditures in $000sCounty/ Congressional DistrictVeteran Population*Total ExpenditureCompensation & PensionConstructionEducation & Vocational Rehabilitation/ EmploymentLoan Guaranty#General Operating ExpensesInsurance & IndemnitiesMedical CareUnique Patients**ADAMS6,722$ 26,232$ 14,471$ -$ 1,625$ -$ -$ 424$ 9,7121,663ALEXANDER764$ 7,040$ 2,958$ -$ 117$ -$ -$ 12$ 3,954297BOND1,417$ 5,198$ 2,725$ -$ 372$ -$ -$ 28$ 2,073264BOONE3,776$ 11,515$ 4,709$ -$ 906$ -$ -$ 255$ 5,646756BROWN455$ 1,548$ 721$ -$ 69$ -$ -$ 1$ 75898BUREAU2,840$ 10,768$ 4,817$ -$ 517$ -$ - $ 303$ 5,130868CALHOUN489$ 1,615$ 960$ -$ 107$ -$ -$ 28$ 520104CARROLL1,475$ 5,691$ 2,413$ -$ 192$ -$ -$ 18$ 3,068494CASS1,075$ 4,620$ 2,897$ -$ 183$ -$ -$ 43$ 1,497235CHAMPAIGN11,184$ 51,438$ 22,156$ -$ 5,795$ -$ -$ 883$ 22,6042,212CHRISTIAN3,002$ 11,376$ 6,812$ -$ 551$ - $ -$ 68$ 3,944662CLARK1,506$ 7,510$ 3,572$ -$ 197$ -$ -$ 136$ 3,605437CLAY1,119$ 6,704$ 2,569$ -$ 194$ -$ -$ 35$ 3,907447CLINTON3,505$ 14,393$ 8,479$ -$ 1,179$ -$ -$ 179$ 4,556624COLES3,845$ 19,053$ 9,184$ -$ 1,468$ -$ -$ 440$ 7,9601,085COOK209,280$ 1,362,173$ 395,425$ 13,292$ 110,402$ -$ 42,547$ 22,137$ 778,37155,901CRAWFORD1,705$ 11,003$ 4,131$ -$ 173$ -$ -$ 32$ 6,666457CUMBERLAND881$ 4,556$ 1,906$ -$ 79$ -$ -$ 77$ 2,494323DEKALB7,017$ 24,304$ 11,211$ -$ 4,147$ -$ -$ 666$ 8,2811,076DEWITT1,576$ 5,600$ 2,591$ -$ 223$ -$ -$
  • 56.
    33$ 2,753363DOUGLAS1,453$ 5,812$2,896$ -$ 402$ - $ -$ 220$ 2,295367DU PAGE41,899$ 180,502$ 65,707$ -$ 33,526$ -$ -$ 5,077$ 76,1927,773EDGAR1,498$ 9,208$ 4,077$ -$ 250$ -$ -$ 74$ 4,806430EDWARDS599$ 2,640$ 1,206$ -$ 97$ -$ -$ 23$ 1,315174EFFINGHAM2,507$ 12,362$ 5,423$ -$ 878$ -$ -$ 270$ 5,7911,008FAYETTE1,794$ 6,749$ 3,083$ -$ 198$ -$ -$ 73$ 3,396462FORD1,227$ 4,977$ 2,324$ -$ 233$ -$ -$ 154$ 2,267240FRANKLIN3,748$ 37,712$ 15,169$ -$ 679$ -$ -$ 222$ 21,6431,721FULTON3,284$ 11,011$ 5,950$ -$ 560$ -$ -$ 134$ 4,366741GALLATIN560$ 3,876$ 1,659$ -$ 32$ -$ -$ 42$ 2,143218GREENE1,330$ 5,062$ 3,127$ -$ 245$ -$ -$ 28$ 1,661240GRUNDY3,679$ 12,651$ 6,141$ -$ 1,147$ -$ -$ 88$ 5,274621HAMILTON636$ 4,690$ 2,547$ -$ 60$ -$ -$ 12$ 2,071249HANCOCK1,590$ 7,809$ 3,606$ -$ 296$ -$ -$ 542$ 3,366487HARDIN368$ 2,208$ 1,040$ -$ 11$ -$ -$ -$ 1,158159HENDERSON813$ 3,609$ 1,288$ -$ 56$ -$ -$ 104$ 2,161232HENRY4,369$ 15,983$ 7,823$ -$ 852$ -$ -$ 377$ 6,9321,074IROQUOIS2,248$ 11,163$ 4,747$ -$ 320$ -$ -$ 108$ 5,988693JACKSON4,453$ 33,224$ 11,994$ -$ 3,802$ -$ -$ 146$ 17,2821,522JASPER788$ 2,714$ 1,373$ -$ 78$ -$ -$ 23$ 1,240254JEFFERSON3,465$ 21,218$ 9,357$ -$ 528$ -$ -$ 195$ 11,1381,141JERSEY2,262$ 7,987$ 3,763$ -$ 469$ -$ -$ 195$ 3,559416JO DAVIESS2,180$ 7,433$ 2,994$ -$ 306$ -$ -$ 172$ 3,961663JOHNSON1,104$ 10,598$ 4,103$ -$ 311$ -$ -$ 35$ 6,148523KANE25,274$ 76,942$ 31,057$ -$ 8,802$ -$ -$ 2,205$ 34,8774,289KANKAKEE8,306$ 37,845$ 16,184$ -$ 2,232$ -$ -$ 561$ 18,8672,223KENDALL7,367$ 22,626$ 9,728$ -$ 2,600$ -$ -$ 640$ 9,659979KNOX4,526$ 19,289$ 8,447$ -$ 751$ -$ -$ 454$ 9,6371,351LAKE37,189$ 280,288$ 76,880$ 4,210$
  • 57.
    18,476$ -$ 2,564$4,486$ 173,67210,080LA SALLE9,216$ 38,745$ 19,108$ -$ 1,448$ -$ -$ 502$ 17,6872,386LAWRENCE1,339$ 5,680$ 2,642$ -$ 251$ - $ -$ 100$ 2,688383LEE2,739$ 10,405$ 4,583$ -$ 694$ -$ -$ 148$ 4,980806LIVINGSTON2,792$ 9,819$ 5,040$ -$ 333$ -$ -$ 268$ 4,177671LOGAN2,316$ 6,957$ 3,915$ -$ 387$ -$ -$ 92$ 2,562442MCDONOUGH2,540$ 12,772$ 5,547$ -$ 1,608$ -$ -$ 132$ 5,484875MCHENRY19,843$ 80,767$ 31,581$ -$ 6,229$ -$ -$ 1,602$ 41,3563,915MCLEAN10,772$ 38,838$ 19,764$ -$ 4,376$ -$ -$ 1,048$ 13,6501,949MACON9,261$ 37,912$ 18,840$ -$ 1,894$ - $ -$ 453$ 16,7242,513MACOUPIN4,562$ 19,739$ 10,769$ -$ 981$ -$ -$ 340$ 7,649915MADISON25,776$ 102,819$ 51,428$ -$ 9,584$ -$ -$ 1,908$ 39,8984,169MARION3,390$ 23,637$ 11,296$ -$ 679$ -$ -$ 388$ 11,2741,122MARSHALL1,118$ 4,248$ 2,229$ - $ 320$ -$ -$ 226$ 1,473268MASON1,456$ 6,010$ 2,926$ -$ 202$ -$ -$ 212$ 2,670353MASSAC1,207$ 9,046$ 3,701$ -$ 336$ -$ -$ 27$ 4,981509MENARD1,011$ 3,790$ 2,241$ -$ 251$ -$ -$ 58$ 1,240236MERCER1,426$ 7,971$ 3,260$ -$ 284$ -$ -$ 77$ 4,350441MONROE2,908$ 10,968$ 5,540$ -$ 992$ -$ -$ 293$ 4,143492MONTGOMERY2,598$ 10,005$ 5,572$ -$ 574$ -$ -$ 229$ 3,631538MORGAN3,077$ 11,203$ 6,849$ -$ 942$ -$ -$ 133$ 3,278668MOULTRIE1,144$ 5,206$ 2,787$ -$ 301$ -$ -$ 148$ 1,970304OGLE4,505$ 15,784$ 7,167$ -$ 985$ -$ -$ 270$ 7,3631,047PEORIA14,273$ 49,770$ 22,231$ -$ 3,541$ -$ -$ 803$ 23,1953,081PERRY1,586$ 10,361$ 4,734$ -$ 302$ -$ - $ 76$ 5,250580PIATT1,457$ 3,783$ 1,894$ -$ 104$ -$ -$ 146$ 1,640288PIKE1,404$ 6,363$ 3,148$ -$ 337$ - $ -$ 86$ 2,791366POPE426$ 2,885$ 1,301$ -$ 73$ -$ -$ 5$ 1,506131PULASKI562$ 6,218$ 2,469$ -$ 41$ -$ 250$ 25$ 3,433281PUTNAM576$ 1,936$ 925$ -$ 47$
  • 58.
    -$ -$ 42$922172RANDOLPH2,934$ 12,038$ 7,091$ -$ 507$ -$ -$ 85$ 4,355659RICHLAND1,323$ 6,773$ 2,711$ -$ 368$ -$ -$ 79$ 3,615427ROCK ISLAND12,265$ 51,967$ 23,116$ -$ 3,089$ -$ 2,865$ 1,158$ 21,7402,803SAINT CLAIR29,935$ 175,069$ 94,200$ -$ 28,486$ -$ -$ 2,518$ 49,8655,310SALINE2,330$ 19,551$ 7,229$ -$ 355$ -$ - $ 224$ 11,743960SANGAMON16,656$ 57,076$ 29,149$ 712$ 5,043$ -$ 1,334$ 1,518$ 19,3212,960SCHUYLER618$ 3,327$ 2,022$ -$ 54$ -$ - $ 109$ 1,141205SCOTT444$ 1,772$ 952$ -$ 91$ -$ - $ 34$ 695119SHELBY2,210$ 7,188$ 3,431$ -$ 277$ - $ -$ 219$ 3,261533STARK502$ 1,845$ 645$ -$ 52$ - $ -$ 50$ 1,098150STEPHENSON3,796$ 19,558$ 7,852$ -$ 730$ -$ -$ 273$ 10,7031,474TAZEWELL12,404$ 38,859$ 19,066$ -$ 3,210$ -$ -$ 859$ 15,7242,367UNION1,618$ 14,084$ 4,866$ -$ 332$ -$ - $ 90$ 8,797655VERMILION6,279$ 85,608$ 19,215$ 344$ 1,761$ -$ 2,276$ 277$ 61,7362,826WABASH1,174$ 4,047$ 2,050$ -$ 162$ -$ -$ 84$ 1,752314WARREN1,327$ 6,844$ 2,797$ -$ 259$ -$ -$ 97$ 3,691446WASHINGTON1,322$ 5,850$ 2,452$ -$ 392$ -$ -$ 271$ 2,734308WAYNE1,251$ 6,899$ 3,039$ -$ 132$ -$ -$ 36$ 3,692471WHITE1,399$ 9,378$ 3,961$ -$ 120$ -$ -$ 104$ 5,193474WHITESIDE5,074$ 20,207$ 8,488$ -$ 1,204$ - $ -$ 161$ 10,3541,693WILL40,017$ 144,065$ 63,193$ -$ 12,463$ -$ -$ 2,378$ 66,0327,406WILLIAMSON5,765$ 62,581$ 19,683$ -$ 1,795$ -$ -$ 326$ 40,7772,796WINNEBAGO21,383$ 86,773$ 37,263$ -$ 4,970$ -$ -$ 1,754$ 42,7855,861WOODFORD3,258$ 9,196$ 3,884$ -$ 684$ - $ -$ 142$ 4,486570ILLINOIS (Totals)744,710$ 3,854,717$ 1,450,236$ 18,558$ 311,330$ -$ 51,835$ 65,139$ 1,957,618180,384CONG. DIST (01)39,777$ 268,743$ 85,178$ -$ 23,289$ -$ -$ 2,797$
  • 59.
    157,47911,714CONG. DIST (02)45,718$255,343$ 86,342$ -$ 21,086$ -$ -$ 2,719$ 145,19612,369CONG. DIST (03)32,941$ 152,600$ 49,431$ -$ 13,115$ -$ -$ 3,144$ 86,9108,074CONG. DIST (04)14,561$ 97,520$ 30,190$ -$ 8,429$ -$ -$ 1,225$ 57,6763,991CONG. DIST (05)24,552$ 118,419$ 37,137$ -$ 11,619$ -$ -$ 2,649$ 67,0145,038CONG. DIST (06)35,414$ 112,260$ 40,247$ -$ 15,867$ -$ -$ 4,110$ 52,0365,901CONG. DIST (07)25,133$ 386,611$ 96,017$ 13,292$ 26,808$ -$ 42,547$ 2,463$ 205,4859,357CONG. DIST (08)29,456$ 120,813$ 42,326$ -$ 17,243$ -$ -$ 2,993$ 58,2525,999CONG. DIST (09)29,222$ 114,943$ 34,241$ -$ 9,560$ -$ -$ 5,444$ 65,6986,096CONG. DIST (10)35,192$ 261,743$ 72,021$ 4,210$ 17,563$ -$ 2,564$ 4,936$ 160,4509,611CONG. DIST (11)34,665$ 135,796$ 56,174$ - $ 16,165$ -$ -$ 2,720$ 60,7376,566CONG. DIST (12)68,247$ 446,392$ 206,250$ -$ 42,836$ -$ 250$ 4,633$ 192,42317,626CONG. DIST (13)55,161$ 217,196$ 110,240$ -$ 16,745$ -$ -$ 3,898$ 86,31211,075CONG. DIST (14)43,344$ 161,183$ 60,945$ -$ 14,791$ -$ -$ 4,078$ 81,3697,890CONG. DIST (15)59,146$ 357,104$ 142,468$ 344$ 14,816$ -$ 2,276$ 4,423$ 192,77717,726CONG. DIST (16)54,746$ 202,285$ 91,905$ -$ 12,888$ -$ -$ 3,927$ 93,56513,200CONG. DIST (17)57,037$ 248,602$ 110,259$ -$ 13,688$ -$ 2,865$ 3,887$ 117,90215,739CONG. DIST (18)60,401$ 197,164$ 98,865$ 712$ 14,823$ -$ 1,334$ 5,094$ 76,33612,412ILLINOIS (Totals)744,710$ 3,854,717$ 1,450,236$ 18,558$ 311,330$ -$ 51,835$ 65,139$ 1,957,618180,384Notes:* Veteran population estimates, as of September 30, 2013, are produced by the VA Office of the Actuary (VetPop 2011).# Prior to FY 08, "Loan Guaranty" expenditures were included in the Education & Vocational Rehabilitation and Employment (E&VRE) programs. Currently, all "Loan Guaranty" expenditures are attributed to Travis County, TX, where all Loan Guaranty payments are
  • 60.
    processed. VA willcontinue to improve data collection for future GDX reports to better distribute loan expenditures at the state, county and congressional district levels.** Unique patients are patients who received treatment at a VA health care facility. Data are provided by the Allocation Resource Center (ARC).Expenditure data sources: USASpending.gov for Compensation & Pension (C&P) and Education and Vocational Rehabilitation and Employment (EVRE) Benefits; Veterans Benefits Administration Insurance Center for the Insurance costs; the VA Financial Management System (FMS) for Construction, Medical Research, General Operating Expenses, and certain C&P and Readjustment data; and the Allocation Resource Center (ARC) for Medical Care costs.1. Expenditures are rounded to the nearest thousand dollars. For example, $500 to $1,000 are rounded to $1; $0 to $499 are rounded to $0; and "$ -" = 0 or no expenditures.2. The Compensation & Pension expenditures include dollars for the following programs: veterans' compensation for service-connected disabilities; dependency and indemnity compensation for service-connected deaths; veterans' pension for nonservice-connected disabilities; and burial and other benefits to veterans and their survivors.3. Medical Care expenditures include dollars for medical services, medical administration, facility maintenance, educational support, research support, and other overhead items. Medical Care expenditures do not include dollars for construction or other non-medical support.4. Medical Care expenditures are based on where patients live instead of where care is delivered.5. A star symbol (*) in the Unique Patients column denotes that there were less than 10 Unique Patients. &"Arial,Bold"&11FY13 GEOGRAPHIC DISTRIBUTION OF VA EXPENDITURES (GDX) &8&P of &N INFY13 Summary of Expenditures by StateExpenditures in $000sCounty/ Congressional DistrictVeteran Population*Total
  • 61.
    ExpenditureCompensation & PensionConstructionEducation& Vocational Rehabilitation/ EmploymentLoan Guaranty#General Operating ExpensesInsurance & IndemnitiesMedical CareUnique Patients**ADAMS1,901$ 6,299$ 2,808$ -$ 382$ -$ -$ 102$ 3,007456ALLEN24,328$ 130,290$ 51,576$ -$ 10,255$ -$ 713$ 1,558$ 66,1897,031BARTHOLOMEW5,795$ 22,152$ 11,403$ -$ 1,631$ -$ -$ 289$ 8,8291,179BENTON690$ 3,485$ 930$ -$ 144$ -$ -$ 16$ 2,394177BLACKFORD1,135$ 6,995$ 3,390$ -$ 259$ -$ -$ 37$ 3,309418BOONE3,808$ 14,847$ 7,107$ -$ 1,391$ -$ -$ 189$ 6,160718BROWN1,507$ 6,389$ 2,378$ -$ 176$ -$ -$ 64$ 3,771467CARROLL2,017$ 6,281$ 2,483$ -$ 296$ -$ -$ 195$ 3,306402CASS3,508$ 15,368$ 7,948$ -$ 500$ -$ -$ 105$ 6,815862CLARK9,281$ 56,540$ 23,699$ -$ 3,420$ -$ -$ 911$ 28,5112,913CLAY2,401$ 12,327$ 5,962$ -$ 813$ -$ -$ 39$ 5,512711CLINTON2,670$ 10,125$ 4,990$ -$ 325$ -$ -$ 101$ 4,709469CRAWFORD925$ 6,080$ 2,451$ -$ 272$ -$ -$ 36$ 3,321311DAVIESS2,031$ 9,606$ 5,546$ -$ 359$ -$ -$ 52$ 3,648561DEARBORN4,396$ 20,305$ 8,039$ -$ 1,635$ -$ -$ 133$ 10,4971,312DECATUR1,892$ 8,432$ 3,651$ -$ 272$ -$ -$ 28$ 4,481481DE KALB2,840$ 16,182$ 8,217$ -$ 599$ -$ -$ 98$ 7,268937DELAWARE9,027$ 43,233$ 21,125$ -$ 2,753$ -$ -$ 332$ 19,0232,565DUBOIS3,011$ 9,584$ 5,093$ -$ 434$ -$ - $ 100$ 3,957758ELKHART11,446$ 44,720$ 22,629$ -$ 2,296$ -$ -$ 641$ 19,1543,410FAYETTE2,115$ 10,749$ 4,586$ -$ 374$ -$ -$ 263$ 5,525601FLOYD6,925$ 32,172$ 14,268$ -$ 1,795$ -$ 590$ 446$ 15,0741,821FOUNTAIN1,389$ 8,750$ 2,991$ -$ 233$ -$ -$ 55$ 5,472430FRANKLIN1,539$ 6,971$ 2,742$ -$ 250$ -$ -$ 43$ 3,936478FULTON1,662$ 7,957$ 3,415$ -$ 225$ -$ -$ 116$ 4,200549GIBSON2,506$ 10,097$ 5,466$ -$ 455$ -$ -$ 227$ 3,948747GRANT5,782$
  • 62.
    101,986$ 27,324$ 7,405$2,633$ -$ 2,277$ 253$ 62,0942,854GREENE3,398$ 16,201$ 8,804$ -$ 826$ -$ -$ 158$ 6,413851HAMILTON17,453$ 61,815$ 31,640$ - $ 7,195$ -$ -$ 1,929$ 21,0512,630HANCOCK6,186$ 32,514$ 18,912$ -$ 2,286$ -$ -$ 289$ 11,0261,262HARRISON3,208$ 18,359$ 8,782$ -$ 807$ - $ -$ 95$ 8,6751,068HENDRICKS13,167$ 53,252$ 24,895$ -$ 3,600$ -$ -$ 801$ 23,9562,585HENRY4,096$ 18,556$ 9,583$ -$ 618$ -$ - $ 101$ 8,255899HOWARD7,759$ 36,720$ 21,372$ -$ 2,483$ -$ -$ 351$ 12,5141,788HUNTINGTON2,767$ 16,284$ 8,372$ -$ 819$ -$ -$ 153$ 6,941920JACKSON2,974$ 12,885$ 6,414$ -$ 587$ -$ - $ 93$ 5,791747JASPER2,618$ 9,646$ 4,642$ -$ 608$ -$ -$ 180$ 4,215546JAY1,785$ 7,639$ 3,155$ -$ 194$ -$ -$ 20$ 4,270518JEFFERSON2,703$ 13,271$ 6,404$ - $ 372$ -$ -$ 57$ 6,437768JENNINGS2,211$ 10,786$ 5,219$ -$ 243$ -$ -$ 88$ 5,236556JOHNSON11,997$ 57,539$ 27,536$ -$ 5,571$ -$ -$ 652$ 23,7802,586KNOX3,009$ 15,864$ 8,603$ -$ 636$ -$ -$ 268$ 6,356930KOSCIUSKO5,200$ 22,203$ 9,594$ -$ 975$ -$ -$ 732$ 10,9011,417LAGRANGE1,749$ 7,358$ 3,502$ -$ 187$ -$ -$ 118$ 3,551473LAKE33,598$ 143,851$ 64,909$ -$ 8,397$ -$ -$ 1,827$ 68,7198,006LA PORTE10,447$ 31,972$ 15,683$ -$ 1,811$ -$ -$ 650$ 13,8281,949LAWRENCE4,011$ 18,895$ 10,242$ -$ 1,125$ -$ -$ 196$ 7,3311,122MADISON11,373$ 51,884$ 28,014$ -$ 2,547$ -$ -$ 632$ 20,6902,708MARION65,183$ 483,322$ 160,122$ 1,378$ 32,239$ -$ 45,352$ 3,883$ 240,34918,263MARSHALL3,078$ 12,327$ 6,514$ -$ 564$ -$ -$ 86$ 5,164945MARTIN1,042$ 5,548$ 3,302$ -$ 196$ -$ -$ 52$ 1,997288MIAMI3,563$ 24,729$ 13,622$ -$ 977$ -$ -$ 146$ 9,9841,481MONROE7,579$ 35,759$ 17,098$ -$ 4,783$ -$ -$ 761$ 13,1182,261MONTGOMERY3,075$ 12,422$ 4,800$ -$
  • 63.
    395$ -$ -$122$ 7,105703MORGAN6,877$ 34,839$ 17,332$ -$ 1,887$ -$ -$ 306$ 15,3131,550NEWTON1,402$ 4,058$ 1,606$ -$ 163$ -$ -$ 42$ 2,247281NOBLE3,151$ 15,238$ 6,521$ -$ 685$ -$ -$ 186$ 7,846875OHIO574$ 3,007$ 1,024$ -$ 115$ -$ -$ 13$ 1,854189ORANGE1,682$ 6,768$ 3,117$ -$ 433$ -$ -$ 73$ 3,144463OWEN2,232$ 10,702$ 5,379$ -$ 444$ -$ -$ 28$ 4,851583PARKE1,461$ 7,179$ 3,119$ -$ 108$ -$ -$ 77$ 3,875452PERRY1,625$ 6,096$ 2,960$ -$ 207$ -$ -$ 25$ 2,904421PIKE1,058$ 3,749$ 2,129$ -$ 139$ -$ -$ 8$ 1,473268PORTER14,002$ 41,958$ 20,577$ -$ 3,598$ -$ -$ 786$ 16,9972,311POSEY2,090$ 8,957$ 4,330$ -$ 302$ -$ -$ 62$ 4,262559PULASKI1,054$ 4,607$ 2,188$ -$ 153$ -$ -$ 181$ 2,085282PUTNAM2,700$ 15,409$ 7,831$ -$ 556$ -$ -$ 95$ 6,926723RANDOLPH1,862$ 10,455$ 4,772$ -$ 313$ -$ -$ 16$ 5,354645RIPLEY2,427$ 10,843$ 5,476$ -$ 527$ -$ -$ 203$ 4,639617RUSH1,548$ 7,498$ 2,769$ -$ 249$ -$ -$ 79$ 4,402321ST. JOSEPH18,458$ 72,170$ 38,588$ -$ 5,277$ -$ -$ 1,353$ 26,9515,563SCOTT1,985$ 11,915$ 5,891$ -$ 341$ -$ -$ 16$ 5,666628SHELBY3,766$ 16,447$ 6,710$ -$ 917$ -$ -$ 108$ 8,713899SPENCER1,661$ 8,560$ 4,821$ -$ 403$ -$ -$ 56$ 3,280468STARKE1,999$ 6,837$ 2,913$ -$ 253$ -$ -$ 103$ 3,568452STEUBEN2,490$ 13,252$ 6,595$ -$ 621$ -$ -$ 34$ 6,003738SULLIVAN2,226$ 8,031$ 4,463$ -$ 380$ -$ -$ 52$ 3,135501SWITZERLAND740$ 3,854$ 1,472$ -$ 107$ -$ -$ 17$ 2,259225TIPPECANOE10,691$ 44,456$ 21,979$ - $ 5,116$ -$ -$ 769$ 16,5912,116TIPTON1,351$ 5,004$ 3,027$ -$ 284$ -$ -$ 31$ 1,662289UNION521$ 3,906$ 1,432$ -$ 132$ -$ -$ 33$ 2,309145VANDERBURGH13,283$ 68,454$ 32,685$ -$ 3,596$ -$ -$ 989$ 31,1844,372VERMILLION1,518$ 9,015$ 3,774$ -$ 261$ -$ -$ 43$ 4,937500VIGO8,482$
  • 64.
    40,026$ 18,893$ -$2,919$ -$ -$ 236$ 17,9782,617WABASH2,833$ 13,426$ 7,077$ -$ 348$ -$ -$ 157$ 5,844820WARREN663$ 3,374$ 1,125$ -$ 100$ -$ -$ 13$ 2,136219WARRICK5,119$ 21,072$ 11,600$ - $ 917$ -$ -$ 347$ 8,2091,231WASHINGTON2,131$ 12,819$ 4,946$ -$ 551$ -$ -$ 75$ 7,247677WAYNE5,968$ 32,803$ 13,846$ -$ 940$ -$ -$ 173$ 17,8441,846WELLS2,051$ 9,031$ 4,334$ -$ 439$ -$ -$ 57$ 4,201543WHITE2,095$ 9,372$ 5,508$ -$ 375$ -$ -$ 182$ 3,307551WHITLEY2,847$ 13,055$ 6,092$ -$ 657$ -$ -$ 44$ 6,263671INDIANA (Totals)490,380$ 2,477,767$ 1,092,855$ 8,783$ 150,033$ -$ 48,931$ 27,941$ 1,149,224128,499CONG. DIST (01)52,853$ 204,014$ 94,479$ -$ 13,034$ -$ -$ 2,874$ 93,62811,278CONG. DIST (02)51,083$ 209,283$ 107,463$ -$ 11,256$ -$ -$ 3,353$ 87,21215,056CONG. DIST (03)49,576$ 249,172$ 107,457$ -$ 15,463$ -$ 713$ 2,939$ 122,60014,084CONG. DIST (04)58,583$ 251,097$ 121,627$ -$ 16,287$ -$ -$ 3,209$ 109,97412,645CONG. DIST (05)52,702$ 288,141$ 117,136$ 7,405$ 17,513$ -$ 2,277$ 4,599$ 139,21012,105CONG. DIST (06)58,436$ 280,975$ 131,735$ -$ 13,885$ -$ -$ 2,261$ 133,09415,285CONG. DIST (07)51,586$ 429,889$ 140,217$ 1,378$ 28,231$ -$ 45,352$ 2,299$ 212,41315,419CONG. DIST (08)58,279$ 271,859$ 137,233$ -$ 13,430$ -$ -$ 2,838$ 118,35816,860CONG. DIST (09)57,282$ 293,337$ 135,509$ -$ 20,934$ -$ 590$ 3,569$ 132,73515,767INDIANA (Totals)490,380$ 2,477,767$ 1,092,855$ 8,783$ 150,033$ -$ 48,931$ 27,941$ 1,149,224128,499Notes:* Veteran population estimates, as of September 30, 2013, are produced by the VA Office of the Actuary (VetPop 2011).# Prior to FY 08, "Loan Guaranty" expenditures were included in the Education & Vocational Rehabilitation and Employment (E&VRE) programs. Currently, all "Loan Guaranty" expenditures are attributed to Travis County, TX, where all Loan Guaranty payments are
  • 65.
    processed. VA willcontinue to improve data collection for future GDX reports to better distribute loan expenditures at the state, county and congressional district levels.** Unique patients are patients who received treatment at a VA health care facility. Data are provided by the Allocation Resource Center (ARC).Expenditure data sources: USASpending.gov for Compensation & Pension (C&P) and Education and Vocational Rehabilitation and Employment (EVRE) Benefits; Veterans Benefits Administration Insurance Center for the Insurance costs; the VA Financial Management System (FMS) for Construction, Medical Research, General Operating Expenses, and certain C&P and Readjustment data; and the Allocation Resource Center (ARC) for Medical Care costs.1. Expenditures are rounded to the nearest thousand dollars. For example, $500 to $1,000 are rounded to $1; $0 to $499 are rounded to $0; and "$ -" = 0 or no expenditures.2. The Compensation & Pension expenditures include dollars for the following programs: veterans' compensation for service-connected disabilities; dependency and indemnity compensation for service-connected deaths; veterans' pension for nonservice-connected disabilities; and burial and other benefits to veterans and their survivors.3. Medical Care expenditures include dollars for medical services, medical administration, facility maintenance, educational support, research support, and other overhead items. Medical Care expenditures do not include dollars for construction or other non-medical support.4. Medical Care expenditures are based on where patients live instead of where care is delivered.5. A star symbol (*) in the Unique Patients column denotes that there were less than 10 Unique Patients. &"Arial,Bold"&11FY13 GEOGRAPHIC DISTRIBUTION OF VA EXPENDITURES (GDX) &8&P of &N KSFY13 Summary of Expenditures by StateExpenditures in $000sCounty/ Congressional DistrictVeteran Population*Total
  • 66.
    ExpenditureCompensation & PensionConstructionEducation& Vocational Rehabilitation/ EmploymentLoan Guaranty#General Operating ExpensesInsurance & IndemnitiesMedical CareUnique Patients**ALLEN1,280$ 4,711$ 2,162$ -$ 246$ -$ -$ 27$ 2,276305ANDERSON666$ 2,967$ 1,227$ -$ 105$ -$ -$ 128$ 1,507173ATCHISON1,369$ 6,876$ 2,787$ -$ 365$ -$ -$ 83$ 3,641348BARBER382$ 1,396$ 731$ -$ 87$ -$ -$ 41$ 536120BARTON2,073$ 7,566$ 3,804$ -$ 250$ -$ -$ 71$ 3,441625BOURBON1,375$ 5,903$ 2,632$ 459$ 219$ -$ -$ 43$ 2,551388BROWN983$ 4,370$ 2,131$ -$ 70$ -$ -$ 14$ 2,155232BUTLER5,888$ 26,518$ 11,506$ -$ 2,506$ -$ -$ 289$ 12,2181,276CHASE301$ 1,076$ 571$ -$ 29$ -$ -$ 137$ 33963CHAUTAUQUA395$ 1,768$ 644$ -$ 38$ -$ -$ 31$ 1,055105CHEROKEE1,788$ 7,380$ 3,931$ -$ 513$ -$ -$ 42$ 2,894465CHEYENNE248$ 758$ 455$ -$ -$ -$ -$ 11$ 29267CLARK197$ 690$ 321$ -$ 3$ -$ -$ 1$ 36567CLAY961$ 6,537$ 3,770$ -$ 547$ -$ -$ 135$ 2,085327CLOUD946$ 4,174$ 2,074$ -$ 155$ -$ -$ 83$ 1,861243COFFEY758$ 3,944$ 1,915$ -$ 226$ -$ - $ 12$ 1,792216COMANCHE193$ 660$ 260$ -$ 19$ -$ -$ 24$ 35649COWLEY2,858$ 15,340$ 5,733$ -$ 871$ -$ -$ 321$ 8,415757CRAWFORD2,787$ 10,492$ 5,907$ -$ 1,361$ -$ -$ 44$ 3,179588DECATUR293$ 929$ 378$ -$ 24$ -$ -$ 51$ 47685DICKINSON2,261$ 15,108$ 7,727$ -$ 1,770$ -$ -$ 512$ 5,099677DONIPHAN678$ 2,662$ 1,001$ -$ 122$ -$ -$ 12$ 1,526175DOUGLAS6,781$ 31,284$ 12,676$ -$ 5,209$ -$ -$ 413$ 12,9861,476EDWARDS265$ 873$ 388$ -$ 22$ -$ -$ 2$ 46182ELK305$ 2,144$ 977$ - $ 46$ -$ -$ 11$ 1,10999ELLIS1,716$ 6,998$ 2,983$ -$ 832$ -$ -$ 117$ 3,066634ELLSWORTH586$ 2,061$ 960$ -$ 156$ -$ -$ 131$ 814174FINNEY1,500$ 4,196$ 2,216$ -$ 260$ -$ -$ 72$ 1,647311FORD1,315$ 7,982$ 2,865$ -$ 1,280$ -$ -$
  • 67.
    56$ 3,782531FRANKLIN2,058$ 9,976$4,698$ -$ 815$ -$ -$ 51$ 4,413533GEARY5,231$ 51,700$ 28,907$ -$ 11,065$ -$ -$ 425$ 11,3021,615GOVE217$ 661$ 378$ -$ 5$ -$ -$ 16$ 26393GRAHAM228$ 810$ 421$ -$ 8$ -$ -$ 52$ 32967GRANT308$ 707$ 292$ -$ 48$ - $ -$ 24$ 34338GRAY239$ 780$ 325$ -$ 15$ -$ -$ 4$ 43781GREELEY97$ 109$ 77$ -$ -$ -$ -$ -$ 3211GREENWOOD702$ 3,558$ 1,617$ -$ 113$ -$ -$ 40$ 1,787184HAMILTON195$ 474$ 215$ -$ 51$ -$ -$ 36$ 17241HARPER510$ 1,623$ 546$ -$ 32$ -$ -$ 9$ 1,036113HARVEY2,671$ 10,533$ 4,185$ -$ 831$ -$ -$ 96$ 5,421534HASKELL182$ 607$ 243$ -$ 8$ -$ -$ 55$ 30133HODGEMAN162$ 684$ 378$ -$ 32$ -$ -$ 41$ 23352JACKSON1,135$ 8,079$ 3,997$ -$ 243$ -$ -$ 86$ 3,754394JEFFERSON1,815$ 12,587$ 5,036$ -$ 604$ -$ -$ 68$ 6,878534JEWELL301$ 1,297$ 652$ -$ 28$ -$ -$ 1$ 61592JOHNSON36,844$ 131,071$ 65,897$ -$ 12,857$ -$ -$ 4,467$ 47,8506,502KEARNY235$ 985$ 476$ -$ 33$ -$ -$ 1$ 47542KINGMAN685$ 2,694$ 1,084$ -$ 214$ -$ -$ 112$ 1,285186KIOWA223$ 517$ 232$ -$ 40$ -$ -$ 16$ 22842LABETTE1,808$ 7,266$ 3,788$ -$ 243$ -$ -$ 74$ 3,162476LANE177$ 436$ 234$ -$ 3$ -$ -$ 10$ 18952LEAVENWORTH10,806$ 110,942$ 40,347$ 284$ 8,244$ -$ 12,960$ 527$ 48,5793,155LINCOLN334$ 1,287$ 441$ -$ 75$ -$ -$ 69$ 702100LINN875$ 5,131$ 2,863$ -$ 157$ -$ -$ 71$ 2,040317LOGAN269$ 533$ 312$ -$ 12$ -$ -$ 13$ 19670LYON2,269$ 12,108$ 5,496$ -$ 678$ -$ -$ 237$ 5,697645MCPHERSON2,125$ 7,753$ 3,381$ -$ 514$ -$ -$ 146$ 3,712503MARION805$ 3,623$ 1,703$ -$ 116$ -$ -$ 16$ 1,788215MARSHALL1,046$ 4,503$ 2,241$ -$ 137$ -$ -$ 23$ 2,101293MEADE293$ 793$ 481$ -$ 10$ -$ -$ 1$ 30281MIAMI2,500$ 9,757$ 5,080$ -$ 494$ -$ -$ 48$ 4,134692MITCHELL523$ 1,754$ 723$ -$ 73$ -$ -$ 63$ 896146MONTGOMERY3,096$
  • 68.
    11,785$ 6,585$ -$474$ -$ -$ 106$ 4,619708MORRIS618$ 4,466$ 2,446$ -$ 278$ -$ -$ 41$ 1,701202MORTON184$ 510$ 350$ -$ -$ -$ -$ 54$ 10631NEMAHA858$ 3,593$ 1,474$ -$ 128$ -$ -$ 67$ 1,925240NEOSHO1,301$ 5,783$ 2,510$ -$ 252$ -$ -$ 87$ 2,934367NESS284$ 692$ 316$ -$ 14$ -$ -$ 12$ 34994NORTON455$ 1,975$ 770$ -$ 78$ -$ -$ 41$ 1,086148OSAGE1,671$ 11,413$ 4,435$ -$ 382$ -$ -$ 88$ 6,508600OSBORNE339$ 1,312$ 608$ -$ 31$ -$ -$ 281$ 39195OTTAWA500$ 2,639$ 1,009$ -$ 94$ -$ -$ 99$ 1,437145PAWNEE544$ 2,523$ 1,257$ -$ 37$ - $ -$ 13$ 1,216176PHILLIPS467$ 2,085$ 1,143$ -$ 13$ -$ -$ 33$ 896202POTTAWATOMIE1,603$ 9,696$ 3,930$ -$ 894$ -$ -$ 35$ 4,838513PRATT735$ 2,542$ 1,128$ -$ 56$ -$ -$ 77$ 1,281141RAWLINS262$ 527$ 285$ -$ 3$ -$ -$ 49$ 19062RENO5,369$ 23,862$ 9,858$ -$ 1,024$ -$ -$ 371$ 12,6081,500REPUBLIC523$ 1,803$ 749$ -$ 33$ -$ -$ 40$ 982134RICE831$ 2,942$ 1,670$ -$ 82$ -$ -$ 23$ 1,166201RILEY5,539$ 37,812$ 18,570$ -$ 10,940$ -$ -$ 363$ 7,9381,160ROOKS452$ 2,289$ 1,122$ -$ 48$ -$ -$ 25$ 1,093163RUSH335$ 1,098$ 532$ -$ 65$ -$ -$ 5$ 497133RUSSELL647$ 2,991$ 1,358$ -$ 35$ -$ -$ 61$ 1,537245SALINE4,800$ 21,651$ 9,486$ -$ 3,016$ -$ -$ 122$ 9,0271,413SCOTT325$ 937$ 450$ -$ 29$ -$ -$ 21$ 43676SEDGWICK38,061$ 226,650$ 85,014$ -$ 20,305$ -$ 9,846$ 3,374$ 108,1129,644SEWARD976$ 2,352$ 945$ -$ 235$ -$ -$ 28$ 1,143176SHAWNEE16,526$ 163,096$ 58,275$ -$ 5,825$ -$ 4,352$ 1,114$ 93,5315,960SHERIDAN222$ 415$ 218$ -$ 2$ -$ -$ 21$ 17553SHERMAN620$ 1,654$ 827$ -$ 57$ -$ -$ 13$ 758129SMITH345$ 1,347$ 776$ -$ 10$ -$ -$ 45$ 517128STAFFORD335$ 1,859$ 852$ -$ 34$ -$ -$ 14$ 95994STANTON127$ 181$ 72$ -$ -$ -$ -$ 6$ 10418STEVENS306$ 539$ 262$ -$ 42$ -$ -$ 1$ 23449SUMNER2,072$ 8,693$
  • 69.
    4,270$ -$ 458$-$ -$ 48$ 3,917454THOMAS449$ 1,194$ 697$ -$ 87$ -$ -$ 43$ 368129TREGO269$ 1,082$ 661$ -$ 10$ -$ -$ 1$ 410107WABAUNSEE661$ 5,407$ 2,093$ -$ 206$ -$ -$ 250$ 2,858232WALLACE125$ 327$ 217$ -$ 42$ -$ -$ 13$ 5628WASHINGTON476$ 2,066$ 1,177$ -$ 52$ -$ -$ 27$ 810138WICHITA152$ 497$ 241$ -$ 32$ -$ -$ 101$ 12330WILSON889$ 3,596$ 1,668$ -$ 132$ -$ -$ 32$ 1,764205WOODSON392$ 1,806$ 622$ -$ 37$ -$ - $ 11$ 1,13698WYANDOTTE9,949$ 65,599$ 26,618$ -$ 3,247$ -$ -$ 273$ 35,4603,086KANSAS (Totals)223,708$ 1,237,985$ 529,023$ 743$ 103,950$ -$ 27,158$ 17,340$ 559,77158,097CONG. DIST (01)55,814$ 286,000$ 138,323$ -$ 35,630$ -$ -$ 4,836$ 107,21115,815CONG. DIST (02)64,080$ 445,399$ 177,706$ 743$ 26,419$ -$ 17,313$ 3,217$ 220,00218,602CONG. DIST (03)47,496$ 199,135$ 93,797$ -$ 16,229$ -$ -$ 4,757$ 84,3539,790CONG. DIST (04)56,318$ 307,451$ 119,198$ - $ 25,673$ -$ 9,846$ 4,530$ 148,20413,890KANSAS (Totals)223,708$ 1,237,985$ 529,023$ 743$ 103,950$ -$ 27,158$ 17,340$ 559,77158,097Notes:* Veteran population estimates, as of September 30, 2013, are produced by the VA Office of the Actuary (VetPop 2011).# Prior to FY 08, "Loan Guaranty" expenditures were included in the Education & Vocational Rehabilitation and Employment (E&VRE) programs. Currently, all "Loan Guaranty" expenditures are attributed to Travis County, TX, where all Loan Guaranty payments are processed. VA will continue to improve data collection for future GDX reports to better distribute loan expenditures at the state, county and congressional district levels.** Unique patients are patients who received treatment at a VA health care facility. Data are provided by the Allocation Resource Center (ARC).Expenditure data sources: USASpending.gov for Compensation & Pension (C&P) and Education and Vocational Rehabilitation and Employment (EVRE) Benefits; Veterans Benefits Administration Insurance Center for the Insurance
  • 70.
    costs; the VAFinancial Management System (FMS) for Construction, Medical Research, General Operating Expenses, and certain C&P and Readjustment data; and the Allocation Resource Center (ARC) for Medical Care costs.1. Expenditures are rounded to the nearest thousand dollars. For example, $500 to $1,000 are rounded to $1; $0 to $499 are rounded to $0; and "$ -" = 0 or no expenditures.2. The Compensation & Pension expenditures include dollars for the following programs: veterans' compensation for service-connected disabilities; dependency and indemnity compensation for service-connected deaths; veterans' pension for nonservice-connected disabilities; and burial and other benefits to veterans and their survivors.3. Medical Care expenditures include dollars for medical services, medical administration, facility maintenance, educational support, research support, and other overhead items. Medical Care expenditures do not include dollars for construction or other non-medical support.4. Medical Care expenditures are based on where patients live instead of where care is delivered.5. A star symbol (*) in the Unique Patients column denotes that there were less than 10 Unique Patients. &"Arial,Bold"&11FY13 GEOGRAPHIC DISTRIBUTION OF VA EXPENDITURES (GDX) &8&P of &N KYFY13 Summary of Expenditures by StateExpenditures in $000sCounty/ Congressional DistrictVeteran Population*Total ExpenditureCompensation & PensionConstructionEducation & Vocational Rehabilitation/ EmploymentLoan Guaranty#General Operating ExpensesInsurance & IndemnitiesMedical CareUnique Patients**ADAIR1,204$ 8,083$ 4,135$ -$ 405$ -$ -$ 8$ 3,535381ALLEN1,371$ 7,669$ 4,451$ - $ 352$ -$ -$ 78$ 2,788357ANDERSON1,668$ 11,076$ 5,237$ -$ 693$ -$ -$ 79$ 5,067500BALLARD778$ 4,298$ 2,040$ -$ 173$ -$ -$ 38$ 2,047271BARREN3,035$ 15,782$ 9,670$ -$ 578$ -$ -$
  • 71.
    60$ 5,474727BATH831$ 7,073$3,415$ -$ 171$ -$ -$ 10$ 3,478349BELL1,976$ 12,563$ 8,260$ -$ 339$ -$ - $ 75$ 3,889474BOONE9,598$ 43,210$ 17,653$ -$ 4,291$ -$ -$ 597$ 20,6692,294BOURBON1,734$ 9,174$ 3,842$ -$ 299$ -$ -$ 72$ 4,960522BOYD4,792$ 33,523$ 16,730$ -$ 1,210$ -$ -$ 159$ 15,4241,425BOYLE2,645$ 12,357$ 6,271$ -$ 615$ -$ - $ 153$ 5,318656BRACKEN748$ 3,896$ 1,585$ -$ 117$ -$ -$ 42$ 2,151207BREATHITT920$ 7,583$ 4,509$ -$ 99$ -$ -$ 253$ 2,721364BRECKINRIDGE1,797$ 10,948$ 5,892$ -$ 393$ -$ -$ 78$ 4,585562BULLITT7,178$ 27,776$ 12,276$ -$ 1,951$ -$ -$ 229$ 13,3191,575BUTLER1,026$ 4,791$ 2,913$ -$ 163$ -$ - $ 14$ 1,701265CALDWELL1,180$ 6,178$ 3,603$ -$ 237$ -$ -$ 49$ 2,288353CALLOWAY2,919$ 17,871$ 9,132$ -$ 1,584$ -$ -$ 242$ 6,913721CAMPBELL6,473$ 41,358$ 12,670$ -$ 2,767$ - $ -$ 478$ 25,4431,998CARLISLE411$ 2,422$ 1,182$ -$ 31$ -$ -$ 9$ 1,201150CARROLL1,224$ 5,883$ 2,236$ -$ 181$ -$ -$ 20$ 3,447312CARTER1,556$ 16,781$ 8,130$ -$ 415$ -$ -$ 47$ 8,189684CASEY1,073$ 8,426$ 4,007$ -$ 118$ -$ -$ 97$ 4,203419CHRISTIAN7,883$ 65,365$ 36,338$ -$ 12,355$ -$ -$ 387$ 16,2862,204CLARK3,306$ 19,578$ 9,206$ - $ 639$ -$ -$ 65$ 9,667967CLAY1,219$ 8,359$ 4,780$ -$ 115$ -$ -$ 2$ 3,463355CLINTON721$ 4,591$ 2,879$ -$ 76$ -$ -$ 31$ 1,606227CRITTENDEN778$ 4,489$ 2,555$ -$ 128$ -$ -$ 105$ 1,701225CUMBERLAND569$ 3,357$ 2,293$ -$ 42$ -$ -$ 1$ 1,021126DAVIESS8,235$ 39,986$ 23,455$ -$ 1,813$ -$ -$ 369$ 14,3492,176EDMONSON971$ 4,587$ 2,414$ -$ 99$ -$ -$ 51$ 2,022275ELLIOTT295$ 1,645$ 751$ -$ 43$ -$ -$ 14$ 83682ESTILL1,096$ 9,440$ 4,369$ -$ 221$ -$ -$ 4$ 4,847356FAYETTE19,955$ 146,160$ 52,090$ 788$ 11,329$ -$ 2,978$ 1,548$ 77,4286,229FLEMING1,029$
  • 72.
    8,853$ 4,012$ -$220$ -$ -$ 171$ 4,449443FLOYD2,009$ 19,461$ 11,109$ -$ 330$ -$ -$ 312$ 7,711922FRANKLIN4,663$ 24,356$ 11,888$ -$ 1,098$ -$ -$ 431$ 10,9401,043FULTON553$ 4,315$ 2,386$ -$ 82$ -$ -$ 7$ 1,840204GALLATIN750$ 3,395$ 1,628$ -$ 91$ -$ -$ 9$ 1,667191GARRARD1,202$ 9,312$ 4,423$ -$ 248$ -$ -$ 63$ 4,579500GRANT2,133$ 10,397$ 5,218$ -$ 634$ -$ -$ 22$ 4,524506GRAVES2,737$ 18,238$ 8,714$ -$ 913$ -$ -$ 120$ 8,4921,039GRAYSON2,043$ 12,732$ 7,417$ -$ 398$ -$ -$ 39$ 4,878641GREEN1,088$ 4,264$ 2,260$ -$ 170$ -$ -$ 14$ 1,819252GREENUP3,408$ 21,237$ 11,281$ -$ 423$ -$ -$ 154$ 9,3791,046HANCOCK800$ 3,103$ 1,963$ -$ 103$ -$ -$ 3$ 1,034184HARDIN15,985$ 158,898$ 107,052$ -$ 21,944$ -$ -$ 971$ 28,9314,681HARLAN1,935$ 20,624$ 12,968$ -$ 339$ -$ -$ 180$ 7,137729HARRISON1,456$ 9,535$ 4,309$ -$ 158$ -$ -$ 158$ 4,909462HART1,305$ 7,442$ 4,041$ -$ 248$ -$ -$ 47$ 3,106358HENDERSON3,331$ 16,418$ 7,999$ -$ 560$ -$ -$ 319$ 7,5391,063HENRY1,434$ 7,724$ 3,378$ -$ 367$ -$ -$ 54$ 3,925336HICKMAN448$ 1,726$ 797$ -$ 2$ -$ -$ 7$ 921124HOPKINS3,718$ 23,269$ 12,960$ -$ 895$ -$ -$ 194$ 9,2201,171JACKSON572$ 6,152$ 3,283$ -$ 106$ -$ -$ -$ 2,764253JEFFERSON56,170$ 376,917$ 135,429$ 5,016$ 27,097$ -$ 33,328$ 4,444$ 171,60416,404JESSAMINE3,493$ 32,040$ 11,701$ 378$ 1,313$ -$ 1,111$ 170$ 17,3671,310JOHNSON1,616$ 17,186$ 10,075$ -$ 250$ -$ -$ 42$ 6,819669KENTON12,661$ 62,239$ 20,923$ -$ 4,504$ -$ -$ 832$ 35,9803,276KNOTT793$ 6,519$ 4,043$ -$ 126$ -$ -$ 10$ 2,341327KNOX2,165$ 12,709$ 7,031$ -$ 573$ -$ -$ 42$ 5,064574LARUE1,418$ 6,477$ 3,932$ -$ 348$ -$ -$ 125$ 2,072326LAUREL3,619$ 32,393$ 17,125$ -$ 746$ -$ -$ 110$
  • 73.
    14,4131,506LAWRENCE1,026$ 9,811$ 5,345$-$ 142$ - $ -$ 37$ 4,287448LEE500$ 3,932$ 2,294$ -$ 109$ -$ -$ 1$ 1,528189LESLIE455$ 3,814$ 2,369$ -$ 157$ -$ -$ -$ 1,288197LETCHER1,253$ 10,592$ 6,853$ -$ 109$ -$ -$ 23$ 3,607474LEWIS819$ 7,499$ 3,441$ -$ 171$ -$ -$ 3$ 3,885307LINCOLN1,692$ 14,591$ 7,200$ -$ 340$ -$ -$ 62$ 6,989695LIVINGSTON892$ 4,710$ 2,734$ -$ 249$ -$ -$ 18$ 1,709288LOGAN2,113$ 12,208$ 5,953$ -$ 477$ -$ -$ 12$ 5,767509LYON817$ 5,136$ 2,884$ -$ 126$ -$ -$ 26$ 2,100249MCCRACKEN6,067$ 32,601$ 16,255$ -$ 1,651$ -$ -$ 227$ 14,4681,996MCCREARY1,174$ 13,254$ 7,436$ -$ 226$ -$ -$ 19$ 5,573573MCLEAN833$ 3,381$ 2,166$ -$ 87$ -$ -$ 5$ 1,123179MADISON6,065$ 45,622$ 22,571$ -$ 4,799$ -$ -$ 494$ 17,7582,151MAGOFFIN441$ 5,095$ 2,964$ -$ 92$ -$ -$ 29$ 2,009228MARION1,282$ 8,558$ 3,830$ 937$ 269$ -$ 442$ 26$ 3,054338MARSHALL3,198$ 19,947$ 7,999$ -$ 592$ -$ -$ 363$ 10,9931,051MARTIN537$ 5,747$ 2,715$ -$ 37$ -$ -$ 11$ 2,983212MASON1,398$ 7,529$ 3,417$ -$ 265$ -$ -$ 42$ 3,804396MEADE3,646$ 20,786$ 11,848$ -$ 1,704$ -$ -$ 144$ 7,0901,004MENIFEE496$ 3,661$ 2,234$ -$ 61$ -$ -$ 3$ 1,364173MERCER1,791$ 10,845$ 5,062$ -$ 400$ -$ -$ 37$ 5,346529METCALFE681$ 3,767$ 2,080$ -$ 109$ -$ -$ 25$ 1,553164MONROE671$ 3,368$ 2,411$ -$ 112$ -$ -$ 9$ 836148MONTGOMERY2,080$ 14,379$ 6,356$ -$ 572$ -$ -$ 121$ 7,331651MORGAN1,016$ 4,693$ 2,488$ -$ 116$ -$ -$ 4$ 2,086245MUHLENBERG2,147$ 11,847$ 7,249$ -$ 259$ -$ -$ 196$ 4,144530NELSON3,549$ 17,549$ 8,961$ -$ 1,192$ -$ -$ 102$ 7,294906NICHOLAS605$ 4,451$ 1,680$ -$ 98$ -$ -$ 4$ 2,669237OHIO2,021$ 10,329$ 6,408$ -$ 206$ -$ -$ 71$ 3,644527OLDHAM5,175$ 16,170$ 8,058$ -$ 1,568$ -$ -$ 222$
  • 74.
    6,322850OWEN952$ 3,302$ 974$-$ 35$ -$ -$ 37$ 2,256224OWSLEY300$ 2,663$ 2,075$ -$ 8$ -$ -$ -$ 58041PENDLETON1,272$ 7,119$ 2,495$ -$ 229$ -$ -$ 74$ 4,321356PERRY1,466$ 18,627$ 12,418$ -$ 314$ -$ -$ 26$ 5,869710PIKE3,615$ 29,220$ 18,019$ -$ 496$ -$ -$ 228$ 10,4771,312POWELL991$ 8,826$ 4,896$ -$ 146$ -$ -$ 4$ 3,779383PULASKI5,259$ 42,587$ 22,923$ 10$ 1,201$ -$ 124$ 230$ 18,0992,220ROBERTSON196$ 1,078$ 553$ -$ 10$ -$ - $ 10$ 50455ROCKCASTLE925$ 7,484$ 4,202$ -$ 111$ -$ -$ 10$ 3,162388ROWAN1,458$ 11,677$ 5,431$ -$ 538$ -$ -$ 21$ 5,687584RUSSELL1,373$ 9,212$ 5,377$ -$ 325$ -$ -$ 9$ 3,500450SCOTT3,555$ 17,406$ 8,410$ -$ 1,159$ -$ -$ 96$ 7,740899SHELBY3,442$ 13,091$ 6,519$ -$ 1,251$ -$ - $ 100$ 5,221690SIMPSON1,421$ 7,256$ 4,352$ -$ 208$ -$ -$ 21$ 2,675357SPENCER1,130$ 6,069$ 3,211$ -$ 393$ -$ -$ 51$ 2,413348TAYLOR1,514$ 11,031$ 6,039$ -$ 891$ -$ -$ 102$ 3,998524TODD926$ 5,979$ 3,395$ -$ 332$ -$ -$ 10$ 2,242249TRIGG1,413$ 10,452$ 6,814$ -$ 803$ -$ -$ 34$ 2,801458TRIMBLE732$ 4,198$ 2,046$ -$ 67$ -$ -$ 61$ 2,025221UNION1,039$ 6,516$ 3,596$ -$ 129$ -$ -$ 14$ 2,777358WARREN7,952$ 41,769$ 24,224$ -$ 3,676$ -$ -$ 571$ 13,2971,813WASHINGTON704$ 4,347$ 2,062$ -$ 260$ -$ -$ 23$ 2,002193WAYNE1,560$ 10,306$ 5,988$ -$ 226$ -$ -$ 111$ 3,981508WEBSTER963$ 5,055$ 2,933$ -$ 184$ - $ -$ 12$ 1,926306WHITLEY2,611$ 28,360$ 17,824$ -$ 916$ -$ -$ 94$ 9,526946WOLFE422$ 4,237$ 2,486$ - $ 67$ -$ -$ 2$ 1,682183WOODFORD2,004$ 11,628$ 4,931$ -$ 602$ -$ -$ 69$ 6,025548KENTUCKY (Totals)339,334$ 2,229,580$ 1,087,772$ 7,129$ 139,199$ -$ 37,983$ 18,871$ 938,626101,096CONG. DIST (01)59,054$ 368,065$ 197,941$ 937$ 24,962$ -$ 442$ 2,871$ 140,91117,716CONG. DIST (02)67,835$ 430,326$
  • 75.
    252,187$ 378$ 36,991$-$ 1,111$ 3,139$ 136,52018,148CONG. DIST (03)54,852$ 373,713$ 134,171$ 5,016$ 26,845$ -$ 33,328$ 4,311$ 170,04216,150CONG. DIST (04)59,243$ 298,443$ 123,114$ -$ 18,580$ -$ -$ 3,168$ 153,58115,109CONG. DIST (05)44,667$ 390,236$ 223,524$ 10$ 8,825$ -$ 124$ 2,004$ 155,74917,203CONG. DIST (06)53,684$ 368,797$ 156,835$ 788$ 22,996$ -$ 2,978$ 3,378$ 181,82316,770KENTUCKY (Totals)339,334$ 2,229,580$ 1,087,772$ 7,129$ 139,199$ -$ 37,983$ 18,871$ 938,626101,096Notes:* Veteran population estimates, as of September 30, 2013, are produced by the VA Office of the Actuary (VetPop 2011).# Prior to FY 08, "Loan Guaranty" expenditures were included in the Education & Vocational Rehabilitation and Employment (E&VRE) programs. Currently, all "Loan Guaranty" expenditures are attributed to Travis County, TX, where all Loan Guaranty payments are processed. VA will continue to improve data collection for future GDX reports to better distribute loan expenditures at the state, county and congressional district levels.** Unique patients are patients who received treatment at a VA health care facility. Data are provided by the Allocation Resource Center (ARC).Expenditure data sources: USASpending.gov for Compensation & Pension (C&P) and Education and Vocational Rehabilitation and Employment (EVRE) Benefits; Veterans Benefits Administration Insurance Center for the Insurance costs; the VA Financial Management System (FMS) for Construction, Medical Research, General Operating Expenses, and certain C&P and Readjustment data; and the Allocation Resource Center (ARC) for Medical Care costs.1. Expenditures are rounded to the nearest thousand dollars. For example, $500 to $1,000 are rounded to $1; $0 to $499 are rounded to $0; and "$ -" = 0 or no expenditures.2. The Compensation & Pension expenditures include dollars for the following programs: veterans' compensation for service-connected disabilities; dependency and indemnity compensation for service-connected
  • 76.
    deaths; veterans' pensionfor nonservice-connected disabilities; and burial and other benefits to veterans and their survivors.3. Medical Care expenditures include dollars for medical services, medical administration, facility maintenance, educational support, research support, and other overhead items. Medical Care expenditures do not include dollars for construction or other non-medical support.4. Medical Care expenditures are based on where patients live instead of where care is delivered.5. A star symbol (*) in the Unique Patients column denotes that there were less than 10 Unique Patients. &"Arial,Bold"&11FY13 GEOGRAPHIC DISTRIBUTION OF VA EXPENDITURES (GDX) &8&P of &N LAFY13 Summary of Expenditures by StateExpenditures in $000sCounty/ Congressional DistrictVeteran Population*Total ExpenditureCompensation & PensionConstructionEducation & Vocational Rehabilitation/ EmploymentLoan Guaranty#General Operating ExpensesInsurance & IndemnitiesMedical CareUnique Patients**ACADIA3,646$ 19,965$ 10,566$ -$ 543$ -$ -$ 108$ 8,7481,106ALLEN1,812$ 10,784$ 5,289$ -$ 216$ -$ -$ 143$ 5,136551ASCENSION6,717$ 28,694$ 16,133$ -$ 2,467$ -$ -$ 172$ 9,9231,216ASSUMPTION1,350$ 5,831$ 3,710$ -$ 157$ - $ -$ 53$ 1,911340AVOYELLES2,845$ 22,541$ 12,296$ -$ 448$ -$ -$ 29$ 9,7671,142BEAUREGARD3,479$ 29,545$ 18,008$ -$ 2,435$ -$ -$ 393$ 8,7101,143BIENVILLE1,096$ 10,084$ 4,271$ -$ 296$ -$ -$ 42$ 5,475393BOSSIER13,331$ 98,022$ 55,156$ -$ 9,722$ -$ -$ 748$ 32,3953,679CADDO21,403$ 161,731$ 69,976$ -$ 9,398$ -$ 1,955$ 1,315$ 79,0876,617CALCASIEU15,307$ 72,348$ 38,514$ -$ 4,194$ -$ -$ 700$ 28,9403,431CALDWELL728$ 4,639$ 2,862$ -$ 105$ -$ -$ 1$ 1,670221CAMERON593$ 962$ 379$ -$ 11$ -$ -$ 28$ 54484CATAHOULA638$
  • 77.
    6,751$ 3,360$ -$34$ -$ -$ 4$ 3,353292CLAIBORNE1,243$ 6,638$ 3,494$ -$ 199$ -$ -$ 51$ 2,894340CONCORDIA1,249$ 9,394$ 5,087$ -$ 244$ -$ -$ 78$ 3,985532DE SOTO1,986$ 12,504$ 5,913$ -$ 395$ -$ -$ 60$ 6,136614EAST BATON ROUGE28,112$ 139,723$ 72,743$ 890$ 12,314$ -$ 1,362$ 1,852$ 50,5635,681EAST CARROLL523$ 2,039$ 1,031$ -$ 55$ -$ -$ 7$ 946118EAST FELICIANA1,802$ 9,571$ 6,220$ -$ 289$ -$ -$ 62$ 2,999410EVANGELINE1,834$ 12,361$ 6,789$ -$ 395$ - $ -$ 86$ 5,092629FRANKLIN1,254$ 9,227$ 5,400$ -$ 147$ -$ -$ 17$ 3,663484GRANT1,814$ 18,534$ 8,217$ -$ 418$ -$ -$ 119$ 9,782846IBERIA4,705$ 21,125$ 12,730$ -$ 764$ -$ -$ 339$ 7,2931,232IBERVILLE2,300$ 11,057$ 6,515$ -$ 481$ -$ -$ 50$ 4,012463JACKSON1,193$ 9,420$ 4,811$ -$ 178$ -$ -$ 58$ 4,373408JEFFERSON27,001$ 151,304$ 75,385$ -$ 11,034$ -$ -$ 2,817$ 62,0685,605JEFFERSON DAVIS1,978$ 16,394$ 8,479$ -$ 265$ -$ -$ 100$ 7,550847LAFAYETTE14,041$ 69,733$ 40,881$ -$ 6,191$ -$ -$ 1,189$ 21,4713,768LAFOURCHE4,781$ 22,578$ 12,725$ -$ 1,239$ -$ -$ 267$ 8,3481,388LA SALLE931$ 7,450$ 3,930$ -$ 205$ -$ -$ 145$ 3,170360LINCOLN2,133$ 19,511$ 12,222$ -$ 1,146$ -$ -$ 353$ 5,790626LIVINGSTON8,679$ 38,597$ 20,212$ -$ 2,975$ -$ -$ 382$ 15,0281,674MADISON674$ 6,804$ 2,131$ - $ 73$ -$ -$ 13$ 4,587282MOREHOUSE2,020$ 12,004$ 6,644$ -$ 238$ -$ -$ 35$ 5,086690NATCHITOCHES2,504$ 22,165$ 11,326$ -$ 861$ -$ -$ 43$ 9,9351,057ORLEANS18,247$ 381,663$ 61,551$ 200,027$ 11,615$ -$ 21,423$ 1,245$ 85,8016,447OUACHITA10,507$ 64,822$ 38,728$ -$ 2,993$ -$ -$ 489$ 22,6123,421PLAQUEMINES1,464$ 7,282$ 3,658$ -$ 1,594$ -$ -$ 26$ 2,003283POINTE COUPEE1,649$ 7,318$ 4,101$ -$ 396$ -$ -$ 20$
  • 78.
    2,801346RAPIDES10,926$ 142,179$ 58,421$1,861$ 4,055$ -$ 1,761$ 1,130$ 74,9515,194RED RIVER531$ 3,960$ 2,008$ -$ 79$ -$ -$ 7$ 1,866156RICHLAND1,149$ 8,028$ 4,550$ -$ 289$ -$ - $ 35$ 3,155418SABINE1,869$ 16,653$ 8,458$ -$ 399$ -$ -$ 126$ 7,671713ST. BERNARD2,305$ 11,456$ 4,951$ -$ 829$ -$ -$ 78$ 5,598446ST. CHARLES3,767$ 14,613$ 6,908$ -$ 1,021$ -$ -$ 175$ 6,509606ST. HELENA804$ 3,305$ 1,512$ -$ 34$ -$ -$ 42$ 1,717186ST. JAMES1,414$ 7,364$ 4,101$ -$ 182$ -$ -$ 126$ 2,955328ST. JOHN THE BAPTIST3,040$ 21,098$ 11,014$ -$ 936$ -$ -$ 142$ 9,006873ST. LANDRY5,525$ 37,979$ 22,239$ -$ 1,223$ -$ -$ 362$ 14,1571,929ST. MARTIN3,103$ 16,143$ 9,364$ -$ 649$ -$ -$ 168$ 5,963923ST. MARY3,198$ 13,335$ 6,734$ -$ 686$ -$ -$ 53$ 5,862943ST. TAMMANY20,348$ 102,272$ 59,020$ -$ 7,868$ -$ -$ 1,963$ 33,4214,167TANGIPAHOA8,573$ 50,429$ 24,813$ -$ 2,784$ -$ -$ 344$ 22,4882,147TENSAS436$ 1,970$ 973$ -$ 18$ -$ -$ 10$ 968104TERREBONNE6,921$ 28,349$ 15,913$ -$ 1,784$ -$ -$ 502$ 10,1501,793UNION1,726$ 11,210$ 6,745$ -$ 254$ -$ - $ 54$ 4,157567VERMILION3,180$ 16,246$ 10,341$ -$ 762$ -$ -$ 186$ 4,958922VERNON7,301$ 62,158$ 38,437$ -$ 7,788$ -$ -$ 275$ 15,6592,299WASHINGTON3,560$ 24,511$ 14,494$ -$ 756$ -$ -$ 208$ 9,0531,198WEBSTER3,341$ 26,217$ 12,389$ -$ 774$ -$ -$ 197$ 12,8571,155WEST BATON ROUGE1,329$ 7,814$ 4,061$ -$ 367$ -$ -$ 53$ 3,332344WEST CARROLL838$ 4,162$ 2,426$ -$ 150$ - $ -$ 4$ 1,582241WEST FELICIANA1,352$ 2,350$ 1,439$ -$ 161$ -$ -$ 32$ 717105WINN1,239$ 7,469$ 3,450$ -$ 189$ -$ -$ 30$ 3,800367LOUISIANA (Totals)315,342$ 2,202,388$ 1,016,206$ 202,777$ 120,767$ -$ 26,501$ 19,941$ 816,19586,890CONG. DIST (01)53,427$ 244,437$ 129,527$ -$ 18,260$ -$ -$
  • 79.
    5,063$ 91,58610,613CONG. DIST(02)42,498$ 578,119$ 163,648$ 200,916$ 25,548$ -$ 22,785$ 2,523$ 162,69813,317CONG. DIST (03)50,028$ 247,154$ 138,501$ -$ 14,093$ -$ -$ 2,901$ 91,65913,331CONG. DIST (04)66,124$ 502,936$ 259,350$ -$ 33,819$ -$ 1,955$ 3,686$ 204,12620,828CONG. DIST (05)53,558$ 427,891$ 216,766$ 1,861$ 13,740$ -$ 1,761$ 3,116$ 190,64619,153CONG. DIST (06)49,708$ 201,852$ 108,414$ -$ 15,306$ -$ -$ 2,652$ 75,4799,648LOUISIANA (Totals)315,342$ 2,202,388$ 1,016,206$ 202,777$ 120,767$ -$ 26,501$ 19,941$ 816,19586,890Notes:* Veteran population estimates, as of September 30, 2013, are produced by the VA Office of the Actuary (VetPop 2011).# Prior to FY 08, "Loan Guaranty" expenditures were included in the Education & Vocational Rehabilitation and Employment (E&VRE) programs. Currently, all "Loan Guaranty" expenditures are attributed to Travis County, TX, where all Loan Guaranty payments are processed. VA will continue to improve data collection for future GDX reports to better distribute loan expenditures at the state, county and congressional district levels.** Unique patients are patients who received treatment at a VA health care facility. Data are provided by the Allocation Resource Center (ARC).Expenditure data sources: USASpending.gov for Compensation & Pension (C&P) and Education and Vocational Rehabilitation and Employment (EVRE) Benefits; Veterans Benefits Administration Insurance Center for the Insurance costs; the VA Financial Management System (FMS) for Construction, Medical Research, General Operating Expenses, and certain C&P and Readjustment data; and the Allocation Resource Center (ARC) for Medical Care costs.1. Expenditures are rounded to the nearest thousand dollars. For example, $500 to $1,000 are rounded to $1; $0 to $499 are rounded to $0; and "$ -" = 0 or no expenditures.2. The Compensation & Pension expenditures include dollars for the following programs: veterans' compensation for service-connected disabilities; dependency
  • 80.
    and indemnity compensationfor service-connected deaths; veterans' pension for nonservice-connected disabilities; and burial and other benefits to veterans and their survivors.3. Medical Care expenditures include dollars for medical services, medical administration, facility maintenance, educational support, research support, and other overhead items. Medical Care expenditures do not include dollars for construction or other non-medical support.4. Medical Care expenditures are based on where patients live instead of where care is delivered.5. A star symbol (*) in the Unique Patients column denotes that there were less than 10 Unique Patients. &"Arial,Bold"&11FY13 GEOGRAPHIC DISTRIBUTION OF VA EXPENDITURES (GDX) &8&P of &N MAFY13 Summary of Expenditures by StateExpenditures in $000sCounty/ Congressional DistrictVeteran Population*Total ExpenditureCompensation & PensionConstructionEducation & Vocational Rehabilitation/ EmploymentLoan Guaranty#General Operating ExpensesInsurance & IndemnitiesMedical CareUnique Patients**BARNSTABLE20,215$ 97,483$ 52,299$ 2,527$ 6,174$ -$ 2,778$ 2,725$ 30,9814,772BERKSHIRE11,172$ 49,390$ 24,099$ -$ 2,011$ -$ -$ 986$ 22,2952,156BRISTOL33,197$ 197,192$ 91,431$ -$ 16,163$ -$ -$ 2,569$ 87,0307,997DUKES1,041$ 3,016$ 1,756$ -$ 183$ -$ -$ 149$ 928201ESSEX42,754$ 209,029$ 95,802$ -$ 20,792$ -$ -$ 4,351$ 88,0848,820FRANKLIN6,198$ 31,695$ 14,734$ -$ 1,849$ -$ -$ 569$ 14,5431,761HAMPDEN33,084$ 168,009$ 90,523$ -$ 13,243$ -$ -$ 2,264$ 61,9797,749HAMPSHIRE11,066$ 81,548$ 30,188$ 694$ 4,807$ -$ 1,221$ 1,314$ 43,3252,923MIDDLESEX69,788$ 476,995$ 176,646$ -$ 43,005$ -$ 4,298$ 10,930$ 242,11714,787NANTUCKET624$ 874$ 537$ -$ 91$ -$
  • 81.
    -$ 21$ 22558NORFOLK35,368$232,920$ 98,579$ -$ 20,217$ -$ -$ 6,042$ 108,0838,051PLYMOUTH34,692$ 260,075$ 102,228$ -$ 15,236$ -$ 1,836$ 3,548$ 137,2268,286SUFFOLK23,303$ 302,740$ 75,071$ 17,331$ 27,157$ -$ 22,414$ 1,888$ 158,8806,306WORCESTER52,307$ 260,645$ 132,003$ -$ 22,046$ -$ -$ 3,878$ 102,71810,478MASSACHUSETTS (Totals)374,809$ 2,371,613$ 985,894$ 20,552$ 192,975$ -$ 32,546$ 41,235$ 1,098,41284,345CONG. DIST (01)55,118$ 261,964$ 133,494$ 694$ 18,249$ -$ 1,221$ 4,144$ 104,16312,401CONG. DIST (02)47,401$ 268,436$ 126,973$ -$ 20,551$ -$ 4,082$ 116,83010,202CONG. DIST (03)38,889$ 216,640$ 92,836$ -$ 20,027$ -$ -$ 4,272$ 99,5048,717CONG. DIST (04)37,753$ 212,451$ 94,406$ -$ 17,566$ -$ -$ 5,911$ 94,5688,166CONG. DIST (05)32,954$ 160,124$ 59,491$ -$ 15,291$ -$ -$ 5,310$ 80,0326,523CONG. DIST (06)44,937$ 338,140$ 137,144$ -$ 31,481$ -$ 4,298$ 5,011$ 160,2079,794CONG. DIST (07)20,389$ 222,669$ 65,112$ 17,331$ 21,030$ -$ 22,414$ 1,560$ 95,2235,176CONG. DIST (08)43,009$ 418,057$ 149,759$ -$ 30,764$ -$ 1,836$ 4,935$ 230,76310,753CONG. DIST (09)54,359$ 273,133$ 126,680$ 2,527$ 18,015$ -$ 2,778$ 6,010$ 117,12312,613MASSACHUSETTS (Totals)374,809$ 2,371,613$ 985,894$ 20,552$ 192,975$ -$ 32,546$ 41,235$ 1,098,41284,345Notes:* Veteran population estimates, as of September 30, 2013, are produced by the VA Office of the Actuary (VetPop 2011).# Prior to FY 08, "Loan Guaranty" expenditures were included in the Education & Vocational Rehabilitation and Employment (E&VRE) programs. Currently, all "Loan Guaranty" expenditures are attributed to Travis County, TX, where all Loan Guaranty payments are processed. VA will continue to improve data collection for future GDX reports to better distribute loan expenditures at the state, county and congressional district levels.** Unique patients are patients who received treatment at a VA health care
  • 82.
    facility. Data areprovided by the Allocation Resource Center (ARC).Expenditure data sources: USASpending.gov for Compensation & Pension (C&P) and Education and Vocational Rehabilitation and Employment (EVRE) Benefits; Veterans Benefits Administration Insurance Center for the Insurance costs; the VA Financial Management System (FMS) for Construction, Medical Research, General Operating Expenses, and certain C&P and Readjustment data; and the Allocation Resource Center (ARC) for Medical Care costs.1. Expenditures are rounded to the nearest thousand dollars. For example, $500 to $1,000 are rounded to $1; $0 to $499 are rounded to $0; and "$ -" = 0 or no expenditures.2. The Compensation & Pension expenditures include dollars for the following programs: veterans' compensation for service-connected disabilities; dependency and indemnity compensation for service-connected deaths; veterans' pension for nonservice-connected disabilities; and burial and other benefits to veterans and their survivors.3. Medical Care expenditures include dollars for medical services, medical administration, facility maintenance, educational support, research support, and other overhead items. Medical Care expenditures do not include dollars for construction or other non-medical support.4. Medical Care expenditures are based on where patients live instead of where care is delivered.5. A star symbol (*) in the Unique Patients column denotes that there were less than 10 Unique Patients. &"Arial,Bold"&11FY13 GEOGRAPHIC DISTRIBUTION OF VA EXPENDITURES (GDX) &8&P of &N MDFY13 Summary of Expenditures by StateExpenditures in $000sCounty/ Congressional DistrictVeteran Population*Total ExpenditureCompensation & PensionConstructionEducation & Vocational Rehabilitation/ EmploymentLoan Guaranty#General Operating ExpensesInsurance & IndemnitiesMedical CareUnique Patients**ALLEGANY7,037$ 38,341$ 17,911$
  • 83.
    -$ 1,367$ -$-$ 358$ 18,7052,273ANNE ARUNDEL55,542$ 264,854$ 131,305$ -$ 52,565$ -$ -$ 4,561$ 76,4237,893BALTIMORE59,431$ 267,966$ 106,586$ -$ 27,476$ -$ -$ 6,323$ 127,58211,568CALVERT9,419$ 33,553$ 18,913$ -$ 7,868$ -$ -$ 997$ 5,775944CAROLINE2,871$ 12,302$ 5,011$ -$ 899$ -$ -$ 290$ 6,103589CARROLL14,002$ 39,324$ 21,382$ -$ 6,052$ -$ -$ 1,073$ 10,8171,443CECIL9,481$ 94,601$ 22,668$ -$ 3,497$ -$ 2,790$ 518$ 65,1282,398CHARLES18,025$ 101,907$ 56,928$ -$ 24,768$ -$ -$ 1,449$ 18,7622,697DORCHESTER2,859$ 15,993$ 5,844$ -$ 523$ -$ -$ 103$ 9,523968FREDERICK19,296$ 86,040$ 42,989$ -$ 15,420$ -$ -$ 2,405$ 25,2272,870GARRETT2,562$ 11,821$ 6,933$ -$ 397$ -$ -$ 163$ 4,329708HARFORD23,309$ 126,244$ 60,920$ - $ 14,664$ -$ -$ 1,800$ 48,8614,324HOWARD20,988$ 79,131$ 40,118$ -$ 18,890$ -$ -$ 2,072$ 18,0512,208KENT1,933$ 6,795$ 3,615$ -$ 507$ -$ -$ 57$ 2,617305MONTGOMERY46,136$ 193,803$ 94,031$ - $ 39,971$ -$ -$ 9,601$ 50,2005,298PRINCE GEORGE'S62,744$ 471,570$ 215,943$ -$ 70,287$ -$ -$ 4,451$ 180,88914,367QUEEN ANNE'S4,688$ 13,873$ 6,054$ -$ 1,604$ -$ -$ 607$ 5,609580ST. MARY'S13,859$ 62,740$ 34,451$ -$ 16,210$ -$ -$ 904$ 11,1751,689SOMERSET2,290$ 10,246$ 5,061$ -$ 529$ -$ -$ 238$ 4,417503TALBOT4,009$ 13,960$ 6,376$ -$ 659$ -$ -$ 418$ 6,508762WASHINGTON12,884$ 69,652$ 28,462$ -$ 5,141$ -$ -$ 1,000$ 35,0493,000WICOMICO8,479$ 36,177$ 16,083$ -$ 2,854$ -$ -$ 533$ 16,7071,746WORCESTER5,352$ 16,667$ 8,471$ -$ 1,196$ -$ -$ 401$ 6,600964BALTIMORE (CITY)35,881$ 385,997$ 91,173$ 7,521$ 20,600$ -$ 21,935$ 2,192$ 242,57712,086MARYLAND (Totals)443,076$ 2,453,557$ 1,047,226$ 7,521$ 333,943$ -$ 24,725$ 42,512$
  • 84.
    997,63082,183CONG. DIST (01)65,453$286,761$ 112,904$ -$ 20,805$ -$ 2,790$ 5,217$ 145,04411,861CONG. DIST (02)58,824$ 334,469$ 143,587$ -$ 41,168$ -$ -$ 4,055$ 145,66012,698CONG. DIST (03)53,086$ 241,477$ 106,758$ -$ 39,640$ -$ -$ 5,882$ 89,1978,516CONG. DIST (04)53,761$ 384,324$ 178,783$ -$ 60,842$ -$ -$ 4,350$ 140,34911,305CONG. DIST (05)72,979$ 380,223$ 194,164$ -$ 76,991$ -$ -$ 5,953$ 103,11511,192CONG. DIST (06)47,256$ 221,080$ 103,229$ -$ 26,600$ -$ -$ 5,273$ 85,9789,249CONG. DIST (07)48,621$ 423,599$ 117,687$ 7,521$ 32,792$ -$ 21,935$ 4,124$ 239,54112,300CONG. DIST (08)43,096$ 181,624$ 90,116$ -$ 35,103$ -$ -$ 7,658$ 48,7475,062MARYLAND (Totals)443,076$ 2,453,557$ 1,047,226$ 7,521$ 333,943$ -$ 24,725$ 42,512$ 997,63082,183Notes:* Veteran population estimates, as of September 30, 2013, are produced by the VA Office of the Actuary (VetPop 2011).# Prior to FY 08, "Loan Guaranty" expenditures were included in the Education & Vocational Rehabilitation and Employment (E&VRE) programs. Currently, all "Loan Guaranty" expenditures are attributed to Travis County, TX, where all Loan Guaranty payments are processed. VA will continue to improve data collection for future GDX reports to better distribute loan expenditures at the state, county and congressional district levels.** Unique patients are patients who received treatment at a VA health care facility. Data are provided by the Allocation Resource Center (ARC).Expenditure data sources: USASpending.gov for Compensation & Pension (C&P) and Education and Vocational Rehabilitation and Employment (EVRE) Benefits; Veterans Benefits Administration Insurance Center for the Insurance costs; the VA Financial Management System (FMS) for Construction, Medical Research, General Operating Expenses, and certain C&P and Readjustment data; and the Allocation Resource Center (ARC) for Medical Care costs.1. Expenditures are rounded to the nearest thousand dollars. For example, $500 to $1,000 are rounded to $1; $0 to $499 are rounded to $0; and
  • 85.
    "$ -" =0 or no expenditures.2. The Compensation & Pension expenditures include dollars for the following programs: veterans' compensation for service-connected disabilities; dependency and indemnity compensation for service-connected deaths; veterans' pension for nonservice-connected disabilities; and burial and other benefits to veterans and their survivors.3. Medical Care expenditures include dollars for medical services, medical administration, facility maintenance, educational support, research support, and other overhead items. Medical Care expenditures do not include dollars for construction or other non-medical support.4. Medical Care expenditures are based on where patients live instead of where care is delivered.5. A star symbol (*) in the Unique Patients column denotes that there were less than 10 Unique Patients. &"Arial,Bold"&11FY13 GEOGRAPHIC DISTRIBUTION OF VA EXPENDITURES (GDX) &8&P of &N MEFY13 Summary of Expenditures by StateExpenditures in $000sCounty/ Congressional DistrictVeteran Population*Total ExpenditureCompensation & PensionConstructionEducation & Vocational Rehabilitation/ EmploymentLoan Guaranty#General Operating ExpensesInsurance & IndemnitiesMedical CareUnique Patients**ANDROSCOGGIN10,174$ 65,306$ 35,702$ -$ 3,759$ -$ -$ 493$ 25,3513,361AROOSTOOK7,609$ 59,966$ 35,851$ -$ 1,264$ -$ -$ 687$ 22,1633,142CUMBERLAND22,482$ 112,594$ 64,634$ -$ 9,140$ -$ -$ 1,989$ 36,8325,357FRANKLIN2,870$ 19,702$ 10,799$ -$ 753$ -$ -$ 103$ 8,0471,077HANCOCK5,787$ 27,989$ 16,243$ -$ 1,160$ -$ -$ 554$ 10,0321,428KENNEBEC12,294$ 153,444$ 60,884$ 7$ 4,827$ -$ 18,277$ 846$ 68,6034,943KNOX4,054$ 25,364$ 13,081$ -$ 433$ -$ -$ 433$ 11,4171,213LINCOLN3,751$ 25,118$ 13,351$ -$ 666$ -
  • 86.
    $ -$ 406$10,6951,254OXFORD5,973$ 36,124$ 19,315$ -$ 1,040$ -$ -$ 367$ 15,4011,953PENOBSCOT14,707$ 104,524$ 59,577$ -$ 7,174$ -$ -$ 737$ 37,0364,684PISCATAQUIS2,092$ 17,190$ 9,937$ -$ 362$ -$ -$ 68$ 6,824822SAGADAHOC4,260$ 26,536$ 16,273$ -$ 1,460$ -$ -$ 297$ 8,5061,072SOMERSET4,905$ 45,238$ 22,942$ -$ 906$ - $ -$ 306$ 21,0831,987WALDO3,653$ 28,335$ 15,001$ -$ 942$ -$ -$ 163$ 12,2291,204WASHINGTON3,654$ 31,310$ 18,865$ -$ 723$ -$ -$ 542$ 11,1801,413YORK19,429$ 94,385$ 54,943$ -$ 7,968$ -$ -$ 1,466$ 30,0084,448MAINE (Totals)127,694$ 873,125$ 467,398$ 7$ 42,577$ -$ 18,277$ 9,459$ 335,40839,358CONG. DIST (01)61,463$ 395,284$ 204,420$ 7$ 23,006$ -$ 18,277$ 5,374$ 144,19816,445CONG. DIST (02)66,232$ 477,842$ 262,977$ -$ 19,570$ -$ -$ 4,085$ 191,20922,913MAINE (Totals)127,694$ 873,125$ 467,398$ 7$ 42,577$ -$ 18,277$ 9,459$ 335,40839,358Notes:* Veteran population estimates, as of September 30, 2013, are produced by the VA Office of the Actuary (VetPop 2011).# Prior to FY 08, "Loan Guaranty" expenditures were included in the Education & Vocational Rehabilitation and Employment (E&VRE) programs. Currently, all "Loan Guaranty" expenditures are attributed to Travis County, TX, where all Loan Guaranty payments are processed. VA will continue to improve data collection for future GDX reports to better distribute loan expenditures at the state, county and congressional district levels.** Unique patients are patients who received treatment at a VA health care facility. Data are provided by the Allocation Resource Center (ARC).Expenditure data sources: USASpending.gov for Compensation & Pension (C&P) and Education and Vocational Rehabilitation and Employment (EVRE) Benefits; Veterans Benefits Administration Insurance Center for the Insurance costs; the VA Financial Management System (FMS) for Construction, Medical Research, General Operating Expenses,
  • 87.
    and certain C&Pand Readjustment data; and the Allocation Resource Center (ARC) for Medical Care costs.1. Expenditures are rounded to the nearest thousand dollars. For example, $500 to $1,000 are rounded to $1; $0 to $499 are rounded to $0; and "$ -" = 0 or no expenditures.2. The Compensation & Pension expenditures include dollars for the following programs: veterans' compensation for service-connected disabilities; dependency and indemnity compensation for service-connected deaths; veterans' pension for nonservice-connected disabilities; and burial and other benefits to veterans and their survivors.3. Medical Care expenditures include dollars for medical services, medical administration, facility maintenance, educational support, research support, and other overhead items. Medical Care expenditures do not include dollars for construction or other non-medical support.4. Medical Care expenditures are based on where patients live instead of where care is delivered.5. A star symbol (*) in the Unique Patients column denotes that there were less than 10 Unique Patients. &"Arial,Bold"&11FY13 GEOGRAPHIC DISTRIBUTION OF VA EXPENDITURES (GDX) &8&P of &N MIFY13 Summary of Expenditures by StateExpenditures in $000sCounty/ Congressional DistrictVeteran Population*Total ExpenditureCompensation & PensionConstructionEducation & Vocational Rehabilitation/ EmploymentLoan Guaranty#General Operating ExpensesInsurance & IndemnitiesMedical CareUnique Patients**ALCONA1,666$ 8,991$ 4,552$ -$ 194$ -$ -$ 116$ 4,129524ALGER941$ 6,206$ 3,606$ - $ 159$ -$ -$ 29$ 2,412375ALLEGAN7,424$ 29,514$ 15,004$ -$ 2,041$ -$ -$ 293$ 12,1761,560ALPENA2,936$ 13,838$ 7,007$ -$ 591$ -$ -$ 156$ 6,084978ANTRIM2,328$ 10,242$ 6,191$ -$ 360$ -$ -$ 116$ 3,574561ARENAC1,557$ 9,994$ 5,747$ -$ 279$ -$ -$ 65$ 3,903406BARAGA764$
  • 88.
    4,610$ 2,373$ -$133$ -$ -$ 45$ 2,059289BARRY4,870$ 19,718$ 9,606$ -$ 850$ -$ -$ 158$ 9,1041,090BAY9,064$ 44,907$ 24,794$ -$ 2,246$ -$ -$ 312$ 17,5552,137BENZIE1,724$ 8,009$ 4,635$ -$ 297$ -$ -$ 103$ 2,974452BERRIEN12,558$ 54,692$ 28,914$ -$ 3,025$ -$ -$ 1,002$ 21,7502,976BRANCH3,414$ 19,721$ 9,422$ -$ 505$ -$ -$ 251$ 9,543869CALHOUN11,297$ 103,187$ 37,854$ - $ 3,543$ -$ -$ 613$ 61,1773,452CASS4,478$ 15,117$ 6,862$ -$ 629$ -$ -$ 149$ 7,4771,216CHARLEVOIX2,368$ 7,834$ 4,816$ -$ 290$ -$ -$ 123$ 2,605550CHEBOYGAN2,525$ 17,144$ 10,286$ -$ 425$ -$ -$ 140$ 6,293810CHIPPEWA3,685$ 20,114$ 11,754$ -$ 1,102$ -$ -$ 112$ 7,1471,006CLARE3,321$ 22,935$ 11,404$ -$ 673$ -$ 1,137$ 148$ 9,572988CLINTON4,817$ 17,751$ 11,533$ -$ 1,634$ -$ -$ 472$ 4,111667CRAWFORD1,592$ 8,869$ 4,519$ -$ 305$ -$ -$ 33$ 4,012461DELTA3,823$ 33,249$ 16,518$ -$ 906$ -$ -$ 121$ 15,7041,542DICKINSON2,525$ 36,053$ 10,154$ 17$ 503$ -$ 1,574$ 79$ 23,7281,374EATON8,388$ 36,818$ 22,201$ -$ 2,847$ -$ -$ 397$ 11,3741,388EMMET2,886$ 11,555$ 7,485$ -$ 544$ -$ - $ 191$ 3,336627GENESEE30,138$ 130,289$ 75,487$ -$ 10,008$ -$ -$ 1,599$ 43,1954,773GLADWIN2,714$ 17,371$ 9,136$ -$ 321$ -$ -$ 189$ 7,726751GOGEBIC1,764$ 12,689$ 5,293$ -$ 408$ -$ -$ 148$ 6,839782GRAND TRAVERSE6,947$ 34,104$ 20,179$ -$ 2,865$ -$ -$ 517$ 10,5431,603GRATIOT2,837$ 17,524$ 10,453$ -$ 636$ -$ -$ 147$ 6,288734HILLSDALE3,415$ 18,055$ 8,638$ -$ 710$ -$ -$ 149$ 8,558897HOUGHTON2,886$ 19,217$ 8,961$ -$ 1,594$ -$ -$ 234$ 8,4281,016HURON2,611$ 14,977$ 8,523$ -$ 364$ -$ -$ 316$ 5,773792INGHAM15,009$ 68,814$ 35,246$ -$ 7,890$ -$ -$ 1,357$ 24,3212,934IONIA4,509$ 15,840$ 8,933$ -$ 834$ -$ -$
  • 89.
    128$ 5,945789IOSCO3,413$ 19,758$10,202$ -$ 373$ - $ -$ 89$ 9,0941,054IRON1,320$ 14,562$ 5,234$ -$ 131$ -$ -$ 120$ 9,077663ISABELLA3,538$ 18,387$ 8,820$ -$ 2,469$ -$ -$ 122$ 6,976822JACKSON11,969$ 58,983$ 29,701$ -$ 3,022$ - $ -$ 834$ 25,4262,836KALAMAZOO15,396$ 84,662$ 33,172$ 5,994$ 6,836$ -$ 4,257$ 990$ 33,4113,271KALKASKA1,798$ 9,556$ 5,133$ -$ 387$ - $ -$ 54$ 3,983463KENT33,576$ 152,391$ 86,050$ -$ 15,001$ -$ -$ 2,082$ 49,2597,996KEWEENAW254$ 1,041$ 561$ -$ 23$ -$ -$ 3$ 45488LAKE1,462$ 7,395$ 4,024$ -$ 108$ -$ -$ 13$ 3,250372LAPEER6,881$ 26,444$ 16,397$ -$ 1,380$ -$ -$ 349$ 8,3191,239LEELANAU2,007$ 6,009$ 3,639$ -$ 193$ -$ -$ 208$ 1,968437LENAWEE7,486$ 41,277$ 19,891$ -$ 2,599$ -$ -$ 210$ 18,5771,911LIVINGSTON12,386$ 48,784$ 24,018$ -$ 2,656$ -$ -$ 700$ 21,4102,118LUCE639$ 3,255$ 2,117$ -$ 87$ -$ -$ 12$ 1,040132MACKINAC1,073$ 6,562$ 3,700$ -$ 164$ -$ -$ 53$ 2,645323MACOMB55,655$ 232,476$ 139,827$ -$ 17,736$ -$ -$ 3,689$ 71,2248,763MANISTEE2,585$ 11,507$ 7,243$ -$ 310$ -$ -$ 121$ 3,832636MARQUETTE6,420$ 45,080$ 27,196$ -$ 2,722$ -$ -$ 510$ 14,6521,968MASON2,595$ 10,944$ 6,839$ - $ 343$ -$ -$ 260$ 3,502549MECOSTA3,212$ 14,087$ 7,868$ -$ 1,526$ -$ -$ 145$ 4,547625MENOMINEE2,273$ 18,008$ 7,615$ -$ 355$ -$ -$ 127$ 9,9111,029MIDLAND6,294$ 31,529$ 16,514$ -$ 1,982$ -$ -$ 648$ 12,3851,454MISSAUKEE1,244$ 6,596$ 3,246$ -$ 234$ -$ -$ 161$ 2,955348MONROE11,437$ 45,225$ 23,473$ -$ 2,640$ -$ -$ 401$ 18,7112,055MONTCALM4,926$ 22,694$ 13,604$ -$ 1,312$ -$ -$ 216$ 7,5621,023MONTMORENCY1,177$ 8,052$ 4,522$ -$ 237$ -$ -$ 23$ 3,269349MUSKEGON13,543$ 59,479$ 34,946$ -$ 3,785$
  • 90.
    -$ -$ 621$20,1273,203NEWAYGO4,063$ 20,317$ 12,325$ -$ 883$ -$ -$ 142$ 6,9681,077OAKLAND65,420$ 283,834$ 155,425$ 2$ 21,630$ -$ 2,014$ 7,126$ 97,63710,955OCEANA2,377$ 10,282$ 6,568$ -$ 529$ -$ -$ 150$ 3,035515OGEMAW2,268$ 14,675$ 7,520$ -$ 311$ -$ - $ 106$ 6,738679ONTONAGON953$ 7,759$ 3,380$ -$ 159$ -$ -$ 57$ 4,164415OSCEOLA2,159$ 11,276$ 6,150$ -$ 429$ -$ -$ 91$ 4,606531OSCODA1,128$ 5,408$ 2,376$ -$ 42$ -$ -$ 71$ 2,918304OTSEGO2,198$ 10,042$ 5,632$ -$ 392$ -$ -$ 120$ 3,898556OTTAWA15,117$ 50,529$ 29,999$ -$ 4,880$ -$ -$ 1,042$ 14,6072,886PRESQUE ISLE1,543$ 8,689$ 4,767$ -$ 278$ -$ -$ 105$ 3,539531ROSCOMMON2,873$ 16,269$ 8,985$ -$ 492$ - $ -$ 95$ 6,697777SAGINAW13,948$ 83,934$ 40,687$ - $ 3,055$ -$ 1,822$ 870$ 37,5003,918ST. CLAIR13,133$ 57,420$ 34,327$ -$ 3,173$ -$ -$ 1,072$ 18,8483,271ST. JOSEPH4,467$ 20,015$ 9,901$ -$ 797$ - $ -$ 303$ 9,013975SANILAC3,057$ 15,710$ 8,768$ -$ 488$ -$ -$ 131$ 6,3221,012SCHOOLCRAFT878$ 6,629$ 3,635$ -$ 79$ -$ -$ 51$ 2,864312SHIAWASSEE5,528$ 24,917$ 12,827$ -$ 1,741$ -$ -$ 327$ 10,0221,048TUSCOLA4,629$ 23,193$ 11,963$ -$ 843$ - $ -$ 269$ 10,1181,059VAN BUREN6,077$ 26,242$ 14,131$ -$ 1,412$ -$ -$ 211$ 10,4881,219WASHTENAW17,495$ 127,309$ 33,705$ 143$ 10,797$ -$ 9,614$ 1,469$ 71,5813,514WAYNE100,230$ 606,639$ 239,741$ 29$ 37,097$ -$ 30,873$ 7,303$ 291,59723,366WEXFORD2,891$ 16,181$ 8,938$ -$ 731$ -$ -$ 82$ 6,431788MICHIGAN (Totals)660,773$ 3,361,961$ 1,675,388$ 6,185$ 208,565$ -$ 51,291$ 43,961$ 1,376,571146,804CONG. DIST (01)68,357$ 417,515$ 216,689$ 17$ 16,316$ -$ 1,574$ 3,962$ 178,95821,335CONG. DIST (02)47,084$ 196,333$ 115,600$ -$ 14,343$ -$ -$ 2,760$ 63,63010,646CONG. DIST
  • 91.
    (03)45,960$ 252,922$ 120,915$-$ 16,440$ -$ -$ 2,415$ 113,15311,180CONG. DIST (04)54,634$ 278,484$ 150,031$ -$ 15,462$ -$ 1,137$ 3,254$ 108,60112,689CONG. DIST (05)53,321$ 268,186$ 146,704$ -$ 15,183$ -$ 1,822$ 2,702$ 101,77611,109CONG. DIST (06)50,253$ 229,623$ 107,673$ 5,994$ 14,688$ -$ 4,257$ 2,932$ 94,07811,184CONG. DIST (07)52,572$ 248,472$ 123,275$ -$ 15,521$ -$ -$ 2,695$ 106,98111,128CONG. DIST (08)39,751$ 155,454$ 79,922$ -$ 13,413$ -$ -$ 3,347$ 58,7716,872CONG. DIST (09)45,605$ 208,812$ 123,468$ -$ 15,969$ -$ -$ 3,603$ 65,7737,456CONG. DIST (10)50,850$ 200,665$ 117,925$ -$ 11,254$ -$ -$ 3,802$ 67,68310,190CONG. DIST (11)38,811$ 135,012$ 67,822$ -$ 9,719$ -$ -$ 4,533$ 52,9386,036CONG. DIST (12)39,032$ 188,825$ 70,371$ 143$ 14,826$ -$ 9,614$ 3,033$ 90,8387,583CONG. DIST (13)38,489$ 312,343$ 116,494$ 29$ 18,026$ -$ 30,873$ 1,828$ 145,09410,742CONG. DIST (14)36,055$ 269,315$ 118,501$ 2$ 17,404$ -$ 2,014$ 3,096$ 128,2988,654MICHIGAN (Totals)660,773$ 3,361,961$ 1,675,388$ 6,185$ 208,565$ -$ 51,291$ 43,961$ 1,376,571146,804Notes:* Veteran population estimates, as of September 30, 2013, are produced by the VA Office of the Actuary (VetPop 2011).# Prior to FY 08, "Loan Guaranty" expenditures were included in the Education & Vocational Rehabilitation and Employment (E&VRE) programs. Currently, all "Loan Guaranty" expenditures are attributed to Travis County, TX, where all Loan Guaranty payments are processed. VA will continue to improve data collection for future GDX reports to better distribute loan expenditures at the state, county and congressional district levels.** Unique patients are patients who received treatment at a VA health care facility. Data are provided by the Allocation Resource Center (ARC).Expenditure data sources: USASpending.gov for Compensation & Pension (C&P) and Education and Vocational Rehabilitation and Employment (EVRE) Benefits; Veterans
  • 92.
    Benefits Administration InsuranceCenter for the Insurance costs; the VA Financial Management System (FMS) for Construction, Medical Research, General Operating Expenses, and certain C&P and Readjustment data; and the Allocation Resource Center (ARC) for Medical Care costs.1. Expenditures are rounded to the nearest thousand dollars. For example, $500 to $1,000 are rounded to $1; $0 to $499 are rounded to $0; and "$ -" = 0 or no expenditures.2. The Compensation & Pension expenditures include dollars for the following programs: veterans' compensation for service-connected disabilities; dependency and indemnity compensation for service-connected deaths; veterans' pension for nonservice-connected disabilities; and burial and other benefits to veterans and their survivors.3. Medical Care expenditures include dollars for medical services, medical administration, facility maintenance, educational support, research support, and other overhead items. Medical Care expenditures do not include dollars for construction or other non-medical support.4. Medical Care expenditures are based on where patients live instead of where care is delivered.5. A star symbol (*) in the Unique Patients column denotes that there were less than 10 Unique Patients. &"Arial,Bold"&11FY13 GEOGRAPHIC DISTRIBUTION OF VA EXPENDITURES (GDX) &8&P of &N MNFY13 Summary of Expenditures by StateExpenditures in $000sCounty/ Congressional DistrictVeteran Population*Total ExpenditureCompensation & PensionConstructionEducation & Vocational Rehabilitation/ EmploymentLoan Guaranty#General Operating ExpensesInsurance & IndemnitiesMedical CareUnique Patients**AITKIN1,731$ 14,476$ 6,739$ -$ 79$ -$ -$ 101$ 7,557945ANOKA22,848$ 131,906$ 55,646$ -$ 9,123$ -$ -$ 1,148$ 65,9896,958BECKER2,900$ 20,865$ 9,703$ -$ 519$ -$ -$ 157$ 10,4861,188BELTRAMI3,155$ 26,151$ 13,993$
  • 93.
    -$ 1,257$ -$-$ 413$ 10,4871,261BENTON3,150$ 27,285$ 8,903$ -$ 738$ -$ -$ 204$ 17,4401,411BIG STONE441$ 3,442$ 1,872$ -$ 100$ -$ -$ 47$ 1,423270BLUE EARTH4,406$ 24,104$ 10,941$ -$ 2,855$ -$ -$ 698$ 9,6101,223BROWN1,866$ 13,584$ 7,361$ - $ 689$ -$ -$ 153$ 5,381864CARLTON3,211$ 22,074$ 13,150$ -$ 933$ -$ -$ 138$ 7,853956CARVER4,930$ 19,979$ 8,791$ -$ 1,705$ -$ -$ 419$ 9,0631,028CASS3,347$ 24,107$ 12,286$ -$ 221$ -$ -$ 258$ 11,3431,489CHIPPEWA838$ 6,603$ 2,519$ -$ 168$ -$ -$ 34$ 3,882527CHISAGO4,221$ 24,091$ 13,191$ -$ 1,515$ -$ -$ 168$ 9,2171,058CLAY4,150$ 33,302$ 12,149$ -$ 1,732$ -$ -$ 284$ 19,1371,639CLEARWATER767$ 6,708$ 3,076$ -$ 111$ -$ -$ 5$ 3,516395COOK511$ 2,377$ 1,480$ -$ 18$ - $ -$ 96$ 783110COTTONWOOD798$ 5,752$ 2,472$ -$ 30$ -$ -$ 155$ 3,094366CROW WING5,759$ 51,221$ 26,268$ -$ 1,548$ -$ -$ 535$ 22,8702,866DAKOTA27,070$ 158,857$ 68,130$ -$ 13,707$ -$ -$ 2,404$ 74,6176,846DODGE1,194$ 5,799$ 3,062$ -$ 366$ -$ -$ 74$ 2,297356DOUGLAS3,109$ 21,467$ 11,058$ -$ 630$ -$ -$ 204$ 9,5751,483FARIBAULT1,301$ 7,828$ 3,427$ -$ 380$ -$ -$ 148$ 3,873404FILLMORE1,523$ 7,769$ 4,136$ -$ 409$ -$ -$ 126$ 3,099430FREEBORN2,507$ 15,683$ 7,108$ -$ 515$ -$ -$ 231$ 7,829944GOODHUE3,834$ 19,500$ 8,434$ -$ 939$ -$ -$ 227$ 9,900953GRANT500$ 4,506$ 2,101$ -$ 84$ -$ -$ 32$ 2,289238HENNEPIN61,511$ 459,706$ 133,259$ 8,678$ 30,560$ -$ 80,331$ 7,797$ 199,08115,685HOUSTON1,575$ 8,272$ 4,757$ -$ 464$ - $ -$ 91$ 2,960665HUBBARD2,263$ 15,579$ 7,752$ -$ 238$ -$ -$ 102$ 7,487877ISANTI3,053$ 19,237$ 8,093$ -$ 882$ -$ -$ 170$ 10,0921,159ITASCA4,618$ 29,168$ 16,255$ -$ 772$ -$ -$ 384$ 11,7561,750JACKSON853$ 4,260$ 1,848$ -$ 73$ -$ -$
  • 94.
    47$ 2,293298KANABEC1,416$ 10,597$4,798$ -$ 122$ -$ -$ 51$ 5,626629KANDIYOHI2,672$ 19,875$ 9,978$ -$ 488$ -$ -$ 282$ 9,1271,315KITTSON416$ 2,078$ 991$ -$ 44$ -$ -$ 15$ 1,028177KOOCHICHING1,254$ 6,783$ 3,562$ -$ 75$ -$ -$ 76$ 3,071371LAC QUI PARLE570$ 4,367$ 1,996$ -$ 15$ -$ -$ 102$ 2,253308LAKE1,226$ 7,710$ 4,595$ -$ 128$ -$ -$ 133$ 2,854384LAKE OF THE WOODS497$ 2,783$ 1,305$ -$ 9$ -$ -$ 93$ 1,376158LE SUEUR1,969$ 11,366$ 4,516$ -$ 344$ -$ -$ 101$ 6,405667LINCOLN460$ 2,994$ 1,188$ -$ 56$ -$ -$ 34$ 1,717173LYON1,707$ 9,431$ 4,335$ -$ 586$ -$ -$ 132$ 4,378569MCLEOD2,880$ 14,937$ 6,788$ -$ 640$ -$ -$ 262$ 7,2461,046MAHNOMEN406$ 3,370$ 1,754$ -$ 34$ -$ -$ 1$ 1,582213MARSHALL694$ 4,748$ 2,111$ -$ 89$ -$ -$ 133$ 2,415349MARTIN1,703$ 12,267$ 6,254$ -$ 303$ -$ -$ 204$ 5,507757MEEKER1,882$ 12,559$ 5,780$ -$ 408$ -$ -$ 143$ 6,228767MILLE LACS2,387$ 24,126$ 12,193$ -$ 733$ -$ -$ 143$ 11,0581,075MORRISON2,809$ 30,164$ 14,910$ -$ 976$ -$ -$ 133$ 14,1441,652MOWER2,845$ 16,234$ 8,993$ -$ 550$ -$ -$ 227$ 6,464820MURRAY674$ 4,375$ 1,727$ -$ 99$ -$ -$ 98$ 2,451319NICOLLET2,120$ 12,297$ 6,008$ -$ 995$ -$ -$ 151$ 5,144773NOBLES1,378$ 6,874$ 2,481$ -$ 306$ -$ -$ 157$ 3,930522NORMAN590$ 4,479$ 2,005$ -$ 132$ -$ -$ 8$ 2,334252OLMSTED10,205$ 34,293$ 16,436$ -$ 3,093$ -$ -$ 856$ 13,9091,860OTTER TAIL5,207$ 36,955$ 17,701$ -$ 905$ -$ -$ 564$ 17,7842,228PENNINGTON973$ 6,298$ 3,053$ -$ 266$ - $ -$ 67$ 2,912337PINE2,813$ 18,957$ 9,881$ -$ 578$ -$ -$ 152$ 8,346904PIPESTONE650$ 3,238$ 1,067$ -$ 136$ -$ -$ 26$ 2,009237POLK2,533$ 13,283$ 6,053$ -$ 756$ -$ -$ 186$ 6,288944POPE881$ 5,965$ 2,941$ -$ 173$ -$ -$ 65$ 2,785420RAMSEY27,709$ 153,695$ 60,852$ 21$ 13,956$ -$ -$ 3,365$ 75,5016,669RED
  • 95.
    LAKE358$ 1,774$ 833$-$ 54$ -$ -$ 9$ 877115REDWOOD1,116$ 8,577$ 4,630$ -$ 243$ -$ -$ 180$ 3,523442RENVILLE1,148$ 7,599$ 4,428$ -$ 186$ -$ -$ 104$ 2,882481RICE4,393$ 19,711$ 9,267$ -$ 1,287$ -$ -$ 815$ 8,342953ROCK643$ 4,774$ 2,207$ -$ 152$ -$ -$ 100$ 2,316305ROSEAU1,012$ 5,296$ 3,006$ -$ 104$ -$ -$ 53$ 2,133399ST. LOUIS18,340$ 94,094$ 50,381$ -$ 5,767$ -$ -$ 1,469$ 36,4765,303SCOTT7,258$ 43,147$ 18,291$ -$ 3,453$ -$ -$ 711$ 20,6931,990SHERBURNE6,101$ 48,335$ 22,176$ -$ 3,619$ -$ -$ 423$ 22,1172,359SIBLEY1,172$ 5,607$ 2,608$ -$ 237$ -$ -$ 84$ 2,679376STEARNS9,950$ 138,352$ 44,816$ 6,900$ 4,345$ -$ 1,695$ 1,044$ 79,5525,620STEELE2,705$ 12,193$ 6,323$ -$ 662$ -$ - $ 224$ 4,985695STEVENS504$ 2,616$ 1,393$ -$ 85$ -$ -$ 21$ 1,117227SWIFT886$ 5,714$ 2,852$ -$ 169$ -$ -$ 102$ 2,591346TODD2,080$ 15,884$ 6,640$ -$ 137$ -$ -$ 131$ 8,9771,010TRAVERSE335$ 1,814$ 1,032$ -$ 45$ -$ -$ 76$ 660126WABASHA1,798$ 11,575$ 6,501$ -$ 356$ -$ -$ 172$ 4,545635WADENA1,167$ 12,775$ 8,210$ -$ 261$ -$ -$ 93$ 4,212629WASECA1,697$ 7,451$ 3,374$ -$ 368$ -$ -$ 160$ 3,549436WASHINGTON16,273$ 80,891$ 36,215$ -$ 7,780$ -$ -$ 1,254$ 35,6423,289WATONWAN867$ 5,248$ 2,635$ -$ 124$ -$ -$ 112$ 2,377384WILKIN465$ 3,362$ 1,300$ -$ 189$ -$ -$ 40$ 1,834183WINONA3,561$ 14,264$ 6,922$ -$ 934$ - $ -$ 256$ 6,152940WRIGHT8,703$ 46,233$ 21,129$ -$ 2,528$ -$ -$ 630$ 21,9462,377YELLOW MEDICINE759$ 6,922$ 3,232$ -$ 190$ -$ -$ 97$ 3,403420MINNESOTA (Totals)360,754$ 2,336,965$ 986,609$ 15,600$ 133,629$ -$ 82,027$ 33,370$ 1,085,731113,577CONG. DIST (01)48,040$ 238,052$ 115,042$ -$ 14,409$ -$ -$ 4,777$ 103,82414,084CONG. DIST (02)44,607$ 256,263$ 111,980$ -$ 20,487$ -$ -$ 3,873$ 119,92411,349CONG. DIST (03)39,046$ 171,848$
  • 96.
    65,770$ -$ 14,274$-$ -$ 5,117$ 86,6879,388CONG. DIST (04)37,634$ 199,244$ 81,189$ 21$ 18,304$ -$ -$ 4,329$ 95,4008,600CONG. DIST (05)34,076$ 347,940$ 92,944$ 8,678$ 20,648$ -$ 80,331$ 3,503$ 141,8359,445CONG. DIST (06)45,198$ 356,884$ 139,577$ 6,900$ 19,070$ -$ 1,695$ 3,136$ 186,50516,301CONG. DIST (07)50,861$ 351,192$ 162,113$ -$ 11,208$ -$ -$ 4,253$ 173,61921,752CONG. DIST (08)61,293$ 415,542$ 217,994$ -$ 15,230$ -$ -$ 4,381$ 177,93722,658MINNESOTA (Totals)360,754$ 2,336,965$ 986,609$ 15,600$ 133,629$ -$ 82,027$ 33,370$ 1,085,731113,577Notes:* Veteran population estimates, as of September 30, 2013, are produced by the VA Office of the Actuary (VetPop 2011).# Prior to FY 08, "Loan Guaranty" expenditures were included in the Education & Vocational Rehabilitation and Employment (E&VRE) programs. Currently, all "Loan Guaranty" expenditures are attributed to Travis County, TX, where all Loan Guaranty payments are processed. VA will continue to improve data collection for future GDX reports to better distribute loan expenditures at the state, county and congressional district levels.** Unique patients are patients who received treatment at a VA health care facility. Data are provided by the Allocation Resource Center (ARC).Expenditure data sources: USASpending.gov for Compensation & Pension (C&P) and Education and Vocational Rehabilitation and Employment (EVRE) Benefits; Veterans Benefits Administration Insurance Center for the Insurance costs; the VA Financial Management System (FMS) for Construction, Medical Research, General Operating Expenses, and certain C&P and Readjustment data; and the Allocation Resource Center (ARC) for Medical Care costs.1. Expenditures are rounded to the nearest thousand dollars. For example, $500 to $1,000 are rounded to $1; $0 to $499 are rounded to $0; and "$ -" = 0 or no expenditures.2. The Compensation & Pension expenditures include dollars for the following programs: veterans' compensation for service-connected disabilities;
  • 97.
    dependency and indemnitycompensation for service-connected deaths; veterans' pension for nonservice-connected disabilities; and burial and other benefits to veterans and their survivors.3. Medical Care expenditures include dollars for medical services, medical administration, facility maintenance, educational support, research support, and other overhead items. Medical Care expenditures do not include dollars for construction or other non-medical support.4. Medical Care expenditures are based on where patients live instead of where care is delivered.5. A star symbol (*) in the Unique Patients column denotes that there were less than 10 Unique Patients. &"Arial,Bold"&11FY13 GEOGRAPHIC DISTRIBUTION OF VA EXPENDITURES (GDX) &8&P of &N MOFY13 Summary of Expenditures by StateExpenditures in $000sCounty/ Congressional DistrictVeteran Population*Total ExpenditureCompensation & PensionConstructionEducation & Vocational Rehabilitation/ EmploymentLoan Guaranty#General Operating ExpensesInsurance & IndemnitiesMedical CareUnique Patients**ADAIR1,387$ 8,711$ 4,250$ -$ 478$ -$ -$ 38$ 3,946585ANDREW1,391$ 5,548$ 2,422$ -$ 224$ -$ -$ 32$ 2,871399ATCHISON589$ 2,079$ 1,154$ -$ 93$ -$ -$ 52$ 780132AUDRAIN2,042$ 15,688$ 6,510$ -$ 251$ -$ -$ 82$ 8,845950BARRY3,000$ 19,530$ 9,908$ -$ 432$ -$ -$ 173$ 9,0171,205BARTON1,046$ 4,996$ 2,885$ -$ 165$ -$ -$ 30$ 1,917337BATES1,464$ 8,191$ 5,062$ -$ 305$ -$ -$ 42$ 2,782379BENTON2,508$ 22,697$ 11,073$ -$ 193$ -$ -$ 55$ 11,3761,081BOLLINGER1,123$ 6,370$ 3,058$ -$ 109$ - $ -$ 27$ 3,176372BOONE10,702$ 94,541$ 33,034$ 1,211$ 9,368$ -$ 2,261$ 1,078$ 47,5893,559BUCHANAN7,339$ 39,100$ 18,519$ -$ 2,278$ -$ -$ 572$ 17,7302,122BUTLER4,133$ 52,706$
  • 98.
    18,935$ 88$ 1,231$-$ 1,818$ 145$ 30,4882,243CALDWELL881$ 5,513$ 2,809$ -$ 172$ -$ -$ 36$ 2,496340CALLAWAY4,294$ 26,513$ 13,265$ -$ 1,217$ -$ -$ 226$ 11,8051,400CAMDEN4,805$ 28,602$ 14,099$ -$ 757$ -$ -$ 213$ 13,5321,690CAPE GIRARDEAU6,353$ 29,708$ 16,868$ -$ 1,990$ -$ -$ 568$ 10,2811,811CARROLL870$ 5,311$ 2,699$ -$ 157$ -$ -$ 38$ 2,417292CARTER566$ 5,239$ 3,098$ -$ 160$ -$ -$ 1$ 1,979204CASS9,629$ 45,853$ 22,523$ - $ 3,153$ -$ -$ 714$ 19,4622,325CEDAR1,525$ 9,451$ 5,402$ -$ 176$ -$ -$ 15$ 3,857547CHARITON767$ 4,096$ 2,098$ -$ 74$ -$ -$ 30$ 1,893286CHRISTIAN7,356$ 31,055$ 19,474$ -$ 2,256$ - $ -$ 326$ 8,9991,936CLARK580$ 2,989$ 1,514$ -$ 54$ -$ -$ 50$ 1,372202CLAY20,094$ 91,501$ 45,064$ -$ 7,060$ -$ -$ 853$ 38,5234,433CLINTON2,136$ 11,465$ 5,951$ -$ 620$ -$ -$ 160$ 4,735695COLE7,249$ 33,177$ 17,107$ -$ 2,222$ -$ 41$ 234$ 13,5741,897COOPER1,272$ 11,305$ 4,354$ -$ 262$ -$ -$ 108$ 6,582581CRAWFORD2,322$ 14,410$ 7,625$ -$ 410$ -$ -$ 15$ 6,361747DADE895$ 3,630$ 2,091$ -$ 100$ -$ -$ 5$ 1,434243DALLAS1,514$ 11,414$ 6,533$ -$ 276$ -$ -$ 151$ 4,453547DAVIESS746$ 6,046$ 1,972$ -$ 169$ -$ -$ 52$ 3,854280DE KALB1,355$ 4,290$ 1,613$ -$ 122$ - $ -$ 86$ 2,470292DENT1,414$ 10,501$ 5,665$ -$ 239$ -$ -$ 51$ 4,547540DOUGLAS1,124$ 5,105$ 3,705$ -$ 280$ -$ -$ 73$ 1,047147DUNKLIN2,203$ 16,799$ 8,910$ -$ 315$ -$ -$ 84$ 7,489811FRANKLIN8,370$ 36,313$ 20,230$ -$ 2,236$ - $ -$ 249$ 13,5991,700GASCONADE1,541$ 8,677$ 4,713$ -$ 175$ -$ -$ 35$ 3,754447GENTRY641$ 3,590$ 1,443$ -$ 274$ -$ -$ 40$ 1,833159GREENE24,334$ 105,031$ 59,800$ -$ 11,433$ -$ 404$ 2,093$ 31,3016,060GRUNDY863$ 5,122$ 2,196$ -$ 160$ -$ -$ 88$ 2,677347HARRISON752$
  • 99.
    4,688$ 1,840$ -$121$ -$ -$ 4$ 2,722269HENRY2,545$ 16,857$ 10,258$ -$ 694$ -$ -$ 213$ 5,692763HICKORY1,305$ 7,394$ 3,682$ -$ 123$ -$ -$ 31$ 3,559360HOLT510$ 1,878$ 910$ -$ 72$ -$ -$ 1$ 894121HOWARD933$ 6,380$ 2,434$ -$ 278$ -$ -$ 27$ 3,641313HOWELL3,734$ 25,630$ 13,782$ -$ 901$ -$ -$ 318$ 10,6291,435IRON1,118$ 7,771$ 4,697$ -$ 234$ -$ -$ 20$ 2,819369JACKSON48,405$ 347,965$ 133,131$ 2,786$ 18,791$ -$ 20,446$ 3,430$ 169,38014,622JASPER9,791$ 49,189$ 27,496$ -$ 3,347$ -$ -$ 404$ 17,9422,846JEFFERSON20,711$ 80,034$ 38,548$ -$ 6,051$ -$ -$ 637$ 34,7983,708JOHNSON6,395$ 35,363$ 19,609$ -$ 6,450$ -$ -$ 59$ 9,2461,360KNOX342$ 6,286$ 1,409$ 61$ 72$ -$ 1,227$ -$ 3,517173LACLEDE3,506$ 24,768$ 15,367$ -$ 1,476$ -$ -$ 119$ 7,8071,033LAFAYETTE2,984$ 16,470$ 8,376$ -$ 890$ - $ -$ 97$ 7,106900LAWRENCE3,372$ 19,380$ 10,697$ -$ 606$ -$ -$ 159$ 7,9181,490LEWIS782$ 4,712$ 2,335$ -$ 199$ -$ -$ 5$ 2,173278LINCOLN4,795$ 18,286$ 8,638$ -$ 1,491$ -$ -$ 188$ 7,969814LINN1,145$ 7,726$ 3,761$ -$ 117$ -$ -$ 75$ 3,773485LIVINGSTON1,318$ 6,571$ 3,463$ -$ 252$ -$ -$ 76$ 2,780417MCDONALD1,595$ 9,221$ 3,832$ -$ 408$ -$ -$ 28$ 4,953628MACON1,259$ 10,223$ 4,905$ -$ 188$ -$ -$ 106$ 5,024592MADISON1,130$ 9,945$ 5,030$ -$ 148$ -$ -$ 73$ 4,695483MARIES918$ 5,583$ 2,299$ -$ 181$ -$ -$ 24$ 3,079328MARION2,562$ 14,256$ 6,981$ -$ 700$ -$ -$ 210$ 6,365735MERCER362$ 2,165$ 1,001$ -$ 30$ -$ -$ 1$ 1,133129MILLER2,139$ 15,269$ 6,780$ -$ 423$ -$ -$ 77$ 7,988869MISSISSIPPI868$ 5,803$ 2,749$ -$ 135$ -$ -$ 63$ 2,856355MONITEAU1,325$ 6,789$ 3,394$ -$ 346$ -$ -$ 18$ 3,031364MONROE825$ 6,778$ 3,163$ -$ 101$ -$ -$ 72$ 3,442335MONTGOMERY1,189$ 6,791$ 3,085$ -$ 279$ -
  • 100.
    $ -$ 165$3,261368MORGAN2,315$ 19,149$ 9,114$ -$ 262$ -$ -$ 108$ 9,665967NEW MADRID1,529$ 9,551$ 4,524$ -$ 202$ -$ -$ 17$ 4,808554NEWTON5,252$ 21,955$ 10,529$ -$ 825$ -$ -$ 364$ 10,2371,667NODAWAY1,441$ 6,703$ 3,420$ -$ 541$ -$ -$ 60$ 2,683352OREGON1,040$ 7,932$ 4,211$ -$ 105$ -$ -$ 6$ 3,611404OSAGE989$ 4,914$ 2,375$ -$ 268$ -$ -$ 31$ 2,240349OZARK1,077$ 5,512$ 3,479$ -$ 147$ -$ -$ 48$ 1,838286PEMISCOT1,279$ 7,667$ 4,324$ -$ 128$ -$ -$ 324$ 2,891367PERRY1,519$ 6,064$ 3,834$ -$ 387$ -$ -$ 157$ 1,687409PETTIS3,607$ 25,448$ 12,326$ -$ 1,403$ -$ - $ 323$ 11,3961,265PHELPS4,592$ 36,202$ 21,366$ -$ 2,313$ -$ -$ 315$ 12,2071,432PIKE1,783$ 7,659$ 3,788$ -$ 243$ -$ -$ 132$ 3,496427PLATTE7,423$ 44,525$ 21,331$ -$ 7,688$ -$ -$ 333$ 15,1731,726POLK2,942$ 14,890$ 8,229$ -$ 776$ -$ -$ 130$ 5,754904PULASKI7,899$ 93,174$ 61,295$ -$ 14,517$ -$ -$ 185$ 17,1772,413PUTNAM453$ 2,789$ 1,435$ -$ 59$ -$ -$ 32$ 1,263172RALLS841$ 7,568$ 1,708$ -$ 113$ -$ 2,149$ 64$ 3,534381RANDOLPH2,319$ 16,329$ 7,360$ -$ 618$ -$ -$ 91$ 8,260776RAY1,853$ 16,377$ 5,162$ 3,187$ 279$ -$ 1,784$ 68$ 5,898633REYNOLDS699$ 5,328$ 2,256$ -$ 69$ -$ -$ 5$ 2,999230RIPLEY1,299$ 12,154$ 6,001$ -$ 192$ -$ -$ 73$ 5,888564ST. CHARLES30,628$ 103,301$ 58,931$ -$ 12,156$ -$ -$ 1,725$ 30,4893,862ST. CLAIR1,155$ 7,046$ 3,587$ -$ 115$ -$ -$ 26$ 3,319370SAINTE GENEVIEVE1,613$ 9,159$ 4,196$ -$ 305$ -$ -$ 31$ 4,627481ST. FRANCOIS6,241$ 37,087$ 18,686$ -$ 1,688$ -$ -$ 165$ 16,5471,851ST. LOUIS71,488$ 345,653$ 161,966$ 525$ 29,439$ -$ 6,846$ 8,988$ 137,88814,156SALINE1,612$ 11,576$ 5,550$ -$ 443$ -$ -$ 281$ 5,302571SCHUYLER324$ 1,635$ 867$ -$ 57$ -$ -$ 9$ 702123SCOTLAND363$ 7,094$ 1,058$ 1,063$
  • 101.
    32$ -$ 2,317$22$ 2,603142SCOTT3,106$ 22,027$ 12,565$ -$ 730$ -$ -$ 216$ 8,5161,117SHANNON743$ 5,795$ 3,077$ -$ 51$ -$ -$ 3$ 2,663247SHELBY580$ 3,643$ 1,922$ -$ 43$ -$ -$ 9$ 1,669226STODDARD2,752$ 20,860$ 10,763$ -$ 428$ -$ -$ 125$ 9,5441,088STONE4,232$ 16,901$ 9,299$ -$ 408$ -$ -$ 174$ 7,0191,379SULLIVAN513$ 2,982$ 1,444$ -$ 64$ -$ -$ 23$ 1,450184TANEY4,225$ 29,194$ 15,357$ -$ 1,022$ -$ -$ 349$ 12,4662,207TEXAS2,897$ 24,419$ 14,412$ -$ 1,201$ -$ -$ 52$ 8,753996VERNON1,535$ 10,614$ 4,179$ -$ 209$ -$ -$ 323$ 5,903697WARREN3,012$ 12,400$ 5,838$ -$ 817$ -$ -$ 216$ 5,528612WASHINGTON2,043$ 10,281$ 4,627$ -$ 222$ -$ -$ 7$ 5,425590WAYNE1,414$ 13,818$ 7,759$ -$ 245$ -$ -$ 28$ 5,786500WEBSTER3,774$ 16,005$ 10,142$ -$ 818$ -$ -$ 157$ 4,888873WORTH218$ 1,203$ 482$ -$ 21$ -$ -$ 14$ 68673WRIGHT1,531$ 13,408$ 8,386$ -$ 375$ -$ -$ 73$ 4,575579ST. LOUIS (CITY)18,689$ 294,819$ 49,837$ 25,502$ 10,697$ -$ 106,834$ 1,293$ 100,6576,541MISSOURI (Totals)497,874$ 3,025,845$ 1,386,280$ 34,423$ 189,473$ -$ 146,126$ 32,796$ 1,236,747137,008CONG. DIST (01)48,749$ 519,218$ 154,463$ 26,027$ 29,714$ -$ 113,679$ 3,681$ 191,65514,607CONG. DIST (02)56,378$ 175,843$ 85,789$ -$ 15,931$ -$ -$ 7,413$ 66,7108,158CONG. DIST (03)67,966$ 294,523$ 151,391$ -$ 20,812$ -$ 41$ 3,018$ 119,26114,141CONG. DIST (04)71,798$ 513,700$ 264,246$ 1,211$ 41,633$ -$ 2,261$ 3,999$ 200,35122,409CONG. DIST (05)56,931$ 419,812$ 164,372$ 5,973$ 22,443$ -$ 22,230$ 3,787$ 201,00817,188CONG. DIST (06)61,801$ 325,074$ 150,137$ 1,124$ 20,661$ -$ 5,693$ 3,457$ 144,00217,640CONG. DIST (07)66,920$ 319,773$ 176,741$ -$ 21,684$ -$ 404$ 4,312$ 116,63120,535CONG. DIST (08)67,332$ 457,903$ 239,141$ 88$ 16,595$ -$ 1,818$ 3,130$ 197,13022,330MISSOURI
  • 102.
    (Totals)497,874$ 3,025,845$ 1,386,280$34,423$ 189,473$ -$ 146,126$ 32,796$ 1,236,747137,008Notes:* Veteran population estimates, as of September 30, 2013, are produced by the VA Office of the Actuary (VetPop 2011).# Prior to FY 08, "Loan Guaranty" expenditures were included in the Education & Vocational Rehabilitation and Employment (E&VRE) programs. Currently, all "Loan Guaranty" expenditures are attributed to Travis County, TX, where all Loan Guaranty payments are processed. VA will continue to improve data collection for future GDX reports to better distribute loan expenditures at the state, county and congressional district levels.** Unique patients are patients who received treatment at a VA health care facility. Data are provided by the Allocation Resource Center (ARC).Expenditure data sources: USASpending.gov for Compensation & Pension (C&P) and Education and Vocational Rehabilitation and Employment (EVRE) Benefits; Veterans Benefits Administration Insurance Center for the Insurance costs; the VA Financial Management System (FMS) for Construction, Medical Research, General Operating Expenses, and certain C&P and Readjustment data; and the Allocation Resource Center (ARC) for Medical Care costs.1. Expenditures are rounded to the nearest thousand dollars. For example, $500 to $1,000 are rounded to $1; $0 to $499 are rounded to $0; and "$ -" = 0 or no expenditures.2. The Compensation & Pension expenditures include dollars for the following programs: veterans' compensation for service-connected disabilities; dependency and indemnity compensation for service-connected deaths; veterans' pension for nonservice-connected disabilities; and burial and other benefits to veterans and their survivors.3. Medical Care expenditures include dollars for medical services, medical administration, facility maintenance, educational support, research support, and other overhead items. Medical Care expenditures do not include dollars for construction or other non-medical support.4. Medical Care expenditures are based on where patients live instead of where care is
  • 103.
    delivered.5. A starsymbol (*) in the Unique Patients column denotes that there were less than 10 Unique Patients. &"Arial,Bold"&11FY13 GEOGRAPHIC DISTRIBUTION OF VA EXPENDITURES (GDX) &8&P of &N MSFY13 Summary of Expenditures by StateExpenditures in $000sCounty/ Congressional DistrictVeteran Population*Total ExpenditureCompensation & PensionConstructionEducation & Vocational Rehabilitation/ EmploymentLoan Guaranty#General Operating ExpensesInsurance & IndemnitiesMedical CareUnique Patients**ADAMS2,391$ 17,197$ 7,567$ 598$ 433$ -$ 563$ 114$ 7,9221,112ALCORN2,271$ 13,423$ 8,664$ -$ 321$ -$ 188$ 138$ 4,113597AMITE1,153$ 5,296$ 2,259$ -$ 173$ -$ -$ 13$ 2,851415ATTALA1,392$ 11,498$ 5,556$ -$ 192$ -$ -$ 57$ 5,692546BENTON511$ 2,638$ 1,177$ -$ 54$ -$ - $ 27$ 1,380122BOLIVAR2,093$ 12,159$ 6,340$ -$ 508$ -$ -$ 147$ 5,165590CALHOUN986$ 6,568$ 3,703$ -$ 246$ -$ -$ 256$ 2,362300CARROLL843$ 3,431$ 1,629$ -$ 150$ -$ -$ 37$ 1,614207CHICKASAW1,067$ 5,843$ 3,634$ -$ 220$ -$ -$ 54$ 1,934320CHOCTAW703$ 3,644$ 1,563$ -$ 191$ -$ -$ 1$ 1,887251CLAIBORNE541$ 4,605$ 1,319$ -$ 171$ -$ -$ 6$ 3,109185CLARKE1,360$ 7,335$ 4,425$ -$ 319$ -$ -$ 101$ 2,491440CLAY1,439$ 6,302$ 3,402$ -$ 438$ -$ -$ 59$ 2,404449COAHOMA1,405$ 8,727$ 4,404$ -$ 359$ -$ -$ 123$ 3,841460COPIAH1,939$ 17,987$ 7,734$ -$ 505$ -$ -$ 88$ 9,661885COVINGTON1,316$ 11,091$ 6,192$ -$ 461$ -$ -$ 111$ 4,327544DE SOTO15,022$ 60,104$ 27,506$ -$ 5,092$ -$ -$ 747$ 26,7592,756FORREST5,992$ 49,754$ 27,246$ -$ 6,867$ -$ -$ 503$ 15,1381,791FRANKLIN624$ 4,125$ 1,725$ -$ 85$ -$ -$ 18$ 2,297229GEORGE1,781$ 9,751$
  • 104.
    4,900$ -$ 627$-$ -$ 120$ 4,104459GREENE1,177$ 4,042$ 2,111$ -$ 102$ -$ -$ 37$ 1,792233GRENADA1,605$ 10,148$ 4,685$ -$ 636$ -$ - $ 73$ 4,753549HANCOCK4,728$ 25,921$ 10,533$ -$ 1,163$ -$ -$ 151$ 14,0741,243HARRISON21,776$ 211,417$ 86,697$ 11,315$ 18,537$ -$ 5,019$ 1,496$ 88,3547,355HINDS15,740$ 181,555$ 53,601$ 317$ 7,480$ -$ 23,543$ 1,298$ 95,3166,664HOLMES959$ 7,226$ 3,138$ -$ 252$ -$ -$ 43$ 3,793378HUMPHREYS440$ 3,299$ 1,508$ -$ 149$ -$ -$ 20$ 1,623186ISSAQUENA138$ 179$ 47$ -$ -$ -$ -$ -$ 13123ITAWAMBA1,654$ 7,167$ 4,491$ -$ 449$ -$ -$ 70$ 2,157426JACKSON15,464$ 76,794$ 37,478$ -$ 6,568$ -$ -$ 419$ 32,3283,536JASPER1,220$ 8,170$ 4,249$ -$ 289$ -$ -$ 11$ 3,621391JEFFERSON477$ 2,754$ 1,249$ -$ 92$ -$ -$ 11$ 1,402154JEFFERSON DAVIS947$ 6,119$ 2,447$ -$ 243$ -$ -$ 81$ 3,347264JONES4,415$ 28,042$ 15,245$ -$ 932$ -$ -$ 429$ 11,4371,509KEMPER634$ 3,226$ 1,824$ -$ 142$ -$ -$ 26$ 1,234191LAFAYETTE2,877$ 11,421$ 5,263$ -$ 1,911$ -$ -$ 220$ 4,027542LAMAR3,948$ 15,985$ 7,102$ -$ 1,096$ -$ -$ 291$ 7,4961,141LAUDERDALE6,641$ 35,246$ 18,563$ -$ 2,629$ -$ -$ 706$ 13,3482,054LAWRENCE1,021$ 9,168$ 4,392$ -$ 437$ -$ -$ 29$ 4,310409LEAKE1,018$ 11,283$ 5,464$ -$ 400$ -$ -$ 47$ 5,372526LEE5,644$ 25,747$ 15,545$ -$ 1,446$ -$ -$ 214$ 8,5421,493LEFLORE1,447$ 9,260$ 4,287$ -$ 422$ -$ -$ 172$ 4,380539LINCOLN2,345$ 16,465$ 6,364$ -$ 429$ -$ -$ 125$ 9,547958LOWNDES5,146$ 35,903$ 19,890$ -$ 2,160$ -$ -$ 402$ 13,4521,872MADISON5,909$ 38,380$ 17,023$ -$ 2,444$ -$ -$ 464$ 18,4492,011MARION1,838$ 11,631$ 6,007$ -$ 222$ -$ -$ 99$ 5,303560MARSHALL2,352$ 14,128$ 6,112$ -$ 723$ -$ -$ 61$ 7,232690MONROE2,889$ 12,790$ 8,452$ -$ 490$ -$ -$ 99$
  • 105.
    3,749834MONTGOMERY818$ 6,009$ 2,826$-$ 206$ -$ -$ 13$ 2,965353NESHOBA1,832$ 12,298$ 6,261$ -$ 511$ -$ -$ 85$ 5,442621NEWTON2,003$ 9,466$ 4,741$ -$ 582$ -$ -$ 49$ 4,093614NOXUBEE548$ 2,911$ 1,292$ -$ 97$ -$ -$ 146$ 1,377149OKTIBBEHA2,425$ 12,338$ 5,319$ -$ 2,930$ -$ -$ 246$ 3,843608PANOLA1,936$ 12,235$ 6,198$ -$ 710$ -$ -$ 138$ 5,189552PEARL RIVER5,482$ 31,530$ 16,032$ -$ 1,262$ -$ -$ 431$ 13,8051,534PERRY1,085$ 4,934$ 2,824$ -$ 196$ -$ -$ 23$ 1,891267PIKE2,914$ 18,521$ 9,099$ -$ 549$ -$ -$ 150$ 8,7221,108PONTOTOC1,854$ 9,517$ 5,268$ -$ 250$ -$ -$ 114$ 3,885557PRENTISS1,709$ 7,161$ 3,957$ -$ 179$ -$ -$ 10$ 3,014427QUITMAN481$ 3,447$ 1,956$ -$ 141$ -$ -$ 3$ 1,346148RANKIN11,768$ 68,603$ 27,157$ -$ 3,950$ -$ -$ 550$ 36,9463,604SCOTT1,566$ 12,649$ 5,172$ -$ 392$ -$ - $ 271$ 6,814634SHARKEY315$ 2,264$ 832$ -$ 78$ - $ -$ 27$ 1,327119SIMPSON1,990$ 16,405$ 6,941$ -$ 516$ -$ -$ 65$ 8,883774SMITH1,033$ 5,993$ 3,103$ -$ 179$ -$ -$ 70$ 2,641283STONE1,707$ 11,589$ 5,691$ -$ 695$ -$ -$ 65$ 5,139474SUNFLOWER1,651$ 7,606$ 3,403$ -$ 386$ -$ -$ 122$ 3,693440TALLAHATCHIE805$ 3,670$ 1,688$ -$ 255$ - $ -$ 21$ 1,705213TATE2,207$ 11,300$ 4,732$ -$ 632$ -$ -$ 115$ 5,822528TIPPAH1,452$ 6,546$ 4,497$ -$ 175$ -$ -$ 27$ 1,847320TISHOMINGO1,523$ 7,200$ 4,735$ -$ 207$ -$ -$ 62$ 2,197321TUNICA483$ 4,597$ 2,527$ -$ 229$ -$ -$ 11$ 1,830209UNION1,872$ 7,629$ 4,550$ -$ 298$ -$ -$ 16$ 2,765471WALTHALL971$ 6,296$ 2,630$ -$ 161$ -$ -$ 62$ 3,443356WARREN3,777$ 18,273$ 8,279$ -$ 762$ -$ -$ 230$ 9,0021,011WASHINGTON3,071$ 20,255$ 9,003$ -$ 758$ -$ -$ 206$ 10,2881,315WAYNE1,458$ 6,862$ 3,515$ - $ 207$ -$ -$ 40$ 3,100395WEBSTER856$ 5,734$
  • 106.
    2,771$ -$ 212$-$ -$ 58$ 2,693287WILKINSON492$ 3,089$ 1,606$ -$ 77$ -$ -$ -$ 1,405164WINSTON1,411$ 7,911$ 3,871$ -$ 304$ -$ -$ 28$ 3,708515YALOBUSHA981$ 7,391$ 4,532$ -$ 322$ -$ -$ 91$ 2,446280YAZOO1,718$ 13,780$ 4,996$ -$ 348$ -$ -$ 36$ 8,400636MISSISSIPPI (Totals)225,469$ 1,470,950$ 666,715$ 12,230$ 88,010$ -$ 29,313$ 13,394$ 661,28869,676CONG. DIST (01)55,799$ 271,083$ 144,831$ -$ 16,583$ -$ 188$ 2,804$ 106,67814,176CONG. DIST (02)44,620$ 365,614$ 145,616$ 802$ 15,315$ -$ 19,964$ 2,505$ 181,41216,966CONG. DIST (03)54,047$ 344,734$ 150,470$ 113$ 17,608$ -$ 3,579$ 3,974$ 168,98917,982CONG. DIST (04)71,003$ 489,518$ 225,799$ 11,315$ 38,504$ -$ 5,582$ 4,111$ 204,20820,552MISSISSIPPI (Totals)225,469$ 1,470,950$ 666,715$ 12,230$ 88,010$ -$ 29,313$ 13,394$ 661,28869,676Notes:* Veteran population estimates, as of September 30, 2013, are produced by the VA Office of the Actuary (VetPop 2011).# Prior to FY 08, "Loan Guaranty" expenditures were included in the Education & Vocational Rehabilitation and Employment (E&VRE) programs. Currently, all "Loan Guaranty" expenditures are attributed to Travis County, TX, where all Loan Guaranty payments are processed. VA will continue to improve data collection for future GDX reports to better distribute loan expenditures at the state, county and congressional district levels.** Unique patients are patients who received treatment at a VA health care facility. Data are provided by the Allocation Resource Center (ARC).Expenditure data sources: USASpending.gov for Compensation & Pension (C&P) and Education and Vocational Rehabilitation and Employment (EVRE) Benefits; Veterans Benefits Administration Insurance Center for the Insurance costs; the VA Financial Management System (FMS) for Construction, Medical Research, General Operating Expenses, and certain C&P and Readjustment data; and the Allocation Resource Center (ARC) for Medical Care costs.1. Expenditures
  • 107.
    are rounded tothe nearest thousand dollars. For example, $500 to $1,000 are rounded to $1; $0 to $499 are rounded to $0; and "$ -" = 0 or no expenditures.2. The Compensation & Pension expenditures include dollars for the following programs: veterans' compensation for service-connected disabilities; dependency and indemnity compensation for service-connected deaths; veterans' pension for nonservice-connected disabilities; and burial and other benefits to veterans and their survivors.3. Medical Care expenditures include dollars for medical services, medical administration, facility maintenance, educational support, research support, and other overhead items. Medical Care expenditures do not include dollars for construction or other non-medical support.4. Medical Care expenditures are based on where patients live instead of where care is delivered.5. A star symbol (*) in the Unique Patients column denotes that there were less than 10 Unique Patients. &"Arial,Bold"&11FY13 GEOGRAPHIC DISTRIBUTION OF VA EXPENDITURES (GDX) &8&P of &N MTFY13 Summary of Expenditures by StateExpenditures in $000sCounty/ Congressional DistrictVeteran Population*Total ExpenditureCompensation & PensionConstructionEducation & Vocational Rehabilitation/ EmploymentLoan Guaranty#General Operating ExpensesInsurance & IndemnitiesMedical CareUnique Patients**BEAVERHEAD991$ 4,473$ 2,473$ - $ 129$ -$ -$ 41$ 1,830273BIG HORN964$ 4,542$ 1,983$ -$ 118$ -$ -$ 23$ 2,418237BLAINE573$ 4,832$ 2,299$ -$ 104$ -$ -$ 69$ 2,360176BROADWATER498$ 7,057$ 2,280$ -$ 202$ -$ -$ 105$ 4,469338CARBON866$ 5,605$ 2,285$ -$ 187$ -$ -$ 103$ 3,030343CARTER86$ 602$ 226$ -$ 8$ -$ -$ 1$ 36739CASCADE11,409$ 74,649$ 41,416$ -$ 8,162$ -$ -$ 1,010$ 24,0613,625CHOUTEAU546$ 2,893$ 1,445$ -$ 68$ -$ -$ 22$
  • 108.
    1,358200CUSTER1,306$ 12,584$ 3,564$-$ 116$ -$ -$ 48$ 8,856489DANIELS200$ 1,123$ 470$ -$ 10$ -$ -$ 4$ 63956DAWSON899$ 3,571$ 1,779$ -$ 60$ -$ -$ 58$ 1,674250DEER LODGE1,238$ 7,263$ 2,803$ -$ 219$ -$ -$ 60$ 4,180480FALLON207$ 928$ 219$ -$ 19$ -$ -$ 16$ 67449FERGUS1,195$ 8,429$ 3,650$ -$ 162$ -$ -$ 134$ 4,483459FLATHEAD9,321$ 50,887$ 25,526$ -$ 2,117$ -$ -$ 710$ 22,5353,590GALLATIN6,654$ 35,564$ 15,415$ -$ 6,162$ -$ -$ 541$ 13,4461,897GARFIELD127$ 268$ 102$ -$ -$ -$ -$ -$ 16635GLACIER890$ 5,948$ 3,105$ -$ 221$ -$ -$ 30$ 2,592314GOLDEN VALLEY99$ 917$ 375$ -$ 31$ -$ -$ -$ 51156GRANITE393$ 1,721$ 677$ -$ 20$ -$ -$ 19$ 1,006118HILL1,359$ 7,574$ 3,896$ -$ 565$ -$ -$ 47$ 3,066440JEFFERSON1,222$ 12,874$ 4,910$ -$ 331$ -$ -$ 138$ 7,496588JUDITH BASIN250$ 1,850$ 870$ -$ 27$ -$ -$ 27$ 92683LAKE3,131$ 14,260$ 7,059$ -$ 267$ -$ -$ 147$ 6,787943LEWIS AND CLARK7,328$ 85,346$ 28,014$ 8$ 3,383$ -$ 7,765$ 449$ 45,7273,504LIBERTY143$ 1,172$ 436$ -$ 11$ -$ -$ 12$ 71338LINCOLN2,757$ 16,890$ 9,836$ -$ 300$ -$ -$ 197$ 6,5581,064MCCONE174$ 716$ 134$ -$ 35$ -$ -$ 1$ 54797MADISON904$ 4,158$ 1,920$ -$ 65$ -$ -$ 75$ 2,097314MEAGHER237$ 1,364$ 673$ -$ 12$ -$ -$ -$ 67894MINERAL589$ 4,125$ 2,072$ -$ 93$ -$ -$ 69$ 1,890235MISSOULA9,794$ 57,530$ 23,911$ -$ 6,124$ - $ -$ 782$ 26,7123,075MUSSELSHELL531$ 3,931$ 2,041$ -$ 20$ -$ -$ 4$ 1,865212PARK1,579$ 8,171$ 3,701$ -$ 328$ -$ -$ 77$ 4,066461PETROLEUM46$ 277$ 139$ -$ 4$ -$ -$ 3$ 13019PHILLIPS342$ 2,053$ 942$ -$ 47$ -$ -$ 9$ 1,055156PONDERA571$ 3,339$ 1,849$ -$ 116$ -$ -$ 110$ 1,264203POWDER RIVER130$ 1,001$ 327$ -$ 1$ -$ -$ 94$ 57962POWELL1,087$ 5,726$ 1,971$ -$ 147$ -$ -$ 63$ 3,546344PRAIRIE141$ 1,259$ 586$ -$ 10$ -$ -$
  • 109.
    6$ 65763RAVALLI5,205$ 34,451$18,393$ -$ 912$ -$ -$ 133$ 15,0131,680RICHLAND696$ 3,363$ 1,657$ -$ 94$ -$ -$ 147$ 1,465251ROOSEVELT926$ 2,964$ 1,579$ -$ 268$ -$ -$ 13$ 1,103180ROSEBUD796$ 4,084$ 1,724$ -$ 172$ -$ -$ 46$ 2,142229SANDERS1,583$ 10,987$ 6,092$ -$ 140$ -$ - $ 94$ 4,661588SHERIDAN320$ 957$ 402$ -$ 18$ -$ -$ 2$ 53556SILVER BOW3,672$ 22,211$ 8,979$ -$ 1,461$ -$ -$ 196$ 11,5751,326STILLWATER792$ 5,497$ 2,515$ -$ 81$ -$ -$ 58$ 2,844352SWEET GRASS380$ 1,951$ 979$ -$ 20$ -$ -$ 34$ 918129TETON626$ 3,463$ 1,899$ -$ 90$ -$ -$ 30$ 1,444225TOOLE557$ 2,146$ 1,085$ -$ 69$ -$ -$ 7$ 984167TREASURE87$ 274$ 122$ -$ -$ -$ -$ -$ 15226VALLEY748$ 3,882$ 1,681$ -$ 51$ -$ -$ 187$ 1,962282WHEATLAND199$ 1,319$ 724$ -$ 17$ -$ -$ 13$ 56584WIBAUX94$ 344$ 201$ -$ -$ -$ -$ -$ 14227YELLOWSTONE14,136$ 81,144$ 35,458$ -$ 4,842$ -$ -$ 809$ 40,0344,568MONTANA (Totals)101,597$ 646,509$ 290,869$ 8$ 38,237$ -$ 7,765$ 7,072$ 302,55835,189CONG. DIST (01)101,597$ 646,509$ 290,869$ 8$ 38,237$ -$ 7,765$ 7,072$ 302,55835,189MONTANA (Totals)101,597$ 646,509$ 290,869$ 8$ 38,237$ -$ 7,765$ 7,072$ 302,55835,189Notes:* Veteran population estimates, as of September 30, 2013, are produced by the VA Office of the Actuary (VetPop 2011).# Prior to FY 08, "Loan Guaranty" expenditures were included in the Education & Vocational Rehabilitation and Employment (E&VRE) programs. Currently, all "Loan Guaranty" expenditures are attributed to Travis County, TX, where all Loan Guaranty payments are processed. VA will continue to improve data collection for future GDX reports to better distribute loan expenditures at the state, county and congressional district levels.** Unique patients are patients who received treatment at a VA health care facility. Data are provided by the Allocation Resource Center
  • 110.
    (ARC).Expenditure data sources:USASpending.gov for Compensation & Pension (C&P) and Education and Vocational Rehabilitation and Employment (EVRE) Benefits; Veterans Benefits Administration Insurance Center for the Insurance costs; the VA Financial Management System (FMS) for Construction, Medical Research, General Operating Expenses, and certain C&P and Readjustment data; and the Allocation Resource Center (ARC) for Medical Care costs.1. Expenditures are rounded to the nearest thousand dollars. For example, $500 to $1,000 are rounded to $1; $0 to $499 are rounded to $0; and "$ -" = 0 or no expenditures.2. The Compensation & Pension expenditures include dollars for the following programs: veterans' compensation for service-connected disabilities; dependency and indemnity compensation for service-connected deaths; veterans' pension for nonservice-connected disabilities; and burial and other benefits to veterans and their survivors.3. Medical Care expenditures include dollars for medical services, medical administration, facility maintenance, educational support, research support, and other overhead items. Medical Care expenditures do not include dollars for construction or other non-medical support.4. Medical Care expenditures are based on where patients live instead of where care is delivered.5. A star symbol (*) in the Unique Patients column denotes that there were less than 10 Unique Patients. &"Arial,Bold"&11FY13 GEOGRAPHIC DISTRIBUTION OF VA EXPENDITURES (GDX) &8&P of &N NCFY13 Summary of Expenditures by StateExpenditures in $000sCounty/ Congressional DistrictVeteran Population*Total ExpenditureCompensation & PensionConstructionEducation & Vocational Rehabilitation/ EmploymentLoan Guaranty#General Operating ExpensesInsurance & IndemnitiesMedical CareUnique Patients**ALAMANCE11,326$ 61,675$ 28,305$ -$ 1,987$ -$ -$ 608$ 30,7742,465ALEXANDER2,840$
  • 111.
    15,137$ 7,795$ -$408$ -$ -$ 41$ 6,893913ALLEGHANY1,024$ 4,407$ 2,862$ -$ 136$ -$ -$ 5$ 1,404287ANSON1,673$ 10,034$ 5,287$ -$ 278$ -$ -$ 255$ 4,214524ASHE2,015$ 12,127$ 7,294$ -$ 329$ -$ -$ 137$ 4,367672AVERY1,182$ 8,396$ 4,187$ -$ 329$ -$ -$ 79$ 3,800468BEAUFORT3,978$ 24,950$ 16,434$ -$ 1,084$ -$ -$ 203$ 7,2291,088BERTIE1,056$ 7,231$ 4,395$ -$ 210$ -$ -$ 48$ 2,579274BLADEN3,082$ 17,378$ 10,396$ -$ 528$ -$ - $ 138$ 6,316770BRUNSWICK13,368$ 65,268$ 43,542$ - $ 2,629$ -$ -$ 1,023$ 18,0743,109BUNCOMBE19,973$ 167,375$ 60,714$ 97$ 5,632$ -$ 5,959$ 1,470$ 93,5037,273BURKE7,215$ 45,784$ 21,222$ -$ 1,243$ -$ -$ 505$ 22,8142,443CABARRUS13,108$ 73,718$ 37,628$ -$ 5,427$ -$ -$ 902$ 29,7613,992CALDWELL6,327$ 37,346$ 19,019$ -$ 1,005$ -$ -$ 209$ 17,1132,143CAMDEN1,043$ 7,764$ 4,985$ -$ 1,623$ -$ -$ 130$ 1,025180CARTERET8,481$ 53,935$ 36,754$ -$ 2,932$ -$ -$ 890$ 13,3592,237CASWELL1,939$ 10,302$ 3,822$ -$ 167$ -$ -$ 131$ 6,183507CATAWBA11,782$ 66,926$ 33,543$ -$ 3,118$ -$ -$ 516$ 29,7483,990CHATHAM6,146$ 18,253$ 7,945$ -$ 803$ - $ -$ 459$ 9,046914CHEROKEE2,791$ 19,848$ 11,050$ -$ 284$ -$ -$ 190$ 8,3241,032CHOWAN1,578$ 7,093$ 4,444$ -$ 257$ -$ -$ 93$ 2,300250CLAY1,105$ 7,486$ 3,671$ -$ 106$ -$ -$ 71$ 3,639407CLEVELAND7,573$ 48,120$ 26,186$ -$ 2,271$ -$ -$ 268$ 19,3962,353COLUMBUS3,968$ 30,948$ 19,279$ -$ 1,081$ -$ -$ 93$ 10,4951,263CRAVEN13,617$ 95,285$ 65,048$ -$ 10,784$ -$ 278$ 1,349$ 17,8262,364CUMBERLAND47,298$ 575,641$ 361,732$ -$ 79,352$ -$ 3,296$ 4,512$ 126,75017,872CURRITUCK3,150$ 17,226$ 10,352$ -$ 2,776$ -$ -$ 926$ 3,171443DARE3,386$ 10,657$ 6,696$ -$ 423$ -$ -$ 297$ 3,241409DAVIDSON13,691$ 56,029$ 22,947$ -$ 1,829$ -$ -$ 475$
  • 112.
    30,7783,605DAVIE3,258$ 17,730$ 8,502$-$ 573$ -$ -$ 258$ 8,396970DUPLIN3,470$ 27,539$ 17,078$ -$ 1,441$ -$ -$ 144$ 8,8781,018DURHAM15,846$ 181,498$ 50,527$ 1,833$ 8,981$ -$ 7,728$ 1,091$ 111,3374,809EDGECOMBE3,368$ 28,344$ 16,326$ -$ 1,272$ -$ -$ 126$ 10,6211,018FORSYTH25,724$ 196,944$ 71,013$ 289$ 8,098$ -$ 63,169$ 2,313$ 52,0626,930FRANKLIN4,834$ 23,825$ 12,028$ -$ 908$ -$ -$ 112$ 10,7771,006GASTON16,804$ 83,703$ 43,541$ -$ 5,322$ -$ -$ 765$ 34,0764,615GATES1,129$ 6,035$ 3,784$ -$ 625$ -$ -$ 54$ 1,571209GRAHAM719$ 4,889$ 2,417$ -$ 57$ -$ - $ 21$ 2,393229GRANVILLE4,889$ 23,958$ 11,303$ -$ 1,108$ -$ -$ 86$ 11,462969GREENE1,287$ 6,935$ 4,276$ -$ 210$ -$ -$ 83$ 2,366340GUILFORD33,329$ 166,842$ 88,904$ -$ 13,618$ -$ -$ 2,423$ 61,8977,470HALIFAX3,754$ 28,952$ 16,954$ -$ 789$ - $ -$ 188$ 11,0221,016HARNETT13,787$ 82,662$ 44,803$ -$ 10,814$ -$ -$ 857$ 26,1883,479HAYWOOD6,608$ 41,431$ 21,106$ -$ 1,157$ -$ -$ 325$ 18,8431,976HENDERSON11,454$ 54,059$ 26,355$ -$ 1,774$ -$ -$ 1,107$ 24,8232,833HERTFORD1,876$ 11,416$ 6,782$ -$ 326$ - $ -$ 105$ 4,204365HOKE6,010$ 55,731$ 33,742$ -$ 10,280$ -$ -$ 182$ 11,5262,018HYDE418$ 2,270$ 1,592$ -$ 37$ -$ -$ 22$ 61982IREDELL12,003$ 61,002$ 28,966$ -$ 4,648$ -$ -$ 1,071$ 26,3183,621JACKSON3,082$ 20,013$ 10,773$ -$ 676$ - $ -$ 263$ 8,301908JOHNSTON13,916$ 67,508$ 33,454$ -$ 3,834$ -$ -$ 822$ 29,3982,966JONES1,134$ 12,814$ 9,368$ -$ 869$ -$ -$ 38$ 2,538326LEE4,209$ 44,645$ 29,134$ -$ 6,483$ -$ -$ 235$ 8,7931,078LENOIR4,643$ 40,753$ 27,246$ -$ 1,829$ -$ -$ 269$ 11,4081,354LINCOLN6,284$ 30,051$ 14,125$ - $ 1,631$ -$ -$ 168$ 14,1261,817MCDOWELL3,575$ 33,546$ 15,184$ -$ 528$ -$ -$ 72$
  • 113.
    17,7611,635MACON3,573$ 23,835$ 12,355$-$ 440$ -$ -$ 189$ 10,8511,305MADISON1,457$ 11,678$ 5,344$ -$ 401$ -$ -$ 28$ 5,905562MARTIN1,731$ 14,200$ 8,462$ -$ 314$ -$ -$ 106$ 5,317537MECKLENBURG57,018$ 274,089$ 133,924$ -$ 32,008$ -$ -$ 4,068$ 104,08813,952MITCHELL1,178$ 8,494$ 4,234$ -$ 115$ -$ -$ 45$ 4,100476MONTGOMERY2,017$ 13,495$ 7,358$ -$ 334$ -$ -$ 112$ 5,692640MOORE10,285$ 52,194$ 33,489$ - $ 5,223$ -$ -$ 1,324$ 12,1591,964NASH8,261$ 46,460$ 27,973$ -$ 2,213$ -$ -$ 369$ 15,9041,681NEW HANOVER17,800$ 95,642$ 56,939$ -$ 10,957$ -$ 149$ 1,481$ 26,1163,759NORTHAMPTON1,548$ 10,100$ 5,560$ -$ 168$ -$ -$ 68$ 4,304392ONSLOW26,002$ 264,305$ 190,122$ -$ 41,487$ -$ -$ 2,932$ 29,7646,067ORANGE6,505$ 34,428$ 14,297$ -$ 3,679$ -$ -$ 1,024$ 15,4281,257PAMLICO1,371$ 9,512$ 5,972$ -$ 269$ -$ -$ 73$ 3,199353PASQUOTANK4,674$ 25,779$ 15,876$ -$ 4,068$ -$ -$ 223$ 5,612847PENDER6,010$ 30,077$ 19,126$ -$ 2,682$ -$ -$ 160$ 8,1081,144PERQUIMANS1,595$ 7,929$ 4,854$ -$ 697$ -$ -$ 185$ 2,192290PERSON2,972$ 20,815$ 9,368$ -$ 720$ -$ -$ 153$ 10,574822PITT10,782$ 71,633$ 46,408$ -$ 6,125$ -$ -$ 544$ 18,5572,478POLK2,092$ 10,559$ 5,847$ -$ 155$ -$ -$ 199$ 4,357546RANDOLPH10,996$ 51,494$ 24,917$ -$ 2,139$ -$ -$ 290$ 24,1472,644RICHMOND3,606$ 33,420$ 20,746$ -$ 1,108$ -$ -$ 367$ 11,1991,399ROBESON8,027$ 74,439$ 42,566$ -$ 5,094$ -$ -$ 205$ 26,5752,974ROCKINGHAM7,971$ 38,245$ 19,714$ -$ 1,412$ -$ -$ 299$ 16,8201,824ROWAN12,005$ 139,014$ 38,466$ 18,376$ 3,183$ -$ 10,695$ 751$ 67,5434,976RUTHERFORD5,472$ 41,955$ 19,247$ -$ 910$ -$ -$ 219$ 21,5802,047SAMPSON3,869$ 38,168$
  • 114.
    21,039$ -$ 1,191$-$ -$ 252$ 15,6861,524SCOTLAND2,891$ 18,433$ 11,317$ -$ 688$ -$ -$ 150$ 6,278864STANLY4,656$ 23,604$ 11,810$ -$ 1,093$ -$ -$ 159$ 10,5421,286STOKES3,924$ 16,956$ 8,597$ -$ 664$ -$ -$ 78$ 7,6171,010SURRY4,611$ 33,020$ 19,742$ -$ 715$ -$ -$ 241$ 12,3221,835SWAIN1,271$ 8,753$ 4,499$ -$ 155$ -$ -$ 14$ 4,085369TRANSYLVANIA3,399$ 16,576$ 8,205$ -$ 467$ -$ -$ 290$ 7,614846TYRRELL425$ 837$ 592$ - $ 21$ -$ -$ 1$ 22356UNION13,317$ 52,673$ 29,199$ -$ 3,812$ -$ -$ 870$ 18,7922,940VANCE2,432$ 23,625$ 10,935$ -$ 584$ -$ -$ 202$ 11,904932WAKE58,436$ 282,733$ 146,235$ 643$ 32,713$ -$ 264$ 4,496$ 98,38310,531WARREN1,608$ 12,554$ 5,178$ -$ 407$ -$ -$ 127$ 6,841515WASHINGTON938$ 6,390$ 3,953$ -$ 217$ -$ -$ 55$ 2,166226WATAUGA2,610$ 14,786$ 7,013$ -$ 2,024$ -$ -$ 257$ 5,492777WAYNE13,031$ 90,376$ 61,659$ -$ 8,429$ -$ -$ 929$ 19,3602,678WILKES4,207$ 26,558$ 15,108$ -$ 717$ -$ -$ 134$ 10,5991,575WILSON5,563$ 40,793$ 23,173$ -$ 1,809$ -$ -$ 406$ 15,4041,352YADKIN2,598$ 13,520$ 7,206$ -$ 501$ -$ -$ 287$ 5,525877YANCEY1,523$ 12,248$ 6,882$ -$ 154$ -$ -$ 133$ 5,079573NORTH CAROLINA (Totals)769,384$ 5,067,823$ 2,712,319$ 21,238$ 399,186$ -$ 91,538$ 53,714$ 1,789,827205,006CONG. DIST (01)50,982$ 458,118$ 243,698$ 1,833$ 27,227$ -$ 7,728$ 3,387$ 174,24414,487CONG. DIST (02)71,406$ 513,231$ 305,916$ -$ 64,469$ -$ -$ 5,816$ 137,03018,892CONG. DIST (03)81,773$ 601,127$ 410,433$ -$ 71,619$ -$ 278$ 7,587$ 111,21017,572CONG. DIST (04)59,488$ 573,325$ 311,011$ -$ 67,148$ -$ 3,296$ 5,171$ 186,69817,689CONG. DIST (05)55,437$ 362,056$ 148,952$ 289$ 15,094$ -$ 63,169$ 3,822$ 130,73116,261CONG. DIST (06)56,664$ 266,222$ 132,554$ -$ 13,429$ -$ -$
  • 115.
    3,344$ 116,89612,838CONG. DIST(07)65,498$ 379,908$ 225,996$ -$ 25,358$ -$ 149$ 4,088$ 124,31715,781CONG. DIST (08)54,239$ 328,616$ 170,634$ -$ 17,650$ -$ -$ 2,904$ 137,42816,676CONG. DIST (09)49,039$ 173,113$ 84,526$ -$ 17,474$ -$ -$ 4,345$ 66,76810,241CONG. DIST (10)59,447$ 384,582$ 177,820$ 97$ 16,683$ -$ 5,959$ 3,028$ 180,99519,115CONG. DIST (11)65,579$ 406,530$ 195,878$ -$ 10,690$ -$ -$ 4,031$ 195,93121,127CONG. DIST (12)42,461$ 357,784$ 159,572$ 18,376$ 28,968$ -$ 10,695$ 2,522$ 137,65114,382CONG. DIST (13)57,371$ 263,211$ 145,328$ 643$ 23,378$ -$ 264$ 3,669$ 89,9289,945NORTH CAROLINA (Totals)769,384$ 5,067,823$ 2,712,319$ 21,238$ 399,186$ -$ 91,538$ 53,714$ 1,789,827205,006Notes:* Veteran population estimates, as of September 30, 2013, are produced by the VA Office of the Actuary (VetPop 2011).# Prior to FY 08, "Loan Guaranty" expenditures were included in the Education & Vocational Rehabilitation and Employment (E&VRE) programs. Currently, all "Loan Guaranty" expenditures are attributed to Travis County, TX, where all Loan Guaranty payments are processed. VA will continue to improve data collection for future GDX reports to better distribute loan expenditures at the state, county and congressional district levels.** Unique patients are patients who received treatment at a VA health care facility. Data are provided by the Allocation Resource Center (ARC).Expenditure data sources: USASpending.gov for Compensation & Pension (C&P) and Education and Vocational Rehabilitation and Employment (EVRE) Benefits; Veterans Benefits Administration Insurance Center for the Insurance costs; the VA Financial Management System (FMS) for Construction, Medical Research, General Operating Expenses, and certain C&P and Readjustment data; and the Allocation Resource Center (ARC) for Medical Care costs.1. Expenditures are rounded to the nearest thousand dollars. For example, $500 to $1,000 are rounded to $1; $0 to $499 are rounded to $0; and
  • 116.
    "$ -" =0 or no expenditures.2. The Compensation & Pension expenditures include dollars for the following programs: veterans' compensation for service-connected disabilities; dependency and indemnity compensation for service-connected deaths; veterans' pension for nonservice-connected disabilities; and burial and other benefits to veterans and their survivors.3. Medical Care expenditures include dollars for medical services, medical administration, facility maintenance, educational support, research support, and other overhead items. Medical Care expenditures do not include dollars for construction or other non-medical support.4. Medical Care expenditures are based on where patients live instead of where care is delivered.5. A star symbol (*) in the Unique Patients column denotes that there were less than 10 Unique Patients. &"Arial,Bold"&11FY13 GEOGRAPHIC DISTRIBUTION OF VA EXPENDITURES (GDX) &8&P of &N NDFY13 Summary of Expenditures by StateExpenditures in $000sCounty/ Congressional DistrictVeteran Population*Total ExpenditureCompensation & PensionConstructionEducation & Vocational Rehabilitation/ EmploymentLoan Guaranty#General Operating ExpensesInsurance & IndemnitiesMedical CareUnique Patients**ADAMS204$ 1,163$ 553$ -$ 40$ -$ -$ 20$ 55078BARNES925$ 5,842$ 2,389$ -$ 163$ -$ -$ 78$ 3,212367BENSON403$ 2,698$ 1,191$ -$ 128$ -$ -$ 30$ 1,350111BILLINGS121$ 167$ 72$ -$ 9$ -$ -$ 1$ 8623BOTTINEAU643$ 2,617$ 1,437$ -$ 205$ -$ -$ 10$ 966195BOWMAN221$ 945$ 445$ -$ -$ -$ -$ 43$ 457101BURKE209$ 728$ 402$ -$ 19$ -$ -$ 1$ 30657BURLEIGH7,038$ 28,836$ 15,944$ -$ 1,999$ -$ -$ 363$ 10,5312,043CASS10,444$ 104,180$ 32,784$ 2,623$ 5,894$ -$ 6,479$ 1,019$ 55,3814,281CAVALIER368$ 1,414$ 648$ -$ 29$ -$ -$ 42$ 695116DICKEY487$ 1,571$ 890$ -$ 73$ -$ -$
  • 117.
    34$ 575114DIVIDE231$ 763$326$ -$ 46$ -$ -$ 59$ 33260DUNN327$ 1,456$ 653$ -$ 20$ -$ -$ 15$ 767110EDDY188$ 902$ 555$ -$ 17$ -$ -$ -$ 33056EMMONS317$ 1,579$ 874$ -$ 20$ -$ -$ 1$ 685141FOSTER222$ 921$ 482$ -$ 58$ -$ -$ 4$ 37768GOLDEN VALLEY168$ 443$ 180$ -$ 20$ -$ -$ 18$ 22544GRAND FORKS6,089$ 32,502$ 16,058$ -$ 5,040$ -$ -$ 288$ 11,1161,681GRANT235$ 852$ 418$ -$ 41$ -$ -$ 68$ 32565GRIGGS208$ 1,667$ 824$ -$ 13$ -$ -$ 21$ 809108HETTINGER273$ 1,020$ 553$ - $ 19$ -$ -$ 1$ 44778KIDDER205$ 1,220$ 510$ -$ 15$ -$ -$ 91$ 60576LA MOURE341$ 1,428$ 542$ -$ 25$ -$ -$ 2$ 859110LOGAN134$ 935$ 439$ -$ -$ - $ -$ 10$ 48676MCHENRY575$ 2,360$ 1,589$ -$ 86$ -$ -$ 3$ 682155MCINTOSH213$ 1,173$ 548$ -$ 56$ -$ -$ 31$ 53798MCKENZIE507$ 2,193$ 1,185$ -$ 30$ -$ -$ 9$ 970175MCLEAN863$ 4,658$ 2,368$ -$ 80$ -$ -$ 19$ 2,191295MERCER725$ 2,184$ 1,345$ -$ 42$ -$ -$ 47$ 751185MORTON2,076$ 12,064$ 6,492$ -$ 526$ -$ -$ 50$ 4,996744MOUNTRAIL564$ 3,022$ 1,767$ -$ 76$ -$ -$ 33$ 1,147184NELSON355$ 2,461$ 1,369$ -$ 62$ -$ -$ 1$ 1,029149OLIVER144$ 536$ 331$ -$ 1$ -$ -$ 3$ 20252PEMBINA705$ 3,210$ 1,704$ -$ 183$ -$ -$ 11$ 1,312248PIERCE398$ 1,336$ 655$ -$ 90$ -$ -$ 17$ 574117RAMSEY810$ 5,721$ 2,734$ -$ 264$ -$ -$ 99$ 2,625324RANSOM497$ 4,290$ 1,704$ -$ 30$ -$ -$ 54$ 2,502225RENVILLE332$ 1,005$ 739$ -$ 69$ -$ - $ 4$ 19368RICHLAND1,047$ 7,229$ 2,761$ -$ 370$ - $ -$ 18$ 4,079381ROLETTE741$ 4,934$ 2,934$ -$ 81$ -$ -$ 63$ 1,855191SARGENT321$ 1,810$ 820$ -$ 99$ -$ -$ 1$ 890106SHERIDAN148$ 393$ 200$ -$ 19$ -$ -$ 1$ 17347SIOUX338$ 1,693$ 931$ -$ 53$ -$ -$ -$ 70972SLOPE46$ 189$ 19$ -$ -$ -$ -$ 5$ 16621STARK1,993$ 10,580$ 5,071$ -$ 402$ -$ -$ 210$ 4,897780STEELE216$ 1,364$ 715$ -$ 27$ -$ -$
  • 118.
    239$ 38470STUTSMAN1,731$ 10,892$4,642$ -$ 330$ -$ -$ 65$ 5,855593TOWNER241$ 1,043$ 434$ -$ 21$ -$ -$ 30$ 55889TRAILL724$ 5,406$ 2,190$ -$ 309$ -$ -$ 64$ 2,842266WALSH1,027$ 5,119$ 2,071$ -$ 74$ -$ -$ 83$ 2,892327WARD6,521$ 31,146$ 18,296$ -$ 5,347$ -$ -$ 262$ 7,2411,572WELLS354$ 1,442$ 752$ -$ 19$ -$ -$ 1$ 669106WILLIAMS1,998$ 9,450$ 4,059$ -$ 132$ -$ -$ 131$ 5,128727NORTH DAKOTA (Totals)56,213$ 334,755$ 149,596$ 2,623$ 22,770$ -$ 6,479$ 3,770$ 149,51818,526CONG. DIST (01)56,213$ 334,755$ 149,596$ 2,623$ 22,770$ -$ 6,479$ 3,770$ 149,51818,526NORTH DAKOTA (Totals)56,213$ 334,755$ 149,596$ 2,623$ 22,770$ -$ 6,479$ 3,770$ 149,51818,526Notes:* Veteran population estimates, as of September 30, 2013, are produced by the VA Office of the Actuary (VetPop 2011).# Prior to FY 08, "Loan Guaranty" expenditures were included in the Education & Vocational Rehabilitation and Employment (E&VRE) programs. Currently, all "Loan Guaranty" expenditures are attributed to Travis County, TX, where all Loan Guaranty payments are processed. VA will continue to improve data collection for future GDX reports to better distribute loan expenditures at the state, county and congressional district levels.** Unique patients are patients who received treatment at a VA health care facility. Data are provided by the Allocation Resource Center (ARC).Expenditure data sources: USASpending.gov for Compensation & Pension (C&P) and Education and Vocational Rehabilitation and Employment (EVRE) Benefits; Veterans Benefits Administration Insurance Center for the Insurance costs; the VA Financial Management System (FMS) for Construction, Medical Research, General Operating Expenses, and certain C&P and Readjustment data; and the Allocation Resource Center (ARC) for Medical Care costs.1. Expenditures are rounded to the nearest thousand dollars. For example, $500 to $1,000 are rounded to $1; $0 to $499 are rounded to $0; and "$ -" = 0 or no expenditures.2. The Compensation & Pension
  • 119.
    expenditures include dollarsfor the following programs: veterans' compensation for service-connected disabilities; dependency and indemnity compensation for service-connected deaths; veterans' pension for nonservice-connected disabilities; and burial and other benefits to veterans and their survivors.3. Medical Care expenditures include dollars for medical services, medical administration, facility maintenance, educational support, research support, and other overhead items. Medical Care expenditures do not include dollars for construction or other non-medical support.4. Medical Care expenditures are based on where patients live instead of where care is delivered.5. A star symbol (*) in the Unique Patients column denotes that there were less than 10 Unique Patients. &"Arial,Bold"&11FY13 GEOGRAPHIC DISTRIBUTION OF VA EXPENDITURES (GDX) &8&P of &N NEFY13 Summary of Expenditures by StateExpenditures in $000sCounty/ Congressional DistrictVeteran Population*Total ExpenditureCompensation & PensionConstructionEducation & Vocational Rehabilitation/ EmploymentLoan Guaranty#General Operating ExpensesInsurance & IndemnitiesMedical CareUnique Patients**ADAMS2,213$ 18,988$ 10,893$ -$ 567$ -$ -$ 360$ 7,167930ANTELOPE593$ 4,222$ 2,592$ -$ 95$ -$ -$ 25$ 1,510245ARTHUR41$ 41$ 15$ -$ -$ -$ -$ -$ 2612BANNER45$ 222$ 109$ -$ 1$ -$ -$ 2$ 11023BLAINE38$ 213$ 120$ -$ -$ -$ -$ 10$ 8318BOONE525$ 3,916$ 2,303$ -$ 36$ -$ -$ 17$ 1,559234BOX BUTTE894$ 5,414$ 2,063$ -$ 330$ - $ -$ 24$ 2,997418BOYD193$ 1,277$ 668$ -$ 21$ -$ -$ -$ 589112BROWN258$ 2,832$ 1,783$ -$ 6$ -$ -$ 1$ 1,041148BUFFALO2,735$ 20,738$ 11,504$ -$ 1,207$ -$ -$ 152$ 7,8751,129BURT688$ 3,653$ 1,413$ -$ 107$ -$ -$ 142$ 1,991175BUTLER683$ 3,923$ 2,335$ -$ 66$ -$ -$ 51$ 1,471250CASS3,023$ 19,311$
  • 120.
    11,491$ -$ 1,350$-$ -$ 351$ 6,119852CEDAR674$ 3,529$ 1,907$ -$ 213$ -$ -$ 53$ 1,355243CHASE278$ 1,563$ 931$ -$ 12$ -$ -$ 15$ 604114CHERRY426$ 3,221$ 1,055$ -$ 63$ -$ -$ 38$ 2,065199CHEYENNE725$ 3,999$ 2,018$ -$ 70$ -$ -$ 93$ 1,819311CLAY518$ 4,008$ 2,549$ -$ 100$ -$ -$ 5$ 1,354210COLFAX639$ 1,999$ 987$ -$ 118$ -$ -$ 17$ 876169CUMING682$ 3,623$ 1,993$ -$ 125$ -$ -$ 55$ 1,450221CUSTER836$ 6,644$ 4,221$ -$ 97$ -$ -$ 132$ 2,194398DAKOTA1,178$ 6,409$ 3,373$ -$ 286$ - $ -$ 46$ 2,704420DAWES714$ 7,076$ 2,669$ -$ 290$ -$ -$ 75$ 4,042358DAWSON1,500$ 8,363$ 3,943$ -$ 182$ -$ -$ 74$ 4,164534DEUEL231$ 872$ 441$ -$ 3$ -$ -$ 1$ 42875DIXON477$ 2,355$ 996$ -$ 61$ - $ -$ 15$ 1,283152DODGE3,146$ 17,487$ 9,401$ -$ 879$ -$ -$ 136$ 7,071889DOUGLAS36,609$ 238,930$ 94,800$ 1,723$ 16,911$ -$ 2,425$ 3,846$ 119,2269,629DUNDY178$ 717$ 436$ -$ 4$ -$ -$ 10$ 26748FILLMORE488$ 5,442$ 2,744$ -$ 58$ -$ -$ 45$ 2,595263FRANKLIN281$ 2,737$ 1,750$ -$ 22$ -$ -$ 7$ 957175FRONTIER237$ 1,131$ 768$ -$ 29$ -$ -$ 19$ 31460FURNAS410$ 3,663$ 2,040$ -$ 23$ -$ -$ 6$ 1,594204GAGE1,534$ 15,162$ 8,818$ -$ 374$ -$ - $ 101$ 5,870857GARDEN201$ 1,626$ 639$ -$ 16$ -$ -$ 4$ 96674GARFIELD140$ 1,449$ 880$ -$ 6$ -$ -$ 8$ 55584GOSPER161$ 1,218$ 837$ -$ 12$ -$ -$ 1$ 36887GRANT56$ 232$ 70$ -$ 12$ -$ -$ -$ 15021GREELEY200$ 1,851$ 973$ -$ 2$ -$ -$ 16$ 860136HALL3,728$ 46,781$ 20,518$ -$ 787$ -$ 483$ 227$ 24,7652,266HAMILTON634$ 5,197$ 2,705$ -$ 135$ -$ -$ 29$ 2,329341HARLAN283$ 2,346$ 1,440$ -$ 2$ -$ -$ 14$ 890158HAYES85$ 254$ 75$ -$ 1$ -$ -$ 2$ 17635HITCHCOCK242$ 1,742$ 1,154$ -$ 20$ -$ -$ 49$ 51979HOLT728$ 4,922$ 2,491$ -$ 111$ -$ -$ 64$ 2,255399HOOKER73$ 363$ 133$ -$ 22$ -$ -$ 3$ 20426HOWARD442$ 5,760$ 3,394$ -$
  • 121.
    65$ -$ -$48$ 2,253293JEFFERSON747$ 4,028$ 2,405$ -$ 65$ -$ -$ 24$ 1,534254JOHNSON398$ 1,848$ 932$ -$ 33$ -$ -$ 59$ 824110KEARNEY482$ 2,479$ 1,379$ -$ 87$ -$ -$ 48$ 964186KEITH647$ 3,438$ 1,900$ -$ 81$ -$ -$ 59$ 1,398251KEYA PAHA72$ 19,365$ 359$ 592$ 4$ -$ 2,727$ -$ 15,68322KIMBALL429$ 2,597$ 900$ -$ 17$ -$ -$ 57$ 1,622135KNOX737$ 5,331$ 3,129$ -$ 148$ -$ -$ 37$ 2,018332LANCASTER18,255$ 153,871$ 64,678$ 14$ 10,118$ -$ 28,046$ 2,332$ 48,6836,536LINCOLN3,102$ 18,481$ 9,395$ 213$ 550$ -$ 701$ 90$ 7,5321,057LOGAN61$ 575$ 190$ -$ 8$ -$ -$ 8$ 36921LOUP50$ 444$ 237$ -$ 9$ -$ -$ 2$ 19721MCPHERSON37$ 175$ 134$ -$ -$ -$ -$ 1$ 4011MADISON2,600$ 11,865$ 6,380$ -$ 551$ -$ -$ 393$ 4,540796MERRICK586$ 7,085$ 3,710$ -$ 99$ -$ -$ 19$ 3,257380MORRILL429$ 2,993$ 1,576$ -$ 96$ -$ -$ 11$ 1,310174NANCE297$ 2,811$ 1,278$ -$ 25$ -$ -$ -$ 1,508134NEMAHA623$ 2,618$ 1,208$ -$ 203$ -$ -$ 54$ 1,154138NUCKOLLS397$ 2,915$ 1,661$ -$ 45$ -$ -$ 14$ 1,194176OTOE1,334$ 6,984$ 3,824$ -$ 298$ -$ -$ 46$ 2,814427PAWNEE265$ 1,349$ 789$ -$ 92$ -$ -$ 21$ 447101PERKINS212$ 1,026$ 646$ -$ 16$ -$ -$ 80$ 28574PHELPS694$ 5,327$ 3,003$ -$ 106$ -$ -$ 124$ 2,095374PIERCE515$ 2,127$ 1,394$ -$ 100$ -$ -$ 4$ 629187PLATTE2,141$ 10,421$ 5,708$ -$ 358$ -$ -$ 158$ 4,197738POLK414$ 2,525$ 1,252$ -$ 52$ -$ -$ 95$ 1,125174RED WILLOW810$ 6,531$ 4,396$ -$ 119$ -$ -$ 130$ 1,886377RICHARDSON827$ 5,157$ 3,062$ -$ 54$ -$ -$ 48$ 1,994275ROCK132$ 868$ 531$ -$ 8$ -$ -$ 1$ 32852SALINE1,104$ 5,897$ 3,512$ -$ 331$ -$ -$ 56$ 1,998355SARPY18,014$ 156,554$ 87,278$ 7,295$ 22,250$ -$ 2,089$ 1,334$ 36,3074,460SAUNDERS1,695$ 11,356$ 6,476$ -$ 501$ - $ -$ 140$ 4,239608SCOTTS BLUFF2,697$ 20,674$
  • 122.
    10,738$ -$ 684$-$ -$ 320$ 8,9321,270SEWARD1,050$ 7,415$ 3,875$ -$ 266$ -$ -$ 168$ 3,106499SHERIDAN530$ 5,500$ 1,882$ -$ 165$ -$ -$ 23$ 3,430322SHERMAN281$ 2,417$ 1,427$ -$ 34$ -$ -$ 10$ 947140SIOUX108$ 434$ 94$ -$ 14$ -$ -$ 2$ 32438STANTON458$ 1,585$ 817$ -$ 72$ -$ -$ 19$ 677148THAYER506$ 2,626$ 1,658$ -$ 45$ -$ -$ 5$ 918160THOMAS76$ 747$ 385$ -$ 11$ -$ -$ 20$ 33121THURSTON477$ 1,409$ 826$ -$ 24$ -$ -$ 8$ 55194VALLEY387$ 2,808$ 1,436$ -$ 44$ -$ -$ 3$ 1,325209WASHINGTON1,354$ 7,162$ 3,437$ -$ 404$ - $ -$ 78$ 3,243389WAYNE636$ 2,391$ 1,153$ -$ 110$ -$ -$ 56$ 1,071180WEBSTER335$ 2,484$ 1,477$ -$ 6$ -$ -$ 3$ 998159WHEELER80$ 384$ 180$ -$ -$ - $ -$ -$ 20427YORK1,033$ 9,263$ 4,828$ -$ 396$ -$ -$ 37$ 4,002609NEBRASKA (Totals)138,773$ 1,023,761$ 487,975$ 9,837$ 63,597$ -$ 36,470$ 12,589$ 413,29447,275CONG. DIST (01)48,757$ 345,875$ 173,248$ 1,295$ 27,612$ -$ 27,502$ 5,026$ 111,19015,495CONG. DIST (02)44,544$ 333,501$ 133,747$ 8,300$ 26,840$ -$ 8,267$ 4,343$ 152,00511,560CONG. DIST (03)45,472$ 344,385$ 180,979$ 242$ 9,144$ -$ 701$ 3,219$ 150,09920,220NEBRASKA (Totals)138,773$ 1,023,761$ 487,975$ 9,837$ 63,597$ -$ 36,470$ 12,589$ 413,29447,275Notes:* Veteran population estimates, as of September 30, 2013, are produced by the VA Office of the Actuary (VetPop 2011).# Prior to FY 08, "Loan Guaranty" expenditures were included in the Education & Vocational Rehabilitation and Employment (E&VRE) programs. Currently, all "Loan Guaranty" expenditures are attributed to Travis County, TX, where all Loan Guaranty payments are processed. VA will continue to improve data collection for future GDX reports to better distribute loan expenditures at the state, county and congressional district levels.** Unique patients are patients who received treatment at a VA health care facility. Data are provided by the Allocation Resource Center
  • 123.
    (ARC).Expenditure data sources:USASpending.gov for Compensation & Pension (C&P) and Education and Vocational Rehabilitation and Employment (EVRE) Benefits; Veterans Benefits Administration Insurance Center for the Insurance costs; the VA Financial Management System (FMS) for Construction, Medical Research, General Operating Expenses, and certain C&P and Readjustment data; and the Allocation Resource Center (ARC) for Medical Care costs.1. Expenditures are rounded to the nearest thousand dollars. For example, $500 to $1,000 are rounded to $1; $0 to $499 are rounded to $0; and "$ -" = 0 or no expenditures.2. The Compensation & Pension expenditures include dollars for the following programs: veterans' compensation for service-connected disabilities; dependency and indemnity compensation for service-connected deaths; veterans' pension for nonservice-connected disabilities; and burial and other benefits to veterans and their survivors.3. Medical Care expenditures include dollars for medical services, medical administration, facility maintenance, educational support, research support, and other overhead items. Medical Care expenditures do not include dollars for construction or other non-medical support.4. Medical Care expenditures are based on where patients live instead of where care is delivered.5. A star symbol (*) in the Unique Patients column denotes that there were less than 10 Unique Patients. &"Arial,Bold"&11FY13 GEOGRAPHIC DISTRIBUTION OF VA EXPENDITURES (GDX) &8&P of &N NHFY13 Summary of Expenditures by StateExpenditures in $000sCounty/ Congressional DistrictVeteran Population*Total ExpenditureCompensation & PensionConstructionEducation & Vocational Rehabilitation/ EmploymentLoan Guaranty#General Operating ExpensesInsurance & IndemnitiesMedical CareUnique Patients**BELKNAP6,099$ 36,934$ 18,360$ - $ 2,007$ -$ -$ 632$ 15,9351,793CARROLL5,266$
  • 124.
    24,268$ 12,286$ -$1,011$ -$ -$ 345$ 10,6261,303CHESHIRE7,055$ 36,480$ 15,969$ -$ 2,370$ -$ -$ 447$ 17,6941,704COOS3,315$ 19,603$ 9,212$ -$ 774$ -$ -$ 163$ 9,4541,390GRAFTON7,346$ 48,321$ 19,062$ -$ 3,748$ -$ -$ 593$ 24,9172,478HILLSBOROUGH30,179$ 182,668$ 71,566$ 1,282$ 16,044$ -$ 6,142$ 2,651$ 84,9827,678MERRIMACK13,035$ 67,423$ 28,482$ -$ 6,955$ -$ -$ 988$ 30,9982,984ROCKINGHAM23,582$ 114,109$ 54,813$ -$ 10,578$ -$ -$ 1,720$ 46,9975,340STRAFFORD10,714$ 53,998$ 26,980$ -$ 6,720$ -$ -$ 751$ 19,5472,397SULLIVAN4,187$ 30,002$ 12,007$ -$ 654$ -$ -$ 181$ 17,1611,537NEW HAMPSHIRE (Totals)110,778$ 613,805$ 268,735$ 1,282$ 50,861$ -$ 6,142$ 8,473$ 278,31228,604CONG. DIST (01)55,307$ 321,871$ 145,688$ 1,282$ 28,161$ -$ 6,142$ 4,346$ 136,25114,159CONG. DIST (02)55,470$ 291,934$ 123,047$ -$ 22,699$ -$ -$ 4,127$ 142,06114,445NEW HAMPSHIRE (Totals)110,778$ 613,805$ 268,735$ 1,282$ 50,861$ -$ 6,142$ 8,473$ 278,31228,604Notes:* Veteran population estimates, as of September 30, 2013, are produced by the VA Office of the Actuary (VetPop 2011).# Prior to FY 08, "Loan Guaranty" expenditures were included in the Education & Vocational Rehabilitation and Employment (E&VRE) programs. Currently, all "Loan Guaranty" expenditures are attributed to Travis County, TX, where all Loan Guaranty payments are processed. VA will continue to improve data collection for future GDX reports to better distribute loan expenditures at the state, county and congressional district levels.** Unique patients are patients who received treatment at a VA health care facility. Data are provided by the Allocation Resource Center (ARC).Expenditure data sources: USASpending.gov for Compensation & Pension (C&P) and Education and Vocational Rehabilitation and Employment (EVRE) Benefits; Veterans Benefits Administration Insurance Center for the Insurance
  • 125.
    costs; the VAFinancial Management System (FMS) for Construction, Medical Research, General Operating Expenses, and certain C&P and Readjustment data; and the Allocation Resource Center (ARC) for Medical Care costs.1. Expenditures are rounded to the nearest thousand dollars. For example, $500 to $1,000 are rounded to $1; $0 to $499 are rounded to $0; and "$ -" = 0 or no expenditures.2. The Compensation & Pension expenditures include dollars for the following programs: veterans' compensation for service-connected disabilities; dependency and indemnity compensation for service-connected deaths; veterans' pension for nonservice-connected disabilities; and burial and other benefits to veterans and their survivors.3. Medical Care expenditures include dollars for medical services, medical administration, facility maintenance, educational support, research support, and other overhead items. Medical Care expenditures do not include dollars for construction or other non-medical support.4. Medical Care expenditures are based on where patients live instead of where care is delivered.5. A star symbol (*) in the Unique Patients column denotes that there were less than 10 Unique Patients. &"Arial,Bold"&11FY13 GEOGRAPHIC DISTRIBUTION OF VA EXPENDITURES (GDX) &8&P of &N NJFY13 Summary of Expenditures by StateExpenditures in $000sCounty/ Congressional DistrictVeteran Population*Total ExpenditureCompensation & PensionConstructionEducation & Vocational Rehabilitation/ EmploymentLoan Guaranty#General Operating ExpensesInsurance & IndemnitiesMedical CareUnique Patients**ATLANTIC17,174$ 65,026$ 36,560$ -$ 6,557$ -$ -$ 1,471$ 20,4382,961BERGEN33,590$ 138,677$ 63,225$ -$ 17,468$ -$ -$ 6,099$ 51,8856,757BURLINGTON33,670$ 180,391$ 111,015$ -$ 26,352$ -$ -$ 2,537$ 40,4886,061CAMDEN30,510$ 139,164$ 77,312$ -$ 12,890$ -$ -$ 2,305$
  • 126.
    46,6585,634CAPE MAY8,741$ 30,607$19,436$ -$ 1,970$ -$ -$ 1,014$ 8,1871,570CUMBERLAND9,117$ 35,536$ 20,069$ -$ 2,368$ -$ -$ 463$ 12,6361,775ESSEX26,070$ 225,698$ 62,528$ 6,578$ 17,720$ -$ 14,756$ 3,282$ 120,8356,593GLOUCESTER20,065$ 81,522$ 45,711$ -$ 6,830$ -$ -$ 1,164$ 27,8183,848HUDSON15,693$ 78,764$ 30,721$ -$ 16,208$ -$ -$ 1,179$ 30,6562,857HUNTERDON7,099$ 25,766$ 11,548$ -$ 1,876$ -$ -$ 1,166$ 11,177876MERCER17,267$ 60,272$ 32,281$ -$ 7,135$ -$ -$ 2,188$ 18,6692,086MIDDLESEX31,612$ 132,453$ 59,106$ -$ 15,221$ -$ -$ 4,152$ 53,9745,396MONMOUTH33,438$ 124,451$ 67,933$ -$ 11,538$ -$ -$ 5,707$ 39,2724,971MORRIS23,381$ 73,861$ 31,434$ -$ 7,656$ -$ -$ 4,190$ 30,5803,403OCEAN45,053$ 184,226$ 105,258$ -$ 12,103$ -$ -$ 5,872$ 60,9929,566PASSAIC17,436$ 71,317$ 28,936$ -$ 10,093$ -$ -$ 2,722$ 29,5663,080SALEM5,534$ 19,873$ 10,347$ -$ 1,342$ -$ -$ 183$ 8,001865SOMERSET13,416$ 87,322$ 23,682$ -$ 3,786$ -$ 1,112$ 2,050$ 56,6912,427SUSSEX9,097$ 33,919$ 15,997$ -$ 3,177$ - $ -$ 611$ 14,1351,489UNION19,481$ 112,335$ 40,246$ -$ 11,393$ -$ -$ 3,005$ 57,6913,965WARREN7,648$ 25,842$ 13,399$ -$ 2,432$ -$ -$ 635$ 9,376999NEW JERSEY (Totals)425,094$ 1,927,021$ 906,744$ 6,578$ 196,113$ -$ 15,868$ 51,994$ 749,72477,179CONG. DIST (01)46,272$ 208,094$ 116,688$ -$ 19,379$ -$ -$ 3,143$ 68,8848,736CONG. DIST (02)51,091$ 186,219$ 106,134$ -$ 15,004$ -$ -$ 3,998$ 61,0838,927CONG. DIST (03)57,521$ 270,499$ 162,276$ -$ 31,358$ -$ -$ 5,093$ 71,77211,034CONG. DIST (04)43,723$ 168,836$ 93,523$ -$ 14,074$ -$ -$ 7,117$ 54,1227,556CONG. DIST (05)34,035$ 122,412$ 56,545$ -$ 14,111$ -$ -$ 5,099$ 46,6586,044CONG. DIST (06)29,728$ 125,403$ 60,578$ -$ 13,567$ -$ -$ 3,746$ 47,5124,765CONG.
  • 127.
    DIST (07)34,198$ 156,529$54,491$ -$ 10,766$ -$ 1,112$ 5,590$ 84,5695,116CONG. DIST (08)14,383$ 84,851$ 31,110$ -$ 12,464$ -$ -$ 1,175$ 40,1023,053CONG. DIST (09)22,560$ 110,394$ 48,329$ -$ 15,255$ -$ -$ 3,273$ 43,5374,656CONG. DIST (10)25,442$ 246,348$ 75,579$ 6,578$ 24,644$ -$ 14,756$ 1,962$ 122,8296,904CONG. DIST (11)34,950$ 112,837$ 42,428$ -$ 11,281$ -$ -$ 6,788$ 52,3415,196CONG. DIST (12)31,192$ 134,598$ 59,064$ -$ 14,209$ -$ -$ 5,009$ 56,3165,191NEW JERSEY (Totals)425,094$ 1,927,021$ 906,744$ 6,578$ 196,113$ - $ 15,868$ 51,994$ 749,72477,178Notes:* Veteran population estimates, as of September 30, 2013, are produced by the VA Office of the Actuary (VetPop 2011).# Prior to FY 08, "Loan Guaranty" expenditures were included in the Education & Vocational Rehabilitation and Employment (E&VRE) programs. Currently, all "Loan Guaranty" expenditures are attributed to Travis County, TX, where all Loan Guaranty payments are processed. VA will continue to improve data collection for future GDX reports to better distribute loan expenditures at the state, county and congressional district levels.** Unique patients are patients who received treatment at a VA health care facility. Data are provided by the Allocation Resource Center (ARC).Expenditure data sources: USASpending.gov for Compensation & Pension (C&P) and Education and Vocational Rehabilitation and Employment (EVRE) Benefits; Veterans Benefits Administration Insurance Center for the Insurance costs; the VA Financial Management System (FMS) for Construction, Medical Research, General Operating Expenses, and certain C&P and Readjustment data; and the Allocation Resource Center (ARC) for Medical Care costs.1. Expenditures are rounded to the nearest thousand dollars. For example, $500 to $1,000 are rounded to $1; $0 to $499 are rounded to $0; and "$ -" = 0 or no expenditures.2. The Compensation & Pension expenditures include dollars for the following programs: veterans' compensation for service-connected disabilities;
  • 128.
    dependency and indemnitycompensation for service-connected deaths; veterans' pension for nonservice-connected disabilities; and burial and other benefits to veterans and their survivors.3. Medical Care expenditures include dollars for medical services, medical administration, facility maintenance, educational support, research support, and other overhead items. Medical Care expenditures do not include dollars for construction or other non-medical support.4. Medical Care expenditures are based on where patients live instead of where care is delivered.5. A star symbol (*) in the Unique Patients column denotes that there were less than 10 Unique Patients. &"Arial,Bold"&11FY13 GEOGRAPHIC DISTRIBUTION OF VA EXPENDITURES (GDX) &8&P of &N NMFY13 Summary of Expenditures by StateExpenditures in $000sCounty/ Congressional DistrictVeteran Population*Total ExpenditureCompensation & PensionConstructionEducation & Vocational Rehabilitation/ EmploymentLoan Guaranty#General Operating ExpensesInsurance & IndemnitiesMedical CareUnique Patients**BERNALILLO54,077$ 530,007$ 238,373$ 19,141$ 29,472$ -$ 10,999$ 4,781$ 227,24117,050CATRON482$ 4,174$ 2,219$ -$ 76$ -$ - $ 17$ 1,861185CHAVES5,299$ 25,792$ 14,759$ -$ 1,101$ -$ -$ 372$ 9,5601,267CIBOLA2,148$ 17,473$ 9,214$ -$ 258$ -$ -$ 29$ 7,973643COLFAX1,542$ 11,446$ 6,544$ -$ 149$ -$ -$ 54$ 4,700540CURRY4,887$ 33,283$ 19,738$ -$ 3,042$ -$ - $ 852$ 9,6511,361DE BACA225$ 1,416$ 844$ -$ 16$ -$ -$ 2$ 55469DONA ANA14,841$ 91,417$ 54,829$ -$ 8,929$ -$ -$ 1,357$ 26,3034,086EDDY4,275$ 18,211$ 10,809$ -$ 342$ -$ -$ 122$ 6,9381,003GRANT3,554$ 24,521$ 12,899$ 3,054$ 576$ -$ -$ 302$ 7,6901,122GUADALUPE444$ 3,663$ 2,112$ -$ 50$ -$ -$ 16$ 1,485142HARDING92$ 1,176$ 302$ -$ 18$ -$
  • 129.
    -$ -$ 85638HIDALGO468$1,875$ 1,046$ -$ 65$ -$ - $ 2$ 76195LEA3,613$ 16,280$ 8,200$ -$ 536$ -$ -$ 111$ 7,434883LINCOLN2,324$ 13,734$ 7,771$ -$ 286$ -$ -$ 191$ 5,485662LOS ALAMOS1,670$ 3,187$ 2,053$ -$ 268$ -$ -$ 113$ 753128LUNA2,354$ 13,653$ 7,847$ -$ 232$ -$ -$ 148$ 5,427669MC KINLEY3,728$ 29,948$ 17,930$ -$ 1,208$ -$ -$ 80$ 10,7301,200MORA469$ 6,439$ 3,894$ -$ 39$ -$ -$ 58$ 2,449219OTERO8,832$ 54,499$ 35,306$ -$ 4,312$ -$ -$ 361$ 14,5202,257QUAY983$ 7,675$ 4,161$ -$ 107$ -$ -$ 54$ 3,354375RIO ARRIBA2,650$ 20,415$ 12,900$ -$ 400$ -$ -$ 221$ 6,893714ROOSEVELT1,405$ 7,335$ 4,228$ -$ 801$ -$ -$ 55$ 2,250318SANDOVAL12,540$ 102,802$ 56,638$ - $ 6,106$ -$ -$ 952$ 39,1063,661SAN JUAN9,361$ 41,155$ 23,877$ -$ 2,250$ -$ -$ 278$ 14,7511,996SAN MIGUEL2,129$ 22,972$ 14,535$ -$ 433$ -$ -$ 81$ 7,924843SANTA FE10,836$ 72,934$ 40,623$ 4,376$ 2,521$ -$ 1,587$ 753$ 23,0742,976SIERRA2,239$ 16,598$ 8,824$ -$ 141$ -$ - $ 211$ 7,422829SOCORRO1,593$ 12,486$ 6,894$ -$ 439$ -$ -$ 45$ 5,107509TAOS2,550$ 24,796$ 15,648$ -$ 412$ -$ -$ 467$ 8,2701,102TORRANCE1,931$ 15,171$ 7,716$ -$ 276$ -$ -$ 40$ 7,139580UNION270$ 2,034$ 1,247$ -$ 27$ -$ -$ 29$ 732125VALENCIA6,886$ 64,375$ 32,244$ -$ 2,427$ -$ -$ 597$ 29,1072,334NEW MEXICO (Totals)170,699$ 1,312,943$ 686,222$ 26,571$ 67,315$ -$ 12,586$ 12,750$ 507,49949,981CONG. DIST (01)57,153$ 564,070$ 257,492$ 19,141$ 30,489$ -$ 10,999$ 4,921$ 241,02818,019CONG. DIST (02)60,175$ 381,681$ 217,299$ 3,054$ 20,105$ -$ -$ 3,843$ 137,38016,843CONG. DIST (03)53,371$ 367,192$ 211,431$ 4,376$ 16,722$ -$ 1,587$ 3,986$ 129,09115,119NEW MEXICO (Totals)170,699$ 1,312,943$ 686,222$ 26,571$ 67,315$ - $ 12,586$ 12,750$ 507,49949,981Notes:* Veteran
  • 130.
    population estimates, asof September 30, 2013, are produced by the VA Office of the Actuary (VetPop 2011).# Prior to FY 08, "Loan Guaranty" expenditures were included in the Education & Vocational Rehabilitation and Employment (E&VRE) programs. Currently, all "Loan Guaranty" expenditures are attributed to Travis County, TX, where all Loan Guaranty payments are processed. VA will continue to improve data collection for future GDX reports to better distribute loan expenditures at the state, county and congressional district levels.** Unique patients are patients who received treatment at a VA health care facility. Data are provided by the Allocation Resource Center (ARC).Expenditure data sources: USASpending.gov for Compensation & Pension (C&P) and Education and Vocational Rehabilitation and Employment (EVRE) Benefits; Veterans Benefits Administration Insurance Center for the Insurance costs; the VA Financial Management System (FMS) for Construction, Medical Research, General Operating Expenses, and certain C&P and Readjustment data; and the Allocation Resource Center (ARC) for Medical Care costs.1. Expenditures are rounded to the nearest thousand dollars. For example, $500 to $1,000 are rounded to $1; $0 to $499 are rounded to $0; and "$ -" = 0 or no expenditures.2. The Compensation & Pension expenditures include dollars for the following programs: veterans' compensation for service-connected disabilities; dependency and indemnity compensation for service-connected deaths; veterans' pension for nonservice-connected disabilities; and burial and other benefits to veterans and their survivors.3. Medical Care expenditures include dollars for medical services, medical administration, facility maintenance, educational support, research support, and other overhead items. Medical Care expenditures do not include dollars for construction or other non-medical support.4. Medical Care expenditures are based on where patients live instead of where care is delivered.5. A star symbol (*) in the Unique Patients column denotes that there were less than 10 Unique Patients. &"Arial,Bold"&11FY13 GEOGRAPHIC DISTRIBUTION OF
  • 131.
    VA EXPENDITURES (GDX) &8&Pof &N NVFY13 Summary of Expenditures by StateExpenditures in $000sCounty/ Congressional DistrictVeteran Population*Total ExpenditureCompensation & PensionConstructionEducation & Vocational Rehabilitation/ EmploymentLoan Guaranty#General Operating ExpensesInsurance & IndemnitiesMedical CareUnique Patients**CHURCHILL3,971$ 27,110$ 13,744$ -$ 1,419$ -$ -$ 358$ 11,5901,189CLARK152,847$ 1,051,792$ 439,575$ 11,348$ 76,659$ -$ 2,990$ 9,488$ 511,73240,214DOUGLAS4,657$ 24,879$ 11,353$ -$ 910$ -$ -$ 389$ 12,2261,639ELKO4,134$ 16,229$ 6,552$ -$ 585$ -$ -$ 67$ 9,025849ESMERALDA199$ 750$ 249$ -$ 30$ -$ -$ 10$ 46038EUREKA210$ 605$ 243$ -$ 13$ -$ -$ 1$ 34737HUMBOLDT1,501$ 7,530$ 3,422$ -$ 106$ -$ -$ 98$ 3,903355LANDER590$ 1,384$ 612$ -$ 80$ -$ -$ -$ 69285LINCOLN638$ 1,880$ 1,099$ - $ 59$ -$ -$ 13$ 70993LYON6,866$ 46,786$ 20,600$ -$ 1,940$ -$ -$ 301$ 23,9452,427MINERAL979$ 5,198$ 2,201$ -$ 64$ -$ -$ 52$ 2,881214NYE6,142$ 54,632$ 24,741$ -$ 698$ -$ -$ 630$ 28,5632,602PERSHING797$ 2,576$ 1,054$ -$ 29$ -$ -$ 20$ 1,473178STOREY689$ 2,701$ 315$ -$ 13$ -$ -$ 17$ 2,356182WASHOE34,718$ 289,245$ 98,363$ 8,293$ 11,838$ -$ 10,515$ 2,766$ 157,46913,193WHITE PINE1,254$ 5,813$ 1,966$ -$ 88$ -$ -$ 91$ 3,668309CARSON CITY5,742$ 33,982$ 15,880$ -$ 1,029$ -$ -$ 214$ 16,8581,839NEVADA (Totals)225,933$ 1,573,091$ 641,969$ 19,641$ 95,562$ -$ 13,505$ 14,516$ 787,89965,443CONG. DIST (01)46,676$ 420,860$ 172,011$ 11,348$ 29,997$ -$ 2,990$ 2,844$ 201,67113,934CONG. DIST (02)62,406$ 446,325$ 169,188$ 8,293$ 17,686$ -$ 10,515$ 4,197$ 236,44621,584CONG. DIST (03)55,365$ 280,758$ 118,892$ -$ 20,734$ -$ -$
  • 132.
    3,174$ 137,95812,894CONG. DIST(04)61,486$ 425,147$ 181,877$ -$ 27,145$ -$ -$ 4,301$ 211,82517,031NEVADA (Totals)225,933$ 1,573,091$ 641,969$ 19,641$ 95,562$ -$ 13,505$ 14,516$ 787,89965,443Notes:* Veteran population estimates, as of September 30, 2013, are produced by the VA Office of the Actuary (VetPop 2011).# Prior to FY 08, "Loan Guaranty" expenditures were included in the Education & Vocational Rehabilitation and Employment (E&VRE) programs. Currently, all "Loan Guaranty" expenditures are attributed to Travis County, TX, where all Loan Guaranty payments are processed. VA will continue to improve data collection for future GDX reports to better distribute loan expenditures at the state, county and congressional district levels.** Unique patients are patients who received treatment at a VA health care facility. Data are provided by the Allocation Resource Center (ARC).Expenditure data sources: USASpending.gov for Compensation & Pension (C&P) and Education and Vocational Rehabilitation and Employment (EVRE) Benefits; Veterans Benefits Administration Insurance Center for the Insurance costs; the VA Financial Management System (FMS) for Construction, Medical Research, General Operating Expenses, and certain C&P and Readjustment data; and the Allocation Resource Center (ARC) for Medical Care costs.1. Expenditures are rounded to the nearest thousand dollars. For example, $500 to $1,000 are rounded to $1; $0 to $499 are rounded to $0; and "$ -" = 0 or no expenditures.2. The Compensation & Pension expenditures include dollars for the following programs: veterans' compensation for service-connected disabilities; dependency and indemnity compensation for service-connected deaths; veterans' pension for nonservice-connected disabilities; and burial and other benefits to veterans and their survivors.3. Medical Care expenditures include dollars for medical services, medical administration, facility maintenance, educational support, research support, and other overhead items. Medical Care expenditures do not include dollars for construction or
  • 133.
    other non-medical support.4.Medical Care expenditures are based on where patients live instead of where care is delivered.5. A star symbol (*) in the Unique Patients column denotes that there were less than 10 Unique Patients. &"Arial,Bold"&11FY13 GEOGRAPHIC DISTRIBUTION OF VA EXPENDITURES (GDX) &8&P of &N NYFY13 Summary of Expenditures by StateExpenditures in $000sCounty/ Congressional DistrictVeteran Population*Total ExpenditureCompensation & PensionConstructionEducation & Vocational Rehabilitation/ EmploymentLoan Guaranty#General Operating ExpensesInsurance & IndemnitiesMedical CareUnique Patients**ALBANY19,513$ 133,312$ 40,903$ 1,522$ 7,458$ -$ 6,365$ 1,763$ 75,3024,743ALLEGANY4,160$ 30,927$ 12,888$ -$ 1,354$ -$ -$ 262$ 16,4231,531BRONX35,073$ 344,602$ 89,106$ 700$ 40,139$ -$ 2,906$ 1,651$ 210,10110,682BROOME14,596$ 52,449$ 29,406$ -$ 3,285$ -$ -$ 1,113$ 18,6463,288CATTARAUGUS7,312$ 47,182$ 24,324$ -$ 2,203$ -$ -$ 355$ 20,3002,359CAYUGA6,401$ 32,830$ 14,195$ -$ 1,518$ -$ -$ 259$ 16,8571,943CHAUTAUQUA10,719$ 71,340$ 37,375$ -$ 2,703$ -$ -$ 705$ 30,5574,062CHEMUNG7,853$ 48,859$ 23,263$ -$ 2,048$ -$ -$ 836$ 22,7122,462CHENANGO4,553$ 21,070$ 10,847$ -$ 1,009$ -$ -$ 380$ 8,835994CLINTON6,703$ 36,666$ 22,940$ -$ 1,875$ -$ -$ 421$ 11,4302,000COLUMBIA4,910$ 22,284$ 9,137$ -$ 550$ - $ -$ 343$ 12,2551,130CORTLAND3,515$ 19,537$ 7,531$ -$ 906$ -$ -$ 126$ 10,9731,083DELAWARE3,678$ 16,635$ 7,796$ -$ 583$ -$ -$ 278$ 7,977844DUTCHESS18,063$ 119,606$ 35,745$ -$ 8,384$ -$ 593$ 1,970$ 72,9134,755ERIE62,686$ 491,832$ 194,254$ 6,650$
  • 134.
    27,267$ -$ 47,754$6,352$ 209,55419,050ESSEX3,797$ 15,631$ 8,013$ -$ 735$ -$ -$ 177$ 6,706938FRANKLIN3,994$ 18,710$ 11,250$ -$ 1,256$ - $ -$ 230$ 5,9741,050FULTON4,546$ 19,174$ 9,502$ -$ 1,186$ -$ -$ 226$ 8,260950GENESEE4,218$ 47,822$ 14,651$ 53$ 1,588$ -$ 304$ 470$ 30,7561,840GREENE4,021$ 23,987$ 9,226$ -$ 630$ -$ -$ 182$ 13,9491,125HAMILTON647$ 1,652$ 700$ -$ 42$ -$ -$ 9$ 90198HERKIMER5,387$ 23,060$ 12,821$ -$ 1,290$ -$ -$ 277$ 8,6731,273JEFFERSON13,150$ 86,739$ 45,476$ -$ 18,311$ -$ -$ 1,272$ 21,6803,651KINGS52,159$ 464,548$ 130,097$ -$ 61,532$ -$ -$ 3,769$ 269,15013,351LEWIS2,188$ 12,552$ 6,828$ -$ 1,010$ -$ -$ 63$ 4,650694LIVINGSTON4,797$ 21,793$ 10,055$ -$ 1,400$ -$ -$ 342$ 9,9951,270MADISON5,188$ 28,609$ 11,821$ -$ 1,900$ -$ -$ 599$ 14,2901,412MONROE44,177$ 196,184$ 86,354$ -$ 19,036$ -$ -$ 4,169$ 86,62511,470MONTGOMERY3,853$ 20,584$ 11,362$ -$ 1,042$ -$ -$ 211$ 7,969850NASSAU54,849$ 233,363$ 96,969$ -$ 26,594$ -$ -$ 12,544$ 97,25611,754NEW YORK37,720$ 296,165$ 71,695$ 7,046$ 43,833$ -$ 27,821$ 8,572$ 137,1978,691NIAGARA17,710$ 98,809$ 46,908$ -$ 6,809$ -$ -$ 1,320$ 43,7724,588ONEIDA17,531$ 95,795$ 49,926$ -$ 5,919$ -$ -$ 1,783$ 38,1674,946ONONDAGA29,198$ 227,026$ 71,716$ 17$ 14,735$ -$ 1,496$ 2,205$ 136,8589,647ONTARIO8,260$ 64,668$ 20,146$ -$ 2,647$ -$ 1,109$ 488$ 40,2783,001ORANGE21,979$ 132,886$ 55,790$ -$ 15,340$ -$ -$ 2,142$ 59,6155,118ORLEANS3,142$ 19,445$ 10,107$ -$ 648$ - $ -$ 81$ 8,609954OSWEGO9,940$ 60,784$ 22,732$ -$ 3,802$ -$ -$ 667$ 33,5843,354OTSEGO4,361$ 21,857$ 12,752$ -$ 1,038$ -$ -$ 372$ 7,694995PUTNAM4,749$ 23,297$ 9,431$ -$ 1,946$ -$ -$ 432$ 11,4881,166QUEENS55,558$ 364,577$ 110,919$ -$
  • 135.
    56,139$ -$ -$5,747$ 191,77211,042RENSSELAER11,798$ 62,781$ 25,292$ -$ 4,163$ -$ -$ 872$ 32,4552,779RICHMOND20,733$ 120,984$ 49,459$ -$ 11,120$ -$ -$ 1,953$ 58,4524,026ROCKLAND10,546$ 53,695$ 25,104$ -$ 4,899$ -$ -$ 1,302$ 22,3903,081ST. LAWRENCE9,039$ 44,999$ 28,457$ -$ 3,214$ -$ -$ 560$ 12,7682,341SARATOGA17,485$ 69,736$ 32,346$ -$ 6,049$ -$ -$ 1,115$ 30,2263,481SCHENECTADY11,040$ 50,863$ 22,329$ -$ 3,628$ -$ -$ 1,094$ 23,8112,437SCHOHARIE2,746$ 14,366$ 6,340$ -$ 592$ -$ -$ 95$ 7,339614SCHUYLER1,704$ 9,824$ 4,333$ -$ 363$ -$ -$ 138$ 4,990539SENECA2,662$ 15,818$ 6,608$ -$ 919$ -$ -$ 157$ 8,135850STEUBEN8,720$ 90,958$ 28,434$ 412$ 2,594$ -$ 1,734$ 344$ 57,4403,639SUFFOLK76,577$ 496,356$ 145,538$ 911$ 33,191$ -$ 28,939$ 9,588$ 278,18919,971SULLIVAN4,954$ 30,818$ 12,324$ -$ 1,063$ -$ -$ 232$ 17,1991,407TIOGA4,655$ 15,975$ 8,807$ -$ 651$ -$ -$ 291$ 6,2261,080TOMPKINS4,964$ 20,801$ 9,666$ -$ 2,013$ -$ -$ 1,218$ 7,9041,073ULSTER12,710$ 53,208$ 21,313$ -$ 3,372$ -$ -$ 1,023$ 27,5002,886WARREN6,353$ 26,016$ 14,025$ -$ 1,573$ -$ -$ 362$ 10,0571,472WASHINGTON5,665$ 22,488$ 12,355$ -$ 1,375$ -$ -$ 113$ 8,6451,287WAYNE7,208$ 38,371$ 15,761$ -$ 1,964$ -$ -$ 515$ 20,1312,080WESTCHESTER34,115$ 241,511$ 73,207$ 211$ 17,412$ -$ 1,536$ 7,706$ 141,4398,248WYOMING3,284$ 17,667$ 8,648$ -$ 752$ -$ -$ 131$ 8,137979YATES1,984$ 15,827$ 6,261$ -$ 504$ -$ -$ 144$ 8,917737NEW YORK (Totals)885,796$ 5,621,911$ 2,063,566$ 17,521$ 493,102$ -$ 120,558$ 94,116$ 2,833,048231,161CONG. DIST (01)40,726$ 209,374$ 56,218$ 911$ 12,821$ -$ 28,939$ 4,525$ 105,9619,713CONG. DIST (02)33,516$ 204,234$ 68,246$ -
  • 136.
    $ 16,470$ -$-$ 3,949$ 115,5698,836CONG. DIST (03)31,777$ 197,073$ 66,363$ -$ 17,247$ -$ -$ 8,388$ 105,0757,595CONG. DIST (04)28,472$ 118,220$ 49,207$ - $ 13,495$ -$ -$ 6,152$ 49,3675,987CONG. DIST (05)21,195$ 210,506$ 66,466$ -$ 32,140$ -$ -$ 1,960$ 109,9405,000CONG. DIST (06)16,582$ 69,131$ 20,674$ -$ 10,463$ -$ -$ 2,112$ 35,8822,769CONG. DIST (07)11,245$ 84,726$ 24,100$ -$ 12,044$ -$ -$ 1,026$ 47,5572,806CONG. DIST (08)18,233$ 177,794$ 50,361$ -$ 23,968$ -$ -$ 858$ 102,6074,992CONG. DIST (09)14,360$ 129,977$ 36,413$ -$ 17,222$ -$ -$ 1,014$ 75,3283,846CONG. DIST (10)15,173$ 86,366$ 24,000$ -$ 13,331$ -$ -$ 3,011$ 46,0242,994CONG. DIST (11)29,082$ 189,733$ 68,571$ -$ 20,159$ -$ -$ 2,998$ 98,0055,768CONG. DIST (12)18,585$ 138,199$ 29,034$ 7,046$ 16,629$ -$ 27,821$ 4,956$ 52,7133,564CONG. DIST (13)14,892$ 189,655$ 53,574$ -$ 29,682$ -$ -$ 1,179$ 105,2205,123CONG. DIST (14)17,000$ 90,730$ 23,557$ -$ 11,199$ -$ -$ 771$ 55,2043,274CONG. DIST (15)12,571$ 153,945$ 40,544$ 700$ 18,263$ -$ 2,906$ 149$ 91,3835,091CONG. DIST (16)25,834$ 146,836$ 39,596$ -$ 12,917$ -$ -$ 4,067$ 90,2565,963CONG. DIST (17)24,997$ 207,661$ 72,605$ 211$ 16,197$ -$ 1,536$ 4,884$ 112,2276,969CONG. DIST (18)40,295$ 245,715$ 91,809$ -$ 23,530$ -$ 593$ 4,817$ 124,9669,720CONG. DIST (19)51,507$ 259,655$ 105,918$ -$ 12,764$ -$ -$ 3,471$ 137,50212,458CONG. DIST (20)49,698$ 269,392$ 102,237$ 1,522$ 17,390$ -$ 6,365$ 4,314$ 137,56511,088CONG. DIST (21)64,521$ 319,866$ 176,162$ -$ 33,534$ -$ -$ 3,967$ 106,20316,364CONG. DIST (22)54,592$ 267,740$ 132,259$ -$ 16,009$ -$ -$ 4,440$ 115,03214,380CONG. DIST (23)57,139$ 385,218$ 167,387$ 412$ 16,120$ -$ 1,734$ 4,664$ 194,90019,304CONG. DIST (24)48,863$ 327,425$ 113,495$ 17$ 20,195$ -$ 1,496$ 3,348$ 188,87515,595CONG. DIST (25)42,244$ 188,397$ 82,899$
  • 137.
    -$ 18,273$ -$-$ 4,065$ 83,16011,018CONG. DIST (26)48,426$ 427,310$ 168,464$ 6,650$ 23,748$ -$ 47,754$ 4,601$ 176,09315,290CONG. DIST (27)54,272$ 327,029$ 133,407$ 53$ 17,291$ -$ 1,413$ 4,430$ 170,43515,654NEW YORK (Totals)885,796$ 5,621,911$ 2,063,566$ 17,521$ 493,102$ -$ 120,558$ 94,116$ 2,833,048231,161Notes:* Veteran population estimates, as of September 30, 2013, are produced by the VA Office of the Actuary (VetPop 2011).# Prior to FY 08, "Loan Guaranty" expenditures were included in the Education & Vocational Rehabilitation and Employment (E&VRE) programs. Currently, all "Loan Guaranty" expenditures are attributed to Travis County, TX, where all Loan Guaranty payments are processed. VA will continue to improve data collection for future GDX reports to better distribute loan expenditures at the state, county and congressional district levels.** Unique patients are patients who received treatment at a VA health care facility. Data are provided by the Allocation Resource Center (ARC).Expenditure data sources: USASpending.gov for Compensation & Pension (C&P) and Education and Vocational Rehabilitation and Employment (EVRE) Benefits; Veterans Benefits Administration Insurance Center for the Insurance costs; the VA Financial Management System (FMS) for Construction, Medical Research, General Operating Expenses, and certain C&P and Readjustment data; and the Allocation Resource Center (ARC) for Medical Care costs.1. Expenditures are rounded to the nearest thousand dollars. For example, $500 to $1,000 are rounded to $1; $0 to $499 are rounded to $0; and "$ -" = 0 or no expenditures.2. The Compensation & Pension expenditures include dollars for the following programs: veterans' compensation for service-connected disabilities; dependency and indemnity compensation for service-connected deaths; veterans' pension for nonservice-connected disabilities; and burial and other benefits to veterans and their survivors.3. Medical Care expenditures include dollars for medical services, medical administration, facility maintenance, educational
  • 138.
    support, research support,and other overhead items. Medical Care expenditures do not include dollars for construction or other non-medical support.4. Medical Care expenditures are based on where patients live instead of where care is delivered.5. A star symbol (*) in the Unique Patients column denotes that there were less than 10 Unique Patients. &"Arial,Bold"&11FY13 GEOGRAPHIC DISTRIBUTION OF VA EXPENDITURES (GDX) &8&P of &N OHFY13 Summary of Expenditures by StateExpenditures in $000sCounty/ Congressional DistrictVeteran Population*Total ExpenditureCompensation & PensionConstructionEducation & Vocational Rehabilitation/ EmploymentLoan Guaranty#General Operating ExpensesInsurance & IndemnitiesMedical CareUnique Patients**ADAMS2,002$ 16,022$ 7,046$ -$ 447$ -$ -$ 32$ 8,496729ALLEN8,438$ 35,784$ 18,046$ -$ 2,260$ -$ -$ 277$ 15,2001,753ASHLAND4,144$ 20,674$ 9,150$ -$ 1,421$ -$ -$ 151$ 9,9531,230ASHTABULA9,037$ 47,579$ 20,917$ -$ 2,269$ -$ -$ 247$ 24,1473,008ATHENS4,093$ 32,935$ 13,944$ -$ 2,659$ -$ -$ 312$ 16,0191,291AUGLAIZE4,242$ 12,621$ 6,192$ -$ 842$ - $ -$ 304$ 5,283756BELMONT6,312$ 24,470$ 13,235$ - $ 836$ -$ -$ 294$ 10,1051,698BROWN3,728$ 22,437$ 8,271$ -$ 720$ -$ -$ 86$ 13,3601,203BUTLER26,644$ 120,003$ 49,754$ -$ 9,338$ -$ -$ 1,406$ 59,5055,790CARROLL2,488$ 9,756$ 3,600$ -$ 385$ -$ -$ 73$ 5,697715CHAMPAIGN3,175$ 13,296$ 6,141$ -$ 1,011$ -$ -$ 339$ 5,804618CLARK13,611$ 66,756$ 32,543$ -$ 3,576$ -$ -$ 621$ 30,0163,069CLERMONT16,126$ 76,009$ 30,314$ -$ 5,229$ -$ -$ 1,221$ 39,2454,063CLINTON3,535$ 21,289$ 9,681$ -$ 1,258$ -$ -$ 417$ 9,934863COLUMBIANA9,393$ 49,923$ 24,100$ -$
  • 139.
    2,560$ -$ -$494$ 22,7703,044COSHOCTON3,029$ 12,730$ 6,913$ -$ 525$ -$ -$ 122$ 5,171942CRAWFORD4,144$ 18,339$ 9,012$ -$ 838$ -$ -$ 153$ 8,3361,070CUYAHOGA82,786$ 2,763,705$ 188,469$ 10,883$ 29,351$ -$ 2,192,066$ 7,545$ 335,39222,635DARKE3,734$ 17,167$ 8,240$ -$ 683$ -$ -$ 177$ 8,067907DEFIANCE2,994$ 12,714$ 7,636$ -$ 776$ -$ -$ 174$ 4,129674DELAWARE12,107$ 30,205$ 15,227$ -$ 3,118$ -$ -$ 752$ 11,1091,642ERIE8,117$ 37,903$ 18,826$ -$ 1,472$ -$ -$ 676$ 16,9292,193FAIRFIELD12,661$ 59,682$ 24,744$ -$ 4,481$ -$ -$ 1,072$ 29,3853,234FAYETTE2,339$ 15,966$ 5,594$ -$ 597$ -$ -$ 21$ 9,755645FRANKLIN71,679$ 355,984$ 149,554$ 1,893$ 41,205$ -$ 1,086$ 4,758$ 157,48718,468FULTON2,985$ 11,564$ 6,238$ -$ 756$ -$ -$ 182$ 4,387661GALLIA2,401$ 18,017$ 8,693$ -$ 676$ -$ -$ 59$ 8,588841GEAUGA6,206$ 24,127$ 10,108$ -$ 1,126$ -$ -$ 713$ 12,1791,364GREENE16,755$ 98,440$ 53,133$ -$ 15,262$ -$ -$ 1,362$ 28,6833,002GUERNSEY3,313$ 22,667$ 10,938$ -$ 770$ -$ -$ 112$ 10,8461,385HAMILTON50,316$ 322,653$ 98,529$ 14,925$ 24,090$ -$ 2,081$ 5,287$ 177,74113,237HANCOCK5,569$ 17,419$ 8,725$ -$ 1,437$ -$ -$ 323$ 6,9351,063HARDIN2,157$ 9,865$ 5,251$ -$ 651$ -$ -$ 46$ 3,917509HARRISON1,564$ 8,270$ 3,775$ -$ 320$ -$ -$ 13$ 4,163457HENRY2,275$ 6,330$ 3,261$ -$ 313$ -$ -$ 258$ 2,498374HIGHLAND3,564$ 26,315$ 9,159$ -$ 872$ -$ -$ 78$ 16,2061,119HOCKING2,807$ 13,665$ 6,270$ -$ 423$ -$ -$ 86$ 6,886776HOLMES1,524$ 14,254$ 3,127$ -$ 194$ -$ -$ 94$ 10,838409HURON4,824$ 21,517$ 11,168$ -$ 1,178$ -$ -$ 285$ 8,8861,255JACKSON2,871$ 25,950$ 10,807$ -$ 522$ -$ -$ 46$ 14,5761,013JEFFERSON6,627$ 29,235$ 14,185$ -$ 1,466$ -$ -$ 693$ 12,8901,705KNOX4,923$
  • 140.
    18,023$ 8,618$ -$1,525$ -$ -$ 269$ 7,6101,127LAKE18,931$ 85,419$ 35,334$ -$ 5,287$ -$ -$ 1,506$ 43,2925,098LAWRENCE5,192$ 44,478$ 19,028$ -$ 1,077$ -$ -$ 209$ 24,1632,028LICKING15,060$ 60,874$ 28,866$ -$ 4,156$ -$ -$ 675$ 27,1773,937LOGAN4,030$ 15,378$ 7,833$ - $ 1,083$ -$ -$ 385$ 6,077716LORAIN26,902$ 103,884$ 43,446$ -$ 6,099$ -$ -$ 1,720$ 52,6196,511LUCAS29,788$ 112,860$ 49,947$ -$ 8,315$ -$ -$ 2,134$ 52,4656,407MADISON3,909$ 13,739$ 6,896$ -$ 941$ -$ -$ 131$ 5,771636MAHONING19,810$ 93,063$ 41,093$ -$ 5,866$ -$ -$ 2,024$ 44,0805,895MARION5,073$ 21,560$ 10,639$ -$ 1,164$ -$ -$ 146$ 9,6121,291MEDINA13,677$ 48,443$ 23,468$ -$ 3,212$ - $ -$ 1,070$ 20,6942,497MEIGS2,297$ 10,845$ 5,134$ - $ 242$ -$ -$ 119$ 5,350640MERCER2,723$ 11,055$ 5,971$ -$ 508$ -$ -$ 147$ 4,430678MIAMI8,574$ 38,204$ 16,974$ -$ 2,633$ -$ -$ 544$ 18,0531,785MONROE1,589$ 5,320$ 2,787$ -$ 129$ -$ -$ 127$ 2,277418MONTGOMERY45,329$ 307,521$ 117,023$ 376$ 21,327$ -$ 4,798$ 2,789$ 161,20911,844MORGAN1,571$ 7,474$ 4,068$ -$ 257$ - $ -$ 33$ 3,116405MORROW3,078$ 11,683$ 4,976$ -$ 632$ -$ -$ 94$ 5,982855MUSKINGUM6,866$ 31,630$ 16,200$ -$ 1,900$ -$ -$ 208$ 13,3212,200NOBLE1,196$ 3,519$ 1,615$ -$ 136$ -$ -$ 30$ 1,738274OTTAWA3,605$ 15,860$ 8,689$ -$ 808$ - $ -$ 247$ 6,1161,020PAULDING1,746$ 5,228$ 2,318$ -$ 239$ -$ -$ 22$ 2,648323PERRY3,058$ 14,687$ 7,539$ -$ 962$ -$ -$ 58$ 6,129785PICKAWAY5,242$ 31,667$ 12,059$ -$ 1,412$ -$ -$ 116$ 18,0791,314PIKE2,303$ 22,691$ 7,196$ -$ 455$ -$ -$ 81$ 14,959830PORTAGE11,745$ 53,425$ 24,155$ -$ 5,424$ -$ -$ 534$ 23,3113,177PREBLE3,495$ 18,998$ 7,815$ -$ 973$ -$ -$ 89$ 10,121879PUTNAM1,953$
  • 141.
    5,902$ 3,016$ -$411$ -$ -$ 179$ 2,297358RICHLAND10,935$ 50,194$ 21,129$ -$ 2,882$ -$ -$ 610$ 25,5733,882ROSS7,276$ 96,960$ 20,879$ 6,911$ 1,813$ -$ 2,358$ 226$ 64,7732,590SANDUSKY4,827$ 16,095$ 7,762$ -$ 890$ -$ -$ 378$ 7,0641,094SCIOTO6,424$ 46,308$ 21,179$ - $ 1,627$ -$ -$ 745$ 22,7562,156SENECA4,375$ 16,868$ 8,776$ -$ 1,323$ -$ -$ 172$ 6,5981,153SHELBY3,512$ 12,425$ 5,490$ -$ 773$ -$ - $ 134$ 6,027743STARK30,385$ 133,041$ 60,371$ -$ 7,716$ -$ -$ 1,654$ 63,3017,702SUMMIT40,814$ 179,409$ 74,145$ -$ 13,791$ -$ -$ 3,489$ 87,98310,382TRUMBULL20,129$ 86,350$ 38,657$ -$ 3,877$ -$ -$ 1,328$ 42,4875,844TUSCARAWAS7,509$ 36,812$ 18,042$ -$ 1,762$ -$ -$ 559$ 16,4482,511UNION3,835$ 10,320$ 5,002$ -$ 747$ -$ - $ 177$ 4,395623VAN WERT2,173$ 7,609$ 3,672$ -$ 253$ -$ -$ 46$ 3,637513VINTON1,136$ 10,907$ 4,014$ -$ 411$ -$ -$ 39$ 6,443444WARREN16,471$ 56,427$ 23,866$ -$ 5,911$ -$ -$ 1,042$ 25,6082,710WASHINGTON6,047$ 26,126$ 13,461$ -$ 1,329$ -$ -$ 268$ 11,0671,696WAYNE8,126$ 33,825$ 14,862$ -$ 1,648$ -$ -$ 450$ 16,8661,917WILLIAMS3,113$ 12,877$ 6,645$ -$ 873$ - $ -$ 120$ 5,239713WOOD9,121$ 26,976$ 12,917$ -$ 3,353$ -$ -$ 572$ 10,1341,521WYANDOT1,707$ 6,715$ 3,477$ -$ 383$ -$ -$ 43$ 2,812412OHIO (Totals)877,894$ 6,643,911$ 1,837,567$ 34,987$ 296,446$ -$ 2,202,389$ 59,096$ 2,213,426223,944CONG. DIST (01)47,571$ 258,702$ 88,400$ -$ 21,688$ -$ -$ 4,040$ 144,57411,444CONG. DIST (02)54,327$ 366,474$ 119,260$ 21,836$ 17,937$ -$ 4,439$ 4,434$ 198,56815,270CONG. DIST (03)42,969$ 273,785$ 115,702$ 1,893$ 31,878$ -$ 1,086$ 2,052$ 121,17313,143CONG. DIST (04)60,184$ 228,517$ 109,682$ -$ 14,101$ -$ -$ 3,336$ 101,39813,344CONG. DIST (05)52,984$ 176,544$
  • 142.
    87,921$ -$ 13,005$-$ -$ 3,246$ 72,37110,394CONG. DIST (06)62,850$ 334,248$ 157,165$ -$ 13,248$ -$ -$ 3,466$ 160,36819,451CONG. DIST (07)56,922$ 252,455$ 112,723$ -$ 14,307$ -$ -$ 3,003$ 122,42115,166CONG. DIST (08)56,930$ 263,803$ 116,768$ -$ 17,328$ -$ -$ 2,861$ 126,84612,648CONG. DIST (09)52,702$ 253,281$ 104,768$ -$ 14,734$ -$ -$ 3,702$ 130,07713,420CONG. DIST (10)64,176$ 419,507$ 174,959$ 376$ 37,100$ -$ 4,798$ 4,168$ 198,10615,403CONG. DIST (11)44,995$ 2,622,349$ 143,804$ 10,883$ 22,964$ -$ 2,192,066$ 3,406$ 249,22815,011CONG. DIST (12)54,506$ 192,782$ 88,780$ -$ 14,832$ -$ -$ 3,402$ 85,76712,568CONG. DIST (13)60,599$ 287,593$ 126,029$ -$ 19,102$ -$ -$ 4,380$ 138,08217,530CONG. DIST (14)54,590$ 221,475$ 91,502$ -$ 13,026$ -$ -$ 4,897$ 112,05013,548CONG. DIST (15)57,447$ 294,702$ 119,149$ -$ 19,250$ -$ -$ 3,783$ 152,52013,905CONG. DIST (16)54,142$ 197,695$ 80,953$ -$ 11,946$ -$ -$ 4,919$ 99,87511,699OHIO (Totals)877,894$ 6,643,911$ 1,837,567$ 34,987$ 296,446$ -$ 2,202,389$ 59,096$ 2,213,426223,944Notes:* Veteran population estimates, as of September 30, 2013, are produced by the VA Office of the Actuary (VetPop 2011).# Prior to FY 08, "Loan Guaranty" expenditures were included in the Education & Vocational Rehabilitation and Employment (E&VRE) programs. Currently, all "Loan Guaranty" expenditures are attributed to Travis County, TX, where all Loan Guaranty payments are processed. VA will continue to improve data collection for future GDX reports to better distribute loan expenditures at the state, county and congressional district levels.** Unique patients are patients who received treatment at a VA health care facility. Data are provided by the Allocation Resource Center (ARC).Expenditure data sources: USASpending.gov for Compensation & Pension (C&P) and Education and Vocational Rehabilitation and Employment (EVRE) Benefits; Veterans Benefits Administration Insurance Center for the Insurance costs; the VA
  • 143.
    Financial Management System(FMS) for Construction, Medical Research, General Operating Expenses, and certain C&P and Readjustment data; and the Allocation Resource Center (ARC) for Medical Care costs.1. Expenditures are rounded to the nearest thousand dollars. For example, $500 to $1,000 are rounded to $1; $0 to $499 are rounded to $0; and "$ -" = 0 or no expenditures.2. The Compensation & Pension expenditures include dollars for the following programs: veterans' compensation for service-connected disabilities; dependency and indemnity compensation for service-connected deaths; veterans' pension for nonservice-connected disabilities; and burial and other benefits to veterans and their survivors.3. Medical Care expenditures include dollars for medical services, medical administration, facility maintenance, educational support, research support, and other overhead items. Medical Care expenditures do not include dollars for construction or other non-medical support.4. Medical Care expenditures are based on where patients live instead of where care is delivered.5. A star symbol (*) in the Unique Patients column denotes that there were less than 10 Unique Patients. &"Arial,Bold"&11FY13 GEOGRAPHIC DISTRIBUTION OF VA EXPENDITURES (GDX) &8&P of &N OKFY13 Summary of Expenditures by StateExpenditures in $000sCounty/ Congressional DistrictVeteran Population*Total ExpenditureCompensation & PensionConstructionEducation & Vocational Rehabilitation/ EmploymentLoan Guaranty#General Operating ExpensesInsurance & IndemnitiesMedical CareUnique Patients**ADAIR1,416$ 13,387$ 8,928$ -$ 216$ -$ -$ 22$ 4,221505ALFALFA811$ 2,130$ 1,122$ -$ 48$ -$ -$ 12$ 94884ATOKA1,368$ 7,617$ 4,913$ -$ 115$ -$ -$ 8$ 2,581339BEAVER386$ 1,122$ 724$ -$ 20$ -$ -$ 10$ 36876BECKHAM1,663$ 6,687$ 4,301$ -$ 207$ -$ -$ 210$ 1,969302BLAINE954$
  • 144.
    4,377$ 3,023$ -$104$ -$ -$ 18$ 1,232203BRYAN3,857$ 27,297$ 17,376$ -$ 987$ -$ -$ 52$ 8,8811,215CADDO2,409$ 18,976$ 12,842$ -$ 481$ -$ -$ 96$ 5,556628CANADIAN11,409$ 57,744$ 36,828$ -$ 4,163$ -$ -$ 504$ 16,2492,198CARTER4,309$ 29,989$ 19,728$ -$ 649$ -$ -$ 225$ 9,3871,123CHEROKEE4,080$ 37,897$ 21,535$ -$ 1,373$ -$ -$ 214$ 14,7751,518CHOCTAW1,429$ 11,020$ 7,118$ -$ 175$ -$ -$ 45$ 3,682427CIMARRON194$ 746$ 449$ -$ 26$ -$ -$ 1$ 27059CLEVELAND27,077$ 164,881$ 106,888$ -$ 16,666$ -$ -$ 1,941$ 39,3865,039COAL502$ 3,872$ 2,795$ -$ 66$ -$ -$ 18$ 992132COMANCHE18,527$ 213,763$ 162,515$ 464$ 18,198$ -$ 661$ 1,563$ 30,3636,265COTTON637$ 5,256$ 4,328$ -$ 164$ -$ -$ 20$ 744160CRAIG1,262$ 9,858$ 5,698$ -$ 150$ -$ -$ 86$ 3,924473CREEK7,340$ 39,484$ 25,973$ -$ 1,380$ -$ - $ 401$ 11,7311,779CUSTER2,160$ 14,940$ 8,097$ -$ 654$ -$ -$ 70$ 6,119521DELAWARE4,316$ 31,327$ 16,848$ -$ 380$ -$ -$ 131$ 13,9681,672DEWEY334$ 2,180$ 1,369$ -$ 44$ -$ -$ 17$ 75175ELLIS416$ 1,646$ 1,095$ -$ 47$ -$ -$ 3$ 50071GARFIELD5,733$ 26,020$ 17,658$ -$ 1,816$ -$ - $ 270$ 6,2761,047GARVIN2,084$ 23,657$ 17,502$ -$ 374$ -$ -$ 59$ 5,723634GRADY4,651$ 27,464$ 18,307$ -$ 1,088$ -$ -$ 241$ 7,8281,082GRANT438$ 1,694$ 998$ -$ 58$ -$ -$ 1$ 63789GREER619$ 4,087$ 2,831$ -$ 21$ -$ -$ 5$ 1,230143HARMON269$ 1,425$ 1,043$ -$ 65$ -$ -$ 2$ 31564HARPER327$ 1,426$ 953$ -$ 23$ -$ -$ 5$ 44568HASKELL968$ 13,739$ 7,838$ -$ 112$ -$ -$ 232$ 5,557533HUGHES1,297$ 12,185$ 8,005$ -$ 216$ -$ -$ 32$ 3,932423JACKSON3,118$ 24,368$ 18,709$ -$ 1,718$ -$ -$ 581$ 3,360616JEFFERSON707$ 4,492$ 3,271$ -$ 46$ -$ -$ 4$ 1,171181JOHNSTON902$ 9,184$ 5,783$ -$ 212$ -$ -$ 2$ 3,187295KAY4,488$
  • 145.
    23,543$ 13,861$ -$794$ -$ -$ 220$ 8,6681,091KINGFISHER944$ 3,965$ 2,825$ -$ 199$ -$ -$ 58$ 883131KIOWA1,064$ 7,082$ 4,931$ -$ 115$ - $ -$ 30$ 2,006254LATIMER894$ 15,931$ 11,014$ -$ 162$ -$ -$ 46$ 4,709464LE FLORE4,225$ 39,823$ 23,138$ -$ 613$ -$ -$ 176$ 15,8961,974LINCOLN3,337$ 23,004$ 14,432$ -$ 606$ - $ -$ 198$ 7,767883LOGAN4,866$ 18,048$ 10,928$ -$ 740$ -$ -$ 293$ 6,088880LOVE755$ 4,560$ 3,089$ -$ 87$ -$ -$ 81$ 1,303196MCCLAIN2,895$ 30,169$ 22,057$ -$ 1,038$ -$ -$ 104$ 6,969833MCCURTAIN2,639$ 18,852$ 12,404$ -$ 375$ - $ -$ 58$ 6,014751MCINTOSH2,372$ 31,894$ 17,808$ - $ 391$ -$ -$ 114$ 13,5811,200MAJOR607$ 1,966$ 1,250$ -$ 109$ -$ -$ 30$ 57793MARSHALL1,383$ 10,608$ 7,083$ -$ 133$ -$ -$ 53$ 3,340443MAYES3,411$ 31,860$ 17,921$ -$ 915$ -$ -$ 150$ 12,8751,328MURRAY1,263$ 12,983$ 8,078$ -$ 173$ -$ -$ 17$ 4,715451MUSKOGEE6,451$ 212,285$ 51,590$ 211$ 2,560$ -$ 118,433$ 232$ 39,2603,098NOBLE896$ 4,437$ 2,751$ -$ 174$ -$ -$ 25$ 1,487201NOWATA978$ 6,380$ 4,114$ -$ 154$ -$ -$ 34$ 2,078252OKFUSKEE1,018$ 7,086$ 4,692$ -$ 120$ -$ -$ 93$ 2,181225OKLAHOMA59,410$ 462,080$ 267,159$ 4,645$ 33,013$ -$ 2,494$ 4,660$ 150,10914,859OKMULGEE3,568$ 34,244$ 19,465$ -$ 833$ -$ -$ 246$ 13,6991,440OSAGE4,218$ 15,027$ 7,739$ -$ 134$ -$ -$ 179$ 6,9751,041OTTAWA3,309$ 22,477$ 15,303$ -$ 647$ -$ -$ 203$ 6,325942PAWNEE1,520$ 10,412$ 5,838$ -$ 175$ -$ -$ 48$ 4,351395PAYNE4,817$ 29,094$ 16,924$ -$ 3,499$ -$ -$ 324$ 8,3471,067PITTSBURG4,856$ 36,955$ 22,996$ -$ 940$ -$ -$ 137$ 12,8821,473PONTOTOC2,691$ 23,370$ 16,356$ -$ 852$ -$ -$ 185$ 5,978919POTTAWATOMIE7,330$ 49,899$ 33,766$ -$ 1,874$ -$ -$ 409$
  • 146.
    13,8501,669PUSHMATAHA1,162$ 11,712$ 8,216$-$ 136$ -$ -$ 49$ 3,310428ROGER MILLS278$ 1,440$ 940$ -$ 38$ -$ -$ 2$ 46155ROGERS9,255$ 51,430$ 32,002$ -$ 2,025$ -$ -$ 292$ 17,1112,362SEMINOLE2,180$ 17,631$ 11,477$ -$ 289$ -$ -$ 77$ 5,788611SEQUOYAH3,944$ 39,051$ 24,013$ -$ 690$ -$ -$ 93$ 14,2551,607STEPHENS4,059$ 36,131$ 25,109$ -$ 808$ -$ -$ 119$ 10,0951,277TEXAS1,042$ 3,538$ 1,612$ -$ 132$ -$ -$ 77$ 1,717235TILLMAN727$ 4,615$ 2,911$ -$ 219$ -$ -$ 29$ 1,456191TULSA47,965$ 266,228$ 163,028$ -$ 19,762$ -$ -$ 3,174$ 80,26311,586WAGONER7,454$ 50,185$ 29,547$ -$ 1,924$ -$ -$ 175$ 18,5392,015WASHINGTON4,921$ 28,139$ 19,701$ -$ 953$ -$ -$ 255$ 7,2291,186WASHITA1,006$ 4,862$ 3,533$ -$ 137$ -$ -$ 19$ 1,173182WOODS716$ 2,779$ 1,565$ -$ 268$ -$ -$ 63$ 883139WOODWARD1,512$ 6,678$ 3,821$ -$ 162$ -$ - $ 30$ 2,666265OKLAHOMA (Totals)340,395$ 2,568,390$ 1,544,376$ 5,320$ 131,030$ -$ 121,588$ 19,958$ 746,11890,731CONG. DIST (01)62,567$ 353,208$ 217,683$ -$ 22,946$ -$ -$ 3,820$ 108,75915,295CONG. DIST (02)69,215$ 742,561$ 375,256$ 211$ 14,486$ -$ 118,433$ 2,763$ 231,41325,167CONG. DIST (03)67,152$ 353,975$ 223,983$ -$ 17,511$ -$ -$ 3,589$ 108,89214,397CONG. DIST (04)80,651$ 636,390$ 443,015$ 464$ 44,367$ -$ 661$ 5,068$ 142,81520,762CONG. DIST (05)60,809$ 482,255$ 284,438$ 4,645$ 31,719$ -$ 2,494$ 4,719$ 154,24015,110OKLAHOMA (Totals)340,395$ 2,568,390$ 1,544,376$ 5,320$ 131,030$ -$ 121,588$ 19,958$ 746,11890,731Notes:* Veteran population estimates, as of September 30, 2013, are produced by the VA Office of the Actuary (VetPop 2011).# Prior to FY 08, "Loan Guaranty" expenditures were included in the Education & Vocational Rehabilitation and Employment (E&VRE) programs. Currently, all "Loan Guaranty" expenditures are attributed to
  • 147.
    Travis County, TX,where all Loan Guaranty payments are processed. VA will continue to improve data collection for future GDX reports to better distribute loan expenditures at the state, county and congressional district levels.** Unique patients are patients who received treatment at a VA health care facility. Data are provided by the Allocation Resource Center (ARC).Expenditure data sources: USASpending.gov for Compensation & Pension (C&P) and Education and Vocational Rehabilitation and Employment (EVRE) Benefits; Veterans Benefits Administration Insurance Center for the Insurance costs; the VA Financial Management System (FMS) for Construction, Medical Research, General Operating Expenses, and certain C&P and Readjustment data; and the Allocation Resource Center (ARC) for Medical Care costs.1. Expenditures are rounded to the nearest thousand dollars. For example, $500 to $1,000 are rounded to $1; $0 to $499 are rounded to $0; and "$ -" = 0 or no expenditures.2. The Compensation & Pension expenditures include dollars for the following programs: veterans' compensation for service-connected disabilities; dependency and indemnity compensation for service-connected deaths; veterans' pension for nonservice-connected disabilities; and burial and other benefits to veterans and their survivors.3. Medical Care expenditures include dollars for medical services, medical administration, facility maintenance, educational support, research support, and other overhead items. Medical Care expenditures do not include dollars for construction or other non-medical support.4. Medical Care expenditures are based on where patients live instead of where care is delivered.5. A star symbol (*) in the Unique Patients column denotes that there were less than 10 Unique Patients. &"Arial,Bold"&11FY13 GEOGRAPHIC DISTRIBUTION OF VA EXPENDITURES (GDX) &8&P of &N ORFY13 Summary of Expenditures by StateExpenditures in
  • 148.
    $000sCounty/ Congressional DistrictVeteranPopulation*Total ExpenditureCompensation & PensionConstructionEducation & Vocational Rehabilitation/ EmploymentLoan Guaranty#General Operating ExpensesInsurance & IndemnitiesMedical CareUnique Patients**BAKER1,936$ 14,456$ 7,570$ -$ 271$ -$ -$ 91$ 6,525838BENTON5,694$ 26,428$ 14,214$ -$ 4,734$ -$ -$ 732$ 6,7481,137CLACKAMAS34,848$ 167,406$ 80,115$ -$ 11,291$ -$ -$ 2,269$ 73,7327,073CLATSOP4,125$ 24,663$ 12,521$ -$ 977$ -$ -$ 253$ 10,9121,146COLUMBIA5,874$ 35,090$ 16,693$ -$ 1,704$ -$ -$ 307$ 16,3871,578COOS8,018$ 70,624$ 40,187$ -$ 1,661$ -$ -$ 310$ 28,4652,789CROOK2,458$ 15,044$ 7,507$ -$ 467$ -$ - $ 130$ 6,9401,017CURRY2,955$ 25,968$ 16,566$ -$ 281$ -$ -$ 140$ 8,9811,290DESCHUTES14,739$ 85,024$ 44,073$ -$ 7,819$ -$ -$ 1,155$ 31,9784,779DOUGLAS13,004$ 186,546$ 92,649$ 5,553$ 2,306$ -$ 890$ 895$ 84,2536,920GILLIAM244$ 1,276$ 726$ -$ 31$ -$ -$ 12$ 50777GRANT743$ 4,532$ 2,432$ -$ 78$ -$ -$ 159$ 1,863299HARNEY942$ 6,053$ 2,946$ -$ 60$ -$ -$ 28$ 3,018340HOOD RIVER1,665$ 7,223$ 4,366$ -$ 307$ -$ -$ 58$ 2,492320JACKSON20,551$ 221,062$ 88,303$ 23,120$ 6,672$ -$ 3,655$ 1,499$ 97,8138,448JEFFERSON2,077$ 13,834$ 7,911$ -$ 504$ -$ -$ 81$ 5,339644JOSEPHINE9,512$ 78,706$ 45,791$ -$ 2,198$ - $ -$ 958$ 29,7593,634KLAMATH6,908$ 57,780$ 36,963$ -$ 2,747$ -$ -$ 385$ 17,6852,903LAKE916$ 7,024$ 4,246$ -$ 186$ -$ -$ 36$ 2,556336LANE30,208$ 207,410$ 119,947$ -$ 12,122$ -$ -$ 2,252$ 73,0899,803LINCOLN5,136$ 37,517$ 21,261$ -$ 600$ -$ -$ 430$ 15,2251,779LINN11,757$ 77,844$ 44,319$ -$ 4,889$ -$ -$ 796$ 27,8403,129MALHEUR2,404$ 11,945$ 5,805$ -$ 672$ - $ -$ 95$ 5,373642MARION23,914$ 140,293$ 75,082$ -
  • 149.
    $ 8,129$ -$-$ 1,667$ 55,4165,805MORROW1,019$ 5,692$ 2,630$ -$ 135$ -$ -$ 33$ 2,895311MULTNOMAH43,528$ 369,946$ 118,732$ 8,028$ 27,454$ -$ 30,753$ 3,822$ 181,15812,287POLK7,132$ 35,817$ 19,677$ -$ 2,750$ -$ -$ 346$ 13,0451,537SHERMAN282$ 1,404$ 786$ -$ 57$ -$ -$ 12$ 55093TILLAMOOK2,515$ 21,541$ 11,646$ -$ 357$ -$ -$ 142$ 9,396901UMATILLA5,932$ 43,348$ 21,196$ -$ 1,298$ -$ -$ 284$ 20,5702,232UNION2,446$ 19,111$ 9,068$ -$ 1,049$ -$ -$ 148$ 8,8471,037WALLOWA869$ 6,435$ 3,520$ -$ 75$ -$ -$ 19$ 2,821359WASCO3,170$ 16,368$ 7,602$ -$ 483$ -$ -$ 159$ 8,124862WASHINGTON35,265$ 192,802$ 89,410$ -$ 20,577$ -$ -$ 2,658$ 80,1577,901WHEELER239$ 1,022$ 626$ -$ -$ -$ -$ 2$ 39475YAMHILL9,328$ 45,893$ 23,204$ -$ 3,230$ - $ -$ 867$ 18,5931,869OREGON (Totals)322,355$ 2,283,129$ 1,100,287$ 36,702$ 128,169$ -$ 35,298$ 23,228$ 959,44596,190CONG. DIST (01)57,414$ 339,693$ 148,925$ -$ 28,130$ -$ -$ 4,581$ 158,05813,221CONG. DIST (02)75,373$ 584,278$ 284,756$ 23,120$ 24,180$ - $ 3,655$ 5,061$ 243,50627,732CONG. DIST (03)49,581$ 368,408$ 130,823$ 8,028$ 28,447$ -$ 30,753$ 3,821$ 166,53713,292CONG. DIST (04)74,539$ 623,646$ 344,866$ 5,553$ 26,146$ -$ 890$ 5,372$ 240,81826,406CONG. DIST (05)65,448$ 367,103$ 190,917$ -$ 21,266$ -$ -$ 4,393$ 150,52715,539OREGON (Totals)322,355$ 2,283,129$ 1,100,287$ 36,702$ 128,169$ -$ 35,298$ 23,228$ 959,44596,190Notes:* Veteran population estimates, as of September 30, 2013, are produced by the VA Office of the Actuary (VetPop 2011).# Prior to FY 08, "Loan Guaranty" expenditures were included in the Education & Vocational Rehabilitation and Employment (E&VRE) programs. Currently, all "Loan Guaranty" expenditures are attributed to Travis County, TX, where all Loan Guaranty payments are processed. VA will continue to improve data collection for
  • 150.
    future GDX reportsto better distribute loan expenditures at the state, county and congressional district levels.** Unique patients are patients who received treatment at a VA health care facility. Data are provided by the Allocation Resource Center (ARC).Expenditure data sources: USASpending.gov for Compensation & Pension (C&P) and Education and Vocational Rehabilitation and Employment (EVRE) Benefits; Veterans Benefits Administration Insurance Center for the Insurance costs; the VA Financial Management System (FMS) for Construction, Medical Research, General Operating Expenses, and certain C&P and Readjustment data; and the Allocation Resource Center (ARC) for Medical Care costs.1. Expenditures are rounded to the nearest thousand dollars. For example, $500 to $1,000 are rounded to $1; $0 to $499 are rounded to $0; and "$ -" = 0 or no expenditures.2. The Compensation & Pension expenditures include dollars for the following programs: veterans' compensation for service-connected disabilities; dependency and indemnity compensation for service-connected deaths; veterans' pension for nonservice-connected disabilities; and burial and other benefits to veterans and their survivors.3. Medical Care expenditures include dollars for medical services, medical administration, facility maintenance, educational support, research support, and other overhead items. Medical Care expenditures do not include dollars for construction or other non-medical support.4. Medical Care expenditures are based on where patients live instead of where care is delivered.5. A star symbol (*) in the Unique Patients column denotes that there were less than 10 Unique Patients. &"Arial,Bold"&11FY13 GEOGRAPHIC DISTRIBUTION OF VA EXPENDITURES (GDX) &8&P of &N PAFY13 Summary of Expenditures by StateExpenditures in $000sCounty/ Congressional DistrictVeteran Population*Total ExpenditureCompensation & PensionConstructionEducation &
  • 151.
    Vocational Rehabilitation/ EmploymentLoanGuaranty#General Operating ExpensesInsurance & IndemnitiesMedical CareUnique Patients**ADAMS9,349$ 26,646$ 14,081$ -$ 2,773$ -$ -$ 533$ 9,2601,456ALLEGHENY92,864$ 587,774$ 172,956$ 19,512$ 43,525$ -$ 26,922$ 11,110$ 313,74821,167ARMSTRONG6,276$ 33,905$ 13,115$ -$ 1,079$ -$ -$ 542$ 19,1702,066BEAVER17,381$ 69,283$ 30,906$ -$ 5,807$ -$ -$ 1,086$ 31,4845,374BEDFORD4,138$ 23,735$ 10,522$ -$ 689$ -$ -$ 178$ 12,3461,511BERKS28,691$ 109,541$ 50,633$ -$ 8,233$ -$ -$ 2,526$ 48,1506,825BLAIR12,468$ 94,168$ 38,389$ 163$ 4,367$ -$ 955$ 1,012$ 49,2824,895BRADFORD6,082$ 23,916$ 13,123$ -$ 1,137$ -$ -$ 283$ 9,3731,699BUCKS43,267$ 135,519$ 73,989$ 275$ 14,976$ -$ 2,657$ 4,972$ 38,6506,862BUTLER15,223$ 101,087$ 29,852$ 5,608$ 5,449$ -$ 1,158$ 1,215$ 57,8065,382CAMBRIA13,921$ 68,263$ 36,443$ -$ 4,897$ -$ -$ 869$ 26,0544,161CAMERON612$ 1,847$ 1,070$ - $ 124$ -$ -$ 29$ 624150CARBON6,519$ 28,803$ 16,488$ -$ 1,509$ -$ -$ 602$ 10,2041,438CENTRE9,395$ 40,472$ 16,922$ -$ 12,000$ -$ -$ 650$ 10,9002,049CHESTER30,722$ 200,183$ 65,050$ -$ 10,429$ -$ 1,495$ 3,515$ 119,6947,215CLARION3,605$ 15,163$ 6,018$ -$ 853$ - $ 17$ 334$ 7,9411,264CLEARFIELD7,245$ 37,084$ 16,116$ -$ 2,412$ -$ -$ 468$ 18,0882,443CLINTON3,594$ 17,209$ 9,617$ -$ 1,321$ - $ -$ 39$ 6,2331,047COLUMBIA5,640$ 22,234$ 12,875$ -$ 1,442$ -$ -$ 416$ 7,5011,327CRAWFORD8,241$ 42,671$ 18,657$ -$ 2,129$ -$ -$ 617$ 21,2683,026CUMBERLAND21,275$ 91,146$ 52,191$ -$ 13,311$ -$ -$ 2,145$ 23,4983,911DAUPHIN22,403$ 98,552$ 46,269$ -$ 10,009$ -$ -$ 2,163$ 40,1114,659DELAWARE35,178$ 154,866$ 73,952$ -$ 13,549$ -$ -$ 4,933$ 62,4326,931ELK3,002$ 12,642$
  • 152.
    6,573$ -$ 522$-$ -$ 467$ 5,0811,070ERIE21,693$ 150,445$ 54,465$ 5,298$ 9,512$ -$ 680$ 1,270$ 79,2208,495FAYETTE12,200$ 64,703$ 34,590$ -$ 3,179$ -$ -$ 825$ 26,1093,302FOREST664$ 3,455$ 1,881$ -$ 88$ -$ -$ 65$ 1,421249FRANKLIN13,382$ 53,388$ 27,523$ -$ 4,876$ -$ -$ 1,048$ 19,9402,625FULTON1,336$ 5,441$ 2,620$ -$ 252$ -$ - $ 107$ 2,463275GREENE3,733$ 16,131$ 9,314$ -$ 823$ -$ -$ 95$ 5,898751HUNTINGDON4,304$ 19,439$ 8,687$ -$ 1,165$ -$ -$ 211$ 9,3761,097INDIANA6,745$ 33,969$ 17,233$ -$ 4,827$ - $ -$ 516$ 11,3941,663JEFFERSON3,922$ 17,271$ 8,979$ -$ 1,287$ -$ -$ 369$ 6,6361,271JUNIATA1,786$ 5,289$ 2,764$ -$ 307$ -$ - $ 73$ 2,145366LACKAWANNA16,878$ 81,879$ 45,061$ -$ 4,332$ -$ -$ 1,574$ 30,9123,683LANCASTER35,883$ 138,890$ 58,386$ -$ 11,295$ -$ -$ 2,646$ 66,5638,487LAWRENCE7,360$ 37,795$ 16,708$ -$ 2,310$ -$ -$ 322$ 18,4562,565LEBANON11,903$ 121,258$ 31,006$ 17,498$ 4,530$ -$ 5,029$ 862$ 62,3334,711LEHIGH24,170$ 71,240$ 40,408$ -$ 6,702$ -$ -$ 1,743$ 22,3864,144LUZERNE27,229$ 179,672$ 78,285$ 785$ 5,747$ -$ 1,271$ 2,564$ 91,0217,511LYCOMING11,172$ 37,531$ 21,634$ -$ 4,237$ -$ -$ 408$ 11,2522,680MCKEAN4,339$ 19,717$ 10,856$ -$ 677$ -$ -$ 331$ 7,8531,506MERCER10,147$ 43,225$ 19,576$ -$ 3,373$ -$ -$ 708$ 19,5673,470MIFFLIN4,308$ 14,590$ 8,130$ -$ 878$ -$ -$ 88$ 5,4941,138MONROE12,986$ 58,514$ 28,978$ -$ 4,017$ -$ -$ 1,285$ 24,2342,364MONTGOMERY48,746$ 168,824$ 86,731$ -$ 18,393$ -$ -$ 6,441$ 57,2609,207MONTOUR1,475$ 5,862$ 3,691$ -$ 631$ -$ -$ 241$ 1,299285NORTHAMPTON22,740$ 69,271$ 40,447$ -$ 6,254$ -$ -$ 1,618$ 20,9513,660NORTHUMBERLAND8,854$ 28,235$ 16,701$
  • 153.
    -$ 1,852$ -$-$ 418$ 9,2641,843PERRY4,134$ 18,349$ 9,163$ -$ 1,362$ -$ -$ 169$ 7,654814PHILADELPHIA74,238$ 683,830$ 229,935$ 269$ 47,914$ -$ 118,075$ 4,333$ 283,30419,965PIKE5,774$ 28,014$ 13,420$ -$ 1,744$ -$ -$ 350$ 12,5001,291POTTER1,737$ 9,433$ 5,194$ -$ 311$ -$ - $ 35$ 3,893586SCHUYLKILL14,186$ 66,834$ 33,040$ - $ 3,818$ -$ -$ 1,312$ 28,6653,850SNYDER2,683$ 7,977$ 4,121$ -$ 630$ -$ -$ 138$ 3,089485SOMERSET6,623$ 31,741$ 16,545$ -$ 2,038$ - $ -$ 392$ 12,7661,964SULLIVAN810$ 3,362$ 1,170$ - $ 96$ -$ -$ 9$ 2,087210SUSQUEHANNA3,912$ 17,490$ 9,185$ -$ 779$ -$ -$ 163$ 7,363879TIOGA4,322$ 22,357$ 11,036$ -$ 874$ -$ -$ 250$ 10,1971,301UNION3,453$ 8,371$ 5,863$ -$ 944$ -$ -$ 181$ 1,383497VENANGO5,429$ 24,331$ 10,857$ -$ 1,421$ -$ -$ 372$ 11,6812,004WARREN4,262$ 21,481$ 9,841$ -$ 893$ -$ -$ 307$ 10,4401,626WASHINGTON18,216$ 68,757$ 32,334$ -$ 5,077$ -$ -$ 1,432$ 29,9134,002WAYNE4,875$ 21,145$ 11,877$ -$ 1,082$ -$ -$ 362$ 7,8241,031WESTMORELAND34,028$ 133,137$ 61,203$ -$ 10,393$ -$ -$ 3,152$ 58,3898,270WYOMING2,467$ 11,823$ 6,421$ -$ 682$ -$ -$ 175$ 4,546491YORK37,449$ 121,178$ 57,920$ -$ 14,922$ -$ -$ 2,727$ 45,6097,512PENNSYLVANIA (Totals)953,644$ 4,782,351$ 2,029,589$ 49,407$ 359,065$ -$ 158,258$ 82,386$ 2,103,647232,054CONG. DIST (01)32,950$ 221,094$ 96,251$ -$ 19,223$ -$ -$ 1,953$ 103,6678,034CONG. DIST (02)36,022$ 469,050$ 142,340$ 269$ 29,675$ -$ 118,075$ 3,000$ 175,69110,826CONG. DIST (03)58,773$ 353,958$ 131,096$ 10,906$ 20,244$ - $ 1,838$ 4,084$ 185,79021,332CONG. DIST (04)60,840$ 214,281$ 107,806$ -$ 26,404$ -$ -$ 4,562$ 75,50811,795CONG. DIST (05)60,101$ 284,941$ 129,670$ -$ 26,085$ -$ 17$ 4,076$ 125,09319,362CONG. DIST
  • 154.
    (06)48,028$ 232,451$ 81,310$17,498$ 13,786$ -$ 5,029$ 4,821$ 110,00711,495CONG. DIST (07)46,522$ 151,717$ 67,715$ -$ 12,432$ -$ -$ 6,180$ 65,3908,820CONG. DIST (08)48,385$ 147,903$ 80,379$ 275$ 16,331$ -$ 2,657$ 5,354$ 42,9087,707CONG. DIST (09)62,424$ 334,995$ 161,240$ 163$ 22,258$ -$ 955$ 4,530$ 145,85017,379CONG. DIST (10)62,844$ 238,286$ 127,858$ -$ 15,765$ -$ -$ 3,169$ 91,49514,174CONG. DIST (11)62,050$ 285,077$ 143,109$ 785$ 21,102$ -$ 1,271$ 4,948$ 113,86313,876CONG. DIST (12)62,495$ 272,719$ 117,648$ -$ 21,220$ -$ -$ 5,868$ 127,98416,511CONG. DIST (13)39,513$ 161,717$ 75,869$ -$ 15,984$ -$ -$ 4,242$ 65,6228,223CONG. DIST (14)53,430$ 438,886$ 126,476$ 19,512$ 31,414$ -$ 26,922$ 5,729$ 228,83313,824CONG. DIST (15)52,868$ 182,968$ 91,191$ -$ 15,158$ -$ -$ 4,022$ 72,59610,557CONG. DIST (16)46,698$ 274,958$ 106,467$ -$ 18,928$ -$ 1,495$ 3,851$ 144,21611,794CONG. DIST (17)58,561$ 302,506$ 153,116$ -$ 16,536$ -$ -$ 6,115$ 126,73813,364CONG. DIST (18)61,139$ 214,846$ 90,048$ -$ 16,520$ -$ -$ 5,881$ 102,39712,981PENNSYLVANIA (Totals)953,644$ 4,782,351$ 2,029,589$ 49,407$ 359,065$ -$ 158,258$ 82,386$ 2,103,647232,054Notes:* Veteran population estimates, as of September 30, 2013, are produced by the VA Office of the Actuary (VetPop 2011).# Prior to FY 08, "Loan Guaranty" expenditures were included in the Education & Vocational Rehabilitation and Employment (E&VRE) programs. Currently, all "Loan Guaranty" expenditures are attributed to Travis County, TX, where all Loan Guaranty payments are processed. VA will continue to improve data collection for future GDX reports to better distribute loan expenditures at the state, county and congressional district levels.** Unique patients are patients who received treatment at a VA health care facility. Data are provided by the Allocation Resource Center (ARC).Expenditure data sources: USASpending.gov for
  • 155.
    Compensation & Pension(C&P) and Education and Vocational Rehabilitation and Employment (EVRE) Benefits; Veterans Benefits Administration Insurance Center for the Insurance costs; the VA Financial Management System (FMS) for Construction, Medical Research, General Operating Expenses, and certain C&P and Readjustment data; and the Allocation Resource Center (ARC) for Medical Care costs.1. Expenditures are rounded to the nearest thousand dollars. For example, $500 to $1,000 are rounded to $1; $0 to $499 are rounded to $0; and "$ -" = 0 or no expenditures.2. The Compensation & Pension expenditures include dollars for the following programs: veterans' compensation for service-connected disabilities; dependency and indemnity compensation for service-connected deaths; veterans' pension for nonservice-connected disabilities; and burial and other benefits to veterans and their survivors.3. Medical Care expenditures include dollars for medical services, medical administration, facility maintenance, educational support, research support, and other overhead items. Medical Care expenditures do not include dollars for construction or other non-medical support.4. Medical Care expenditures are based on where patients live instead of where care is delivered.5. A star symbol (*) in the Unique Patients column denotes that there were less than 10 Unique Patients. &"Arial,Bold"&11FY13 GEOGRAPHIC DISTRIBUTION OF VA EXPENDITURES (GDX) &8&P of &N RIFY13 Summary of Expenditures by StateExpenditures in $000sCounty/ Congressional DistrictVeteran Population*Total ExpenditureCompensation & PensionConstructionEducation & Vocational Rehabilitation/ EmploymentLoan Guaranty#General Operating ExpensesInsurance & IndemnitiesMedical CareUnique Patients**BRISTOL3,765$ 24,833$ 9,803$ -$ 1,391$ -$ -$ 481$ 13,1591,054KENT13,603$ 84,361$ 39,573$ -$ 7,204$ -$ -$ 978$
  • 156.
    36,6074,010NEWPORT7,599$ 41,403$ 22,005$-$ 5,514$ -$ -$ 1,014$ 12,8701,572PROVIDENCE33,941$ 279,743$ 98,634$ 2,867$ 16,778$ -$ 19,476$ 2,892$ 139,09711,302WASHINGTON10,298$ 43,998$ 23,974$ -$ 4,638$ -$ -$ 564$ 14,8222,194RHODE ISLAND (Totals)69,206$ 474,338$ 193,988$ 2,867$ 35,525$ -$ 19,476$ 5,928$ 216,55520,132CONG. DIST (01)32,908$ 214,503$ 91,248$ -$ 17,016$ -$ -$ 3,201$ 103,0389,713CONG. DIST (02)36,298$ 259,835$ 102,740$ 2,867$ 18,509$ -$ 19,476$ 2,727$ 113,51710,419RHODE ISLAND (Totals)69,206$ 474,338$ 193,988$ 2,867$ 35,525$ -$ 19,476$ 5,928$ 216,55520,132Notes:* Veteran population estimates, as of September 30, 2013, are produced by the VA Office of the Actuary (VetPop 2011).# Prior to FY 08, "Loan Guaranty" expenditures were included in the Education & Vocational Rehabilitation and Employment (E&VRE) programs. Currently, all "Loan Guaranty" expenditures are attributed to Travis County, TX, where all Loan Guaranty payments are processed. VA will continue to improve data collection for future GDX reports to better distribute loan expenditures at the state, county and congressional district levels.** Unique patients are patients who received treatment at a VA health care facility. Data are provided by the Allocation Resource Center (ARC).Expenditure data sources: USASpending.gov for Compensation & Pension (C&P) and Education and Vocational Rehabilitation and Employment (EVRE) Benefits; Veterans Benefits Administration Insurance Center for the Insurance costs; the VA Financial Management System (FMS) for Construction, Medical Research, General Operating Expenses, and certain C&P and Readjustment data; and the Allocation Resource Center (ARC) for Medical Care costs.1. Expenditures are rounded to the nearest thousand dollars. For example, $500 to $1,000 are rounded to $1; $0 to $499 are rounded to $0; and "$ -" = 0 or no expenditures.2. The Compensation & Pension expenditures include dollars for the following programs:
  • 157.
    veterans' compensation forservice-connected disabilities; dependency and indemnity compensation for service-connected deaths; veterans' pension for nonservice-connected disabilities; and burial and other benefits to veterans and their survivors.3. Medical Care expenditures include dollars for medical services, medical administration, facility maintenance, educational support, research support, and other overhead items. Medical Care expenditures do not include dollars for construction or other non-medical support.4. Medical Care expenditures are based on where patients live instead of where care is delivered.5. A star symbol (*) in the Unique Patients column denotes that there were less than 10 Unique Patients. &"Arial,Bold"&11FY13 GEOGRAPHIC DISTRIBUTION OF VA EXPENDITURES (GDX) &8&P of &N SCFY13 Summary of Expenditures by StateExpenditures in $000sCounty/ Congressional DistrictVeteran Population*Total ExpenditureCompensation & PensionConstructionEducation & Vocational Rehabilitation/ EmploymentLoan Guaranty#General Operating ExpensesInsurance & IndemnitiesMedical CareUnique Patients**ABBEVILLE2,217$ 14,383$ 8,252$ - $ 325$ -$ -$ 73$ 5,733730AIKEN15,645$ 96,042$ 44,288$ -$ 5,087$ -$ -$ 842$ 45,8264,858ALLENDALE725$ 4,845$ 2,309$ -$ 161$ -$ -$ 3$ 2,372214ANDERSON16,569$ 79,623$ 48,569$ -$ 3,663$ -$ -$ 739$ 26,6524,392BAMBERG1,587$ 8,518$ 4,687$ -$ 417$ -$ -$ 14$ 3,400406BARNWELL1,793$ 11,528$ 6,123$ -$ 477$ -$ -$ 70$ 4,858531BEAUFORT19,757$ 94,984$ 57,073$ 53$ 10,730$ -$ 1,056$ 1,875$ 24,1974,121BERKELEY24,134$ 148,391$ 75,864$ -$ 16,414$ -$ -$ 1,223$ 54,8906,256CALHOUN1,504$ 7,430$ 3,158$ -$ 254$ -$ -$ 52$ 3,965438CHARLESTON29,660$ 272,889$ 110,033$ 2,044$ 21,471$ -$ 3,045$ 2,823$
  • 158.
    133,47310,490CHEROKEE4,346$ 22,180$ 13,013$-$ 2,005$ -$ -$ 173$ 6,9901,156CHESTER2,421$ 20,207$ 11,269$ -$ 504$ -$ -$ 122$ 8,312915CHESTERFIELD3,232$ 20,754$ 11,877$ -$ 627$ -$ -$ 222$ 8,028979CLARENDON2,650$ 23,934$ 14,321$ -$ 714$ -$ -$ 114$ 8,7861,130COLLETON3,718$ 29,758$ 14,887$ -$ 1,067$ -$ -$ 178$ 13,6261,353DARLINGTON5,730$ 32,727$ 19,602$ -$ 1,472$ -$ -$ 335$ 11,3181,632DILLON2,028$ 13,806$ 7,981$ -$ 793$ -$ -$ 127$ 4,906631DORCHESTER17,851$ 135,809$ 74,818$ -$ 18,462$ -$ -$ 1,409$ 41,1194,707EDGEFIELD1,948$ 16,059$ 8,114$ -$ 861$ -$ -$ 108$ 6,975691FAIRFIELD2,051$ 16,195$ 8,909$ -$ 513$ -$ -$ 142$ 6,630613FLORENCE10,318$ 67,151$ 39,884$ 51$ 3,790$ -$ 675$ 706$ 22,0453,344GEORGETOWN5,930$ 32,873$ 16,385$ -$ 1,307$ -$ -$ 461$ 14,7201,813GREENVILLE34,363$ 154,916$ 95,795$ -$ 14,014$ -$ -$ 2,063$ 43,0447,463GREENWOOD5,102$ 38,217$ 23,818$ -$ 1,563$ -$ -$ 380$ 12,4571,699HAMPTON1,689$ 10,863$ 6,030$ -$ 779$ -$ -$ 159$ 3,896503HORRY28,659$ 175,460$ 104,165$ -$ 8,895$ - $ -$ 2,041$ 60,3599,385JASPER1,759$ 10,523$ 6,198$ -$ 900$ -$ -$ 141$ 3,284555KERSHAW6,277$ 60,728$ 36,705$ -$ 5,408$ -$ -$ 393$ 18,2232,234LANCASTER6,749$ 35,893$ 22,099$ -$ 1,135$ -$ -$ 386$ 12,2721,834LAURENS5,452$ 31,093$ 19,887$ -$ 926$ -$ -$ 419$ 9,8601,447LEE1,600$ 10,615$ 5,818$ -$ 387$ -$ -$ 107$ 4,304463LEXINGTON25,550$ 157,854$ 87,395$ -$ 12,683$ -$ -$ 1,855$ 55,9206,424MCCORMICK1,165$ 9,144$ 4,729$ -$ 233$ -$ -$ 207$ 3,974368MARION2,629$ 18,599$ 10,247$ -$ 982$ -$ - $ 72$ 7,299888MARLBORO1,807$ 12,556$ 7,509$ -$ 535$ -$ -$ 115$ 4,397617NEWBERRY2,909$ 17,944$
  • 159.
    11,119$ -$ 1,035$-$ -$ 111$ 5,679731OCONEE7,195$ 31,834$ 21,243$ -$ 1,476$ -$ -$ 549$ 8,5671,453ORANGEBURG6,453$ 57,823$ 29,533$ -$ 2,451$ -$ -$ 392$ 25,4472,707PICKENS9,017$ 46,162$ 29,342$ -$ 4,157$ -$ -$ 324$ 12,3382,121RICHLAND35,222$ 471,570$ 225,436$ 409$ 47,733$ -$ 58,470$ 3,381$ 136,14114,458SALUDA1,471$ 8,745$ 3,871$ -$ 191$ -$ -$ 66$ 4,617437SPARTANBURG23,039$ 114,565$ 69,071$ -$ 6,815$ -$ -$ 1,102$ 37,5775,451SUMTER12,223$ 116,043$ 70,079$ -$ 12,245$ -$ -$ 829$ 32,8904,158UNION1,945$ 11,699$ 7,201$ -$ 421$ -$ - $ 287$ 3,790609WILLIAMSBURG2,464$ 20,125$ 10,475$ -$ 1,044$ -$ -$ 136$ 8,471922YORK20,414$ 83,267$ 48,602$ -$ 6,227$ -$ -$ 984$ 27,4544,743SOUTH CAROLINA (Totals)420,968$ 2,876,324$ 1,557,784$ 2,557$ 223,348$ -$ 63,246$ 28,310$ 1,001,079123,070CONG. DIST (01)77,469$ 498,483$ 245,821$ 2,097$ 52,380$ -$ 4,101$ 6,441$ 187,64220,064CONG. DIST (02)63,670$ 439,076$ 229,995$ -$ 36,963$ -$ -$ 4,484$ 167,63319,028CONG. DIST (03)54,781$ 300,049$ 183,241$ -$ 15,519$ -$ -$ 3,054$ 98,23614,526CONG. DIST (04)51,912$ 237,920$ 145,385$ -$ 18,290$ -$ -$ 2,966$ 71,27911,459CONG. DIST (05)60,006$ 369,761$ 219,635$ -$ 26,934$ -$ -$ 3,368$ 119,82416,900CONG. DIST (06)53,733$ 666,297$ 321,123$ 460$ 55,342$ -$ 59,145$ 4,041$ 226,18622,174CONG. DIST (07)59,397$ 364,738$ 212,583$ -$ 17,919$ -$ -$ 3,957$ 130,27818,919SOUTH CAROLINA (Totals)420,968$ 2,876,324$ 1,557,784$ 2,557$ 223,348$ -$ 63,246$ 28,310$ 1,001,079123,070Notes:* Veteran population estimates, as of September 30, 2013, are produced by the VA Office of the Actuary (VetPop 2011).# Prior to FY 08, "Loan Guaranty" expenditures were included in the Education & Vocational Rehabilitation and Employment (E&VRE) programs.
  • 160.
    Currently, all "LoanGuaranty" expenditures are attributed to Travis County, TX, where all Loan Guaranty payments are processed. VA will continue to improve data collection for future GDX reports to better distribute loan expenditures at the state, county and congressional district levels.** Unique patients are patients who received treatment at a VA health care facility. Data are provided by the Allocation Resource Center (ARC).Expenditure data sources: USASpending.gov for Compensation & Pension (C&P) and Education and Vocational Rehabilitation and Employment (EVRE) Benefits; Veterans Benefits Administration Insurance Center for the Insurance costs; the VA Financial Management System (FMS) for Construction, Medical Research, General Operating Expenses, and certain C&P and Readjustment data; and the Allocation Resource Center (ARC) for Medical Care costs.1. Expenditures are rounded to the nearest thousand dollars. For example, $500 to $1,000 are rounded to $1; $0 to $499 are rounded to $0; and "$ -" = 0 or no expenditures.2. The Compensation & Pension expenditures include dollars for the following programs: veterans' compensation for service-connected disabilities; dependency and indemnity compensation for service-connected deaths; veterans' pension for nonservice-connected disabilities; and burial and other benefits to veterans and their survivors.3. Medical Care expenditures include dollars for medical services, medical administration, facility maintenance, educational support, research support, and other overhead items. Medical Care expenditures do not include dollars for construction or other non-medical support.4. Medical Care expenditures are based on where patients live instead of where care is delivered.5. A star symbol (*) in the Unique Patients column denotes that there were less than 10 Unique Patients. &"Arial,Bold"&11FY13 GEOGRAPHIC DISTRIBUTION OF VA EXPENDITURES (GDX) &8&P of &N
  • 161.
    SDFY13 Summary ofExpenditures by StateExpenditures in $000sCounty/ Congressional DistrictVeteran Population*Total ExpenditureCompensation & PensionConstructionEducation & Vocational Rehabilitation/ EmploymentLoan Guaranty#General Operating ExpensesInsurance & IndemnitiesMedical CareUnique Patients**AURORA281$ 1,596$ 836$ -$ 73$ -$ -$ 2$ 685100BEADLE1,630$ 6,591$ 2,930$ -$ 111$ -$ -$ 86$ 3,464472BENNETT196$ 1,817$ 595$ - $ -$ -$ -$ 1$ 1,222101BON HOMME760$ 4,686$ 1,298$ -$ 130$ -$ -$ 78$ 3,179275BROOKINGS2,159$ 10,032$ 4,166$ -$ 1,556$ -$ -$ 163$ 4,148647BROWN2,862$ 14,912$ 6,463$ -$ 900$ -$ -$ 105$ 7,4451,307BRULE463$ 1,979$ 848$ -$ 97$ -$ -$ 29$ 1,005135BUFFALO157$ 914$ 494$ -$ 38$ -$ -$ 6$ 37631BUTTE967$ 10,959$ 3,778$ -$ 190$ -$ -$ 20$ 6,971502CAMPBELL127$ 468$ 257$ -$ 6$ -$ -$ 1$ 20560CHARLES MIX816$ 4,770$ 1,715$ -$ 194$ -$ -$ 138$ 2,724268CLARK295$ 1,858$ 939$ -$ 13$ -$ -$ 13$ 893115CLAY1,006$ 5,522$ 2,084$ -$ 1,031$ - $ -$ 71$ 2,336300CODINGTON2,283$ 11,261$ 5,071$ -$ 709$ -$ -$ 62$ 5,418914CORSON326$ 2,628$ 1,107$ -$ 31$ -$ -$ 6$ 1,485142CUSTER991$ 9,814$ 3,262$ -$ 211$ -$ -$ 86$ 6,256525DAVISON1,523$ 7,556$ 3,223$ -$ 671$ -$ -$ 50$ 3,612501DAY618$ 3,249$ 1,608$ -$ 21$ -$ -$ 116$ 1,504273DEUEL478$ 2,162$ 944$ -$ 89$ -$ -$ 68$ 1,061163DEWEY485$ 3,791$ 1,287$ -$ 26$ -$ -$ 9$ 2,468208DOUGLAS346$ 1,199$ 532$ -$ 21$ -$ -$ 18$ 62892EDMUNDS319$ 1,433$ 578$ -$ 71$ -$ -$ 5$ 779165FALL RIVER1,137$ 31,910$ 8,343$ -$ 215$ -$ 546$ 58$ 22,748978FAULK220$ 858$ 334$ -$ 9$ -$ -$ 3$ 51394GRANT768$ 3,763$ 1,898$ -$ 115$ -$ -$ 37$ 1,713266GREGORY438$ 3,067$ 1,187$ -$ 54$ -$ -$ 6$ 1,819185HAAKON155$ 882$ 243$ -$ 26$ - $ -$ -$ 61372HAMLIN458$ 2,304$ 1,036$ -$ 50$ -$ -$ 20$ 1,199190HAND350$ 1,213$ 568$ -$ 16$ -$ -$
  • 162.
    26$ 604139HANSON305$ 1,902$1,024$ -$ 28$ -$ -$ 6$ 844139HARDING92$ 326$ 174$ -$ -$ -$ -$ 1$ 15229HUGHES1,468$ 7,873$ 3,194$ -$ 319$ -$ -$ 168$ 4,194696HUTCHINSON619$ 3,134$ 1,264$ -$ 119$ -$ -$ 40$ 1,712225HYDE147$ 552$ 259$ -$ 26$ -$ -$ -$ 26754JACKSON229$ 1,730$ 576$ -$ 8$ -$ -$ -$ 1,14689JERAULD233$ 809$ 424$ -$ 40$ -$ -$ 2$ 34373JONES110$ 275$ 59$ -$ 1$ -$ -$ -$ 21635KINGSBURY545$ 3,213$ 1,397$ -$ 99$ -$ -$ 34$ 1,683202LAKE867$ 6,509$ 2,602$ -$ 489$ -$ -$ 235$ 3,183377LAWRENCE2,339$ 23,878$ 7,406$ -$ 793$ -$ -$ 178$ 15,5011,300LINCOLN3,531$ 18,583$ 7,173$ -$ 1,692$ -$ -$ 158$ 9,5611,120LYMAN350$ 1,540$ 638$ -$ 41$ -$ -$ 12$ 849112MCCOOK480$ 3,462$ 1,085$ -$ 177$ -$ -$ 100$ 2,100189MCPHERSON274$ 988$ 454$ -$ 18$ -$ -$ 2$ 514124MARSHALL395$ 2,046$ 745$ -$ 17$ -$ -$ 86$ 1,197158MEADE3,577$ 47,567$ 11,553$ 1,605$ 1,745$ -$ 3,088$ 298$ 29,2791,612MELLETTE155$ 803$ 308$ -$ 31$ -$ -$ 1$ 46355MINER275$ 1,059$ 450$ -$ 11$ -$ -$ 229$ 37063MINNEHAHA14,689$ 113,020$ 39,665$ 371$ 5,773$ -$ 6,758$ 1,049$ 59,4044,824MOODY680$ 3,537$ 1,259$ -$ 140$ -$ -$ 18$ 2,121174PENNINGTON12,433$ 112,361$ 47,255$ -$ 10,268$ -$ -$ 1,094$ 53,7445,468PERKINS301$ 1,990$ 638$ -$ 43$ -$ -$ 46$ 1,263150POTTER272$ 1,402$ 575$ -$ 30$ -$ -$ 1$ 796124ROBERTS770$ 6,311$ 2,802$ -$ 132$ -$ -$ 37$ 3,341347SANBORN297$ 1,149$ 457$ -$ 36$ -$ -$ 1$ 65473SHANNON721$ 9,189$ 3,415$ -$ 196$ -$ -$ 9$ 5,568314SPINK702$ 2,936$ 1,261$ -$ 38$ -$ -$ 105$ 1,531265STANLEY226$ 1,267$ 483$ -$ 59$ -$ -$ 5$ 720126SULLY136$ 338$ 107$ -$ 19$ -$ -$ 7$ 20552TODD602$ 3,716$ 1,548$ -$ 84$ -$ -$ 4$ 2,080166TRIPP516$ 3,273$ 1,180$ -$ 39$ -$ -$ 6$ 2,048268TURNER817$ 4,366$ 1,814$ -$ 149$ -$ -$
  • 163.
    15$ 2,387285UNION1,101$ 6,676$2,776$ -$ 389$ -$ -$ 162$ 3,349378WALWORTH535$ 3,304$ 1,156$ -$ 110$ -$ -$ 16$ 2,022284YANKTON2,078$ 9,653$ 4,305$ -$ 535$ -$ -$ 50$ 4,763536ZIEBACH206$ 554$ 243$ -$ -$ -$ -$ 4$ 30738SOUTH DAKOTA (Totals)75,687$ 564,489$ 209,347$ 1,976$ 30,364$ -$ 10,392$ 5,461$ 306,94929,744CONG. DIST (01)75,687$ 564,489$ 209,347$ 1,976$ 30,364$ -$ 10,392$ 5,461$ 306,94929,744SOUTH DAKOTA (Totals)75,687$ 564,489$ 209,347$ 1,976$ 30,364$ -$ 10,392$ 5,461$ 306,94929,744Notes:* Veteran population estimates, as of September 30, 2013, are produced by the VA Office of the Actuary (VetPop 2011).# Prior to FY 08, "Loan Guaranty" expenditures were included in the Education & Vocational Rehabilitation and Employment (E&VRE) programs. Currently, all "Loan Guaranty" expenditures are attributed to Travis County, TX, where all Loan Guaranty payments are processed. VA will continue to improve data collection for future GDX reports to better distribute loan expenditures at the state, county and congressional district levels.** Unique patients are patients who received treatment at a VA health care facility. Data are provided by the Allocation Resource Center (ARC).Expenditure data sources: USASpending.gov for Compensation & Pension (C&P) and Education and Vocational Rehabilitation and Employment (EVRE) Benefits; Veterans Benefits Administration Insurance Center for the Insurance costs; the VA Financial Management System (FMS) for Construction, Medical Research, General Operating Expenses, and certain C&P and Readjustment data; and the Allocation Resource Center (ARC) for Medical Care costs.1. Expenditures are rounded to the nearest thousand dollars. For example, $500 to $1,000 are rounded to $1; $0 to $499 are rounded to $0; and "$ -" = 0 or no expenditures.2. The Compensation & Pension expenditures include dollars for the following programs: veterans' compensation for service-connected disabilities; dependency and indemnity compensation for service-connected
  • 164.
    deaths; veterans' pensionfor nonservice-connected disabilities; and burial and other benefits to veterans and their survivors.3. Medical Care expenditures include dollars for medical services, medical administration, facility maintenance, educational support, research support, and other overhead items. Medical Care expenditures do not include dollars for construction or other non-medical support.4. Medical Care expenditures are based on where patients live instead of where care is delivered.5. A star symbol (*) in the Unique Patients column denotes that there were less than 10 Unique Patients. &"Arial,Bold"&11FY13 GEOGRAPHIC DISTRIBUTION OF VA EXPENDITURES (GDX) &8&P of &N TNFY13 Summary of Expenditures by StateExpenditures in $000sCounty/ Congressional DistrictVeteran Population*Total ExpenditureCompensation & PensionConstructionEducation & Vocational Rehabilitation/ EmploymentLoan Guaranty#General Operating ExpensesInsurance & IndemnitiesMedical CareUnique Patients**ANDERSON7,922$ 29,308$ 18,631$ -$ 1,960$ -$ -$ 346$ 8,3711,484BEDFORD3,254$ 20,317$ 8,833$ -$ 750$ -$ -$ 150$ 10,5841,037BENTON1,859$ 12,089$ 6,464$ -$ 311$ -$ -$ 4$ 5,309480BLEDSOE914$ 4,953$ 2,562$ -$ 78$ - $ -$ 227$ 2,086305BLOUNT12,283$ 49,261$ 32,272$ - $ 3,849$ -$ -$ 1,262$ 11,8782,208BRADLEY8,453$ 34,131$ 20,874$ -$ 2,232$ -$ -$ 437$ 10,5881,607CAMPBELL3,190$ 26,955$ 19,628$ -$ 461$ -$ -$ 268$ 6,598959CANNON1,049$ 7,800$ 3,953$ -$ 298$ -$ -$ 63$ 3,486361CARROLL2,998$ 13,051$ 7,422$ -$ 903$ -$ -$ 143$ 4,583516CARTER5,858$ 59,360$ 23,023$ -$ 965$ -$ -$ 226$ 35,1462,837CHEATHAM3,334$ 19,914$ 9,449$ -$ 1,762$ -$ -$ 263$ 8,439741CHESTER1,241$ 5,417$ 3,087$ -$ 334$ -$ -$ 46$ 1,950264CLAIBORNE2,370$ 18,626$
  • 165.
    12,305$ -$ 992$-$ -$ 226$ 5,103660CLAY685$ 3,863$ 1,732$ -$ 75$ -$ -$ 7$ 2,049193COCKE3,129$ 26,296$ 14,414$ -$ 519$ -$ -$ 80$ 11,2841,160COFFEE5,046$ 32,617$ 16,184$ -$ 1,605$ - $ -$ 466$ 14,3631,576CROCKETT1,039$ 5,690$ 3,271$ -$ 139$ -$ -$ 31$ 2,250235CUMBERLAND6,900$ 30,167$ 17,096$ -$ 685$ -$ -$ 353$ 12,0332,010DAVIDSON39,006$ 318,747$ 107,843$ 576$ 27,265$ -$ 47,809$ 2,708$ 132,5479,600DECATUR1,105$ 6,054$ 3,485$ -$ 163$ -$ -$ 76$ 2,329289DE KALB1,432$ 7,965$ 3,521$ -$ 285$ -$ -$ 69$ 4,090362DICKSON4,579$ 26,126$ 14,012$ -$ 1,768$ -$ -$ 342$ 10,003966DYER2,968$ 14,772$ 9,221$ -$ 578$ -$ -$ 61$ 4,912784FAYETTE4,001$ 13,277$ 5,324$ -$ 513$ -$ -$ 278$ 7,162673FENTRESS1,240$ 10,500$ 6,369$ -$ 163$ -$ -$ 14$ 3,954543FRANKLIN3,792$ 20,421$ 10,237$ -$ 724$ -$ -$ 416$ 9,0451,089GIBSON4,221$ 21,491$ 13,769$ -$ 1,356$ -$ -$ 103$ 6,263886GILES2,445$ 13,814$ 7,605$ -$ 728$ -$ -$ 328$ 5,152593GRAINGER1,880$ 10,286$ 6,441$ -$ 339$ -$ -$ 54$ 3,452509GREENE6,302$ 43,806$ 19,987$ -$ 1,151$ -$ -$ 355$ 22,3142,264GRUNDY994$ 7,074$ 3,533$ -$ 145$ -$ -$ 35$ 3,361330HAMBLEN5,514$ 33,480$ 18,379$ -$ 1,241$ -$ -$ 182$ 13,6771,538HAMILTON27,245$ 119,457$ 69,483$ 990$ 8,772$ -$ 1,980$ 1,895$ 36,3375,663HANCOCK523$ 3,453$ 1,784$ -$ 35$ -$ -$ 15$ 1,619125HARDEMAN2,213$ 12,319$ 5,216$ -$ 356$ -$ -$ 116$ 6,631453HARDIN2,463$ 11,662$ 6,570$ -$ 324$ -$ -$ 32$ 4,735641HAWKINS5,641$ 35,942$ 19,549$ -$ 706$ -$ -$ 616$ 15,0711,904HAYWOOD1,115$ 6,105$ 3,038$ -$ 247$ -$ -$ 20$ 2,800280HENDERSON2,097$ 10,736$ 5,475$ -$ 385$ -$ -$ 524$ 4,352501HENRY3,483$ 20,959$ 12,343$ -$ 950$ -$ -$ 104$ 7,561809HICKMAN2,191$ 11,181$ 5,234$ -$ 377$ -$ -$ 95$
  • 166.
    5,475463HOUSTON939$ 6,013$ 3,398$-$ 233$ -$ -$ 54$ 2,327227HUMPHREYS1,911$ 9,801$ 5,501$ -$ 372$ -$ -$ 115$ 3,813380JACKSON941$ 4,791$ 2,186$ -$ 132$ -$ -$ 33$ 2,440343JEFFERSON5,109$ 26,889$ 16,443$ -$ 1,145$ -$ -$ 145$ 9,1561,302JOHNSON1,712$ 16,215$ 7,864$ -$ 173$ -$ -$ 61$ 8,116729KNOX35,204$ 147,921$ 88,500$ -$ 15,635$ -$ 136$ 2,510$ 41,1396,739LAKE540$ 2,578$ 1,382$ -$ 41$ -$ -$ 2$ 1,153119LAUDERDALE1,939$ 10,870$ 5,912$ -$ 445$ -$ -$ 7$ 4,506488LAWRENCE2,837$ 20,955$ 12,415$ -$ 898$ -$ -$ 71$ 7,571851LEWIS909$ 7,233$ 3,254$ -$ 197$ -$ -$ 6$ 3,777320LINCOLN3,103$ 13,661$ 7,835$ -$ 743$ -$ -$ 203$ 4,881584LOUDON5,486$ 20,547$ 14,056$ -$ 1,358$ -$ -$ 231$ 4,903881MCMINN4,447$ 23,787$ 14,741$ -$ 1,048$ -$ -$ 110$ 7,8881,043MCNAIRY2,523$ 13,535$ 8,036$ -$ 398$ -$ -$ 68$ 5,032605MACON1,495$ 7,578$ 3,793$ -$ 111$ -$ -$ 22$ 3,651365MADISON6,725$ 37,527$ 21,704$ - $ 1,912$ -$ -$ 319$ 13,5921,594MARION2,318$ 9,030$ 4,374$ -$ 209$ -$ -$ 81$ 4,366579MARSHALL2,248$ 14,914$ 7,057$ -$ 489$ -$ -$ 103$ 7,264684MAURY7,173$ 35,247$ 18,902$ -$ 2,678$ -$ -$ 325$ 13,3421,491MEIGS1,198$ 6,359$ 4,335$ -$ 174$ -$ -$ 25$ 1,825258MONROE3,619$ 18,909$ 13,066$ -$ 683$ -$ -$ 160$ 5,000817MONTGOMERY25,992$ 284,733$ 174,816$ -$ 52,954$ -$ -$ 1,372$ 55,5918,012MOORE621$ 2,023$ 958$ -$ 30$ -$ -$ 53$ 982142MORGAN1,795$ 7,631$ 4,984$ -$ 232$ -$ -$ 70$ 2,346462OBION2,708$ 13,105$ 7,465$ -$ 561$ -$ -$ 274$ 4,804726OVERTON1,772$ 10,322$ 5,720$ -$ 455$ -$ - $ 23$ 4,124577PERRY734$ 5,674$ 2,969$ -$ 156$ -$ -$ 3$ 2,546215PICKETT529$ 3,048$ 1,813$ -$ 50$ -$ -$ 2$ 1,182178POLK1,507$ 7,598$ 4,835$ -$ 219$ -$ -$ 81$ 2,463336PUTNAM5,452$ 33,518$ 19,283$ -$
  • 167.
    2,255$ -$ -$464$ 11,5161,805RHEA2,764$ 13,605$ 9,297$ -$ 352$ -$ -$ 52$ 3,904617ROANE5,613$ 25,203$ 16,992$ -$ 1,061$ -$ -$ 335$ 6,8161,135ROBERTSON5,548$ 31,841$ 18,205$ -$ 2,851$ -$ -$ 220$ 10,5651,091RUTHERFORD21,128$ 174,901$ 55,596$ -$ 15,879$ -$ 1,524$ 1,706$ 100,1965,828SCOTT1,546$ 10,365$ 7,258$ -$ 243$ -$ -$ 92$ 2,772460SEQUATCHIE1,182$ 9,481$ 7,038$ -$ 216$ -$ -$ 59$ 2,168304SEVIER7,635$ 46,589$ 27,962$ -$ 1,879$ -$ -$ 303$ 16,4452,233SHELBY59,516$ 446,471$ 177,218$ 2,781$ 34,417$ -$ 3,600$ 4,790$ 223,66617,634SMITH1,550$ 6,182$ 3,218$ -$ 400$ -$ -$ 79$ 2,485300STEWART2,007$ 14,525$ 10,054$ -$ 766$ -$ -$ 156$ 3,549511SULLIVAN15,364$ 114,256$ 59,561$ - $ 3,127$ -$ -$ 1,197$ 50,3715,256SUMNER13,592$ 61,701$ 32,889$ -$ 4,445$ -$ -$ 523$ 23,8442,569TIPTON6,161$ 37,184$ 19,451$ -$ 4,379$ - $ -$ 606$ 12,7471,348TROUSDALE687$ 3,634$ 1,413$ -$ 119$ -$ -$ 43$ 2,059165UNICOI2,063$ 19,385$ 7,970$ -$ 345$ -$ -$ 462$ 10,609861UNION1,357$ 5,614$ 3,261$ -$ 313$ -$ -$ 41$ 1,999343VAN BUREN548$ 2,848$ 1,079$ -$ 91$ -$ -$ 22$ 1,656169WARREN2,616$ 20,564$ 9,573$ -$ 507$ -$ -$ 206$ 10,2771,126WASHINGTON11,927$ 150,739$ 54,542$ 2,096$ 4,507$ -$ 7,966$ 528$ 81,1005,514WAYNE1,391$ 6,942$ 3,501$ -$ 199$ -$ - $ 113$ 3,129321WEAKLEY2,636$ 12,809$ 6,165$ -$ 972$ -$ -$ 461$ 5,210604WHITE2,237$ 13,995$ 7,514$ -$ 484$ -$ -$ 47$ 5,949770WILLIAMSON11,136$ 38,748$ 21,291$ -$ 3,240$ -$ -$ 1,031$ 13,1851,442WILSON9,601$ 51,678$ 24,352$ -$ 3,485$ - $ -$ 545$ 23,2962,231TENNESSEE (Totals)521,267$ 3,320,710$ 1,652,616$ 6,443$ 236,754$ -$ 63,014$ 33,644$ 1,328,239135,582CONG. DIST (01)66,689$ 554,839$ 258,252$ 2,096$ 14,870$ -$ 7,966$ 4,111$
  • 168.
    267,54424,727CONG. DIST (02)61,683$272,350$ 169,846$ -$ 23,164$ -$ 136$ 4,344$ 74,86012,133CONG. DIST (03)60,497$ 279,407$ 175,175$ 990$ 15,493$ -$ 1,980$ 3,479$ 82,29112,999CONG. DIST (04)57,384$ 370,341$ 161,145$ -$ 23,932$ -$ 1,524$ 3,944$ 179,79715,246CONG. DIST (05)45,974$ 361,065$ 129,541$ 576$ 30,467$ -$ 47,809$ 3,264$ 149,40711,109CONG. DIST (06)60,741$ 325,093$ 171,096$ -$ 18,248$ -$ -$ 2,978$ 132,77215,658CONG. DIST (07)68,195$ 501,562$ 293,786$ -$ 63,162$ -$ -$ 4,331$ 140,28317,005CONG. DIST (08)58,490$ 260,206$ 136,494$ -$ 16,873$ -$ -$ 4,585$ 102,25411,811CONG. DIST (09)41,614$ 395,846$ 157,282$ 2,781$ 30,545$ -$ 3,600$ 2,607$ 199,03114,894TENNESSEE (Totals)521,267$ 3,320,710$ 1,652,616$ 6,443$ 236,754$ -$ 63,014$ 33,644$ 1,328,239135,582Notes:* Veteran population estimates, as of September 30, 2013, are produced by the VA Office of the Actuary (VetPop 2011).# Prior to FY 08, "Loan Guaranty" expenditures were included in the Education & Vocational Rehabilitation and Employment (E&VRE) programs. Currently, all "Loan Guaranty" expenditures are attributed to Travis County, TX, where all Loan Guaranty payments are processed. VA will continue to improve data collection for future GDX reports to better distribute loan expenditures at the state, county and congressional district levels.** Unique patients are patients who received treatment at a VA health care facility. Data are provided by the Allocation Resource Center (ARC).Expenditure data sources: USASpending.gov for Compensation & Pension (C&P) and Education and Vocational Rehabilitation and Employment (EVRE) Benefits; Veterans Benefits Administration Insurance Center for the Insurance costs; the VA Financial Management System (FMS) for Construction, Medical Research, General Operating Expenses, and certain C&P and Readjustment data; and the Allocation Resource Center (ARC) for Medical Care costs.1. Expenditures are rounded to the nearest thousand dollars. For example, $500
  • 169.
    to $1,000 arerounded to $1; $0 to $499 are rounded to $0; and "$ -" = 0 or no expenditures.2. The Compensation & Pension expenditures include dollars for the following programs: veterans' compensation for service-connected disabilities; dependency and indemnity compensation for service-connected deaths; veterans' pension for nonservice-connected disabilities; and burial and other benefits to veterans and their survivors.3. Medical Care expenditures include dollars for medical services, medical administration, facility maintenance, educational support, research support, and other overhead items. Medical Care expenditures do not include dollars for construction or other non-medical support.4. Medical Care expenditures are based on where patients live instead of where care is delivered.5. A star symbol (*) in the Unique Patients column denotes that there were less than 10 Unique Patients. &"Arial,Bold"&11FY13 GEOGRAPHIC DISTRIBUTION OF VA EXPENDITURES (GDX) &8&P of &N TXFY13 Summary of Expenditures by StateExpenditures in $000sCounty/ Congressional DistrictVeteran Population*Total ExpenditureCompensation & PensionConstructionEducation & Vocational Rehabilitation/ EmploymentLoan Guaranty#General Operating ExpensesInsurance & IndemnitiesMedical CareUnique Patients**ANDERSON5,048$ 28,121$ 16,286$ -$ 828$ -$ -$ 128$ 10,8791,307ANDREWS787$ 2,581$ 1,418$ -$ 193$ -$ -$ 1$ 969149ANGELINA6,160$ 42,046$ 24,600$ -$ 1,531$ -$ -$ 247$ 15,6682,151ARANSAS3,062$ 14,405$ 9,156$ -$ 407$ -$ -$ 315$ 4,527632ARCHER793$ 2,463$ 1,552$ -$ 69$ -$ -$ 24$ 818181ARMSTRONG207$ 1,274$ 325$ -$ 29$ -$ -$ 7$ 91473ATASCOSA3,484$ 29,214$ 16,654$ -$ 1,130$ -$ -$ 230$ 11,201916AUSTIN2,288$ 8,846$ 5,326$ -$ 637$ -$ -$ 48$ 2,835397BAILEY342$ 1,564$ 803$ -$ 26$ -$ -$ 87$ 64981BANDERA2,665$
  • 170.
    22,852$ 12,622$ -$615$ -$ -$ 103$ 9,512912BASTROP7,737$ 40,418$ 22,562$ -$ 1,995$ -$ -$ 349$ 15,5121,733BAYLOR359$ 1,638$ 1,043$ -$ 55$ -$ -$ 21$ 51984BEE2,521$ 10,906$ 7,073$ -$ 520$ -$ -$ 86$ 3,228451BELL47,939$ 662,146$ 359,571$ 12,114$ 86,129$ -$ 6,135$ 4,073$ 194,12420,405BEXAR154,509$ 1,573,026$ 912,148$ 5,790$ 185,806$ -$ 12,183$ 14,655$ 442,44244,738BLANCO1,434$ 6,057$ 3,280$ -$ 258$ -$ -$ 90$ 2,429277BORDEN67$ 117$ 3$ -$ -$ -$ -$ 1$ 11314BOSQUE1,972$ 13,632$ 6,888$ -$ 411$ -$ - $ 108$ 6,224553BOWIE9,034$ 54,924$ 35,141$ -$ 1,963$ -$ -$ 479$ 17,3402,404BRAZORIA25,633$ 119,722$ 62,232$ -$ 11,663$ -$ -$ 487$ 45,3394,774BRAZOS8,925$ 51,631$ 27,437$ -$ 9,045$ - $ -$ 763$ 14,3852,114BREWSTER740$ 3,976$ 1,885$ - $ 323$ -$ -$ 26$ 1,742184BRISCOE124$ 848$ 366$ -$ 8$ -$ -$ 3$ 47046BROOKS429$ 2,824$ 1,914$ -$ 48$ -$ -$ 1$ 860117BROWN3,123$ 26,376$ 12,395$ - $ 1,161$ -$ -$ 210$ 12,6101,277BURLESON1,348$ 9,300$ 4,874$ -$ 309$ -$ -$ 59$ 4,058476BURNET4,351$ 24,389$ 11,904$ -$ 578$ -$ - $ 573$ 11,3341,058CALDWELL3,145$ 17,632$ 10,669$ -$ 775$ -$ -$ 408$ 5,780702CALHOUN1,687$ 10,178$ 6,578$ -$ 318$ -$ -$ 107$ 3,175409CALLAHAN1,358$ 9,725$ 5,509$ -$ 324$ -$ -$ 194$ 3,698418CAMERON17,285$ 153,142$ 80,830$ -$ 9,163$ -$ 2,676$ 732$ 59,7415,951CAMP1,087$ 6,387$ 4,067$ -$ 216$ -$ -$ 11$ 2,092242CARSON541$ 2,966$ 1,532$ -$ 55$ -$ -$ 3$ 1,376161CASS2,914$ 20,879$ 12,316$ -$ 618$ -$ -$ 306$ 7,639924CASTRO348$ 1,307$ 632$ -$ 40$ -$ -$ 14$ 621115CHAMBERS3,489$ 9,732$ 5,195$ -$ 726$ -$ -$ 60$ 3,751480CHEROKEE3,649$ 18,183$ 10,062$ -$ 462$ -$ -$ 132$ 7,528872CHILDRESS526$ 2,578$ 1,342$ -$ 67$ -$ -$ 3$ 1,166156CLAY1,184$ 4,091$
  • 171.
    2,750$ -$ 46$-$ -$ 85$ 1,211253COCHRAN201$ 727$ 508$ -$ 26$ -$ -$ -$ 19348COKE331$ 1,865$ 993$ -$ 60$ -$ -$ -$ 81299COLEMAN778$ 5,300$ 2,794$ -$ 120$ -$ -$ 76$ 2,310300COLLIN53,007$ 179,054$ 101,002$ -$ 23,470$ -$ -$ 3,313$ 51,2697,031COLLINGSWORTH252$ 992$ 472$ -$ 18$ - $ -$ 31$ 47062COLORADO1,674$ 6,942$ 3,678$ -$ 229$ -$ -$ 223$ 2,812324COMAL15,416$ 106,413$ 70,291$ -$ 8,909$ -$ -$ 1,612$ 25,6003,016COMANCHE1,065$ 8,556$ 4,837$ -$ 139$ - $ -$ 55$ 3,525394CONCHO257$ 1,631$ 762$ -$ 37$ -$ -$ 20$ 81282COOKE3,084$ 12,349$ 6,388$ -$ 362$ -$ -$ 210$ 5,390715CORYELL11,618$ 121,495$ 78,519$ -$ 13,028$ -$ -$ 391$ 29,5563,696COTTLE122$ 1,024$ 493$ -$ 74$ -$ -$ 7$ 45057CRANE282$ 888$ 572$ -$ 59$ -$ -$ 1$ 25743CROCKETT290$ 924$ 399$ -$ 51$ -$ -$ 6$ 46836CROSBY377$ 1,865$ 952$ -$ 77$ -$ -$ 31$ 806109CULBERSON175$ 1,141$ 870$ -$ 28$ -$ -$ -$ 24361DALLAM414$ 2,668$ 1,501$ -$ 49$ -$ -$ -$ 1,117143DALLAS106,374$ 780,140$ 325,092$ 1,208$ 75,093$ -$ 11,697$ 9,093$ 357,95629,479DAWSON720$ 2,998$ 1,883$ -$ 3$ -$ -$ 4$ 1,107187DEAF SMITH703$ 4,352$ 1,698$ -$ 120$ -$ -$ 5$ 2,530284DELTA585$ 3,546$ 1,699$ -$ 157$ -$ -$ 2$ 1,687183DENTON44,004$ 177,572$ 96,903$ -$ 28,528$ -$ -$ 2,060$ 50,0817,422DE WITT1,673$ 7,471$ 4,385$ -$ 120$ -$ -$ 75$ 2,891361DICKENS210$ 1,286$ 810$ -$ 5$ -$ -$ 6$ 46562DIMMIT466$ 2,932$ 1,870$ -$ 107$ -$ -$ 1$ 954148DONLEY362$ 2,160$ 966$ -$ 45$ -$ -$ -$ 1,149127DUVAL724$ 4,143$ 2,637$ -$ 75$ -$ -$ 58$ 1,373174EASTLAND1,495$ 11,007$ 6,315$ -$ 289$ -$ -$ 16$ 4,387486ECTOR7,486$ 36,223$ 19,081$ -$ 1,552$ -$ - $ 621$ 14,9691,932EDWARDS134$ 1,502$ 459$ -$ 18$ -$ -$ 6$ 1,01844ELLIS12,607$ 70,666$ 36,244$ -$
  • 172.
    5,640$ -$ -$329$ 28,4532,701EL PASO46,595$ 525,113$ 299,686$ -$ 74,433$ -$ 2,882$ 3,283$ 144,82920,861ERATH2,173$ 12,455$ 6,969$ -$ 1,546$ - $ -$ 98$ 3,842532FALLS1,272$ 14,935$ 6,705$ -$ 278$ -$ -$ 168$ 7,783579FANNIN3,095$ 45,029$ 14,900$ -$ 740$ -$ 492$ 125$ 28,7731,580FAYETTE1,849$ 12,236$ 6,652$ -$ 323$ -$ -$ 168$ 5,094637FISHER369$ 2,208$ 1,384$ -$ 28$ - $ -$ 12$ 783103FLOYD319$ 1,597$ 896$ -$ 138$ -$ -$ 11$ 552120FOARD102$ 865$ 491$ -$ 30$ -$ -$ 6$ 33738FORT BEND32,580$ 151,325$ 80,226$ -$ 15,242$ -$ -$ 1,574$ 54,2825,826FRANKLIN939$ 4,785$ 2,406$ -$ 136$ -$ -$ 22$ 2,221214FREESTONE1,485$ 10,038$ 5,149$ -$ 276$ -$ -$ 89$ 4,524489FRIO749$ 5,147$ 3,131$ -$ 209$ -$ -$ 11$ 1,796187GAINES537$ 2,364$ 1,354$ -$ 50$ -$ -$ 2$ 957127GALVESTON23,364$ 120,031$ 62,596$ -$ 12,765$ -$ -$ 1,099$ 43,5715,203GARZA322$ 1,006$ 536$ -$ 94$ -$ -$ 25$ 35173GILLESPIE2,753$ 17,091$ 8,564$ -$ 369$ -$ -$ 179$ 7,979740GLASSCOCK86$ 368$ 64$ -$ -$ -$ -$ 2$ 30229GOLIAD624$ 3,177$ 2,017$ -$ 48$ -$ -$ 68$ 1,045138GONZALES1,423$ 6,577$ 3,740$ -$ 335$ -$ - $ 42$ 2,460256GRAY1,784$ 9,329$ 3,843$ -$ 107$ -$ -$ 79$ 5,300573GRAYSON11,318$ 75,070$ 43,904$ -$ 3,061$ -$ -$ 715$ 27,3903,682GREGG9,119$ 50,328$ 29,257$ -$ 3,488$ -$ -$ 420$ 17,1622,298GRIMES2,665$ 11,164$ 5,918$ -$ 356$ -$ -$ 43$ 4,847519GUADALUPE19,768$ 174,722$ 117,113$ -$ 25,183$ -$ -$ 1,894$ 30,5324,226HALE1,685$ 16,184$ 5,513$ -$ 849$ -$ -$ 173$ 9,649528HALL265$ 1,372$ 688$ -$ 23$ -$ -$ -$ 66177HAMILTON746$ 4,865$ 2,791$ -$ 172$ -$ -$ 22$ 1,881208HANSFORD256$ 810$ 324$ -$ 32$ -$ -$ 2$ 45176HARDEMAN298$ 1,737$ 1,120$ -$ 62$ -$ - $ 82$ 47375HARDIN5,385$ 20,681$ 12,219$ -$ 1,262$
  • 173.
    -$ -$ 170$7,0301,196HARRIS186,604$ 1,258,362$ 516,643$ 7,224$ 138,287$ -$ 74,905$ 12,381$ 508,92343,483HARRISON5,020$ 29,039$ 15,288$ -$ 1,186$ -$ -$ 235$ 12,3301,496HARTLEY465$ 924$ 198$ -$ 41$ -$ -$ 6$ 67865HASKELL369$ 2,881$ 1,400$ -$ 40$ -$ -$ 4$ 1,438118HAYS12,746$ 76,050$ 41,306$ -$ 12,446$ -$ -$ 1,105$ 21,1932,531HEMPHILL234$ 438$ 157$ -$ -$ -$ -$ -$ 28146HENDERSON8,769$ 43,048$ 20,531$ -$ 1,114$ -$ -$ 385$ 21,0192,120HIDALGO23,105$ 197,550$ 107,941$ -$ 12,506$ -$ -$ 1,164$ 75,9397,955HILL3,020$ 24,213$ 13,144$ -$ 619$ -$ -$ 150$ 10,3001,080HOCKLEY1,300$ 6,984$ 4,086$ -$ 443$ -$ -$ 21$ 2,434371HOOD5,979$ 28,675$ 16,243$ -$ 1,265$ -$ -$ 250$ 10,9161,460HOPKINS2,700$ 15,455$ 8,299$ -$ 746$ -$ -$ 131$ 6,279776HOUSTON2,235$ 12,661$ 7,845$ -$ 351$ -$ -$ 18$ 4,447590HOWARD2,626$ 32,078$ 12,936$ 56$ 522$ -$ 724$ 166$ 17,6741,418HUDSPETH145$ 1,490$ 648$ -$ 21$ -$ -$ 1$ 82061HUNT8,071$ 48,204$ 22,333$ -$ 3,438$ -$ -$ 384$ 22,0492,202HUTCHINSON1,821$ 12,007$ 4,764$ -$ 353$ -$ -$ 123$ 6,768682IRION163$ 784$ 583$ -$ 48$ -$ -$ 34$ 11932JACK651$ 2,653$ 1,563$ -$ 173$ -$ -$ 41$ 877113JACKSON1,176$ 4,121$ 2,491$ -$ 269$ -$ -$ 132$ 1,229211JASPER2,873$ 15,190$ 8,244$ -$ 460$ - $ -$ 103$ 6,384794JEFF DAVIS197$ 1,217$ 651$ -$ 61$ -$ -$ 10$ 49447JEFFERSON18,852$ 86,327$ 49,598$ -$ 5,354$ -$ -$ 456$ 30,9184,778JIM HOGG272$ 1,757$ 1,282$ -$ 9$ -$ -$ 1$ 46584JIM WELLS2,474$ 14,984$ 10,649$ -$ 560$ -$ -$ 154$ 3,620583JOHNSON13,701$ 64,120$ 35,870$ -$ 5,481$ - $ -$ 437$ 22,3312,710JONES1,487$ 7,571$ 4,415$ -$ 365$ -$ -$ 68$ 2,722396KARNES978$ 6,393$ 3,841$ -$ 152$ -$ -$ 100$ 2,300208KAUFMAN7,246$ 51,238$ 25,757$ -$ 3,309$ -$ -$ 266$
  • 174.
    21,9062,026KENDALL3,662$ 28,737$ 19,056$-$ 2,162$ -$ -$ 356$ 7,163749KENEDY26$ 119$ 60$ -$ 35$ -$ -$ -$ 23*KENT83$ 319$ 194$ -$ -$ -$ -$ 20$ 10513KERR4,665$ 66,518$ 25,251$ -$ 1,083$ -$ 67$ 814$ 39,3032,628KIMBLE400$ 2,179$ 1,304$ -$ 99$ - $ -$ 31$ 746113KING21$ 50$ 39$ -$ -$ -$ -$ 1$ 10*KINNEY439$ 4,821$ 1,938$ -$ 52$ -$ -$ 3$ 2,829143KLEBERG2,104$ 13,515$ 8,865$ -$ 1,224$ -$ -$ 39$ 3,387423KNOX232$ 995$ 462$ -$ -$ -$ -$ 28$ 50474LAMAR4,400$ 27,256$ 14,674$ -$ 956$ -$ -$ 166$ 11,4611,411LAMB814$ 4,006$ 2,304$ -$ 161$ -$ -$ 17$ 1,523253LAMPASAS3,703$ 38,301$ 26,726$ -$ 2,544$ -$ -$ 113$ 8,9181,295LA SALLE289$ 1,377$ 867$ -$ 84$ -$ -$ 7$ 41965LAVACA1,480$ 8,541$ 5,808$ -$ 146$ -$ -$ 40$ 2,547343LEE1,091$ 6,768$ 3,637$ -$ 176$ -$ -$ 40$ 2,915323LEON1,622$ 12,906$ 6,784$ -$ 226$ -$ -$ 55$ 5,842545LIBERTY5,774$ 36,028$ 19,736$ -$ 1,622$ -$ -$ 277$ 14,3931,473LIMESTONE1,615$ 15,631$ 6,535$ -$ 355$ -$ -$ 39$ 8,702629LIPSCOMB194$ 882$ 247$ -$ 33$ -$ -$ 1$ 60081LIVE OAK1,139$ 3,983$ 2,066$ -$ 54$ -$ -$ 18$ 1,845211LLANO2,838$ 15,824$ 9,008$ -$ 264$ -$ -$ 211$ 6,341679LOVING11$ 61$ 15$ -$ -$ -$ -$ -$ 46*LUBBOCK15,912$ 107,214$ 60,089$ -$ 12,126$ -$ -$ 1,305$ 33,6945,381LYNN290$ 1,659$ 762$ -$ 54$ -$ -$ 6$ 83778MCCULLOCH645$ 3,930$ 1,869$ -$ 130$ -$ -$ 4$ 1,927226MCLENNAN16,697$ 270,299$ 102,392$ 12$ 9,736$ -$ 71,923$ 1,259$ 84,9766,870MCMULLEN79$ 221$ 110$ -$ 4$ -$ -$ 20$ 8814MADISON977$ 4,216$ 2,209$ -$ 158$ -$ -$ 31$ 1,818214MARION1,426$ 8,378$ 3,964$ -$ 131$ -$ -$ 225$ 4,057400MARTIN236$ 1,581$ 737$ -$ 43$ -$ -$ 1$ 80083MASON318$ 2,564$ 1,116$ -$ 58$ -$ -$ 66$ 1,32479MATAGORDA2,382$ 15,245$ 8,122$ -$ 501$ -$ -$ 36$ 6,587633MAVERICK1,323$ 8,043$
  • 175.
    5,287$ -$ 473$-$ -$ 86$ 2,196302MEDINA4,899$ 31,625$ 19,547$ -$ 1,676$ -$ -$ 384$ 10,0171,080MENARD274$ 1,366$ 760$ -$ 25$ -$ -$ 4$ 57865MIDLAND8,699$ 38,683$ 19,947$ -$ 1,908$ - $ -$ 604$ 16,2251,946MILAM2,125$ 16,959$ 7,892$ -$ 300$ -$ -$ 149$ 8,618593MILLS418$ 3,153$ 1,620$ - $ 38$ -$ -$ 6$ 1,490139MITCHELL723$ 3,153$ 1,650$ -$ 57$ -$ -$ 44$ 1,401167MONTAGUE1,797$ 9,751$ 6,424$ -$ 232$ -$ -$ 36$ 3,060536MONTGOMERY38,226$ 155,904$ 85,474$ -$ 15,599$ -$ -$ 2,427$ 52,4036,810MOORE882$ 4,021$ 1,624$ -$ 218$ -$ -$ 98$ 2,082301MORRIS1,183$ 9,609$ 5,298$ -$ 208$ -$ -$ 97$ 4,006398MOTLEY125$ 1,108$ 668$ -$ 3$ -$ -$ 1$ 43550NACOGDOCHES4,026$ 23,504$ 14,157$ -$ 1,950$ -$ -$ 197$ 7,2001,036NAVARRO3,454$ 26,008$ 12,512$ -$ 1,006$ -$ -$ 250$ 12,2391,056NEWTON1,152$ 6,811$ 3,623$ -$ 257$ -$ -$ 50$ 2,881446NOLAN1,010$ 7,809$ 3,665$ -$ 230$ -$ -$ 18$ 3,897353NUECES28,208$ 172,085$ 110,450$ -$ 16,396$ -$ -$ 1,355$ 43,8836,178OCHILTREE426$ 1,691$ 629$ -$ 57$ -$ -$ 53$ 95294OLDHAM160$ 1,380$ 613$ -$ 52$ -$ -$ 4$ 71269ORANGE6,524$ 44,448$ 29,802$ -$ 2,131$ -$ -$ 149$ 12,3652,107PALO PINTO2,661$ 12,664$ 8,063$ -$ 466$ -$ -$ 101$ 4,035546PANOLA1,791$ 10,351$ 5,030$ -$ 421$ -$ -$ 114$ 4,785488PARKER11,075$ 51,024$ 30,796$ -$ 3,358$ -$ -$ 607$ 16,2632,366PARMER427$ 1,687$ 889$ -$ 37$ -$ -$ 23$ 738129PECOS1,062$ 2,626$ 1,394$ -$ 150$ -$ -$ 22$ 1,060147POLK3,935$ 38,513$ 20,770$ -$ 510$ -$ -$ 467$ 16,7651,740POTTER7,639$ 81,440$ 25,969$ 859$ 2,306$ -$ 746$ 521$ 51,0393,449PRESIDIO318$ 1,814$ 1,149$ -$ 153$ -$ -$ 1$ 51173RAINS1,146$ 9,608$ 4,132$ -$ 126$ -$ -$ 20$ 5,330375RANDALL9,480$ 66,682$ 27,760$ -$ 3,770$ -$
  • 176.
    -$ 542$ 34,6103,609REAGAN148$925$ 433$ -$ 13$ - $ -$ 2$ 47632REAL338$ 3,658$ 1,150$ -$ 50$ -$ - $ 12$ 2,446155RED RIVER1,234$ 7,317$ 3,783$ -$ 282$ -$ -$ 42$ 3,209331REEVES535$ 2,728$ 1,443$ - $ 54$ -$ -$ 80$ 1,150155REFUGIO628$ 4,590$ 2,586$ -$ 36$ -$ -$ 9$ 1,959171ROBERTS63$ 60$ 37$ -$ -$ -$ -$ 2$ 21*ROBERTSON1,264$ 9,934$ 4,199$ -$ 114$ -$ -$ 107$ 5,514406ROCKWALL5,910$ 31,510$ 16,978$ -$ 3,656$ -$ -$ 304$ 10,5721,057RUNNELS893$ 4,614$ 3,070$ -$ 119$ -$ - $ 3$ 1,423234RUSK4,088$ 18,186$ 10,086$ -$ 465$ - $ -$ 164$ 7,472951SABINE1,213$ 8,741$ 5,461$ -$ 141$ -$ -$ 55$ 3,083446SAN AUGUSTINE858$ 4,752$ 2,535$ -$ 94$ -$ -$ 70$ 2,053261SAN JACINTO3,316$ 12,797$ 5,187$ -$ 337$ -$ -$ 73$ 7,199725SAN PATRICIO6,245$ 37,643$ 26,072$ -$ 2,670$ -$ -$ 172$ 8,7281,198SAN SABA455$ 2,219$ 1,014$ -$ 40$ -$ -$ 37$ 1,128134SCHLEICHER150$ 908$ 537$ -$ 21$ -$ -$ 53$ 29630SCURRY909$ 4,884$ 2,566$ -$ 138$ -$ -$ 52$ 2,128242SHACKELFORD187$ 1,533$ 850$ -$ 26$ -$ -$ 100$ 55848SHELBY1,518$ 9,060$ 4,711$ -$ 204$ -$ -$ 46$ 4,099456SHERMAN147$ 548$ 152$ -$ 14$ -$ -$ 17$ 36439SMITH16,355$ 81,245$ 50,323$ -$ 5,354$ -$ -$ 652$ 24,9163,770SOMERVELL541$ 2,277$ 1,314$ -$ 179$ -$ -$ 14$ 769126STARR803$ 8,281$ 5,572$ -$ 328$ -$ -$ 24$ 2,357329STEPHENS967$ 3,098$ 1,569$ -$ 35$ -$ -$ 37$ 1,458166STERLING78$ 459$ 169$ -$ -$ -$ -$ 3$ 28823STONEWALL116$ 461$ 206$ -$ 5$ -$ -$ 4$ 24633SUTTON244$ 750$ 514$ -$ 15$ -$ -$ 2$ 22050SWISHER526$ 3,950$ 1,564$ -$ 49$ -$ -$ 28$ 2,309181TARRANT118,214$ 629,050$ 339,594$ -$ 85,064$ -$ 274$ 7,872$ 196,24726,434TAYLOR11,863$ 98,610$ 60,550$ -$ 12,238$ -$ -$ 961$ 24,8613,345TERRELL103$ 761$ 521$ -$ 34$ -$ -$ -$ 20527TERRY730$ 2,826$ 1,797$ -$ 77$ -$ -$ 37$
  • 177.
    915150THROCKMORTON186$ 591$ 454$-$ 29$ -$ -$ 10$ 9825TITUS1,859$ 9,006$ 4,989$ -$ 420$ -$ -$ 47$ 3,549375TOM GREEN9,836$ 67,272$ 40,764$ -$ 6,689$ -$ -$ 1,055$ 18,7632,515TRAVIS52,364$ 1,759,581$ 168,368$ 2,763$ 50,887$ 1,385,063$ 35,922$ 6,004$ 110,57413,356TRINITY1,760$ 11,812$ 6,288$ -$ 310$ -$ -$ 114$ 5,100538TYLER2,138$ 11,321$ 6,271$ -$ 212$ -$ -$ 39$ 4,799617UPSHUR3,076$ 18,347$ 9,766$ -$ 616$ -$ -$ 126$ 7,8391,009UPTON252$ 1,082$ 637$ -$ 21$ -$ -$ 25$ 39969UVALDE1,567$ 9,753$ 5,462$ -$ 482$ -$ -$ 52$ 3,758411VAL VERDE3,299$ 22,786$ 14,450$ -$ 1,759$ -$ -$ 396$ 6,181759VAN ZANDT5,024$ 27,312$ 13,092$ -$ 799$ - $ -$ 166$ 13,2561,276VICTORIA6,489$ 36,346$ 21,323$ -$ 1,411$ -$ -$ 513$ 13,0981,470WALKER4,717$ 20,868$ 10,687$ -$ 3,202$ -$ -$ 188$ 6,791825WALLER2,586$ 8,708$ 3,294$ -$ 647$ -$ -$ 110$ 4,657500WARD787$ 3,616$ 2,185$ - $ 38$ -$ -$ 25$ 1,368185WASHINGTON2,480$ 11,591$ 7,256$ -$ 404$ -$ -$ 217$ 3,714597WEBB6,406$ 50,712$ 32,723$ -$ 3,131$ -$ -$ 206$ 14,6522,332WHARTON2,567$ 13,347$ 6,171$ -$ 349$ -$ -$ 111$ 6,716575WHEELER386$ 2,443$ 1,225$ -$ 43$ -$ -$ 8$ 1,167127WICHITA12,838$ 85,761$ 63,583$ -$ 7,940$ -$ -$ 861$ 13,3782,845WILBARGER964$ 4,827$ 3,433$ -$ 173$ -$ -$ 91$ 1,130189WILLACY840$ 8,964$ 4,685$ -$ 304$ -$ -$ 34$ 3,941320WILLIAMSON36,489$ 187,499$ 107,988$ -$ 25,073$ -$ -$ 2,285$ 52,1527,417WILSON4,892$ 37,817$ 23,459$ -$ 2,746$ - $ -$ 327$ 11,2851,228WINKLER522$ 1,822$ 970$ -$ 17$ -$ -$ 15$ 81990WISE5,262$ 24,637$ 14,191$ -$ 950$ -$ -$ 368$ 9,1281,273WOOD5,678$ 26,357$ 14,947$ -$ 603$ -$ -$ 159$ 10,6471,273YOAKUM350$ 1,397$ 882$ -$ 47$ -$ -$ 10$ 45877YOUNG1,524$ 4,965$ 3,132$ -$ 223$ -$ -$ 97$
  • 178.
    1,514302ZAPATA568$ 3,503$ 1,971$-$ 21$ -$ -$ 3$ 1,509157ZAVALA276$ 2,381$ 1,304$ -$ 94$ -$ -$ 2$ 981100TEXAS (Totals)1,667,740$ 12,943,393$ 6,091,910$ 30,026$ 1,118,114$ 1,385,063$ 220,626$ 110,750$ 3,986,903434,255CONG. DIST (01)53,293$ 290,690$ 168,866$ -$ 15,191$ -$ -$ 2,300$ 104,33314,096CONG. DIST (02)38,925$ 173,854$ 76,471$ -$ 20,451$ -$ -$ 3,018$ 73,9157,124CONG. DIST (03)46,256$ 146,516$ 82,393$ -$ 19,146$ -$ -$ 3,087$ 41,8905,848CONG. DIST (04)62,690$ 407,354$ 215,735$ -$ 19,584$ -$ 492$ 3,353$ 168,19117,899CONG. DIST (05)47,956$ 281,763$ 136,900$ -$ 16,378$ -$ -$ 2,412$ 126,07312,463CONG. DIST (06)49,664$ 282,205$ 148,908$ -$ 31,732$ -$ -$ 3,019$ 98,54511,769CONG. DIST (07)31,290$ 115,672$ 50,219$ -$ 13,440$ -$ -$ 3,303$ 48,7095,207CONG. DIST (08)58,556$ 247,429$ 131,918$ - $ 21,961$ -$ -$ 3,077$ 90,47411,164CONG. DIST (09)27,701$ 286,006$ 127,944$ -$ 31,839$ -$ -$ 1,444$ 124,7798,709CONG. DIST (10)43,248$ 1,624,526$ 100,833$ 2,763$ 20,588$ 1,385,063$ 35,922$ 3,932$ 75,4269,285CONG. DIST (11)54,054$ 306,498$ 169,947$ - $ 16,141$ -$ -$ 3,710$ 116,70014,265CONG. DIST (12)57,273$ 276,347$ 152,471$ -$ 32,879$ -$ 274$ 3,723$ 86,99912,429CONG. DIST (13)53,845$ 352,694$ 178,208$ 859$ 17,381$ -$ 746$ 3,231$ 152,26816,627CONG. DIST (14)56,366$ 276,016$ 148,460$ -$ 24,917$ -$ -$ 1,742$ 100,89612,614CONG. DIST (15)33,881$ 295,817$ 179,577$ -$ 28,643$ -$ -$ 2,479$ 85,1199,478CONG. DIST (16)44,336$ 496,114$ 282,974$ -$ 70,282$ -$ 2,882$ 3,180$ 136,79619,780CONG. DIST (17)43,433$ 446,278$ 189,695$ 12$ 26,251$ -$ 71,923$ 3,176$ 155,22214,448CONG. DIST (18)29,722$ 393,288$ 138,874$ 7,224$ 37,172$ -$ 74,905$ 1,665$ 133,45010,278CONG. DIST (19)44,912$ 315,874$ 173,334$ 56$ 28,023$ -$ 724$ 3,289$ 110,44914,034CONG. DIST (20)58,201$ 680,519$ 386,289$
  • 179.
    5,790$ 78,688$ -$12,183$ 3,920$ 193,64917,107CONG. DIST (21)67,445$ 489,979$ 271,535$ -$ 45,743$ -$ 67$ 7,543$ 165,09016,831CONG. DIST (22)42,771$ 170,665$ 87,293$ -$ 17,461$ -$ -$ 1,842$ 64,0707,028CONG. DIST (23)46,903$ 351,118$ 206,443$ -$ 34,752$ -$ -$ 4,041$ 105,88212,490CONG. DIST (24)39,330$ 139,473$ 69,014$ -$ 17,521$ -$ -$ 3,028$ 49,9096,584CONG. DIST (25)64,887$ 451,043$ 260,859$ -$ 46,060$ -$ -$ 4,244$ 139,88017,176CONG. DIST (26)47,710$ 182,907$ 99,528$ -$ 28,531$ -$ -$ 2,232$ 52,6168,135CONG. DIST (27)57,965$ 331,592$ 205,801$ -$ 22,910$ -$ -$ 3,154$ 99,72712,759CONG. DIST (28)41,267$ 354,210$ 211,276$ -$ 32,699$ -$ -$ 3,689$ 106,54613,106CONG. DIST (29)21,947$ 160,342$ 71,549$ -$ 19,151$ -$ -$ 739$ 68,9025,673CONG. DIST (30)33,682$ 414,166$ 170,020$ 1,208$ 39,273$ -$ 11,697$ 1,855$ 190,11313,352CONG. DIST (31)79,197$ 794,686$ 436,078$ 12,114$ 103,658$ -$ 6,135$ 6,251$ 230,44925,128CONG. DIST (32)35,883$ 156,854$ 68,298$ -$ 15,787$ -$ -$ 3,643$ 69,1276,934CONG. DIST (33)21,974$ 208,717$ 104,674$ -$ 25,573$ -$ -$ 1,672$ 76,7977,145CONG. DIST (34)33,599$ 255,597$ 144,317$ -$ 14,790$ -$ 2,676$ 1,330$ 92,4849,843CONG. DIST (35)45,337$ 504,718$ 295,513$ - $ 64,605$ -$ -$ 3,920$ 140,68014,422CONG. DIST (36)52,241$ 281,865$ 149,698$ -$ 18,912$ -$ -$ 2,508$ 110,74813,025TEXAS (Totals)1,667,740$ 12,943,393$ 6,091,910$ 30,026$ 1,118,114$ 1,385,063$ 220,626$ 110,750$ 3,986,903434,255Notes:* Veteran population estimates, as of September 30, 2013, are produced by the VA Office of the Actuary (VetPop 2011).# Prior to FY 08, "Loan Guaranty" expenditures were included in the Education & Vocational Rehabilitation and Employment (E&VRE) programs. Currently, all "Loan Guaranty" expenditures are attributed to Travis County, TX, where all Loan Guaranty payments are processed. VA will continue to improve data collection for
  • 180.
    future GDX reportsto better distribute loan expenditures at the state, county and congressional district levels.** Unique patients are patients who received treatment at a VA health care facility. Data are provided by the Allocation Resource Center (ARC).Expenditure data sources: USASpending.gov for Compensation & Pension (C&P) and Education and Vocational Rehabilitation and Employment (EVRE) Benefits; Veterans Benefits Administration Insurance Center for the Insurance costs; the VA Financial Management System (FMS) for Construction, Medical Research, General Operating Expenses, and certain C&P and Readjustment data; and the Allocation Resource Center (ARC) for Medical Care costs.1. Expenditures are rounded to the nearest thousand dollars. For example, $500 to $1,000 are rounded to $1; $0 to $499 are rounded to $0; and "$ -" = 0 or no expenditures.2. The Compensation & Pension expenditures include dollars for the following programs: veterans' compensation for service-connected disabilities; dependency and indemnity compensation for service-connected deaths; veterans' pension for nonservice-connected disabilities; and burial and other benefits to veterans and their survivors.3. Medical Care expenditures include dollars for medical services, medical administration, facility maintenance, educational support, research support, and other overhead items. Medical Care expenditures do not include dollars for construction or other non-medical support.4. Medical Care expenditures are based on where patients live instead of where care is delivered.5. A star symbol (*) in the Unique Patients column denotes that there were less than 10 Unique Patients. &"Arial,Bold"&11FY13 GEOGRAPHIC DISTRIBUTION OF VA EXPENDITURES (GDX) &8&P of &N UTFY13 Summary of Expenditures by StateExpenditures in $000sCounty/ Congressional DistrictVeteran Population*Total ExpenditureCompensation & PensionConstructionEducation &
  • 181.
    Vocational Rehabilitation/ EmploymentLoanGuaranty#General Operating ExpensesInsurance & IndemnitiesMedical CareUnique Patients**BEAVER477$ 1,568$ 709$ -$ 118$ -$ -$ 2$ 74085BOX ELDER2,724$ 12,337$ 5,353$ -$ 852$ -$ -$ 235$ 5,897588CACHE4,606$ 17,628$ 8,879$ -$ 3,322$ -$ -$ 489$ 4,939702CARBON1,744$ 9,869$ 4,625$ -$ 265$ -$ -$ 158$ 4,821402DAGGETT120$ 698$ 222$ -$ 9$ -$ -$ 2$ 46541DAVIS20,978$ 113,709$ 58,039$ -$ 16,618$ -$ - $ 1,435$ 37,6173,939DUCHESNE971$ 6,275$ 2,636$ -$ 165$ -$ -$ 56$ 3,417402EMERY738$ 2,676$ 1,042$ - $ 52$ -$ -$ 39$ 1,543154GARFIELD448$ 1,462$ 781$ -$ 24$ -$ -$ 30$ 62795GRAND692$ 4,444$ 1,616$ - $ 3$ -$ -$ 19$ 2,806260IRON2,720$ 14,089$ 6,204$ -$ 1,864$ -$ -$ 165$ 5,856570JUAB640$ 3,790$ 1,562$ -$ 99$ -$ -$ 19$ 2,110156KANE671$ 3,206$ 1,804$ -$ 65$ -$ -$ 100$ 1,237158MILLARD828$ 3,322$ 1,421$ -$ 105$ -$ -$ 40$ 1,756142MORGAN612$ 2,885$ 1,779$ -$ 233$ -$ -$ 22$ 851127PIUTE138$ 618$ 355$ -$ 8$ -$ -$ 1$ 25436RICH122$ 601$ 307$ -$ 16$ -$ -$ 14$ 26434SALT LAKE50,134$ 410,113$ 116,685$ 6,163$ 33,010$ -$ 53,145$ 3,864$ 197,24713,869SAN JUAN603$ 2,829$ 1,194$ -$ 73$ -$ -$ 14$ 1,548151SANPETE1,695$ 8,463$ 3,549$ -$ 398$ -$ -$ 60$ 4,455385SEVIER1,491$ 6,593$ 3,509$ -$ 331$ -$ -$ 44$ 2,709307SUMMIT1,962$ 7,200$ 3,043$ -$ 487$ -$ -$ 254$ 3,417351TOOELE4,660$ 24,585$ 10,794$ -$ 1,711$ -$ -$ 150$ 11,932971UINTAH2,074$ 7,155$ 2,971$ -$ 172$ -$ -$ 17$ 3,995501UTAH18,951$ 77,156$ 35,826$ -$ 11,495$ -$ -$ 1,242$ 28,5933,393WASATCH1,025$ 4,059$ 1,716$ -$ 266$ -$ -$ 88$ 1,989207WASHINGTON11,037$ 48,313$ 26,494$ -$ 3,650$ -$ -$ 564$ 17,6052,461WAYNE221$ 579$ 349$ -$ 10$ -$ -$ 7$ 21336WEBER17,691$ 91,295$ 47,462$ -$ 10,552$ -$ -$ 906$ 32,3743,539UTAH
  • 182.
    (Totals)150,771$ 887,516$ 350,923$6,163$ 85,974$ -$ 53,145$ 10,033$ 381,27934,062CONG. DIST (01)46,274$ 220,874$ 110,802$ -$ 26,733$ -$ -$ 2,956$ 80,3829,023CONG. DIST (02)41,773$ 335,631$ 116,008$ 6,163$ 25,574$ -$ 51,303$ 2,675$ 133,90710,370CONG. DIST (03)30,783$ 131,040$ 53,788$ -$ 14,121$ -$ 1,841$ 2,286$ 59,0045,992CONG. DIST (04)31,941$ 199,971$ 70,325$ -$ 19,545$ -$ -$ 2,115$ 107,9868,677UTAH (Totals)150,771$ 887,516$ 350,923$ 6,163$ 85,974$ -$ 53,145$ 10,033$ 381,27934,062Notes:* Veteran population estimates, as of September 30, 2013, are produced by the VA Office of the Actuary (VetPop 2011).# Prior to FY 08, "Loan Guaranty" expenditures were included in the Education & Vocational Rehabilitation and Employment (E&VRE) programs. Currently, all "Loan Guaranty" expenditures are attributed to Travis County, TX, where all Loan Guaranty payments are processed. VA will continue to improve data collection for future GDX reports to better distribute loan expenditures at the state, county and congressional district levels.** Unique patients are patients who received treatment at a VA health care facility. Data are provided by the Allocation Resource Center (ARC).Expenditure data sources: USASpending.gov for Compensation & Pension (C&P) and Education and Vocational Rehabilitation and Employment (EVRE) Benefits; Veterans Benefits Administration Insurance Center for the Insurance costs; the VA Financial Management System (FMS) for Construction, Medical Research, General Operating Expenses, and certain C&P and Readjustment data; and the Allocation Resource Center (ARC) for Medical Care costs.1. Expenditures are rounded to the nearest thousand dollars. For example, $500 to $1,000 are rounded to $1; $0 to $499 are rounded to $0; and "$ -" = 0 or no expenditures.2. The Compensation & Pension expenditures include dollars for the following programs: veterans' compensation for service-connected disabilities; dependency and indemnity compensation for service-connected
  • 183.
    deaths; veterans' pensionfor nonservice-connected disabilities; and burial and other benefits to veterans and their survivors.3. Medical Care expenditures include dollars for medical services, medical administration, facility maintenance, educational support, research support, and other overhead items. Medical Care expenditures do not include dollars for construction or other non-medical support.4. Medical Care expenditures are based on where patients live instead of where care is delivered.5. A star symbol (*) in the Unique Patients column denotes that there were less than 10 Unique Patients. &"Arial,Bold"&11FY13 GEOGRAPHIC DISTRIBUTION OF VA EXPENDITURES (GDX) &8&P of &N VAFY13 Summary of Expenditures by StateExpenditures in $000sCounty/ Congressional DistrictVeteran Population*Total ExpenditureCompensation & PensionConstructionEducation & Vocational Rehabilitation/ EmploymentLoan Guaranty#General Operating ExpensesInsurance & IndemnitiesMedical CareUnique Patients**ACCOMACK3,980$ 12,855$ 7,737$ -$ 854$ -$ -$ 172$ 4,093620ALBEMARLE7,618$ 21,699$ 12,033$ -$ 3,267$ -$ -$ 776$ 5,623960ALLEGHANY1,838$ 7,408$ 1,979$ -$ 140$ -$ -$ 84$ 5,205527AMELIA1,223$ 8,146$ 3,141$ -$ 241$ -$ -$ 25$ 4,739328AMHERST2,929$ 14,087$ 6,521$ -$ 882$ -$ -$ 113$ 6,572756APPOMATTOX1,237$ 7,137$ 3,341$ -$ 230$ -$ -$ 153$ 3,413375ARLINGTON14,552$ 65,634$ 31,496$ -$ 22,495$ -$ -$ 1,798$ 9,8451,173AUGUSTA7,722$ 24,042$ 9,767$ -$ 930$ -$ -$ 595$ 12,7511,571BATH492$ 2,118$ 1,141$ -$ 35$ -$ -$ 62$ 881113BEDFORD7,695$ 40,676$ 15,919$ -$ 1,812$ -$ -$ 701$ 22,2432,004BLAND795$ 4,239$ 2,352$ -$ 69$ -$ -$ 18$ 1,800215BOTETOURT3,537$ 21,058$ 7,420$ -$ 440$ -$ -$ 216$
  • 184.
    12,983971BRUNSWICK1,756$ 9,141$ 4,280$-$ 320$ -$ -$ 40$ 4,500425BUCHANAN1,256$ 10,399$ 7,419$ -$ 210$ -$ -$ 28$ 2,743367BUCKINGHAM1,389$ 5,839$ 2,610$ -$ 48$ -$ -$ 24$ 3,157275CAMPBELL4,954$ 20,836$ 7,909$ -$ 667$ -$ -$ 366$ 11,8931,347CAROLINE3,629$ 18,753$ 8,540$ -$ 1,637$ -$ -$ 208$ 8,368707CARROLL2,470$ 14,587$ 5,549$ - $ 428$ -$ -$ 132$ 8,477994CHARLES CITY761$ 4,163$ 1,338$ -$ 170$ -$ -$ 9$ 2,646203CHARLOTTE1,026$ 7,109$ 3,807$ -$ 306$ -$ -$ 18$ 2,978333CHESTERFIELD32,414$ 174,332$ 81,310$ -$ 19,293$ -$ -$ 2,923$ 70,8066,524CLARKE1,577$ 6,608$ 2,734$ -$ 648$ -$ - $ 146$ 3,080282CRAIG476$ 4,091$ 1,827$ -$ 98$ -$ -$ 29$ 2,137173CULPEPER4,518$ 16,129$ 8,414$ -$ 1,466$ -$ 1,393$ 181$ 4,675540CUMBERLAND711$ 3,641$ 1,290$ -$ 85$ -$ -$ 22$ 2,244229DICKENSON988$ 10,110$ 5,433$ -$ 260$ -$ -$ 51$ 4,366403DINWIDDIE3,116$ 15,406$ 5,436$ -$ 696$ -$ -$ 172$ 9,103750ESSEX1,036$ 5,232$ 2,556$ -$ 286$ -$ -$ 150$ 2,241232FAIRFAX84,306$ 367,401$ 211,536$ -$ 107,085$ -$ -$ 9,756$ 39,0245,987FAUQUIER8,129$ 20,039$ 10,514$ -$ 3,305$ -$ -$ 591$ 5,629593FLOYD1,064$ 7,329$ 2,828$ -$ 114$ -$ -$ 71$ 4,316417FLUVANNA3,163$ 8,473$ 4,571$ -$ 1,013$ -$ -$ 142$ 2,746428FRANKLIN5,101$ 35,612$ 14,034$ -$ 911$ -$ -$ 83$ 20,5841,623FREDERICK8,464$ 35,622$ 15,506$ -$ 2,642$ -$ -$ 682$ 16,7921,701GILES1,372$ 9,779$ 4,477$ -$ 248$ -$ -$ 159$ 4,895405GLOUCESTER5,490$ 25,625$ 15,609$ -$ 3,945$ -$ -$ 731$ 5,339677GOOCHLAND1,925$ 7,458$ 3,032$ -$ 465$ -$ -$ 139$ 3,822345GRAYSON1,366$ 7,091$ 2,894$ -$ 87$ -$ -$ 90$ 4,019560GREENE1,938$ 6,608$ 3,242$ -$ 929$ -$ -$ 68$ 2,370289GREENSVILLE1,353$ 7,789$ 2,949$ -$ 263$ -
  • 185.
    $ -$ 109$4,468242HALIFAX3,016$ 19,642$ 10,584$ - $ 414$ -$ -$ 127$ 8,518926HANOVER9,958$ 30,966$ 14,360$ -$ 2,759$ -$ -$ 440$ 13,4071,230HENRICO23,002$ 112,458$ 45,166$ -$ 10,211$ -$ -$ 1,550$ 55,5314,912HENRY4,833$ 27,018$ 8,403$ -$ 756$ -$ -$ 355$ 17,5041,774HIGHLAND319$ 1,115$ 613$ -$ 37$ -$ -$ 4$ 46167ISLE OF WIGHT4,836$ 23,120$ 13,918$ -$ 4,610$ -$ -$ 307$ 4,284649JAMES CITY10,028$ 55,215$ 36,233$ -$ 10,871$ -$ -$ 823$ 7,2881,115KING AND QUEEN758$ 3,104$ 1,305$ -$ 123$ -$ -$ 141$ 1,535138KING GEORGE4,158$ 15,030$ 8,660$ -$ 2,935$ -$ -$ 132$ 3,303446KING WILLIAM1,482$ 6,205$ 3,018$ -$ 450$ -$ -$ 59$ 2,679263LANCASTER1,848$ 6,141$ 3,181$ -$ 176$ -$ -$ 226$ 2,559255LEE2,035$ 15,508$ 8,393$ -$ 297$ - $ -$ 63$ 6,755634LOUDOUN25,105$ 72,450$ 40,662$ -$ 19,595$ -$ -$ 1,999$ 10,1931,507LOUISA3,772$ 13,733$ 6,429$ -$ 792$ -$ -$ 501$ 6,011543LUNENBURG1,556$ 8,327$ 3,071$ -$ 199$ -$ -$ 51$ 5,006358MADISON1,263$ 3,598$ 2,133$ -$ 210$ -$ -$ 56$ 1,199180MATHEWS1,281$ 4,775$ 3,120$ -$ 299$ -$ -$ 53$ 1,303165MECKLENBURG3,168$ 20,710$ 9,390$ -$ 842$ -$ -$ 476$ 10,002860MIDDLESEX1,500$ 6,919$ 3,482$ -$ 414$ -$ -$ 165$ 2,858257MONTGOMERY5,959$ 29,088$ 11,729$ -$ 3,737$ -$ -$ 158$ 13,4641,177NELSON1,524$ 6,674$ 4,113$ -$ 387$ -$ - $ 143$ 2,031273NEW KENT1,717$ 10,710$ 6,128$ -$ 983$ -$ -$ 115$ 3,485370NORTHAMPTON1,221$ 4,492$ 2,657$ -$ 249$ -$ -$ 61$ 1,525199NORTHUMBERLAND1,914$ 5,027$ 2,373$ -$ 187$ -$ -$ 311$ 2,156266NOTTOWAY1,644$ 9,932$ 4,640$ -$ 610$ -$ -$ 42$ 4,641449ORANGE4,199$ 16,247$ 10,005$ -$ 2,119$ -$ -$ 204$ 3,917595PAGE2,167$ 9,940$ 4,356$ -$ 469$ -$ -$
  • 186.
    125$ 4,990565PATRICK1,462$ 10,405$4,249$ -$ 252$ -$ -$ 198$ 5,706608PITTSYLVANIA5,555$ 28,121$ 10,814$ -$ 1,072$ -$ -$ 113$ 16,1231,909POWHATAN3,264$ 10,490$ 5,008$ -$ 788$ -$ -$ 150$ 4,543421PRINCE EDWARD1,501$ 10,390$ 4,960$ -$ 867$ -$ -$ 90$ 4,473464PRINCE GEORGE5,473$ 33,879$ 16,851$ -$ 5,960$ -$ -$ 234$ 10,8341,208PRINCE WILLIAM46,988$ 249,030$ 140,407$ 1,930$ 75,121$ -$ 2,227$ 2,203$ 27,1424,411PULASKI3,433$ 16,377$ 7,231$ -$ 512$ -$ -$ 123$ 8,511927RAPPAHANNOCK780$ 1,641$ 821$ -$ 115$ -$ -$ 15$ 69092RICHMOND1,077$ 4,918$ 2,082$ -$ 150$ -$ -$ 37$ 2,649155ROANOKE8,961$ 57,152$ 22,696$ -$ 2,346$ -$ -$ 775$ 31,3352,541ROCKBRIDGE1,935$ 11,000$ 3,319$ -$ 258$ -$ -$ 138$ 7,285568ROCKINGHAM5,676$ 19,348$ 8,739$ -$ 1,008$ -$ -$ 275$ 9,3251,423RUSSELL2,174$ 9,169$ 5,594$ -$ 236$ -$ - $ 26$ 3,312475SCOTT2,016$ 12,842$ 6,747$ -$ 242$ -$ -$ 65$ 5,788599SHENANDOAH4,265$ 19,814$ 9,087$ -$ 986$ -$ -$ 635$ 9,1061,104SMYTH2,759$ 17,587$ 9,062$ -$ 270$ -$ -$ 66$ 8,189890SOUTHAMPTON2,247$ 6,865$ 3,454$ -$ 627$ -$ -$ 97$ 2,687337SPOTSYLVANIA16,492$ 76,772$ 42,718$ -$ 15,164$ -$ -$ 706$ 18,1852,593STAFFORD22,414$ 123,646$ 73,043$ -$ 36,700$ -$ -$ 552$ 13,3512,553SURRY735$ 3,410$ 2,050$ -$ 189$ -$ -$ 16$ 1,155157SUSSEX1,215$ 5,716$ 2,963$ -$ 441$ -$ -$ 61$ 2,252258TAZEWELL3,475$ 30,347$ 18,103$ -$ 699$ -$ -$ 180$ 11,3661,302WARREN4,142$ 16,490$ 7,018$ -$ 1,236$ -$ -$ 223$ 8,014802WASHINGTON4,543$ 27,553$ 15,023$ -$ 779$ -$ -$ 141$ 11,6101,503WESTMORELAND2,004$ 8,149$ 3,740$ -$ 472$ -$ -$ 499$ 3,438349WISE2,875$ 21,101$ 13,353$ -$ 560$ -$ -$ 42$ 7,146955WYTHE2,700$ 15,914$
  • 187.
    8,135$ -$ 377$-$ -$ 84$ 7,319839YORK9,790$ 53,964$ 31,808$ -$ 14,221$ -$ -$ 1,276$ 6,6591,198ALEXANDRIA (CITY)11,862$ 58,141$ 28,399$ 93$ 17,576$ -$ -$ 1,300$ 10,7731,202BRISTOL (CITY)1,439$ 9,834$ 4,932$ -$ 275$ -$ -$ 112$ 4,514591BUENA VISTA (CITY)580$ 3,233$ 1,509$ -$ 125$ -$ -$ 5$ 1,594165CHARLOTTESVILLE (CITY)2,357$ 10,760$ 3,923$ -$ 4,543$ -$ -$ 231$ 2,062269CHESAPEAKE (CITY)34,445$ 211,019$ 116,481$ -$ 59,329$ -$ -$ 2,732$ 32,4774,475COLONIAL HEIGHTS (CITY)1,943$ 22,159$ 13,927$ -$ 2,581$ -$ -$ 231$ 5,420509COVINGTON (CITY)689$ 6,611$ 4,348$ -$ 170$ -$ -$ 76$ 2,016209DANVILLE (CITY)3,939$ 29,425$ 15,242$ 11$ 1,672$ -$ 97$ 180$ 12,2221,427EMPORIA (CITY)401$ 3,348$ 1,588$ -$ 142$ -$ -$ 51$ 1,567137FAIRFAX (CITY)2,248$ 13,163$ 7,494$ -$ 4,626$ -$ -$ 261$ 782121FALLS CHURCH (CITY)1,052$ 3,521$ 1,929$ -$ 992$ -$ -$ 134$ 46678FRANKLIN (CITY)1,033$ 5,998$ 3,754$ -$ 722$ -$ -$ 26$ 1,496158FREDERICKSBURG (CITY)2,155$ 13,463$ 6,771$ -$ 3,334$ -$ -$ 107$ 3,251512GALAX (CITY)493$ 6,257$ 3,973$ -$ 274$ -$ -$ 19$ 1,991205HAMPTON (CITY)33,589$ 223,563$ 96,877$ 5,211$ 36,714$ -$ 4,276$ 1,213$ 79,2715,881HARRISONBURG (CITY)2,129$ 10,708$ 5,855$ -$ 1,644$ -$ -$ 248$ 2,961398HOPEWELL (CITY)3,200$ 25,088$ 14,005$ -$ 2,919$ -$ -$ 267$ 7,897834LEXINGTON (CITY)546$ 4,779$ 3,566$ -$ 565$ -$ -$ 54$ 59479LYNCHBURG (CITY)5,527$ 36,014$ 16,581$ -$ 7,100$ -$ -$ 489$ 11,8451,511MANASSAS (CITY)3,001$ 12,658$ 6,591$ -$ 3,347$ -$ -$ 200$ 2,521230MANASSAS PARK (CITY)1,199$ 1,286$ 88$ -$ 16$ -$ -$ 15$ 1,167101MARTINSVILLE (CITY)1,246$ 11,328$ 6,455$ -$ 873$ -$ -$ 59$ 3,941408NEWPORT NEWS (CITY)26,138$ 187,702$ 96,306$ -$ 45,719$ -$ -$ 1,459$ 44,2185,178NORFOLK (CITY)35,204$ 195,267$
  • 188.
    90,006$ -$ 61,939$-$ -$ 2,103$ 41,2195,157NORTON (CITY)289$ 2,081$ 1,549$ -$ 100$ -$ -$ 2$ 43096PETERSBURG (CITY)3,810$ 50,579$ 28,883$ -$ 5,021$ -$ -$ 350$ 16,3241,310POQUOSON (CITY)1,309$ 7,852$ 4,924$ -$ 1,188$ -$ -$ 120$ 1,619158PORTSMOUTH (CITY)13,872$ 82,031$ 41,596$ - $ 18,667$ -$ -$ 311$ 21,4582,385RADFORD (CITY)886$ 6,062$ 3,406$ -$ 820$ -$ -$ 45$ 1,791198RICHMOND (CITY)13,282$ 135,577$ 35,659$ 6,159$ 11,112$ -$ 7,850$ 988$ 73,8094,657ROANOKE (CITY)8,749$ 139,197$ 29,557$ 1,058$ 3,468$ -$ 42,378$ 672$ 62,0643,485SALEM (CITY)2,760$ 44,802$ 10,630$ 8,299$ 1,399$ -$ 2,908$ 169$ 21,399848STAUNTON (CITY)2,100$ 12,385$ 7,456$ -$ 799$ -$ -$ 183$ 3,947602SUFFOLK (CITY)13,291$ 78,158$ 43,994$ -$ 21,292$ -$ -$ 699$ 12,1731,878VIRGINIA BEACH (CITY)65,201$ 433,416$ 230,804$ -$ 146,261$ -$ -$ 5,633$ 50,7188,581WAYNESBORO (CITY)1,966$ 10,403$ 6,132$ -$ 603$ -$ -$ 125$ 3,544433WILLIAMSBURG (CITY)930$ 1,841$ 535$ -$ 112$ -$ -$ 270$ 923132WINCHESTER (CITY)1,963$ 9,301$ 3,784$ -$ 791$ -$ -$ 106$ 4,620529VIRGINIA (Totals)840,398$ 4,653,545$ 2,291,200$ 22,761$ 874,229$ -$ 61,129$ 60,779$ 1,343,447142,605CONG. DIST (01)99,112$ 477,248$ 271,443$ 1,930$ 107,066$ -$ 2,227$ 6,830$ 87,75212,200CONG. DIST (02)113,418$ 644,819$ 333,490$ 196,915$ -$ 8,432$ 105,98215,466CONG. DIST (03)90,048$ 744,379$ 325,009$ 11,369$ 135,378$ -$ 12,126$ 3,922$ 256,57521,105CONG. DIST (04)95,698$ 566,008$ 297,830$ 111,126$ -$ 6,842$ 150,21016,498CONG. DIST (05)65,972$ 318,338$ 144,190$ 11$ 22,163$ -$ 97$ 4,187$ 147,68915,359CONG. DIST (06)64,410$ 412,458$ 149,842$ 1,058$ 22,819$ -$ 42,378$ 5,068$ 191,29417,063CONG. DIST (07)70,285$ 276,393$ 132,350$ 32,206$ -$ 1,393$ 4,821$
  • 189.
    105,62310,598CONG. DIST (08)56,115$306,485$ 165,937$ 93$ 93,768$ -$ 6,681$ 40,0055,286CONG. DIST (09)58,695$ 398,422$ 189,486$ 8,299$ 14,664$ -$ 2,908$ 2,711$ 180,35318,526CONG. DIST (10)62,432$ 207,596$ 108,833$ 47,471$ -$ 5,355$ 45,9385,478CONG. DIST (11)64,214$ 301,400$ 172,790$ 90,654$ -$ 5,931$ 32,0265,026VIRGINIA (Totals)840,398$ 4,653,545$ 2,291,200$ 22,761$ 874,229$ -$ 61,129$ 60,779$ 1,343,447142,605Notes:* Veteran population estimates, as of September 30, 2013, are produced by the VA Office of the Actuary (VetPop 2011).# Prior to FY 08, "Loan Guaranty" expenditures were included in the Education & Vocational Rehabilitation and Employment (E&VRE) programs. Currently, all "Loan Guaranty" expenditures are attributed to Travis County, TX, where all Loan Guaranty payments are processed. VA will continue to improve data collection for future GDX reports to better distribute loan expenditures at the state, county and congressional district levels.** Unique patients are patients who received treatment at a VA health care facility. Data are provided by the Allocation Resource Center (ARC).Expenditure data sources: USASpending.gov for Compensation & Pension (C&P) and Education and Vocational Rehabilitation and Employment (EVRE) Benefits; Veterans Benefits Administration Insurance Center for the Insurance costs; the VA Financial Management System (FMS) for Construction, Medical Research, General Operating Expenses, and certain C&P and Readjustment data; and the Allocation Resource Center (ARC) for Medical Care costs.1. Expenditures are rounded to the nearest thousand dollars. For example, $500 to $1,000 are rounded to $1; $0 to $499 are rounded to $0; and "$ -" = 0 or no expenditures.2. The Compensation & Pension expenditures include dollars for the following programs: veterans' compensation for service-connected disabilities; dependency and indemnity compensation for service-connected deaths; veterans' pension for nonservice-connected disabilities; and burial and other benefits to veterans and their survivors.3.
  • 190.
    Medical Care expendituresinclude dollars for medical services, medical administration, facility maintenance, educational support, research support, and other overhead items. Medical Care expenditures do not include dollars for construction or other non-medical support.4. Medical Care expenditures are based on where patients live instead of where care is delivered.5. A star symbol (*) in the Unique Patients column denotes that there were less than 10 Unique Patients. &"Arial,Bold"&11FY13 GEOGRAPHIC DISTRIBUTION OF VA EXPENDITURES (GDX) &8&P of &N VTFY13 Summary of Expenditures by StateExpenditures in $000sCounty/ Congressional DistrictVeteran Population*Total ExpenditureCompensation & PensionConstructionEducation & Vocational Rehabilitation/ EmploymentLoan Guaranty#General Operating ExpensesInsurance & IndemnitiesMedical CareUnique Patients**ADDISON2,415$ 9,773$ 5,072$ -$ 712$ -$ -$ 91$ 3,899660BENNINGTON3,543$ 18,331$ 7,759$ -$ 387$ -$ -$ 292$ 9,8931,222CALEDONIA2,653$ 16,172$ 6,937$ -$ 905$ - $ -$ 334$ 7,996905CHITTENDEN9,703$ 41,289$ 20,232$ -$ 7,062$ -$ -$ 658$ 13,3362,314ESSEX730$ 5,436$ 2,949$ -$ 167$ -$ -$ 1$ 2,319313FRANKLIN3,947$ 16,464$ 8,361$ -$ 1,441$ -$ -$ 192$ 6,4701,120GRAND ISLE669$ 2,526$ 1,563$ -$ 236$ -$ -$ 48$ 678171LAMOILLE1,924$ 7,765$ 3,899$ -$ 786$ -$ -$ 124$ 2,955453ORANGE2,432$ 16,346$ 6,523$ -$ 829$ -$ -$ 83$ 8,912903ORLEANS2,367$ 14,704$ 7,410$ -$ 655$ -$ - $ 87$ 6,551906RUTLAND5,418$ 28,319$ 12,908$ -$ 1,955$ -$ -$ 370$ 13,0871,652WASHINGTON4,855$ 23,652$ 10,767$ -$ 3,222$ -$ -$ 387$ 9,2761,134WINDHAM3,425$ 20,429$ 8,373$ -$ 725$ -$ -$ 397$ 10,9351,124WINDSOR4,731$ 52,762$ 15,531$
  • 191.
    1,105$ 1,215$ -$3,992$ 276$ 30,6432,048VERMONT (Totals)48,812$ 273,966$ 118,286$ 1,105$ 20,296$ -$ 3,992$ 3,340$ 126,94914,925CONG. DIST (01)48,812$ 273,966$ 118,286$ 1,105$ 20,296$ -$ 3,992$ 3,340$ 126,94914,925VERMONT (Totals)48,812$ 273,966$ 118,286$ 1,105$ 20,296$ -$ 3,992$ 3,340$ 126,94914,925Notes:* Veteran population estimates, as of September 30, 2013, are produced by the VA Office of the Actuary (VetPop 2011).# Prior to FY 08, "Loan Guaranty" expenditures were included in the Education & Vocational Rehabilitation and Employment (E&VRE) programs. Currently, all "Loan Guaranty" expenditures are attributed to Travis County, TX, where all Loan Guaranty payments are processed. VA will continue to improve data collection for future GDX reports to better distribute loan expenditures at the state, county and congressional district levels.** Unique patients are patients who received treatment at a VA health care facility. Data are provided by the Allocation Resource Center (ARC).Expenditure data sources: USASpending.gov for Compensation & Pension (C&P) and Education and Vocational Rehabilitation and Employment (EVRE) Benefits; Veterans Benefits Administration Insurance Center for the Insurance costs; the VA Financial Management System (FMS) for Construction, Medical Research, General Operating Expenses, and certain C&P and Readjustment data; and the Allocation Resource Center (ARC) for Medical Care costs.1. Expenditures are rounded to the nearest thousand dollars. For example, $500 to $1,000 are rounded to $1; $0 to $499 are rounded to $0; and "$ -" = 0 or no expenditures.2. The Compensation & Pension expenditures include dollars for the following programs: veterans' compensation for service-connected disabilities; dependency and indemnity compensation for service-connected deaths; veterans' pension for nonservice-connected disabilities; and burial and other benefits to veterans and their survivors.3. Medical Care expenditures include dollars for medical services, medical administration, facility maintenance, educational
  • 192.
    support, research support,and other overhead items. Medical Care expenditures do not include dollars for construction or other non-medical support.4. Medical Care expenditures are based on where patients live instead of where care is delivered.5. A star symbol (*) in the Unique Patients column denotes that there were less than 10 Unique Patients. &"Arial,Bold"&11FY13 GEOGRAPHIC DISTRIBUTION OF VA EXPENDITURES (GDX) &8&P of &N WAFY13 Summary of Expenditures by StateExpenditures in $000sCounty/ Congressional DistrictVeteran Population*Total ExpenditureCompensation & PensionConstructionEducation & Vocational Rehabilitation/ EmploymentLoan Guaranty#General Operating ExpensesInsurance & IndemnitiesMedical CareUnique Patients**ADAMS901$ 3,300$ 2,026$ -$ 240$ -$ -$ 40$ 994145ASOTIN2,316$ 11,248$ 6,648$ -$ 526$ -$ -$ 33$ 4,042670BENTON15,114$ 60,283$ 32,716$ -$ 5,584$ -$ -$ 933$ 21,0513,172CHELAN5,817$ 22,409$ 13,652$ -$ 1,287$ - $ -$ 364$ 7,1041,180CLALLAM9,532$ 46,442$ 28,518$ -$ 1,809$ -$ -$ 920$ 15,1951,755CLARK38,765$ 218,079$ 96,844$ -$ 18,384$ -$ -$ 1,826$ 101,0249,523COLUMBIA437$ 2,637$ 1,186$ -$ 78$ -$ -$ 2$ 1,370179COWLITZ11,011$ 56,056$ 30,358$ -$ 2,498$ -$ -$ 508$ 22,6922,493DOUGLAS3,270$ 9,589$ 6,368$ -$ 472$ -$ -$ 82$ 2,666567FERRY977$ 5,540$ 3,268$ -$ 68$ -$ -$ 3$ 2,201302FRANKLIN4,054$ 18,157$ 9,604$ -$ 1,756$ -$ -$ 302$ 6,494911GARFIELD236$ 1,077$ 615$ -$ -$ -$ -$ 4$ 45967GRANT5,923$ 24,591$ 15,104$ -$ 1,306$ -$ -$ 234$ 7,9471,180GRAYS HARBOR7,825$ 37,172$ 23,326$ -$ 1,429$ -$ -$ 173$ 12,2441,559ISLAND13,846$ 82,262$ 55,025$ -$ 12,601$ -$ -$ 991$ 13,6451,824JEFFERSON3,684$ 18,023$ 11,557$ -$ 669$
  • 193.
    -$ -$ 291$5,505692KING118,429$ 666,274$ 247,420$ 35,080$ 62,927$ -$ 66,626$ 11,591$ 242,63019,276KITSAP38,633$ 209,090$ 137,044$ -$ 27,545$ -$ -$ 1,899$ 42,6025,125KITTITAS2,987$ 14,030$ 7,274$ -$ 2,347$ -$ -$ 181$ 4,228527KLICKITAT2,433$ 12,455$ 6,084$ -$ 419$ -$ -$ 152$ 5,799590LEWIS8,625$ 50,222$ 26,284$ -$ 1,897$ -$ -$ 343$ 21,6982,216LINCOLN1,337$ 7,040$ 4,257$ -$ 290$ -$ -$ 48$ 2,445335MASON8,442$ 42,087$ 27,064$ -$ 2,137$ -$ -$ 582$ 12,3051,499OKANOGAN3,906$ 22,391$ 14,778$ -$ 435$ -$ -$ 209$ 6,9701,016PACIFIC2,801$ 14,547$ 7,907$ - $ 226$ -$ -$ 111$ 6,303706PEND OREILLE1,583$ 11,297$ 6,098$ -$ 126$ -$ -$ 47$ 5,027543PIERCE90,360$ 664,183$ 385,581$ -$ 86,532$ -$ 140$ 6,825$ 185,10521,336SAN JUAN1,735$ 4,259$ 2,892$ -$ 55$ -$ -$ 188$ 1,125194SKAGIT12,659$ 54,698$ 33,742$ -$ 4,376$ -$ -$ 1,039$ 15,5411,974SKAMANIA1,250$ 4,797$ 2,080$ -$ 180$ -$ -$ 32$ 2,505310SNOHOMISH57,612$ 240,608$ 131,547$ -$ 30,918$ -$ -$ 3,661$ 74,4827,965SPOKANE48,793$ 285,254$ 146,954$ 3,252$ 23,714$ -$ 547$ 3,339$ 107,44912,316STEVENS5,112$ 28,509$ 16,739$ -$ 540$ -$ -$ 263$ 10,9671,605THURSTON32,270$ 222,257$ 142,182$ -$ 33,673$ -$ -$ 2,170$ 44,2326,473WAHKIAKUM505$ 2,314$ 1,179$ -$ 77$ -$ -$ 10$ 1,048124WALLA WALLA4,256$ 61,177$ 16,203$ 17,342$ 2,188$ -$ 436$ 267$ 24,7411,854WHATCOM16,395$ 66,025$ 42,656$ -$ 6,634$ -$ -$ 1,073$ 15,6622,441WHITMAN2,903$ 11,416$ 4,867$ -$ 3,435$ -$ -$ 279$ 2,835400YAKIMA15,535$ 72,313$ 40,890$ -$ 4,415$ -$ -$ 901$ 26,1073,417WASHINGTON (Totals)602,272$ 3,384,110$ 1,788,537$ 55,674$ 343,793$ -$ 67,749$ 41,915$ 1,086,440118,461CONG. DIST (01)49,051$ 177,691$ 98,204$ -$ 20,029$ -$ -$ 3,892$
  • 194.
    55,5676,452CONG. DIST (02)64,062$299,227$ 179,392$ - $ 37,656$ -$ -$ 4,560$ 77,6209,207CONG. DIST (03)67,106$ 370,632$ 178,558$ -$ 25,533$ -$ -$ 3,039$ 163,50216,350CONG. DIST (04)47,391$ 208,547$ 119,676$ -$ 14,113$ -$ -$ 2,656$ 72,10110,276CONG. DIST (05)67,689$ 423,656$ 206,255$ 20,595$ 30,884$ - $ 983$ 4,282$ 160,65818,148CONG. DIST (06)88,846$ 524,263$ 326,809$ -$ 56,779$ -$ -$ 5,078$ 135,59615,338CONG. DIST (07)41,086$ 332,319$ 96,912$ 35,080$ 24,531$ -$ 66,626$ 4,360$ 104,8116,760CONG. DIST (08)53,189$ 232,249$ 123,037$ -$ 27,461$ -$ -$ 3,421$ 78,3299,217CONG. DIST (09)41,179$ 222,016$ 102,269$ -$ 25,832$ -$ -$ 4,294$ 89,6227,562CONG. DIST (10)82,671$ 593,510$ 357,426$ -$ 80,975$ -$ 140$ 6,334$ 148,63519,151WASHINGTON (Totals)602,272$ 3,384,111$ 1,788,537$ 55,674$ 343,793$ -$ 67,749$ 41,915$ 1,086,440118,461Notes:* Veteran population estimates, as of September 30, 2013, are produced by the VA Office of the Actuary (VetPop 2011).# Prior to FY 08, "Loan Guaranty" expenditures were included in the Education & Vocational Rehabilitation and Employment (E&VRE) programs. Currently, all "Loan Guaranty" expenditures are attributed to Travis County, TX, where all Loan Guaranty payments are processed. VA will continue to improve data collection for future GDX reports to better distribute loan expenditures at the state, county and congressional district levels.** Unique patients are patients who received treatment at a VA health care facility. Data are provided by the Allocation Resource Center (ARC).Expenditure data sources: USASpending.gov for Compensation & Pension (C&P) and Education and Vocational Rehabilitation and Employment (EVRE) Benefits; Veterans Benefits Administration Insurance Center for the Insurance costs; the VA Financial Management System (FMS) for Construction, Medical Research, General Operating Expenses, and certain C&P and Readjustment data; and the Allocation Resource Center (ARC) for Medical Care costs.1. Expenditures
  • 195.
    are rounded tothe nearest thousand dollars. For example, $500 to $1,000 are rounded to $1; $0 to $499 are rounded to $0; and "$ -" = 0 or no expenditures.2. The Compensation & Pension expenditures include dollars for the following programs: veterans' compensation for service-connected disabilities; dependency and indemnity compensation for service-connected deaths; veterans' pension for nonservice-connected disabilities; and burial and other benefits to veterans and their survivors.3. Medical Care expenditures include dollars for medical services, medical administration, facility maintenance, educational support, research support, and other overhead items. Medical Care expenditures do not include dollars for construction or other non-medical support.4. Medical Care expenditures are based on where patients live instead of where care is delivered.5. A star symbol (*) in the Unique Patients column denotes that there were less than 10 Unique Patients. &"Arial,Bold"&11FY13 GEOGRAPHIC DISTRIBUTION OF VA EXPENDITURES (GDX) &8&P of &N WIFY13 Summary of Expenditures by StateExpenditures in $000sCounty/ Congressional DistrictVeteran Population*Total ExpenditureCompensation & PensionConstructionEducation & Vocational Rehabilitation/ EmploymentLoan Guaranty#General Operating ExpensesInsurance & IndemnitiesMedical CareUnique Patients**ADAMS2,180$ 17,093$ 5,362$ -$ 142$ -$ -$ 210$ 11,3791,023ASHLAND1,314$ 7,327$ 4,045$ -$ 311$ -$ -$ 141$ 2,830415BARRON3,724$ 19,861$ 10,041$ -$ 703$ -$ -$ 330$ 8,7881,309BAYFIELD1,701$ 7,860$ 3,950$ -$ 139$ -$ -$ 102$ 3,669536BROWN16,967$ 76,301$ 39,863$ -$ 5,403$ -$ -$ 1,204$ 29,8315,271BUFFALO1,142$ 5,341$ 3,140$ -$ 144$ -$ -$ 21$ 2,037404BURNETT1,764$ 11,266$ 5,123$ -$ 143$ -$ -$ 35$ 5,965659CALUMET2,962$ 11,908$ 4,394$ -$ 217$ -$ -
  • 196.
    $ 252$ 7,0461,078CHIPPEWA5,284$27,309$ 12,216$ -$ 1,179$ -$ -$ 387$ 13,5271,699CLARK1,985$ 14,782$ 8,104$ -$ 325$ -$ -$ 70$ 6,283911COLUMBIA4,907$ 25,794$ 10,259$ -$ 1,264$ -$ -$ 261$ 14,0101,310CRAWFORD1,305$ 6,961$ 3,265$ -$ 204$ - $ -$ 26$ 3,466420DANE28,566$ 155,441$ 52,168$ 599$ 12,844$ -$ 3,003$ 3,901$ 82,9276,686DODGE6,900$ 27,912$ 11,207$ -$ 1,495$ -$ -$ 297$ 14,9131,723DOOR2,598$ 10,744$ 5,128$ -$ 336$ -$ -$ 323$ 4,957812DOUGLAS4,386$ 27,212$ 14,283$ -$ 1,863$ -$ -$ 297$ 10,7681,361DUNN3,159$ 16,466$ 8,192$ -$ 1,382$ -$ -$ 154$ 6,737749EAU CLAIRE7,267$ 31,794$ 15,248$ -$ 2,733$ -$ -$ 778$ 13,0351,780FLORENCE560$ 8,216$ 2,211$ -$ 68$ -$ - $ 15$ 5,922278FOND DU LAC7,992$ 30,245$ 13,724$ - $ 2,191$ -$ -$ 477$ 13,8542,030FOREST922$ 9,773$ 4,796$ -$ 127$ -$ -$ 40$ 4,811487GRANT3,256$ 18,596$ 6,951$ -$ 1,128$ -$ -$ 231$ 10,286942GREEN2,585$ 13,068$ 5,389$ -$ 640$ -$ -$ 191$ 6,848699GREEN LAKE1,493$ 8,656$ 3,778$ -$ 271$ -$ -$ 220$ 4,387438IOWA1,379$ 7,525$ 3,048$ -$ 234$ -$ -$ 64$ 4,179437IRON796$ 4,758$ 1,926$ -$ 74$ -$ -$ 31$ 2,728325JACKSON1,923$ 14,254$ 6,025$ -$ 369$ -$ -$ 133$ 7,727757JEFFERSON6,014$ 28,460$ 11,522$ -$ 1,601$ -$ -$ 379$ 14,9581,591JUNEAU2,317$ 18,512$ 7,271$ -$ 707$ -$ -$ 246$ 10,2881,026KENOSHA12,201$ 76,577$ 28,919$ -$ 6,772$ -$ -$ 1,038$ 39,8483,258KEWAUNEE1,437$ 7,933$ 4,443$ -$ 230$ -$ -$ 104$ 3,156555LA CROSSE9,036$ 51,346$ 24,915$ -$ 5,011$ -$ -$ 623$ 20,7973,305LAFAYETTE989$ 4,915$ 2,267$ -$ 207$ -$ -$ 130$ 2,311303LANGLADE1,872$ 12,929$ 6,796$ -$ 332$ -$ -$ 216$ 5,586743LINCOLN2,604$ 18,734$ 10,511$ -$ 646$ -$ -$ 504$ 7,0721,038MANITOWOC6,737$ 29,228$ 15,431$ -$ 1,614$ -$ -$ 582$ 11,6012,084MARATHON10,390$
  • 197.
    40,674$ 20,872$ -$2,492$ -$ -$ 638$ 16,6733,066MARINETTE4,303$ 36,164$ 15,707$ -$ 742$ -$ -$ 147$ 19,5671,896MARQUETTE1,739$ 10,605$ 4,777$ -$ 200$ -$ -$ 79$ 5,549565MENOMINEE356$ 1,799$ 1,193$ -$ 104$ -$ -$ 1$ 50177MILWAUKEE51,063$ 509,291$ 137,348$ 6,752$ 26,180$ -$ 64,933$ 5,178$ 268,90115,176MONROE5,074$ 117,772$ 24,558$ 4,872$ 3,105$ -$ 2,056$ 242$ 82,9372,692OCONTO3,348$ 19,255$ 9,510$ -$ 491$ -$ -$ 91$ 9,1621,313ONEIDA3,682$ 22,222$ 11,690$ -$ 722$ -$ -$ 488$ 9,3221,455OUTAGAMIE12,666$ 54,541$ 27,694$ -$ 4,216$ -$ -$ 804$ 21,8283,671OZAUKEE6,184$ 21,359$ 10,186$ -$ 1,657$ -$ -$ 777$ 8,7391,054PEPIN528$ 3,918$ 1,809$ -$ 127$ -$ -$ 47$ 1,935203PIERCE2,848$ 15,197$ 7,498$ -$ 1,303$ - $ -$ 119$ 6,277616POLK3,741$ 23,070$ 9,930$ -$ 712$ -$ -$ 126$ 12,3011,213PORTAGE4,777$ 24,346$ 12,378$ -$ 1,739$ -$ -$ 477$ 9,7521,736PRICE1,499$ 6,862$ 3,639$ -$ 230$ -$ -$ 52$ 2,941486RACINE14,215$ 77,721$ 32,034$ -$ 4,676$ -$ -$ 1,087$ 39,9243,264RICHLAND1,352$ 8,999$ 3,230$ -$ 190$ -$ -$ 38$ 5,541498ROCK12,713$ 57,808$ 23,454$ -$ 3,763$ -$ -$ 852$ 29,7393,257RUSK1,525$ 7,542$ 4,275$ -$ 145$ -$ -$ 93$ 3,029448ST. CROIX5,994$ 27,851$ 12,376$ -$ 2,305$ -$ -$ 263$ 12,9071,371SAUK4,449$ 24,624$ 10,483$ -$ 763$ -$ - $ 354$ 13,0241,453SAWYER1,891$ 11,663$ 5,754$ -$ 379$ -$ -$ 120$ 5,410615SHAWANO3,396$ 18,527$ 9,010$ -$ 697$ -$ -$ 204$ 8,6171,280SHEBOYGAN8,671$ 27,265$ 12,502$ -$ 1,937$ -$ -$ 683$ 12,1431,865TAYLOR1,461$ 6,723$ 3,748$ -$ 238$ -$ -$ 150$ 2,587426TREMPEALEAU2,087$ 12,361$ 6,468$ -$ 532$ -$ -$ 94$ 5,267751VERNON2,173$ 13,924$ 6,809$ -$ 592$ -$ -$ 236$ 6,287827VILAS2,632$ 14,433$ 7,269$
  • 198.
    -$ 256$ -$-$ 262$ 6,646951WALWORTH7,111$ 37,714$ 15,427$ -$ 2,215$ -$ -$ 933$ 19,1391,716WASHBURN1,543$ 13,773$ 6,975$ -$ 408$ -$ -$ 53$ 6,337613WASHINGTON9,012$ 36,763$ 15,855$ -$ 2,406$ -$ -$ 772$ 17,7311,874WAUKESHA27,116$ 111,900$ 48,192$ -$ 8,696$ -$ -$ 3,305$ 51,7074,856WAUPACA5,269$ 40,716$ 23,751$ -$ 701$ -$ -$ 340$ 15,9241,667WAUSHARA2,447$ 14,099$ 6,597$ -$ 202$ -$ -$ 67$ 7,233874WINNEBAGO13,639$ 51,725$ 26,374$ -$ 3,954$ -$ -$ 883$ 20,5133,588WOOD6,301$ 33,543$ 17,229$ -$ 1,555$ -$ -$ 330$ 14,4292,516WISCONSIN (Totals)409,419$ 2,421,849$ 972,511$ 12,224$ 133,679$ -$ 69,991$ 34,398$ 1,199,045118,371CONG. DIST (01)51,739$ 268,110$ 105,328$ -$ 18,779$ -$ -$ 4,467$ 139,53612,249CONG. DIST (02)44,223$ 236,667$ 85,883$ 599$ 16,650$ -$ 3,003$ 5,174$ 125,35811,316CONG. DIST (03)55,916$ 394,048$ 156,626$ 4,872$ 20,566$ -$ 2,056$ 3,833$ 206,09419,598CONG. DIST (04)34,456$ 413,743$ 107,124$ 6,752$ 20,419$ -$ 64,933$ 3,341$ 211,17510,997CONG. DIST (05)49,907$ 235,419$ 92,610$ -$ 15,760$ -$ -$ 5,280$ 121,77010,768CONG. DIST (06)57,179$ 232,752$ 108,756$ -$ 13,942$ -$ -$ 4,212$ 105,84314,665CONG. DIST (07)61,794$ 359,972$ 173,822$ -$ 14,170$ -$ -$ 4,579$ 167,40120,944CONG. DIST (08)54,206$ 281,138$ 142,363$ -$ 13,393$ -$ -$ 3,513$ 121,86917,834WISCONSIN (Totals)409,419$ 2,421,849$ 972,511$ 12,224$ 133,679$ -$ 69,991$ 34,398$ 1,199,045118,371Notes:* Veteran population estimates, as of September 30, 2013, are produced by the VA Office of the Actuary (VetPop 2011).# Prior to FY 08, "Loan Guaranty" expenditures were included in the Education & Vocational Rehabilitation and Employment (E&VRE) programs. Currently, all "Loan Guaranty" expenditures are attributed to Travis County, TX, where all Loan Guaranty payments are
  • 199.
    processed. VA willcontinue to improve data collection for future GDX reports to better distribute loan expenditures at the state, county and congressional district levels.** Unique patients are patients who received treatment at a VA health care facility. Data are provided by the Allocation Resource Center (ARC).Expenditure data sources: USASpending.gov for Compensation & Pension (C&P) and Education and Vocational Rehabilitation and Employment (EVRE) Benefits; Veterans Benefits Administration Insurance Center for the Insurance costs; the VA Financial Management System (FMS) for Construction, Medical Research, General Operating Expenses, and certain C&P and Readjustment data; and the Allocation Resource Center (ARC) for Medical Care costs.1. Expenditures are rounded to the nearest thousand dollars. For example, $500 to $1,000 are rounded to $1; $0 to $499 are rounded to $0; and "$ -" = 0 or no expenditures.2. The Compensation & Pension expenditures include dollars for the following programs: veterans' compensation for service-connected disabilities; dependency and indemnity compensation for service-connected deaths; veterans' pension for nonservice-connected disabilities; and burial and other benefits to veterans and their survivors.3. Medical Care expenditures include dollars for medical services, medical administration, facility maintenance, educational support, research support, and other overhead items. Medical Care expenditures do not include dollars for construction or other non-medical support.4. Medical Care expenditures are based on where patients live instead of where care is delivered.5. A star symbol (*) in the Unique Patients column denotes that there were less than 10 Unique Patients. &"Arial,Bold"&11FY13 GEOGRAPHIC DISTRIBUTION OF VA EXPENDITURES (GDX) &8&P of &N WVFY13 Summary of Expenditures by StateExpenditures in $000sCounty/ Congressional DistrictVeteran Population*Total
  • 200.
    ExpenditureCompensation & PensionConstructionEducation& Vocational Rehabilitation/ EmploymentLoan Guaranty#General Operating ExpensesInsurance & IndemnitiesMedical CareUnique Patients**BARBOUR1,200$ 10,726$ 5,145$ -$ 214$ -$ -$ 30$ 5,337546BERKELEY12,478$ 372,726$ 43,645$ 1,888$ 5,046$ -$ 237,433$ 600$ 84,1144,190BOONE1,883$ 12,512$ 8,023$ -$ 122$ -$ - $ 56$ 4,310533BRAXTON1,479$ 12,860$ 5,621$ -$ 144$ -$ -$ 119$ 6,976621BROOKE2,484$ 8,151$ 3,837$ -$ 439$ -$ -$ 284$ 3,592513CABELL8,933$ 93,208$ 31,295$ 13$ 3,189$ -$ 18,780$ 443$ 39,4883,151CALHOUN694$ 4,987$ 3,036$ -$ 59$ -$ -$ 26$ 1,867220CLAY756$ 7,911$ 4,075$ -$ 76$ -$ -$ 72$ 3,688375DODDRIDGE672$ 4,510$ 1,946$ -$ 109$ -$ -$ 13$ 2,441255FAYETTE4,674$ 50,365$ 25,001$ -$ 774$ -$ -$ 209$ 24,3811,804GILMER566$ 4,497$ 2,009$ -$ 211$ -$ -$ 36$ 2,241257GRANT1,092$ 5,744$ 3,082$ -$ 156$ -$ -$ 67$ 2,438377GREENBRIER3,192$ 27,479$ 13,229$ -$ 602$ -$ -$ 142$ 13,5071,379HAMPSHIRE2,406$ 15,233$ 6,706$ -$ 301$ -$ -$ 202$ 8,025706HANCOCK3,380$ 13,088$ 6,316$ -$ 735$ -$ -$ 229$ 5,807773HARDY1,257$ 7,131$ 3,891$ -$ 103$ -$ -$ 56$ 3,080421HARRISON7,149$ 74,641$ 27,687$ 845$ 1,892$ -$ 1,134$ 472$ 42,6113,248JACKSON2,695$ 13,365$ 8,109$ -$ 495$ -$ -$ 88$ 4,673638JEFFERSON5,952$ 48,409$ 16,441$ -$ 5,534$ -$ -$ 251$ 26,1831,558KANAWHA17,473$ 92,219$ 49,179$ -$ 3,501$ -$ -$ 1,627$ 37,9125,087LEWIS1,559$ 16,688$ 7,369$ -$ 272$ -$ -$ 87$ 8,960807LINCOLN1,374$ 13,308$ 6,716$ -$ 169$ -$ -$ 94$ 6,329592LOGAN2,536$ 24,417$ 15,853$ -$ 279$ -$ -$ 62$ 8,224918MCDOWELL1,311$ 15,027$ 9,207$ -$ 44$ -$ -$ 3$ 5,773541MARION5,993$ 43,728$ 20,802$ -$ 1,655$ -$ -$ 322$ 20,9492,099MARSHALL3,216$ 11,504$ 5,789$ -$ 424$
  • 201.
    -$ -$ 183$5,109762MASON2,280$ 13,842$ 7,292$ -$ 291$ -$ -$ 126$ 6,133682MERCER5,855$ 60,119$ 31,784$ -$ 1,431$ -$ -$ 344$ 26,5602,120MINERAL3,235$ 18,553$ 9,969$ -$ 384$ -$ -$ 201$ 7,999983MINGO1,508$ 15,616$ 9,842$ -$ 169$ -$ -$ 92$ 5,513618MONONGALIA6,820$ 32,582$ 15,961$ -$ 4,782$ -$ -$ 445$ 11,3941,522MONROE1,190$ 14,760$ 8,461$ -$ 296$ -$ -$ 15$ 5,988553MORGAN1,706$ 13,715$ 5,628$ -$ 440$ -$ -$ 61$ 7,587585NICHOLAS2,204$ 22,230$ 12,218$ -$ 334$ -$ -$ 38$ 9,639976OHIO4,079$ 16,143$ 8,529$ -$ 792$ -$ -$ 352$ 6,4701,105PENDLETON1,007$ 4,855$ 2,221$ -$ 196$ -$ -$ 34$ 2,405282PLEASANTS654$ 3,407$ 1,618$ -$ 101$ -$ -$ 17$ 1,671177POCAHONTAS901$ 7,373$ 3,611$ -$ 75$ -$ -$ 284$ 3,403333PRESTON3,166$ 21,686$ 11,570$ -$ 633$ -$ -$ 125$ 9,3591,026PUTNAM5,219$ 27,099$ 13,643$ -$ 1,106$ - $ -$ 176$ 12,1751,373RALEIGH7,495$ 102,259$ 39,440$ 3,486$ 1,575$ -$ 1,119$ 582$ 56,0583,610RANDOLPH2,901$ 23,579$ 10,875$ -$ 648$ -$ -$ 86$ 11,9711,100RITCHIE992$ 8,695$ 4,353$ -$ 100$ -$ -$ 11$ 4,232430ROANE1,433$ 9,169$ 4,992$ -$ 125$ -$ -$ 129$ 3,923480SUMMERS1,323$ 12,744$ 6,955$ -$ 220$ -$ -$ 91$ 5,477537TAYLOR1,718$ 12,645$ 5,466$ 88$ 309$ -$ 1,032$ 136$ 5,613586TUCKER687$ 4,183$ 2,079$ -$ 89$ -$ -$ 14$ 2,001269TYLER1,040$ 4,905$ 2,435$ -$ 28$ -$ - $ 117$ 2,325237UPSHUR2,344$ 21,049$ 8,847$ -$ 406$ -$ -$ 101$ 11,695971WAYNE3,283$ 44,750$ 18,665$ 206$ 821$ -$ 2,062$ 79$ 22,9171,695WEBSTER880$ 7,973$ 4,072$ -$ 53$ -$ -$ 59$ 3,789361WETZEL1,629$ 9,094$ 4,904$ -$ 183$ -$ -$ 29$ 3,978466WIRT529$ 3,168$ 1,995$ -$ 147$ -$ -$ 3$ 1,023183WOOD9,103$ 44,533$ 26,508$ -$ 1,890$ -$ -$ 313$ 15,8232,439WYOMING1,807$
  • 202.
    16,097$ 7,750$ -$174$ -$ -$ 37$ 8,135663WEST VIRGINIA (Totals)173,389$ 1,601,256$ 625,689$ 6,525$ 44,341$ -$ 261,560$ 9,871$ 653,27058,733CONG. DIST (01)58,873$ 353,060$ 170,089$ 855$ 15,132$ -$ 2,166$ 3,386$ 161,43218,076CONG. DIST (02)61,888$ 694,155$ 196,210$ 1,965$ 18,593$ -$ 237,433$ 3,724$ 236,23119,593CONG. DIST (03)52,627$ 554,040$ 259,390$ 3,705$ 10,617$ -$ 21,961$ 2,761$ 255,60721,064WEST VIRGINIA (Totals)173,389$ 1,601,256$ 625,689$ 6,525$ 44,341$ -$ 261,560$ 9,871$ 653,27058,733Notes:* Veteran population estimates, as of September 30, 2013, are produced by the VA Office of the Actuary (VetPop 2011).# Prior to FY 08, "Loan Guaranty" expenditures were included in the Education & Vocational Rehabilitation and Employment (E&VRE) programs. Currently, all "Loan Guaranty" expenditures are attributed to Travis County, TX, where all Loan Guaranty payments are processed. VA will continue to improve data collection for future GDX reports to better distribute loan expenditures at the state, county and congressional district levels.** Unique patients are patients who received treatment at a VA health care facility. Data are provided by the Allocation Resource Center (ARC).Expenditure data sources: USASpending.gov for Compensation & Pension (C&P) and Education and Vocational Rehabilitation and Employment (EVRE) Benefits; Veterans Benefits Administration Insurance Center for the Insurance costs; the VA Financial Management System (FMS) for Construction, Medical Research, General Operating Expenses, and certain C&P and Readjustment data; and the Allocation Resource Center (ARC) for Medical Care costs.1. Expenditures are rounded to the nearest thousand dollars. For example, $500 to $1,000 are rounded to $1; $0 to $499 are rounded to $0; and "$ -" = 0 or no expenditures.2. The Compensation & Pension expenditures include dollars for the following programs: veterans' compensation for service-connected disabilities; dependency and indemnity compensation for service-connected deaths;
  • 203.
    veterans' pension fornonservice-connected disabilities; and burial and other benefits to veterans and their survivors.3. Medical Care expenditures include dollars for medical services, medical administration, facility maintenance, educational support, research support, and other overhead items. Medical Care expenditures do not include dollars for construction or other non-medical support.4. Medical Care expenditures are based on where patients live instead of where care is delivered.5. A star symbol (*) in the Unique Patients column denotes that there were less than 10 Unique Patients. &"Arial,Bold"&11FY13 GEOGRAPHIC DISTRIBUTION OF VA EXPENDITURES (GDX) &8&P of &N WYFY13 Summary of Expenditures by StateExpenditures in $000sCounty/ Congressional DistrictVeteran Population*Total ExpenditureCompensation & PensionConstructionEducation & Vocational Rehabilitation/ EmploymentLoan Guaranty#General Operating ExpensesInsurance & IndemnitiesMedical CareUnique Patients**ALBANY2,533$ 15,907$ 6,215$ -$ 3,855$ -$ -$ 280$ 5,558688BIG HORN1,097$ 4,354$ 1,821$ -$ 156$ -$ -$ 44$ 2,334390CAMPBELL3,774$ 12,573$ 4,333$ -$ 556$ -$ -$ 173$ 7,5121,047CARBON1,661$ 7,502$ 2,991$ -$ 154$ -$ -$ 27$ 4,330395CONVERSE1,296$ 4,358$ 1,882$ -$ 152$ -$ -$ 25$ 2,300346CROOK669$ 4,086$ 1,104$ -$ 80$ -$ -$ 26$ 2,876282FREMONT3,567$ 17,576$ 7,867$ -$ 497$ -$ -$ 472$ 8,7401,297GOSHEN1,215$ 7,536$ 3,540$ -$ 235$ -$ -$ 50$ 3,709439HOT SPRINGS611$ 3,037$ 1,238$ -$ 96$ -$ -$ 14$ 1,689242JOHNSON848$ 8,921$ 2,686$ -$ 39$ -$ -$ 73$ 6,124489LARAMIE15,056$ 111,083$ 45,812$ 1,157$ 6,116$ -$ 968$ 849$ 56,1814,591LINCOLN1,385$ 4,773$ 1,899$ -$ 138$ -$ -$ 45$ 2,691389NATRONA6,691$ 26,693$ 12,039$ -$ 1,172$ -$
  • 204.
    -$ 345$ 13,1362,093NIOBRARA251$1,242$ 474$ -$ 21$ -$ -$ 10$ 73896PARK2,823$ 14,171$ 6,330$ -$ 398$ -$ -$ 192$ 7,2511,021PLATTE1,060$ 6,478$ 2,646$ -$ 221$ -$ -$ 40$ 3,572407SHERIDAN3,138$ 59,008$ 11,472$ 6,107$ 810$ -$ 488$ 102$ 40,0292,021SUBLETTE641$ 2,221$ 813$ -$ 96$ -$ -$ 39$ 1,273176SWEETWATER3,952$ 14,401$ 5,854$ -$ 401$ -$ -$ 182$ 7,9641,015TETON1,202$ 1,952$ 1,065$ -$ 131$ -$ -$ 44$ 712173UINTA1,494$ 8,033$ 3,011$ -$ 263$ -$ -$ 34$ 4,726425WASHAKIE811$ 2,953$ 1,127$ -$ 92$ -$ -$ 6$ 1,727259WESTON742$ 4,751$ 1,338$ -$ 71$ -$ -$ 60$ 3,283302WYOMING (Totals)56,518$ 343,611$ 127,557$ 7,264$ 15,751$ -$ 1,456$ 3,131$ 188,45318,583CONG. DIST (01)56,518$ 343,611$ 127,557$ 7,264$ 15,751$ -$ 1,456$ 3,131$ 188,45318,583WYOMING (Totals)56,518$ 343,611$ 127,557$ 7,264$ 15,751$ -$ 1,456$ 3,131$ 188,45318,583Notes:* Veteran population estimates, as of September 30, 2013, are produced by the VA Office of the Actuary (VetPop 2011).# Prior to FY 08, "Loan Guaranty" expenditures were included in the Education & Vocational Rehabilitation and Employment (E&VRE) programs. Currently, all "Loan Guaranty" expenditures are attributed to Travis County, TX, where all Loan Guaranty payments are processed. VA will continue to improve data collection for future GDX reports to better distribute loan expenditures at the state, county and congressional district levels.** Unique patients are patients who received treatment at a VA health care facility. Data are provided by the Allocation Resource Center (ARC).Expenditure data sources: USASpending.gov for Compensation & Pension (C&P) and Education and Vocational Rehabilitation and Employment (EVRE) Benefits; Veterans Benefits Administration Insurance Center for the Insurance costs; the VA Financial Management System (FMS) for Construction, Medical Research, General Operating Expenses, and certain C&P and Readjustment data; and the Allocation
  • 205.
    Resource Center (ARC)for Medical Care costs.1. Expenditures are rounded to the nearest thousand dollars. For example, $500 to $1,000 are rounded to $1; $0 to $499 are rounded to $0; and "$ -" = 0 or no expenditures.2. The Compensation & Pension expenditures include dollars for the following programs: veterans' compensation for service-connected disabilities; dependency and indemnity compensation for service-connected deaths; veterans' pension for nonservice-connected disabilities; and burial and other benefits to veterans and their survivors.3. Medical Care expenditures include dollars for medical services, medical administration, facility maintenance, educational support, research support, and other overhead items. Medical Care expenditures do not include dollars for construction or other non-medical support.4. Medical Care expenditures are based on where patients live instead of where care is delivered.5. A star symbol (*) in the Unique Patients column denotes that there were less than 10 Unique Patients. &"Arial,Bold"&11FY13 GEOGRAPHIC DISTRIBUTION OF VA EXPENDITURES (GDX) &8&P of &N PRFY13 Summary of Expenditures by StateExpenditures in $000sCounty/ Congressional DistrictVeteran Population*Total ExpenditureCompensation & PensionsConstructionEducation & Vocational Rehabilitation/ EmploymentLoan Guaranty#General Operating ExpensesInsurance & IndemnitiesMedical CareUnique Patients**ADJUNTAS$ 5,995$ 3,904$ -$ 94$ -$ -$ 3$ 1,994282AGUADA$ 10,219$ 6,383$ -$ 599$ -$ -$ -$ 3,237474AGUADILLA$ 29,560$ 18,390$ -$ 1,673$ -$ -$ 75$ 9,4221,195AGUAS BUENAS$ 7,404$ 3,462$ -$ 344$ -$ -$ -$ 3,598312AIBONITO$ 13,229$ 8,331$ -$ 339$ -$ -$ 37$ 4,522457ANASCO$ 6,017$ 3,527$ -$ 163$ -$ -$ -$ 2,327383ARECIBO$ 31,922$ 18,829$ -$ 866$ -$ -$ 37$ 12,1891,520ARROYO$ 6,215$ 3,163$ -$ 341$ -$ -$ -$
  • 206.
    2,710314BARCELONETA$ 6,658$ 3,909$-$ 257$ -$ -$ 9$ 2,483318BARRANQUITAS$ 12,775$ 8,487$ -$ 296$ -$ -$ 32$ 3,960380BAYAMON$ 110,870$ 52,171$ 1,706$ 2,997$ -$ 2,300$ 222$ 51,4743,970CABO ROJO$ 17,532$ 9,407$ -$ 538$ -$ -$ 13$ 7,5751,001CAGUAS$ 62,586$ 29,325$ -$ 2,055$ -$ -$ 78$ 31,1282,426CAMUY$ 9,254$ 5,329$ -$ 331$ -$ - $ 2$ 3,592434CANOVANAS$ 14,637$ 7,386$ -$ 479$ -$ -$ 10$ 6,762524CAROLINA$ 81,100$ 35,033$ -$ 1,884$ -$ -$ 175$ 44,0083,154CATANO$ 6,499$ 3,015$ -$ 209$ -$ -$ 1$ 3,274277CAYEY$ 30,460$ 18,550$ -$ 772$ -$ -$ 36$ 11,102972CEIBA$ 7,686$ 3,803$ -$ 310$ -$ -$ 210$ 3,363339CIALES$ 5,877$ 3,827$ -$ 100$ -$ -$ -$ 1,950219CIDRA$ 12,825$ 6,486$ -$ 498$ -$ -$ 7$ 5,834538COAMO$ 19,459$ 11,416$ -$ 859$ -$ -$ 7$ 7,178877COMERIO$ 6,395$ 3,316$ -$ 116$ -$ -$ -$ 2,963234COROZAL$ 11,991$ 6,035$ -$ 362$ -$ -$ 12$ 5,582414CULEBRA$ 869$ 273$ -$ 13$ -$ -$ 3$ 57930DORADO$ 14,874$ 5,804$ -$ 495$ -$ -$ 5$ 8,570580FAJARDO$ 21,371$ 9,437$ -$ 589$ -$ -$ 22$ 11,324775FLORIDA$ 3,355$ 2,038$ -$ 128$ -$ -$ -$ 1,189143GUANICA$ 5,583$ 3,133$ -$ 260$ -$ -$ 8$ 2,182366GUAYAMA$ 14,730$ 8,439$ -$ 595$ -$ -$ 3$ 5,692715GUAYANILLA$ 8,123$ 4,739$ -$ 369$ -$ -$ 25$ 2,991442GUAYNABO$ 35,455$ 15,211$ -$ 1,531$ -$ -$ 120$ 18,5921,377GURABO$ 14,860$ 6,539$ -$ 631$ -$ -$ 9$ 7,681624HATILLO$ 10,283$ 5,167$ -$ 357$ -$ -$ 2$ 4,757538HORMIGUEROS$ 6,371$ 3,744$ -$ 233$ -$ -$ 1$ 2,392399HUMACAO$ 19,499$ 10,364$ -$ 537$ -$ -$ 41$ 8,558770ISABELA$ 17,694$ 10,802$ -$ 701$ -$ -$ 29$ 6,162773JAYUYA$ 4,657$ 3,034$ -$ 104$ -$ -$ 1$ 1,517188JUANA DIAZ$ 17,679$ 9,226$ -$ 893$ -$ -$ 18$ 7,5421,059JUNCOS$ 11,682$ 6,171$ -$ 476$ - $ -$ 32$ 5,003490LAJAS$ 9,132$ 5,504$ -$ 324$ -$
  • 207.
    -$ 1$ 3,302504LARES$7,664$ 4,687$ -$ 270$ -$ -$ 10$ 2,697337LAS MARIAS$ 1,185$ 717$ -$ 73$ -$ -$ -$ 39596LAS PIEDRAS$ 11,547$ 5,986$ -$ 344$ -$ - $ -$ 5,217453LOIZA$ 6,631$ 2,631$ -$ 70$ -$ -$ 6$ 3,924298LUQUILLO$ 9,340$ 4,597$ -$ 312$ -$ -$ 4$ 4,426386MANATI$ 12,550$ 7,909$ -$ 302$ -$ -$ 11$ 4,328512MARICAO$ 906$ 612$ -$ 68$ -$ -$ -$ 22762MAUNABO$ 4,597$ 2,524$ -$ 57$ -$ -$ -$ 2,016155MAYAGUEZ$ 25,186$ 14,114$ -$ 960$ -$ -$ 31$ 10,0821,528MOCA$ 8,814$ 5,121$ -$ 541$ -$ -$ 12$ 3,140436MOROVIS$ 7,414$ 4,292$ -$ 202$ -$ -$ 1$ 2,919309NAGUABO$ 8,904$ 4,394$ -$ 320$ -$ -$ 1$ 4,190403NARANJITO$ 12,391$ 6,273$ -$ 143$ -$ -$ 1$ 5,973346OROCOVIS$ 7,056$ 4,324$ -$ 175$ -$ -$ 2$ 2,555257PATILLAS$ 5,727$ 3,631$ -$ 208$ -$ -$ 3$ 1,884249PENUELAS$ 9,019$ 5,156$ -$ 291$ -$ -$ 27$ 3,544455PONCE$ 64,813$ 37,511$ -$ 3,128$ - $ -$ 85$ 24,0903,784QUEBRADILLAS$ 10,192$ 6,052$ -$ 435$ -$ -$ -$ 3,705431RINCON$ 4,402$ 2,484$ -$ 174$ -$ -$ -$ 1,744236RIO GRANDE$ 19,149$ 8,659$ -$ 675$ -$ -$ 6$ 9,808796SABANA GRANDE$ 10,067$ 6,327$ -$ 545$ -$ -$ 10$ 3,185574SALINAS$ 11,686$ 6,703$ -$ 381$ -$ -$ 60$ 4,541571SAN GERMAN$ 11,975$ 6,863$ -$ 639$ -$ -$ 79$ 4,395699SAN JUAN$ 175,478$ 64,218$ 6,050$ 4,792$ -$ 17,612$ 676$ 82,1305,373SAN LORENZO$ 11,532$ 5,473$ -$ 479$ -$ -$ 16$ 5,564500SAN SEBASTIAN$ 10,966$ 6,420$ -$ 368$ -$ -$ 7$ 4,171547SANTA ISABEL$ 7,274$ 4,303$ -$ 415$ -$ -$ 7$ 2,549429TOA ALTA$ 23,122$ 10,600$ -$ 1,078$ -$ -$ 16$ 11,429919TOA BAJA$ 41,270$ 20,045$ -$ 1,225$ -$ -$ 63$ 19,9371,597TRUJILLO ALTO$ 25,052$ 9,865$ -$ 552$ - $ -$ 25$ 14,610973UTUADO$ 11,029$ 5,781$ -$ 403$ -$ -$ 3$ 4,842458VEGA ALTA$ 12,491$ 5,884$ -$ 357$ -$ -$ 23$ 6,227505VEGA BAJA$ 19,782$ 10,998$ -$ 533$ -$ -$ 16$ 8,235790VIEQUES$ 4,228$ 2,047$
  • 208.
    -$ 68$ -$-$ -$ 2,114226VILLALBA$ 6,530$ 4,047$ -$ 299$ -$ -$ -$ 2,183344YABUCOA$ 9,480$ 4,979$ -$ 272$ -$ -$ -$ 4,230378YAUCO$ 14,949$ 8,546$ - $ 669$ -$ -$ 6$ 5,728810Puerto Rico Totals99,928$ 1,387,777$ 697,879$ 7,756$ 46,541$ -$ 19,912$ 2,496$ 613,19358,009CONG. DIST (01)99,928$ 1,387,777$ 697,879$ 7,756$ 46,541$ -$ 19,912$ 2,496$ 613,19358,009Puerto Rico (Totals)99,928$ 1,387,777$ 697,879$ 7,756$ 46,541$ -$ 19,912$ 2,496$ 613,19358,009Notes:* Veteran population estimates, as of September 30, 2013, are produced by the VA Office of the Actuary (VetPop 2011).# Prior to FY 08, "Loan Guaranty" expenditures were included in the Education & Vocational Rehabilitation and Employment (E&VRE) programs. Currently, all "Loan Guaranty" expenditures are attributed to Travis County, TX, where all Loan Guaranty payments are processed. VA will continue to improve data collection for future GDX reports to better distribute loan expenditures at the state, county and congressional district levels.** Unique patients are patients who received treatment at a VA health care facility. Data are provided by the Allocation Resource Center (ARC).Expenditure data sources: USASpending.gov for Compensation & Pension (C&P) and Education and Vocational Rehabilitation and Employment (EVRE) Benefits; Veterans Benefits Administration Insurance Center for the Insurance costs; the VA Financial Management System (FMS) for Construction, Medical Research, General Operating Expenses, and certain C&P and Readjustment data; and the Allocation Resource Center (ARC) for Medical Care costs.1. Expenditures are rounded to the nearest thousand dollars. For example, $500 to $1,000 are rounded to $1; $0 to $499 are rounded to $0; and "$ -" = 0 or no expenditures.2. The Compensation & Pension expenditures include dollars for the following programs: veterans' compensation for service-connected disabilities; dependency and indemnity compensation for service-connected deaths; veterans' pension for nonservice-connected disabilities;
  • 209.
    and burial andother benefits to veterans and their survivors.3. Medical Care expenditures include dollars for medical services, medical administration, facility maintenance, educational support, research support, and other overhead items. Medical Care expenditures do not include dollars for construction or other non-medical support.4. Medical Care expenditures are based on where patients live instead of where care is delivered.5. A star symbol (*) in the Unique Patients column denotes that there were less than 10 Unique Patients. &"Arial,Bold"&11FY13 GEOGRAPHIC DISTRIBUTION OF VA EXPENDITURES (GDX) &8&P of &N GUFY13 Summary of Expenditures by StateExpenditures in $000sCounty/ Congressional DistrictVeteran Population*Total ExpenditureCompensation & PensionConstructionEducation & Vocational Rehabilitation/ EmploymentLoan Guaranty#General Operating ExpensesInsurance & IndemnitiesMedical CareUnique Patients**Guam9,055$ 66,330$ 46,193$ -$ 10,629$ -$ -$ 495$9,012Guam (Totals)9,055$ 66,330$ 46,193$ -$ 10,629$ -$ -$ 495$ 9,012Notes:* Veteran population estimates, as of September 30, 2013, are produced by the VA Office of the Actuary (VetPop 2011).# Prior to FY 08, "Loan Guaranty" expenditures were included in the Education & Vocational Rehabilitation and Employment (E&VRE) programs. Currently, all "Loan Guaranty" expenditures are attributed to Travis County, TX, where all Loan Guaranty payments are processed. VA will continue to improve data collection for future GDX reports to better distribute loan expenditures at the state, county and congressional district levels.** Unique patients are patients who received treatment at a VA health care facility. Data are provided by the Allocation Resource Center (ARC).Expenditure data sources: USASpending.gov for Compensation & Pension (C&P) and Education and Vocational Rehabilitation and Employment (EVRE) Benefits; Veterans
  • 210.
    Benefits Administration InsuranceCenter for the Insurance costs; the VA Financial Management System (FMS) for Construction, Medical Research, General Operating Expenses, and certain C&P and Readjustment data; and the Allocation Resource Center (ARC) for Medical Care costs.1. Expenditures are rounded to the nearest thousand dollars. For example, $500 to $1,000 are rounded to $1; $0 to $499 are rounded to $0; and "$ -" = 0 or no expenditures.2. The Compensation & Pension expenditures include dollars for the following programs: veterans' compensation for service-connected disabilities; dependency and indemnity compensation for service-connected deaths; veterans' pension for nonservice-connected disabilities; and burial and other benefits to veterans and their survivors.3. Medical Care expenditures include dollars for medical services, medical administration, facility maintenance, educational support, research support, and other overhead items. Medical Care expenditures do not include dollars for construction or other non-medical support.4. Medical Care expenditures are based on where patients live instead of where care is delivered.5. A star symbol (*) in the Unique Patients column denotes that there were less than 10 Unique Patients. &"Arial,Bold"&11FY13 GEOGRAPHIC DISTRIBUTION OF VA EXPENDITURES (GDX) &8&P of &N Data DescriptionIntroductionEach Fiscal Year (FY), the Department of Veterans Affairs’ (VA’s) Office of Policy and Planning (OPP) publishes the Geographic Distribution of VA Expenditures (GDX) report. This report provides the estimated dollar expenditures for major VA programs at the state, county, and Congressional District levels. Expenditure data are grouped by the following categories: Compensation and Pension, Education and Vocational Rehabilitation and Employment, Insurance and Indemnities, Construction, General Operating Expenses, Loan Guaranty, and Medical Care. Veteran
  • 211.
    population estimates atthe state, county and Congressional District level and the number of unique patients who used VA healthcare services are also included in the report. The following information provides a brief description of the data included in the report, the methods used for data collection, and the sources of the data.Veteran PopulationAs of FY 2012, the estimated Veteran population data by state and county are based on the VA VetPop2011 model. This model is VA’s source for official estimates and projections of the Veteran population. Compensation and Pension The Compensation and Pension (C&P) category includes expenditures for the following categories: compensation payments, pension payments, Dependency and Indemnity Compensation, and burial allowances. Most expenditures reported in this category reflect monthly payments made to individuals. Retroactive payments and one-time payments are also included. Data is obtained from USASpending.gov. Education and Vocational Rehabilitation and Employment Education and Vocational Rehabilitation and Employment (E&VRE) are separate programs, but are combined into one category for display purposes in GDX. Expenditures in this category include: automobile and adaptive equipment, specially adapted housing, Survivors’ and Dependents’ Educational Assistance (Chapter 35), Vocational Rehabilitation for Disabled Veterans (Chapter 31), Post-Vietnam Era Veterans’ Educational Assistance (Chapter 32), Montgomery G.I. Bill for Selected Reserves (Chapter 1606), Reserve Educational Assistance Program (Chapter 1607), Montgomery G.I. Bill (Chapter 30), and Post-9/11 Veterans Educational Assistance (Chapter 33). Expenditure data for E&VRE are also obtained from USASpending.gov. Insurance and Indemnities The data reported for this category are provided by the VA Regional Office and Insurance Center (RO&IC) in Philadelphia, Pennsylvania. This category consists of VA expenditures for death claims, matured endowments, dividends, cash surrender payments, total disability income provision payments, and total and permanent disability benefits payments. It includes
  • 212.
    Veterans Group LifeInsurance, National Service Life Insurance, Service Disabled Veterans Life Insurance, United States Government Life Insurance, Veterans Reopened Insurance, and Veterans Special Life Insurance. It does not include Traumatic Injury Protection Under Servicemembers' Group Life Insurance, Family Servicemembers' Group Life Insurance, or Servicemembers' Group Life Insurance. The RO&IC provides OPP with monthly extracts of payments to recipients by zip code for the purposes of aggregating these monthly payments by state, county, and Congressional District.Construction and Related Costs The Construction expenditures category includes funding for Major Projects, Minor Projects, Grants for Construction of State Extended Care Facilities, and Grants for Construction of State Veterans Cemeteries. The source of the Construction data is the Financial Management System (FMS).General Operating Expenses General Operating Expenses (GOE) represent the costs necessary to provide administration and oversight for the benefits provided by VA. This includes costs for overhead and human resources. This category does not include payments made directly to beneficiaries. The source of the GOE data is FMS.Loan GuarantyPrior to FY 2008, Loan Guaranty expenditures were included in the E&VRE category. Currently, all Loan Guaranty expenditures are attributed to Travis, Texas, where all payments are processed. VA will continue to improve data collection for future GDX reports to better distribute loan expenditures at the state, county and Congressional District levels.Medical Expenditures Medical expenditures data come from both the Allocation Resource Center (ARC) and FMS. The specific programs reported for this category are: medical care, General Post Fund, medical and prosthetic research, and miscellaneous accounts.Unique Patients The count of unique patients is based on the home residence of the patient. The number of patients, along with associated county and Congressional District codes, are provided by the ARC.
  • 213.
    Movies Sample Presentation SCM315 – Business Decision Models Data Data for these visualizations are from two sources: Data comprises all major motion picture releases from 2011 and most of 2012 Box Office Mojo http://www.boxofficemojo.com/ Contains all movie release data including: Theaters Opening gross Total gross Any much more … IMDB http://www.imdb.com/ Obtained top three billed starts for each film Google Obtained ‘Bacon Number’ for each actor (number of movie connections between the actor and Kevin Bacon)
  • 214.
    Opening Gross vs.Total Gross Opening Gross vs. Total Gross Visualization: Each data point is a different movie Each movie is colored based on the MPAA rating of the film The x-axis denotes the total box office gross of the film The y-axis denotes the opening weekend box office gross of the film The trend lines are separate for each MPAA rating Reasoning: This graph was created to determine variability between a films opening weekend gross vs. its total gross They are expected to be correlated, but it will be interesting to see if there are outliers The movies are color coded by MPAA rating to determine if that has any impact on the correlation Opening Gross vs. Total Gross
  • 215.
    Opening Gross vs.Total Gross Conclusions: It is clearly evident that a movie’s total gross is highly correlated with its opening gross (i.e. if it makes more initially it will make more over its life) Only a small subset of movies make over $100 million in total gross Due to the higher slope, PG-13 movies tend to make more of its total earning in its opening week/weekend This is not overly surprising as this is driven by many high profile movies (Avengers, Pirates of the Caribbean, etc.) which are more likely to be seen in the opening week than less high profile movies It appears that children's movies have the longest lifespans as they tend to make the lowest percentage on their opening weekend Examples are Puss in Boots, Brave, Kung Fu Panda 2 Average Gross by Date Including 3D Percentages
  • 216.
    Average Gross byDate Including 3D Percentages Visualization: Each bar represents the count of the number of films released that month (height shown on the left y-axis) Each bar is colored based on the percentage of releases that month which were in 3D The line shows the average box office gross per film release during that month (height shown on the right y-axis) The reference lines show the yearly average box office gross for each film Reasoning: This graph was made to primarily observe if summer movies tend to make more These months tend to have the blockbuster movies The bars were added to provide clarity on the scale of films released each month The bars were color coded to see if higher percentage of 3D movies are also released in the summer Average Gross by Date Including 3D Percentages
  • 217.
    Average Gross byDate Including 3D Percentages Conclusions: From 2011 to 2012, the average gross per film increased by $10 million Typically, the highest average movie grosses take place in the summer (May, June, and July). These months also have the highest percentage of 3D releases in general (coinciding with the big blockbuster action movies) The summer months also tend to have the lowest number of releases This trend is not very consistent, more data would be needed to see if it holds up Top 30 Actors and Actresses Based on % Sequels
  • 218.
    Top 30 Actorsand Actresses based on % Sequels Visualization: Each bubble is one of the top 30 top-billed actors or actresses based on the total gross of their movies The larger the bubble, the more that actors/actresses movies grossed (as given by the label) The bubbles are shaded based on the percentage of their movies which were sequels Reasoning: The chart was made to simply observe which actors/actresses are in the highest grossing movies The shading was added to observe how frequently the top grossing actors are tied with franchise movies Top 30 Actors and Actresses based on % Sequels Top 30 Actors and Actresses based on % Sequels
  • 219.
    Conclusions: You can seethe top actors/actresses are all associated with sequels of various types: Robert Downey Jr.: Avengers/Iron Man Christian Bale: Batman Johnny Depp: Pirates of the Caribbean Daniel Radcliffe: Harry Potter Nearly none of the actors/actresses associated with sequels are women Women do not appear to earn top billing in franchise films (minus one outlier of Jennifer Lawrence) Other than top performers, most of the top 30 are all around the $200 million Movie Gross vs. Budget by Movie Type Movie Gross vs. Budget by Movie Type Visualization:
  • 220.
    Each dot onthe graph represents a different movie The x-axis represents the genre of movie The left y-axis represents the total gross of the movie A box and whisker plot is overlaid to determine the quartiles for each genre of movie The bars represent the median movie budget of that genre of movie (right y-axis) Reasoning: The main reason for this graph is to compare the median budget to the median gross as well as to compare if this relationship varies based on the genre Movie Gross vs. Budget by Movie Type Movie Gross vs. Budget by Movie Type Conclusions: Adventure movies have the highest statistical measures Highest median, 75% quartile and max However adventure movies also have the highest median budget The median budget exceeds the median gross implying adventure movies can be risky
  • 221.
    The two riskiestcategories (Adventure and Action) also have the highest earning potential. Least risky movies are Romantic Comedies and Musicals as their median budget is less than the 25% quartile of their overall gross However the upside of these movies is minimal Distributors Gross by Genre/Rating and Season Releases Distributors Gross by Genre/ Rating and Season Releases Visualization: This dashboard features two graphs Graph 1: Shows total distributor gross as the height of each bar The bar is split by the genre of the film Graph 2: Shows the percentage of movies released during each season based on genre Both graphs are controlled by the filter which allows control for the MPAA rating of the movies included in both graphs Reasoning:
  • 222.
    This dashboard willinteractively allow for the inspection of different distributors based on MPAA rating to see if there is a correlation between different distributors and different types of movies. The second graph will permit observations regarding when different types of movies are released and if they follow traditional assumptions Distributors Gross by Genre/ Rating (All) and Season Releases Distributors Gross by Genre/ Rating (G) and Season Releases
  • 223.
    Distributors Gross byGenre/ Rating (PG) and Season Releases Distributors Gross by Genre/ Rating (PG-13) and Season Releases Distributors Gross by Genre/ Rating (R) and Season Releases Distributors Gross by Genre/ Rating and Season Releases Conclusions: Overall, the WB was the highest grossing distributor fueled primarily by their PG13 movies They also have the highest total grossing R movies as well by
  • 224.
    are closely matchedwith Universal Paramount has the highest grossing PG movies while the WB is only 6th on the list PG movies are heavily dominated by Adventure type movies while R movies are dominated by Comedy movies There are only a small handful of G movies released every year In general, Adventure movies (the blockbusters) are released during the Spring and Summer periods Drama movies are most prevalent during the Fall and Holiday seasons which coincide the typical Oscar release dates for films $0M$50M$100M$150M$200M$250M$300M$350M$400M$450 M$500M$550M$600M$650M Gross $0M $20M $40M $60M $80M $100M $120M $140M $160M $180M $200M $220M O p e
  • 225.
    n i n g G r o s s Cars 2 Brave Dr. Seuss'The Lorax Kung Fu Panda 2 Puss in Boots Captain America: The First Avenger Cowboys & Aliens Green Lantern Harry Potter and the Deathly Hallows: Part II MIB 3 Mission: Impossible - Ghost Protocol Pirates of the Caribbean: On Stranger Tides Sherlock Holmes: A Game of Shadows The Amazing Spider-Man The Avengers The Dark Knight Rises The Help The Hunger Games The Twilight Saga: Breaking Dawn, Part 1 Thor Transformers: Dark of the Moon Paranormal Activity 3 MPAA Rate G PG PG-13
  • 226.
  • 227.
  • 228.
  • 229.
  • 230.
  • 231.
  • 232.
  • 233.
    30.0% 12.5% 50.0%37.5% 18.2% 23.1% 12.5% 50.0% 15.4% 8.3% 9.1% Average Yearly Gross 18.2% 33.3% 10.0% 25.0% 30.8% 50.0% 7.7% 7.1% AverageYearly Gross 7.1%50.0% Avg. 3D Percentage Measure Names Avg. Gross Zac Efron $274M Will Smith $179M Vin Diesel $210M Tom Cruise $209M Shia LaBeouf $352M Robert pattinson $340M
  • 234.
    Robert Downey Jr. $809M RayRomano $158M Owen Wilson $244M Matt Damon $214M Mark Wahlberg $284M Kristen Wiig $169M Kelly Macdonald $234M Jonah Hill $169M Johnny Depp $457M Jesse Eisenberg $181M Jennifer Lawrence $408M James McAvoy $193M James Franco $195M Jack Black $165M Emma Stone $170M Daniel Radcliffe $435M Daniel Craig $224M Christian Bale $442M
  • 235.
    Chris Hemsworth $181M Chris Evans $177M BradleyCooper $344M Ben Stiller $250M Andrew Garfield $261M Adam Sandler $214M 0.0%100.0% Avg. Sequel Status Genre AdventureActionThriller/SuspenseComedyRomantic ComedyDramaHorrorMusical $0M $100M $200M $300M $400M $500M $600M $700M G r o s s $0M $100M $200M $300M $400M $500M
  • 236.
  • 237.
  • 238.
  • 239.
  • 240.
  • 241.
  • 242.
  • 243.
  • 244.
  • 245.
  • 246.
  • 247.
  • 248.
  • 249.
  • 250.
  • 251.
  • 252.
  • 253.
  • 254.
  • 255.
    Null G PG PG-13 R Chats idea: 1. Statelevel expenditures: timeline 2000-2013 totals and how the increased & changed over time 0. Map for the states by county with highest veteran rate. Comparing unique patient 0. GOE & Construction (Dashboard) 0. AZ chart, compares other areas with same population 0. Progression of time???? Increase in veterans etc. Data link: https://catalog.data.gov/dataset/geographic-distribution-of-va- expenditures-fy2013 data descriptions and information Unique patient: “A unique patient means that even if a patient is seen multiple times during the EHR reporting period they are only counted once." GOE: n expense incurred in carrying out an organization's day- to-day activities, but not directly associated with production. Operating expenses include such things as payroll, sales commissions, employee benefits and pension contributions, transportation and travel, amortization and depreciation, rent, repairs, and taxes.
  • 256.
    Introduction Each Fiscal Year(FY), the Department of Veterans Affairs’ (VA’s) Office of Policy and Planning (OPP) publishes the Geographic Distribution of VA Expenditures (GDX) report. This report provides the estimated dollar expenditures for major VA programs at the state, county, and Congressional District levels. Expenditure data are grouped by the following categories: Compensation and Pension, Education and Vocational Rehabilitation and Employment, Insurance and Indemnities, Construction, General Operating Expenses, Loan Guaranty, and Medical Care. Veteran population estimates at the state, county and Congressional District level and the number of unique patients who used VA healthcare services are also included in the report. The following information provides a brief description of the data included in the report, the methods used for data collection, and the sources of the data. Veteran Population As of FY 2012, the estimated Veteran population data by state and county are based on the VA VetPop2011 model. This model is VA’s source for official estimates and projections of the Veteran population. Compensation and Pension The Compensation and Pension (C&P) category includes expenditures for the following categories: compensation payments, pension payments, Dependency and Indemnity Compensation, and burial allowances. Most expenditures reported in this category reflect monthly payments made to individuals. Retroactive payments and one-time payments are also included. Data is obtained from USASpending.gov. Education and Vocational Rehabilitation and Employment Education and Vocational Rehabilitation and Employment (E&VRE) are separate programs, but are combined into one category for display purposes in GDX. Expenditures in this category include: automobile and adaptive equipment, specially adapted housing, Survivors’ and Dependents’ Educational
  • 257.
    Assistance (Chapter 35),Vocational Rehabilitation for Disabled Veterans (Chapter 31), Post-Vietnam Era Veterans’ Educational Assistance (Chapter 32), Montgomery G.I. Bill for Selected Reserves (Chapter 1606), Reserve Educational Assistance Program (Chapter 1607), Montgomery G.I. Bill (Chapter 30), and Post-9/11 Veterans Educational Assistance (Chapter 33). Expenditure data for E&VRE are also obtained from USASpending.gov. Insurance and Indemnities The data reported for this category are provided by the VA Regional Office and Insurance Center (RO&IC) in Philadelphia, Pennsylvania. This category consists of VA expenditures for death claims, matured endowments, dividends, cash surrender payments, total disability income provision payments, and total and permanent disability benefits payments. It includes Veterans Group Life Insurance, National Service Life Insurance, Service Disabled Veterans Life Insurance, United States Government Life Insurance, Veterans Reopened Insurance, and Veterans Special Life Insurance. It does not include Traumatic Injury Protection Under Servicemembers' Group Life Insurance, Family Servicemembers' Group Life Insurance, or Servicemembers' Group Life Insurance. The RO&IC provides OPP with monthly extracts of payments to recipients by zip code for the purposes of aggregating these monthly payments by state, county, and Congressional District. Construction and Related Costs The Construction expenditures category includes funding for Major Projects, Minor Projects, Grants for Construction of State Extended Care Facilities, and Grants for Construction of State Veterans Cemeteries. The source of the Construction data is the Financial Management System (FMS). General Operating Expenses General Operating Expenses (GOE) represent the costs necessary to provide administration and oversight for the benefits provided by VA. This includes costs for overhead and
  • 258.
    human resources. Thiscategory does not include payments made directly to beneficiaries. The source of the GOE data is FMS. Loan Guaranty Prior to FY 2008, Loan Guaranty expenditures were included in the E&VRE category. Currently, all Loan Guaranty expenditures are attributed to Travis, Texas, where all payments are processed. VA will continue to improve data collection for future GDX reports to better distribute loan expenditures at the state, county and Congressional District levels. Medical Expenditures Medical expenditures data come from both the Allocation Resource Center (ARC) and FMS. The specific programs reported for this category are: medical care, General Post Fund, medical and prosthetic research, and miscellaneous accounts. Unique Patients The count of unique patients is based on the home residence of the patient. The number of patients, along with associated county and Congressional District codes, are provided by the ARC. SCM 315: Visualization Project Rubric 1 Background: The purpose of this project is to introduce you to Tableau and its various capabilities. As a group, you are to find your own set of data and you will create five different graphs/dashboards that each relate to the same topic. You will present your work to your lab session as well as submit an annotated PowerPoint presentation
  • 259.
    that fully detailsyour work. Data Requirements: You are not permitted to use data from: Otherwise, data can come from any source you wish. All graphs and dashboards must relate to a common topic. This topic can be as broad or as narrow as your group wants. For example, you can have a project which focus on only one sports team/season or you can have a project that covers an entire league over multiple years. Common topics include sports, movies, universities, Olympics, demographics, crime statistics, and global economic indicators. You can combine data from different sources if needed. Visualization Requirements: As a group, you must create five graphs or dashboards. Each graph must ensure the following: l
  • 260.
    has a professionallook Each dashboard must ensure the following: Excel graphs legends, etc. and they each have a professional look Across all the graphs, you must ensure the following: interactive component controlled from the dashboard. to make a dashboard) can be of the same type. For example, at most two of the standard graphs (not graphs in the dashboard) can be bar graphs even if you use a basic bar graph in a dashboard somewhere else. changing only one element example, you don’t graph the count of children in each US state, you graph the percentage of children in each US
  • 261.
    state) example, if yougraph a map of the US, do not zoom out to take a full screenshot of the 48 states, Alaska, and Hawaii. This creates a lot of blank, unused space. Instead, take three separate screenshots). SCM 315: Visualization Project Rubric 2 Presentation Requirements: Your team will provide a 5 minute presentation. You are recommended to use a PowerPoint presentation with the following slides: graph/dashboard For any interactive graphs/dashboards (e.g. ones which use the “Page” feature or dashboard with a filter which would like to demonstrate), you are allowed to switch from PowerPoint (or
  • 262.
    similar software) toTableau when you present to show the interactivity. Therefore, a group member must bring a computer to use during the presentation and they must ensure they can open all files/graphs. One of the most important aspects of the presentation is the 5 minute time limit. We must fit in every presentation (8 to 9) in only one lab session so if you have to cut out some key details (such as an additional conclusion from your graph), that is fine. The grader either will ask during the Q&A session after your presentation if something is unclear or will be able to read it in the ‘Annotated PowerPoint’ (see the next section). IMPORTANT: For either the Presentation or Annotated PowerPoint, do not alter the height/width ratio of figures/graphs/dashboards. Annotated PowerPoint Requirements: Starting from the PowerPoint created for the presentation, create the following Annotated PowerPoint. This file will just serve as a hard-copy version of your presentation. It should contain the following (some of which is the same as your presentation PowerPoint). m Name, Names of Team Members)
  • 263.
    o Explanation ofdata sources (use citations) o Explanation of information obtained from each data source o Explanation of any data your team excluded from your analysis er visualizations (more can be used if needed) o Explanation of visual and why you selected that visualization type o Visualization o Observations/conclusions you obtain from that visualization An important aspect of this project is identifying any obvious or easily evident patterns, trends, and conclusions in each graph. If there is anything that stands out which you do not state as a conclusion, points will be deducted. It is highly recommended to be as thorough as possible on the annotated powerpoint. SCM 315: Visualization Project Rubric 3 General Expectations: The project is due by 11:59 PM the day before your Week 6 lab session. The annotated
  • 264.
    PowerPoint is theonly document that will be submitted. Grading will be determined as follows: graded based on its complexity (beyond Excel), its use of proper axis/legends/number formats, its professionalism, and your ability to indicate any obvious conclusions/trends/patterns. Each dashboard will be graded based its use of proper axis/legends/number formats, its professionalism, and your ability to indicate any obvious conclusions/trends/patterns on your ability to stay within the five minute time limit and graded based on following the rules/guidelines provided in the “Annotated PowerPoint Requirements” section of the rubric. ’s ability to follow the other rules listed under “Visualization Requirements” is worth 25 points. Frequently Asked Questions: What are common topics for the project?
  • 265.
    There are alot of common topics students use on this project. They include sports, census data, college data, movies, crime statistics, and demographic data. There is no restrictions on the data you can use and there is no limit/requirement on the scope. For instance, you can have an entire presentation on football worldwide or a presentation on one player or match. If you are having trouble thinking of a topic, focus instead on looking up data sources and using your favorite from what you find. Can I ask the TA if this is a good topic? You can ask, but the only criteria for a good topic is whether or not the data exists for that topic. If you think you have enough data, try to make the visualizations. If you can't make 5 which fit all the requirements, try to find more to add to your existing data set. When I make a graph and add labels, why are not all of the labels showing up? Tableau adds labels and tries to fit as many as it can such that the labels do not overlap. You do have some control over this, but I recommend just letting the default options control the displayed labels. Only change it if you really need certain labels to be shown
  • 266.
    on the visualization. Howdo I zoom on maps? There are control in the upper left of the screen to zoom in and out of maps. However, these jumps in zoom tend to be quite dramatic. On a PC, you can hold the CTRL key and scroll to have finer control over the zooming. SCM 315: Visualization Project Rubric 4 What are examples of "beyond Excel"? Simple bar, line, scatter, and pie charts are not permitted. You have plenty of options to modify your graphs to make it go beyond Excel (adding colors or size differences, making multiple simple graphs into an appropriate dashboard, etc.). Do we have to have one conclusion per visualization or one overall conclusion for the project? You should have at least one conclusion per visualization (see
  • 267.
    the sample annotated PowerPoint).However, the annotated PowerPoint can contain any conclusions/discussions you would like so long as they are supported by the graph/dashboard. You are encouraged to be thorough to ensure you don’t miss any obvious patterns, trends, and conclusions. How do we share files between group members? To share Tableau files, you have to send the Tableau file (.twb) as well as the data it is based off of. This is either the Excel file (if you chose to "Connect Live") or the Tableau Data Extract(.tde - if you told Tableau to save its own version of the data). How do I get visuals into PowerPoint? In the top menu, there are two drop down menus (one for Worksheets and one for Dashboards). Whichever you are trying to insert into Powerpoint, select the appropriate menu and there is a copy feature. You can then paste this image into PowerPoint for professional images. How can we get feedback on our visualizations?
  • 268.
    If you wantfeedback, either come see me in office hours or send screenshots of your visualizations via email. If you send them via email, note I will not go in depth on my feedback. DO NOT send me .twb files via email. I can't open these files unless you send the data as well and I am not going to be opening and analyzing such workbooks via email. Are the annotated PowerPoint and presentation two seperate documents? Yes, your annotated PowerPoint and presentation are two separate files. The annotated PowerPoint should be much longer and text based than the presentation file. The presentation file should simply be one or two introduction slides and then one or more slides per visualization with minimal text. SCM 315: Visualization Project Rubric 5 If we use the page feature, how should we present that in the presentation and annotated PowerPoint?
  • 269.
    If you usethe page feature, you can open Tableau while presenting to show the animation. In your annotated PowerPoint, copy and paste each 'page' into the annotated PowerPoint document. There is not limit to the annotated PowerPoint length so this shouldn't be a problem. If this will make your annotated PowerPoint extremely long, talk with the instructor about how to show the page visualization in the annotated PowerPoint.