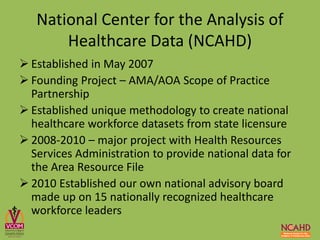
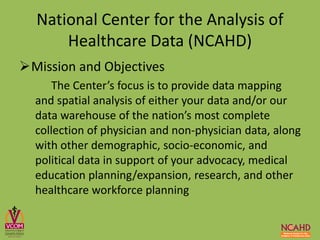
The National Center for the Analysis of Healthcare Data (NCAHD):
- Established in 2007 to provide data analysis and mapping of healthcare workforce data to support advocacy, research, and planning.
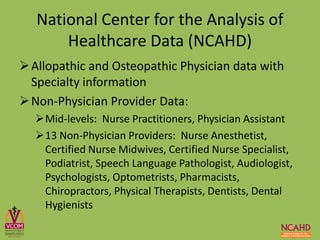
- Maintains a large database of physician and non-physician provider data from state licensure records along with demographic data.
- Provides data analysis, mapping, and other services to over 200 clients including medical schools, hospitals, and state/national associations.
The document provides demographic data for states and counties in the US, including total population, percentage of population born in the US, percentage who are not US citizens, and percentages of population living in the US for less than 10 years. It shows that states on the west coast like California and states in the northeast like New York have lower percentages of population born in the US and higher percentages born abroad compared to other states. At the county level, it provides similar data for counties in Hawaii, showing Honolulu County has a lower percentage of population born in the US compared to other Hawaii counties.
Covid 19 cases per day per 100,000 popylation 5-15-2020James Orr
More weekly update. Focused on average new cases per week, change in cases per week, and average new cases per week per 100,000 population. Provides graphs on six "no doing well states" and detail data in tabular form on all states
U.S. Presidential Election 2016 Popular Vote StatisticsJeremy Shih
- The document provides the official 2016 presidential election results for all 50 U.S. states and the District of Columbia, comparing votes for Clinton, Trump, and others as well as margins from the 2012 election.
- Thirteen states are identified as "swing states" that were decided by less than 5% or flipped from Democratic to Republican or vice versa between elections. Clinton won the national popular vote by over 2 million votes but Trump won the electoral college.
- Clinton received the majority of votes in the non-swing states, totaling over 44 million votes compared to Trump's 40.7 million. However, Trump won the majority of swing states, totaling over 22 million votes to Clinton's 21.4 million.
The document shows demographic data for the total population and racial groups of the United States, each state, Hawaii counties, and selected Hawaii census-designated places. It provides percentages for the white population, black population, Native American/Alaskan Native population, Pacific Islander population, and other racial groups for each geographic area.
This document outlines an evaluation process for a program called the Spring Branch Coalition of the Coalition of Behavioral Health Services Drug Free Communities Grant Project. It defines the target community as north of I-10 in Spring Branch and the target population as adolescents ages 12-17. Data is presented from the 2008 Texas School Survey of Substance Use to assess substance use, age of onset, perceived parental disapproval and risk for the target population. Rates are shown for Spring Branch ISD, Region VI and a local survey to plan strategies.
iHT² Health IT Summit New York - Cancer Care Ontario Presentation "Transforming Data into Meaningful Information to Support Improved Patient Care"
Presentation "Transforming Data into Meaningful Information to Support Improved Patient Care"
Learning Objectives:
∙ Understand the information imperative for Cancer Care Ontario (CCO), one of the largest provincial health organizations in Canada, as it supports
population-based care co-ordination and administration for 3 clinical domains in the province of Ontario: cancer care, renal care, and access to
care
∙ Learn how the organization built the Informatics Centre of Excellence to better enable the acquisition, management, reporting, and analysis of one
of the broadest and richest data sets in the country
∙ Discuss concrete examples of how CCO has used leading-edge analytic techniques to drive health system performance.
Vickie Welch
Director, Informatics Centre of Excellence
Cancer Care Ontario
Hakim Lakhani
Director, Reporting and Analytics, Informatics Centre of Excellence
Cancer Care Ontario
Latest Projection Of Cases By State For Next 15 Day.
Average growth abut 30 % per day (expect to be lower).
Uses average growth per day from 3-21 to 3-28 to project ahead 14 days.
El documento describe una herramienta llamada Cuadernia que permite crear libros digitales y materiales educativos multimedia de forma sencilla para apoyar el aprendizaje. Fue desarrollada en Castilla-La Mancha para facilitar que los profesores creen contenido sin necesidad de conocimientos informáticos avanzados. La herramienta ofrece una interfaz simple y permite incluir contenido multimedia e interactivo para hacer el aprendizaje más dinámico y entretenido.
La herramienta permite crear libros digitales educativos de forma sencilla para apoyar el aprendizaje. Los profesores pueden elaborar material multimedia e incorporar actividades de manera dinámica sin necesidad de conocimientos informáticos avanzados. Los estudiantes pueden acceder a los contenidos de manera atractiva y visual para aprender jugando.
Ganesh Devadiga is seeking a position that utilizes his 9 years of experience in the banking sector. He currently works as an Associate Manager of Digital Banking at Indusind Bank, where he handles customer queries and transactions via video calls. Previously, he worked at HSBC and ADFC Pvt Ltd as a Customer Service Executive, resolving issues for various accounts. He has received multiple awards for his performance and customer service. Ganesh holds a B Com degree and is computer literate with skills in Microsoft Office, internet, and email.
The document presents a study on laminated fibre-reinforced composite materials. It investigates the behaviour of laminate configurations with different ply orientations. It examines the concept of an equivalent isotropic laminate for material selection. Strength design is considered by analyzing through-thickness stress distribution, σx, of laminates with isotropic stiffness properties and stress variation with angle ply orientation. Mechanical and thermal behaviours under load are also analyzed.
La física estudia los fenómenos naturales buscando describirlos y comprender las leyes que los rigen. Surge de la filosofía natural y se divide en física clásica y moderna. La física clásica incluye mecánica, termología, óptica y electromagnetismo, mientras que la física moderna incluye física cuántica y relativista. Ambas áreas coexisten y se aplican dependiendo del sistema estudiado.
This document presents a computational analysis of the structural components and behavior of flexible aircraft. It describes a MATLAB code used to determine natural frequencies and loads of a cantilever wing with stores in different spanwise positions. The code calculates natural frequencies from mass and stiffness matrices. Basis functions are used to represent bending and torsional modes. Validation shows computed torsion frequencies match experimental data, while bending frequencies have some offset. Parameters like store mass and position are investigated and found to affect natural frequencies.
Michael T. Murphy is seeking an account manager position where he can utilize his skills and experience. He has over 20 years of experience in oilfield services including managing accounts valued at over $175 million. He has held roles such as account manager, district sales representative, operations supervisor, and frac field supervisor. Murphy has extensive experience in frac and cement applications and safety initiatives.
Las magnitudes físicas pueden ser escalares o vectoriales. Los vectores se pueden representar usando diferentes sistemas de coordenadas como cartesianas o polares, y pueden sumarse, restarse, ponderarse y descomponerse en componentes dependiendo del sistema de referencia.
This document provides demographic data on substance abuse treatment admissions across various agencies in Michigan for fiscal year 2012. It includes information on gender, age, race/ethnicity, primary substance reported, education level, employment status, income, and living arrangements for 61,093 total admissions. For each agency, the percentages of clients in different demographic categories are shown, along with the total number of admissions for that agency. Statewide demographic percentages are also provided at the bottom.
This document provides demographic data on substance abuse treatment admissions across various agencies in Michigan for fiscal year 2012. It includes information on gender, age, race/ethnicity, primary substance reported, education level, employment status, income, and living arrangements for 61,093 total admissions. For example, 60.4% of admissions were male, 52.5% were between ages 18-35, 69.3% were white, 38% reported alcohol as their primary substance, 60.4% had less than a high school education, 60.4% were unemployed, and 62.5% lived independently. The document also includes data on involvement with the criminal justice system, with 54.2% of admissions reporting some type of
This document summarizes data from SK&A on physician access to drug and device sales representatives from 2009 to 2014. It finds that the percentage of physicians permitting access has declined from 77.1% in 2009 to 68.1% in 2014. It also analyzes trends in access by specialty, state, office size, daily patient volume, ownership, region, and metropolitan statistical area. Appointment requirements have also increased over this period. The data is based on telephone surveys of over 700,000 physicians across the United States.
This report shows the market activity for home sales in the Dallas/Ft. Worth area including number of sales, list price and county averages and adjustments.
The document discusses obesity rates among people with and without disabilities. It finds that in all states, obesity rates are higher for those with disabilities, indicating inequities in health promotion. Public health professionals are encouraged to include disability data in surveillance efforts and ensure people with disabilities are included in health programs. Tables of data from all US states and territories show the prevalence of obesity is an average of 13.8 percentage points higher among those with disabilities.
Criteria to begin relaxing social distancing revision AJames Orr
Latest weekly update (on weekend) of my projection of the number of Coronavirus case per day by state. Prior predictions modeled following three weeks. Mode VII two weeks ago and Model IX on week ago appear as accurate as randomness in data allows, or new pockets of outbreaks. This version looks at where states are at plateauing or being pose peak new cases per day. Also looks at criteria to begin to relax social distancing guidelines. Revision A corrects Alaska (missing a 0) and Nevada population (one extra 0).
This document provides demographic data for regions and counties in the United States and Hawaii, including population sizes, percentages of residents with high school diplomas and bachelor's or post-graduate degrees across different age groups. The data shows variations across regions and counties in educational attainment levels, with the Northeast generally having the highest percentages of residents with degrees and some rural Hawaiian counties having the lowest.
This document is a summary of the 2014 National Bridge Inventory from the U.S. Department of Transportation. It ranks the states by the total number of structurally deficient bridges and by the percentage of bridges that are structurally deficient. Pennsylvania has the most structurally deficient bridges at 5,050, representing 22.3% of its total bridges. Rhode Island has the highest percentage of structurally deficient bridges at 22.7%, with 174 out of 766 bridges being structurally deficient. Overall, there are over 608,000 bridges in the U.S. and approximately 61,000 or 10% are currently structurally deficient.
This document presents data on the percentage of workers aged 16 and over in each US state who commute longer than 30 minutes, 45 minutes, and 60 minutes to work, excluding those who worked from home. Maryland, New York and New Jersey had the highest percentages of workers with commutes longer than 30 minutes, while New York, Maryland and West Virginia had the most commutes over 45 minutes. New York and Maryland also topped the rankings for longest commutes over 60 minutes.
Copy of Dm and ADM KPR Report_January14YTD (1)Niki Appleman
This document contains a performance summary of 40 district managers across various regions. It provides rankings for each manager in six key performance metrics including sales, profitability, and total points. The metrics are weighted to calculate an overall total ranking, with the top performer being Dana Braunschweigere from the East Military/Outlet District receiving a total of 4.6 points. The company-wide averages for sales and profitability are also provided for comparison.
Sequencing 60,000 Samples: An Innovative Large Cohort Study for Breast Cancer...QIAGEN
This slidedeck focuses on the design of a large cohort study for assessing breast cancer risk and how an innovative digital sequencing approach is able to solve the previously unmet challenges of this type of NGS study design. Our speaker, Dr. Fergus J. Couch of the Mayo Clinic, presents on the design of this NCI-funded project, which comprises the sequencing of 60,000 samples to assess the risk of breast cancer through association with targeted genes. The design and size of the study requires an accurate, robust and high-throughput sequencing method. The investigators are using a digital DNA sequencing approach from QIAGEN that incorporates molecular barcodes to tag and remove PCR duplicates and increase NGS assay sensitivity. The approach also uses proprietary chemistry that enables uniform sequencing to efficiently utilize sequencing power and deliver optimized results.
The document shows data on educational attainment levels for adults aged 25 and older in each U.S. state. It provides the percentage of adults with a high school diploma or higher, percentage with a bachelor's degree or higher, and percentage with a postgraduate degree or higher for each state. Minnesota ranks highest for percentage with a high school diploma, Massachusetts ranks highest for percentage with a bachelor's degree or higher, and Massachusetts also ranks highest for percentage with a postgraduate degree or higher. Mississippi ranks lowest across all three educational attainment levels.
This document provides data on language abilities in the United States, including percentages of the population that speak English only, speak English very well, and other languages very well, for each state and several counties in Hawaii. It shows that over 80% of the US population speaks only English, with percentages varying from 44.7% to 97.7% across different states and Hawaiian counties. English proficiency is highest nationwide and in many states, while other languages like Spanish, Chinese, and Tagalog have higher percentages of fluent speakers in some states and regions compared to nationwide averages.
Making cardiovascular risk reduction happen in primary care final diabetes ukTony Willis
Slides from opening plenary at Diabetes UK, 14th March 2018, London: "Cardiovascular risk reduction in diabetes: Maximising patient benefits"
This is some of the output over the last few years of the North West London Diabetes Transformation Team, demonstrating that urban deprivation doesn't need to be a barrier to improvements in care (as shown elsewhere including Tower Hamlets).
The document shows data on the percentage of workers aged 16 and over who did not work from home in each US state. It provides this data for three time periods: before 6am, before 7am, and before 8am. For each time period and state, it also includes the state's rank among all states for that time period. At 6am, Hawaii had the highest percentage of workers not working from home at 20.4% and was ranked 1st. At 7am, Alabama had the highest percentage at 44.5% and was ranked 1st. And at 8am, Mississippi had the highest percentage at 69.1% and was ranked 1st.
Adding complexity to an already difficult task monitoring the impact of the a...soder145
This document discusses research comparing Medicaid enrollment counts from the American Community Survey (ACS) and Centers for Medicare and Medicaid Services (CMS) administrative data before and after the implementation of the Affordable Care Act. It presents data showing larger increases in enrollment and larger differences between ACS and CMS counts in states that expanded Medicaid compared to non-expansion states. Tables and figures analyze enrollment changes from 2013 to 2014 and differences between ACS and CMS counts for states with the largest and smallest enrollment increases. The findings suggest misreporting of Medicaid coverage in surveys may have increased more in expansion states post-ACA.
April 2014 Local Neighborhood Housing Resale Statistics Honolulu Board of REALTORS® presents the April 2014 Local Market Update consisting of the detailed neighborhood analysis.
The document shows data on digital magazine subscriptions from June 2012 to December 2012 and June 2013. It indicates that during this period:
- Digital magazine subscriptions across the top 10 publications increased 60% from around 150,000 in June 2012 to around 250,000 in December 2012.
- Across all magazine categories, digital subscriptions increased 46% between January 2013 and June 2013, with some categories like crafts and hobbies increasing over 200%.
- Data on digital newsstand sales across different platforms shows Apple iPad newsstand selling the most magazines, followed by Google Play and Amazon Kindle newsstand.
The document compares owner-occupied and renter-occupied housing units in the United States, Hawaii, and various counties and communities in Hawaii using data from the 2009 American Community Survey and 2000 Census. Nationwide, owner-occupied units increased slightly while renter-occupied units decreased slightly. In Hawaii, owner-occupied units increased more substantially while renter-occupied units decreased more substantially. Many specific communities in Hawaii saw larger increases in owner-occupied units and larger decreases in renter-occupied units between 2000 and 2009.
This document shows percentages and changes in percentages from 2000 to 2009 of populations identifying as white only, at least part Asian, and at least part Pacific Islander for each US state. For white only populations, percentages decreased in most states but increased in a few like California, Arizona, and New Mexico. Percentages identifying as at least part Asian increased across all states. Percentages identifying as at least part Pacific Islander decreased in most states. Hawaii had the largest non-white populations and highest percentages identifying as part Asian and Pacific Islander.
3. Established in May 2007
Founding Project – AMA/AOA Scope of Practice
Partnership
Established unique methodology to create national
healthcare workforce datasets from state licensure
2008-2010 – major project with Health Resources
Services Administration to provide national data for
the Area Resource File
2010 Established our own national advisory board
made up on 15 nationally recognized healthcare
workforce leaders
National Center for the Analysis of
Healthcare Data (NCAHD)
4. Mission and Objectives
The Center’s focus is to provide data mapping
and spatial analysis of either your data and/or our
data warehouse of the nation’s most complete
collection of physician and non-physician data, along
with other demographic, socio-economic, and
political data in support of your advocacy, medical
education planning/expansion, research, and other
healthcare workforce planning
National Center for the Analysis of
Healthcare Data (NCAHD)
5. Allopathic and Osteopathic Physician data with
Specialty information
Non-Physician Provider Data:
Mid-levels: Nurse Practitioners, Physician Assistant
13 Non-Physician Providers: Nurse Anesthetist,
Certified Nurse Midwives, Certified Nurse Specialist,
Podiatrist, Speech Language Pathologist, Audiologist,
Psychologists, Optometrists, Pharmacists,
Chiropractors, Physical Therapists, Dentists, Dental
Hygienists
National Center for the Analysis of
Healthcare Data (NCAHD)
6. Past/Current Clients (over 200 projects and/or clients in the last eight
years)
• National physicians and non-physician associations (e.g.
American Osteopathic Association, American Medical
Association, Physician Assistant Education Association, etc.)
• Colleges of Medicine (KCUMB-COM, AT Still University,
Vanderbilt, University of Chicago, etc.) and Area Health
Education Associations (state and regional programs)
• Healthcare research institutes and rural health associations (e.g.
NRHA, Robert Graham Center, etc.)
• Hospital Associations, state workforce boards, state provider
associations, state agencies (e.g.Tennessee Hospital Association/
Rural Partnership, West Virginia Rural Health Association)
National Center for the Analysis of
Healthcare Data (NCAHD)
7. • Data Research – aside from our enhanced state licensure
(ESL), we find and process many other state and national
demographic, socio-economic, health indicators, etc. to
support research, proposal development, planning, etc.
• Mapping and Spatial Analysis
• Alumni Tracking – validate school’s existing alumni and/or
find missing alumni; perform analysis on specialty,
proximity to rural and underserved, etc.
• Training on GIS/mapping
• Healthcare workforce economic impact analysis – for
medical schools and entire primary care workforce
• Time Series mapping/data subscription service (Future)
• Internet Mapping Portal Development – current projects
with Tennessee, West Virginia, Arkansas and New York and
the American Osteopathic Association
NCAHD’s Products and Services
9. Per
100,000
Population Average Ratio
Per
100,000
Population Average Ratio
Per
100,000
Population Average Ratio
Family Medicine 28.08 1:3,561 35.54 1:2,814 26.66 1:3,750
Internal Medicine 22.86 1:4,374 13.03 1:7,672 24.73 1:4,043
Pediatrics 12.83 1:7,796 9.63 1:10,389 13.44 1:7,443
Allergy & Immunology 1.17 1:85,737 0.54 1:186,207 1.29 1:77,746
Cardiology 5.51 1:18,140 2.96 1:33,833 6.00 1:16,667
Dermatology 2.80 1:35,762 1.17 1:85,462 3.11 1:32,196
Endocrinology, Diabetes, and Metabolism 1.05 1:95,096 0.36 1:280,334 1.18 1:84,464
Gastroenterology 2.56 1:39,066 1.29 1:77,304 2.80 1:35,702
Hematology & Oncology 3.07 1:32,626 1.54 1:65,078 3.36 1:29,796
Infectious Disease 9.04 1:11,067 5.24 1:19,080 9.76 1:10,247
Nephrology 1.17 1:85,530 0.64 1:155,551 1.27 1:78,775
Neurology 3.04 1:32,913 1.71 1:58,645 3.29 1:30,374
Psychiatry 11.14 1:8,978 5.73 1:17,443 12.17 1:8,219
Rheumatology 0.38 1:262,866 0.19 1:520,620 0.42 1:240,212
Other Specialty 7.44 1:13,448 4.51 1:22,173 7.99 1:12,510
General Surgery 7.30 1:13,700 6.51 1:15,358 7.45 1:13,424
Neurological Surgery 1.34 1:74,867 0.54 1:186,207 1.49 1:67,211
Obstetrics & Gynecology 9.66 1:10,351 6.57 1:15,221 10.25 1:9,757
Ophthalmology 4.26 1:23,499 2.69 1:37,133 4.55 1:21,963
Orthopaedic Surgery 6.92 1:14,459 5.20 1:19,239 7.24 1:13,805
Plastic Surgery 1.48 1:67,412 0.58 1:172,952 1.66 1:60,391
Urology 2.36 1:42,390 1.92 1:52,168 2.44 1:40,929
Other Surgical Specialties 1.22 1:82,180 0.55 1:180,285 1.34 1:74,461
Emergency Medicine 11.07 1:9,035 7.76 1:12,881 11.70 1:8,549
Anesthesiology 10.56 1:9,473 4.75 1:21,057 11.66 1:8,574
Radiology-Diagnostic 9.76 1:10,242 5.52 1:18,112 10.57 1:9,459
Pathology-Anatomic and Clinical 3.89 1:25,718 2.20 1:45,392 4.21 1:23,757
Pediatric Cardiology 0.27 1:366,502 0.05 1:1,822,171 0.31 1:318,095
Pediatric Neurology 0.12 1:836,895 0.06 1:1,546,084 0.13 1:769,644
Other Pediatric Subspecialties 2.28 1:43,956 0.47 1:212,587 2.62 1:38,186
* Ratio's generated after all reported specialties were normalized to ACGME standard definitions and group accordingly. Individual
provider practice location relative to OMB rural and rural population was utilized to create rural and urban ratios.
Medical Specialties
Surgical Specialties
Hospital-Based
Pediatric Subspecialties
Primary Care
Created by NCAHD using National Enhanced State Licensure Data and 2015 Census Population Estimates
ACGME Specialties
National Rural Urban
2015 Physician Specialty Ratios*
10. 2008-2012 Healthcare Workforce Shift
-60.0
-40.0
-20.0
0.0
20.0
40.0
60.0
80.0
100.0
RhodeIsland
Iowa
Utah
NewYork
NorthDakota
Washington
Missouri
NewMexico
Oregon
Hawaii
Alabama
Nevada
Montana
WestVirginia
Arkansas
Indiana
Nebraska
Colorado
Alaska
Kansas
NewJersey
SouthCarolina
SouthDakota
Georgia
Kentucky
Arizona
Tennessee
Massachusetts
Oklahoma
Louisiana
Minnesota
Ohio
NewHampshire
Michigan
Maryland
Mississippi
Virginia
Pennsylvania
Maine
Texas
Illinois
Florida
NorthCarolina
Idaho
Wisconsin
Vermont
Delaware
California
Wyoming
Connecticut
Migration of Primary Care Workforce
between Urban vs Rural per 100,000 population
from 2008 to 2012
Greater Migration
towards Urban
Greater Migration
towards Rural
28
11. 2008-2012 Healthcare Workforce Shift
-10000
0
10000
20000
30000
40000
50000
Migration of Allied Healthcare Workforce
between Urban vs Rural from 2008 to 2012
Greater Migration
towards Urban
Greater Migration
towards Rural
29
15. • Free public access to all of the enhanced state
licensure data
• Visualize the individual providers at a national
and regional level
• Zoom in to see state, county and zip code
aggregates of providers and demographic
information at the total number or percentage
• Users can download the data as a spreadsheet
NCAHD’s Healthcare Workforce
Mapping Portal - Features
Website: http://gis.ncahd.org
23. Demographic Profile of
Florida’s Psychologists
National
• Total Instate Licensed Psychologists = 89,595
• % Change from 2008 = 4%
• Total in Rural Areas* = 8,478
• % of all psychologists serving rural = 10%
State Average = 17%
• Total in Mental Health Professional
Shortage Areas (HPSA) = 16,558
• % of all physicians in Mental HPSA = 19%
State Average = 30%
Florida
2010 NCAHD Enhanced State Licensure
• Total Instate Licensed Psychologists = 3,815
• % Change from 2008 = 7%
• Total/% in Rural Areas* = 148/4%
• State Rank = 44
• Total/% in Florida in Mental HPSA = 537/14%
State Rank = 34
24. • Data Research – aside from our enhanced state licensure (ESL), we
find and process many other state and national demographic, socio-
economic, health indicators, etc. to support research, proposal
development, planning, etc.
• Mapping and Spatial Analysis
• Alumni Tracking – validate school’s existing alumni and/or find
missing alumni; perform analysis on specialty, proximity to rural and
underserved, etc.
• Trend analysis on Physician, NP, PA and 14 other providers at the
county, state and national level
• Healthcare workforce economic impact analysis – for medical
schools and entire primary care workforce
• Future - Time Series mapping/data subscription service
• Internet Mapping Portal Development – current projects with
Tennessee and West Virginia; Ohio and Virginia in discussion phase
Current and Future Research and
Product/Services Development
25. Questions
Ann K. Peton, MPH
NCAHD Director
573-301-9654
apeton@vcom.vt.edu
NCAHD website: www.ncahd.org