Download to read offline
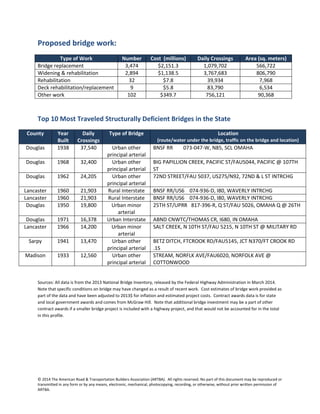

The document summarizes bridge data from Nebraska's 2013 National Bridge Inventory. It finds that 18% of the state's 15,370 bridges are structurally deficient, and 7% are functionally obsolete. Between 2003-2012, $550.9 million in federal funding supported bridge construction and reconstruction projects. The state estimates it would cost $3.7 billion to repair all deficient bridges. The document also lists the top 10 most traveled structurally deficient bridges, including locations and daily crossings.


