Download to read offline
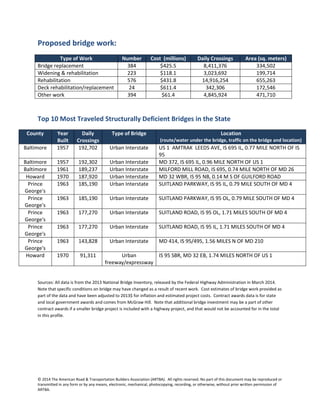

The document summarizes bridge data from Maryland's 2013 National Bridge Inventory. Some key points: - 6% of Maryland's 5,291 bridges, or 333 bridges, are structurally deficient. - 21% of bridges, or 1,085 bridges, are functionally obsolete. - Between 2003-2012, $1.1 billion in federal funding supported construction of 1,198 bridges in Maryland. - The state estimates it would cost $1.6 billion to repair 1,601 deficient bridges.


