
Recommended
More Related Content
What's hot
What's hot (20)
Viewers also liked
Similar to Stat Arb Performance
Stat Arb Performance
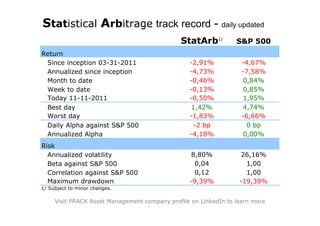
- 1. Statistical Arbitrage track record - daily updated StatArb1/ S&P 500 Return Since inception 03-31-2011 -2,91% -4,67% Annualized since inception -4,73% -7,58% Month to date -0,46% 0,84% Week to date -0,13% 0,85% Today 11-11-2011 -0,50% 1,95% Best day 1,42% 4,74% Worst day -1,83% -6,66% Daily Alpha against S&P 500 -2 bp 0 bp Annualized Alpha -4,18% 0,00% Risk Annualized volatility 8,80% 26,16% Beta against S&P 500 0,04 1,00 Correlation against S&P 500 0,12 1,00 Maximum drawdown -9,39% -19,39% 1/ Subject to minor changes. Visit PRACK Asset Management company profile on LinkedIn to learn more
- 2. 0,80 0,85 0,90 0,95 1,00 1,05 31-Mar 10-Apr 20-Apr 30-Apr 10-May 20-May 30-May 9-Jun Daily Performance 19-Jun 29-Jun 9-Jul 19-Jul 29-Jul 8-Aug 18-Aug 28-Aug 7-Sep 17-Sep 27-Sep 7-Oct 17-Oct 27-Oct 6-Nov S&P 500 16-Nov StatArb 26-Nov Inception date=1 Statistical Arbitrage track record - daily updated
- 3. Statistical Arbitrage track record - daily updated S&P 500 StatArb Best 3 market days1/ 08-09-2011 4,74% -0,28% 08-11-2011 4,63% -0,49% 08-23-2011 3,43% 0,43% Worst 3 market days1/ 08-08-2011 -6,66% 0,39% 08-04-2011 -4,78% 0,74% 08-18-2011 -4,46% -1,35% 1/ since inception date 03-31-2011