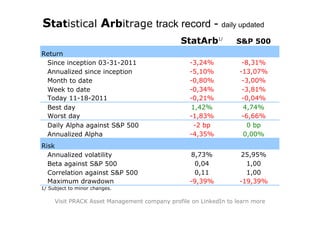
The document summarizes the performance of a statistical arbitrage strategy compared to the S&P 500 index since inception on March 31, 2011. The statistical arbitrage strategy has underperformed the S&P 500 on a cumulative and annualized return basis but with lower volatility, beta, and maximum drawdown. It has experienced negative returns on the S&P 500's best up days but gains on some of its worst down days.
1. Statistical Arbitrage track record - daily updated
StatArb1/ S&P 500
Return
Since inception 03-31-2011 -3,24% -8,31%
Annualized since inception -5,10% -13,07%
Month to date -0,80% -3,00%
Week to date -0,34% -3,81%
Today 11-18-2011 -0,21% -0,04%
Best day 1,42% 4,74%
Worst day -1,83% -6,66%
Daily Alpha against S&P 500 -2 bp 0 bp
Annualized Alpha -4,35% 0,00%
Risk
Annualized volatility 8,73% 25,95%
Beta against S&P 500 0,04 1,00
Correlation against S&P 500 0,11 1,00
Maximum drawdown -9,39% -19,39%
1/ Subject to minor changes.
Visit PRACK Asset Management company profile on LinkedIn to learn more