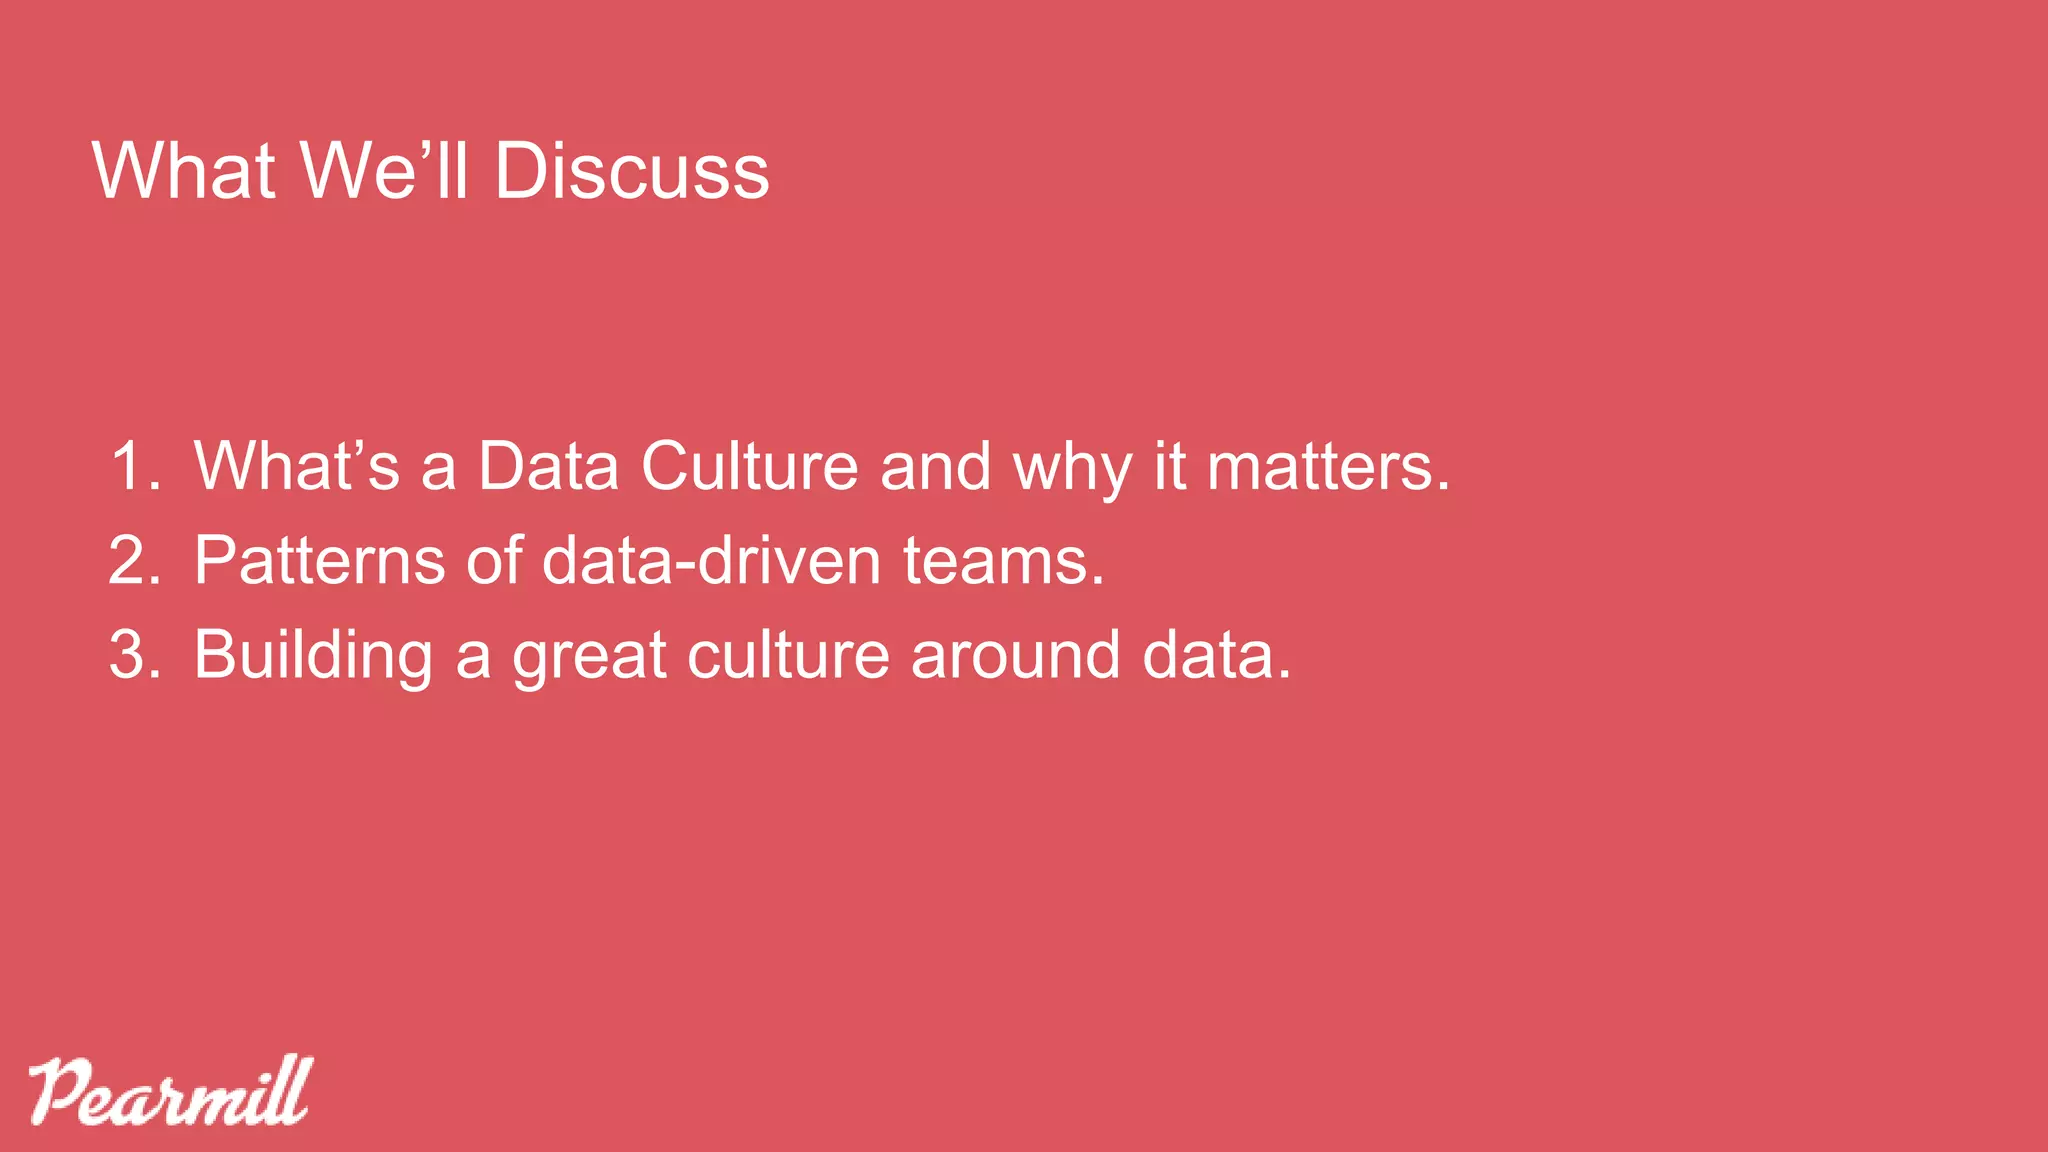
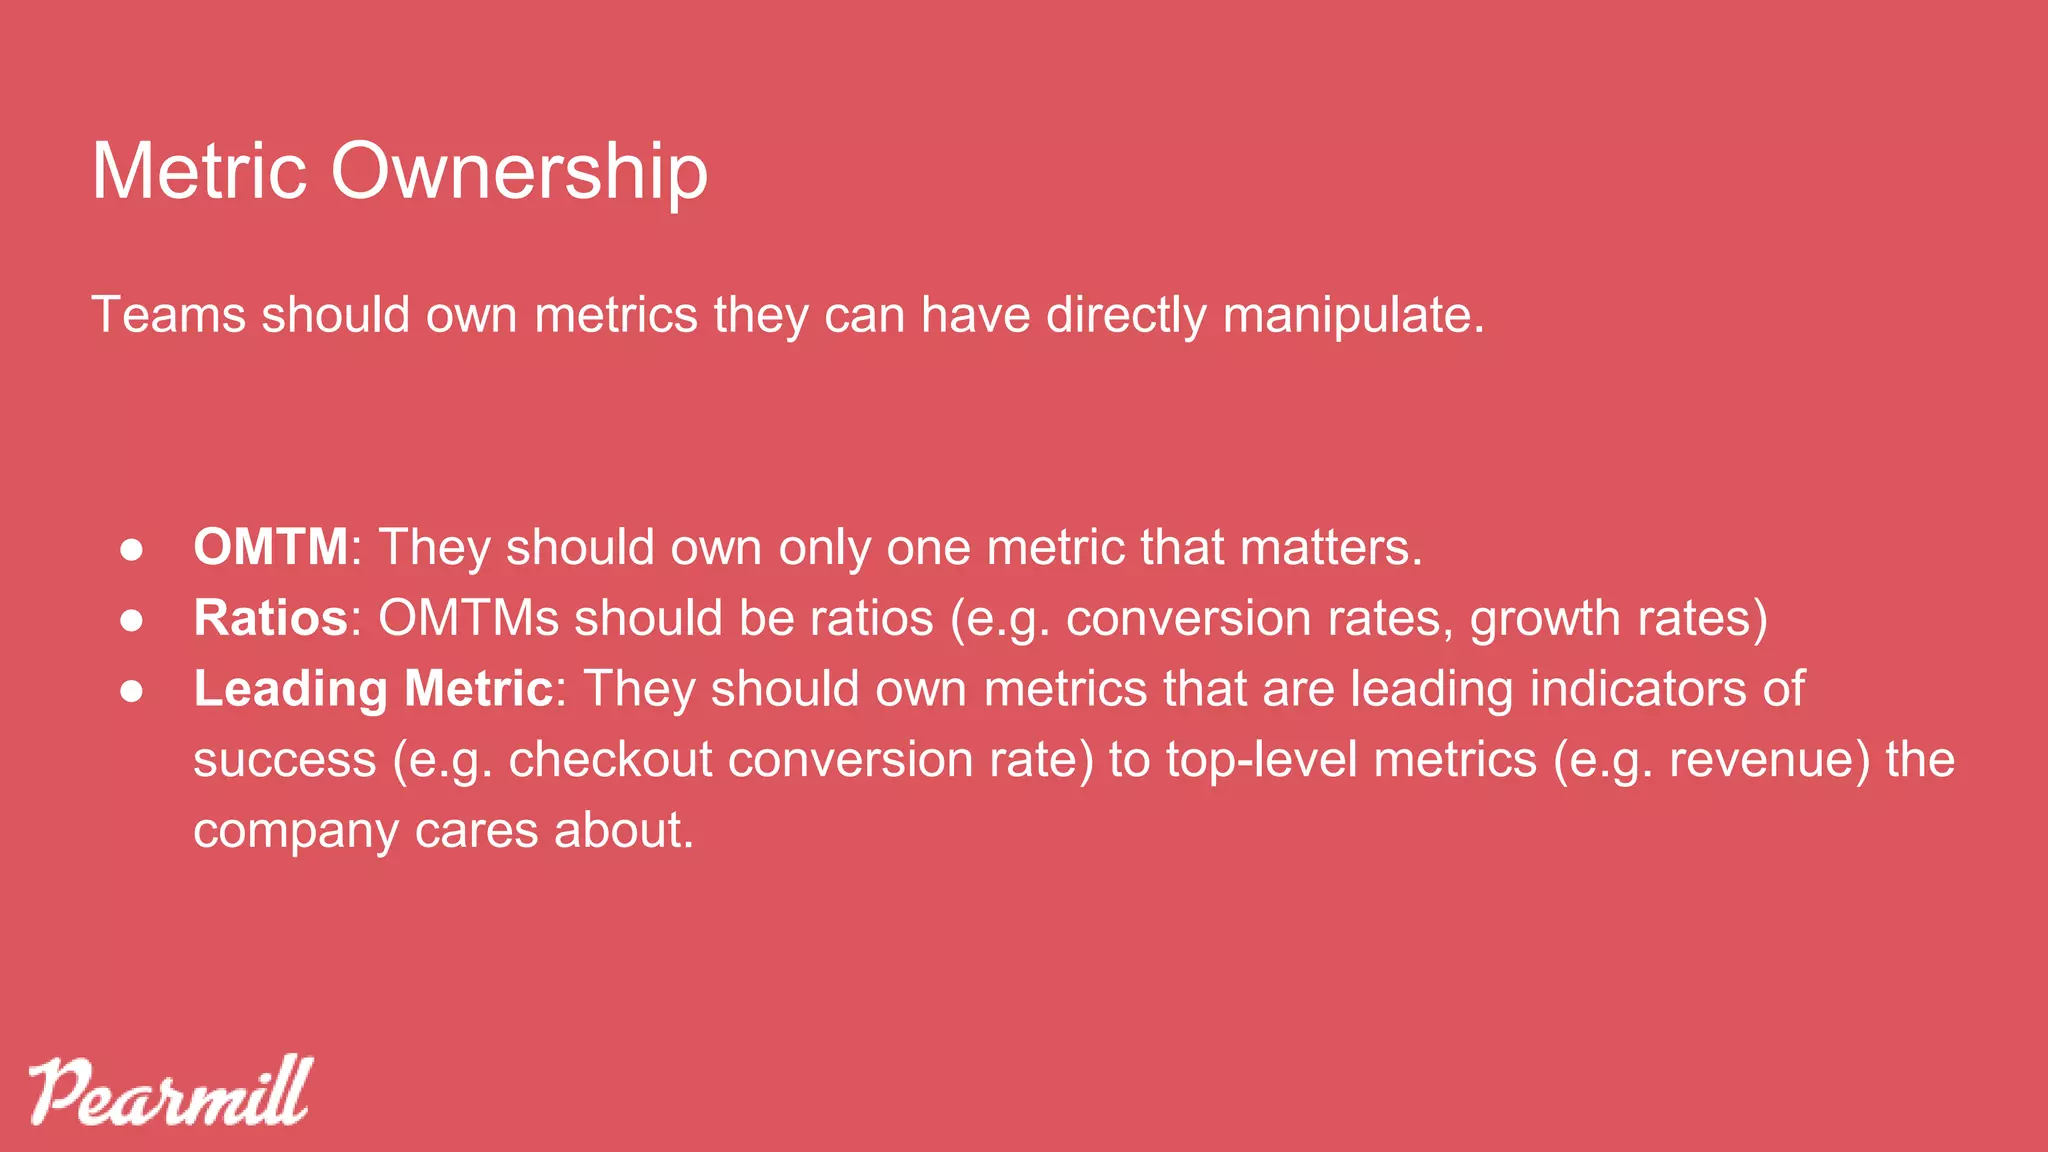
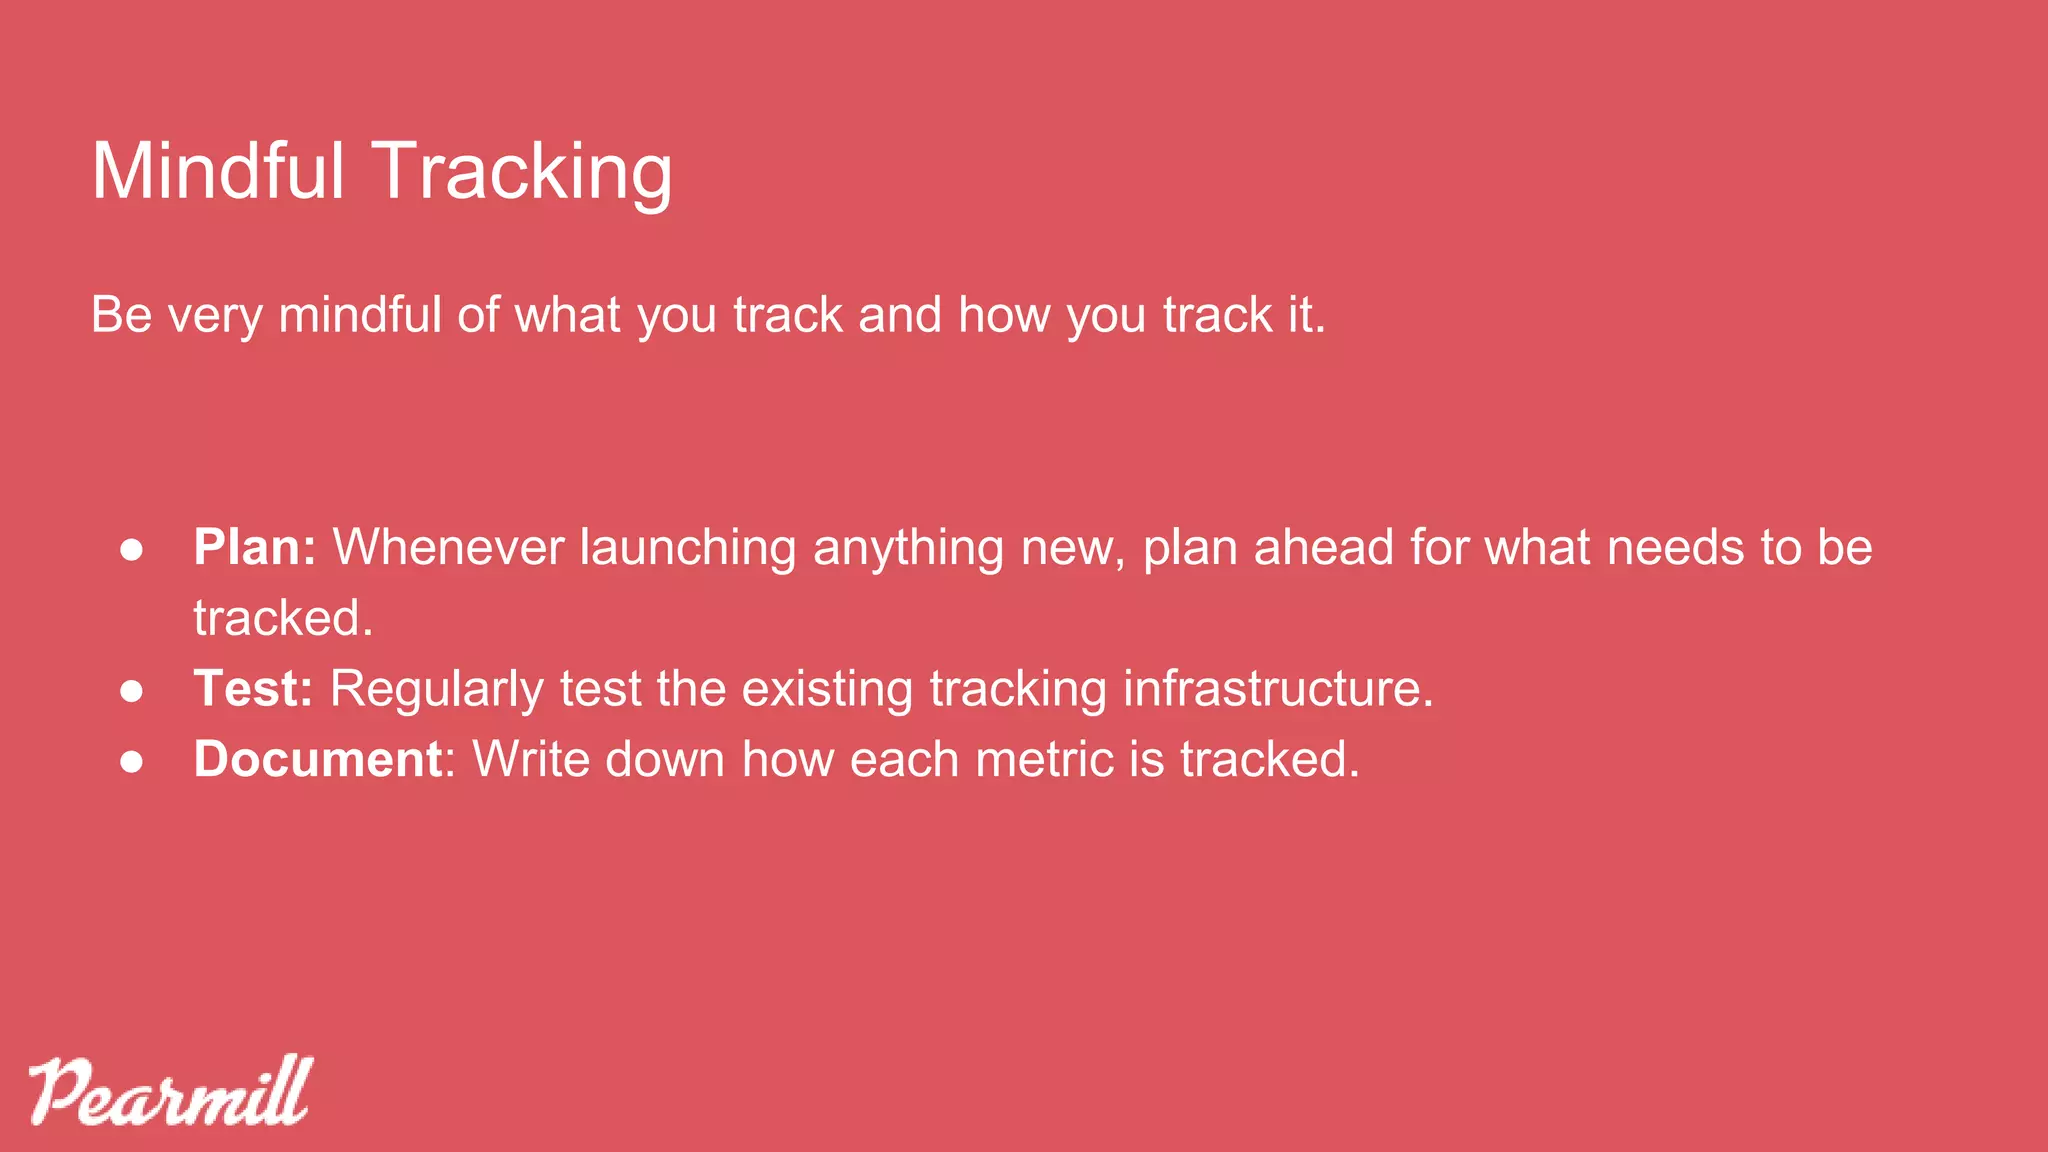
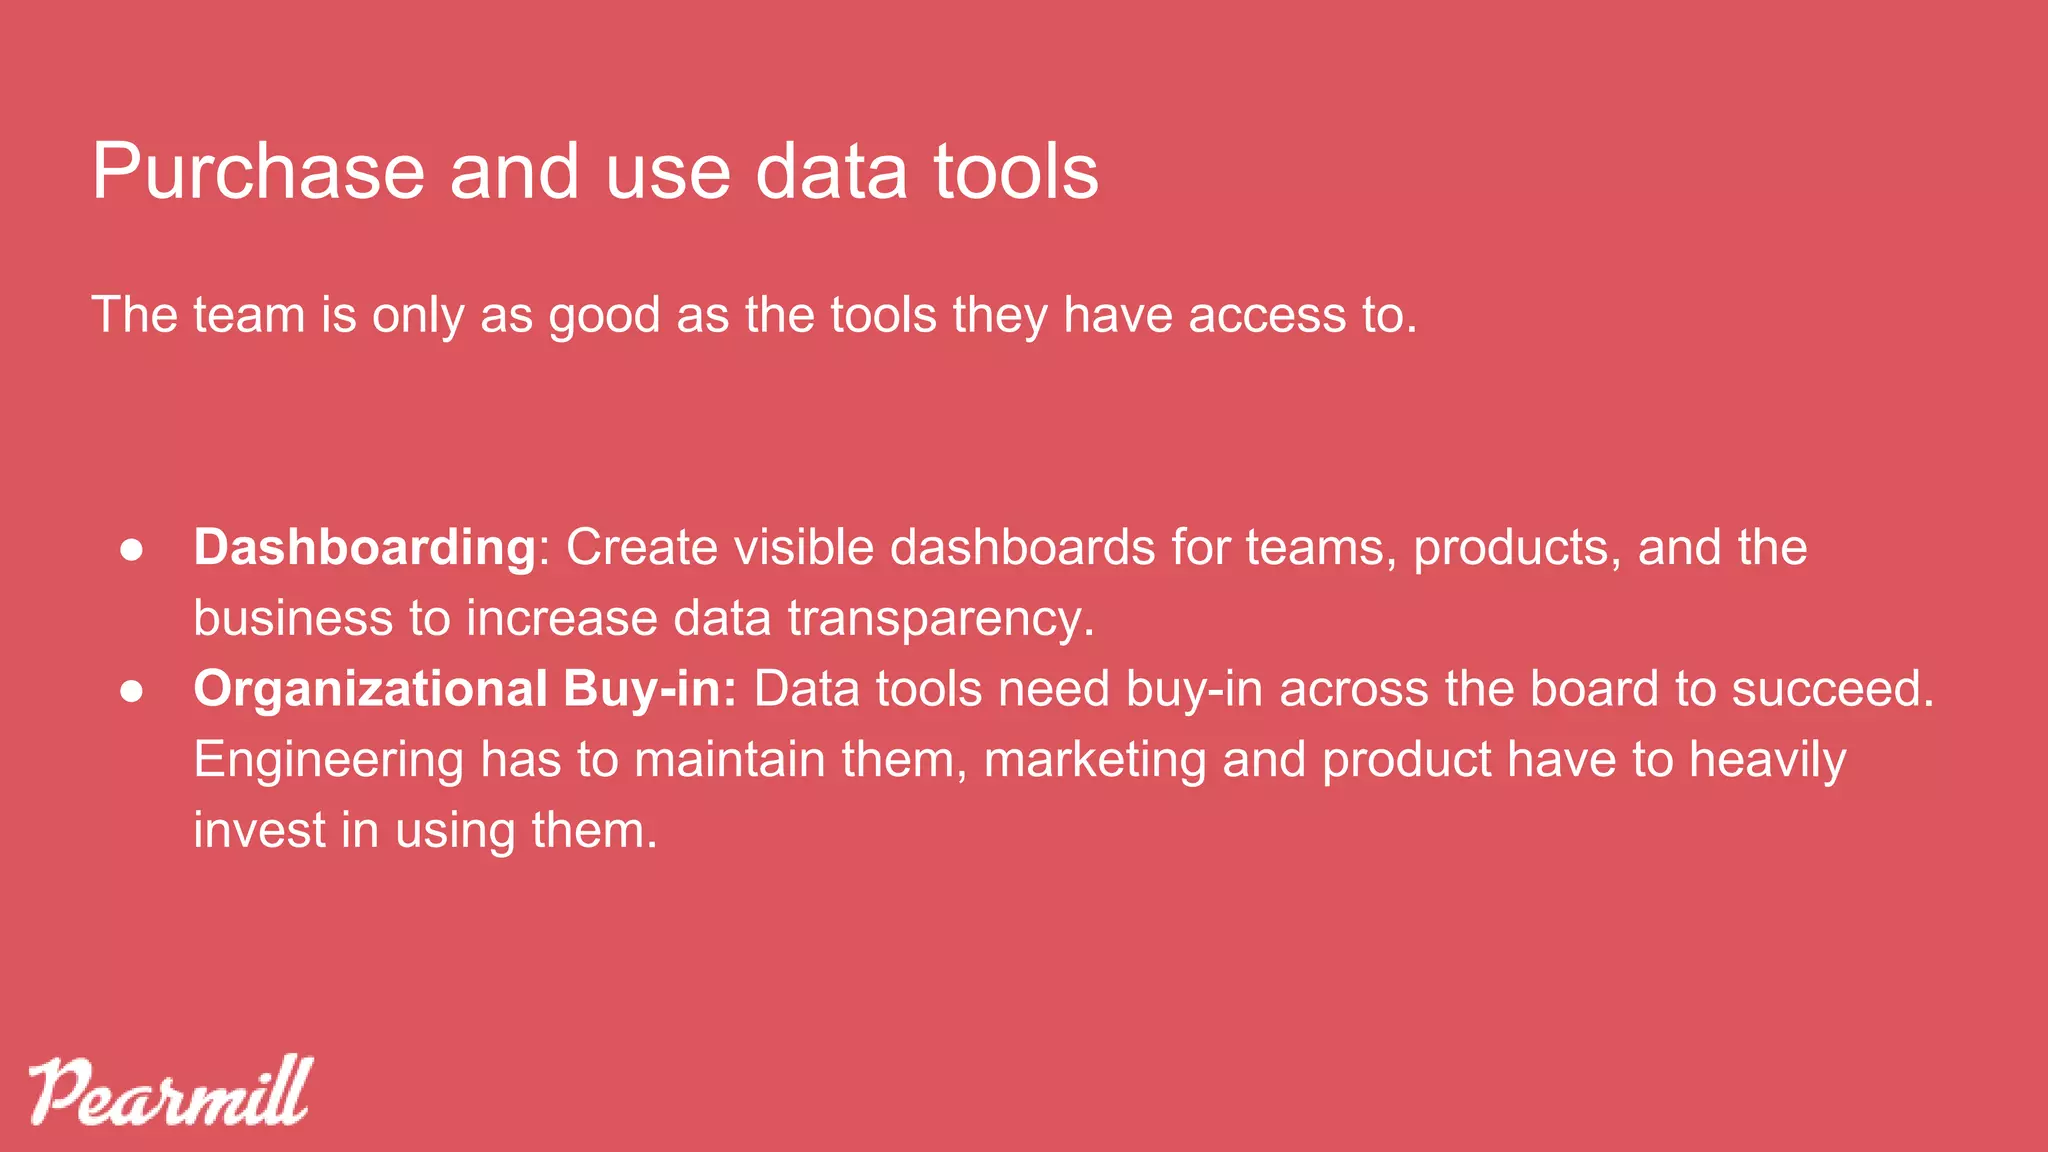
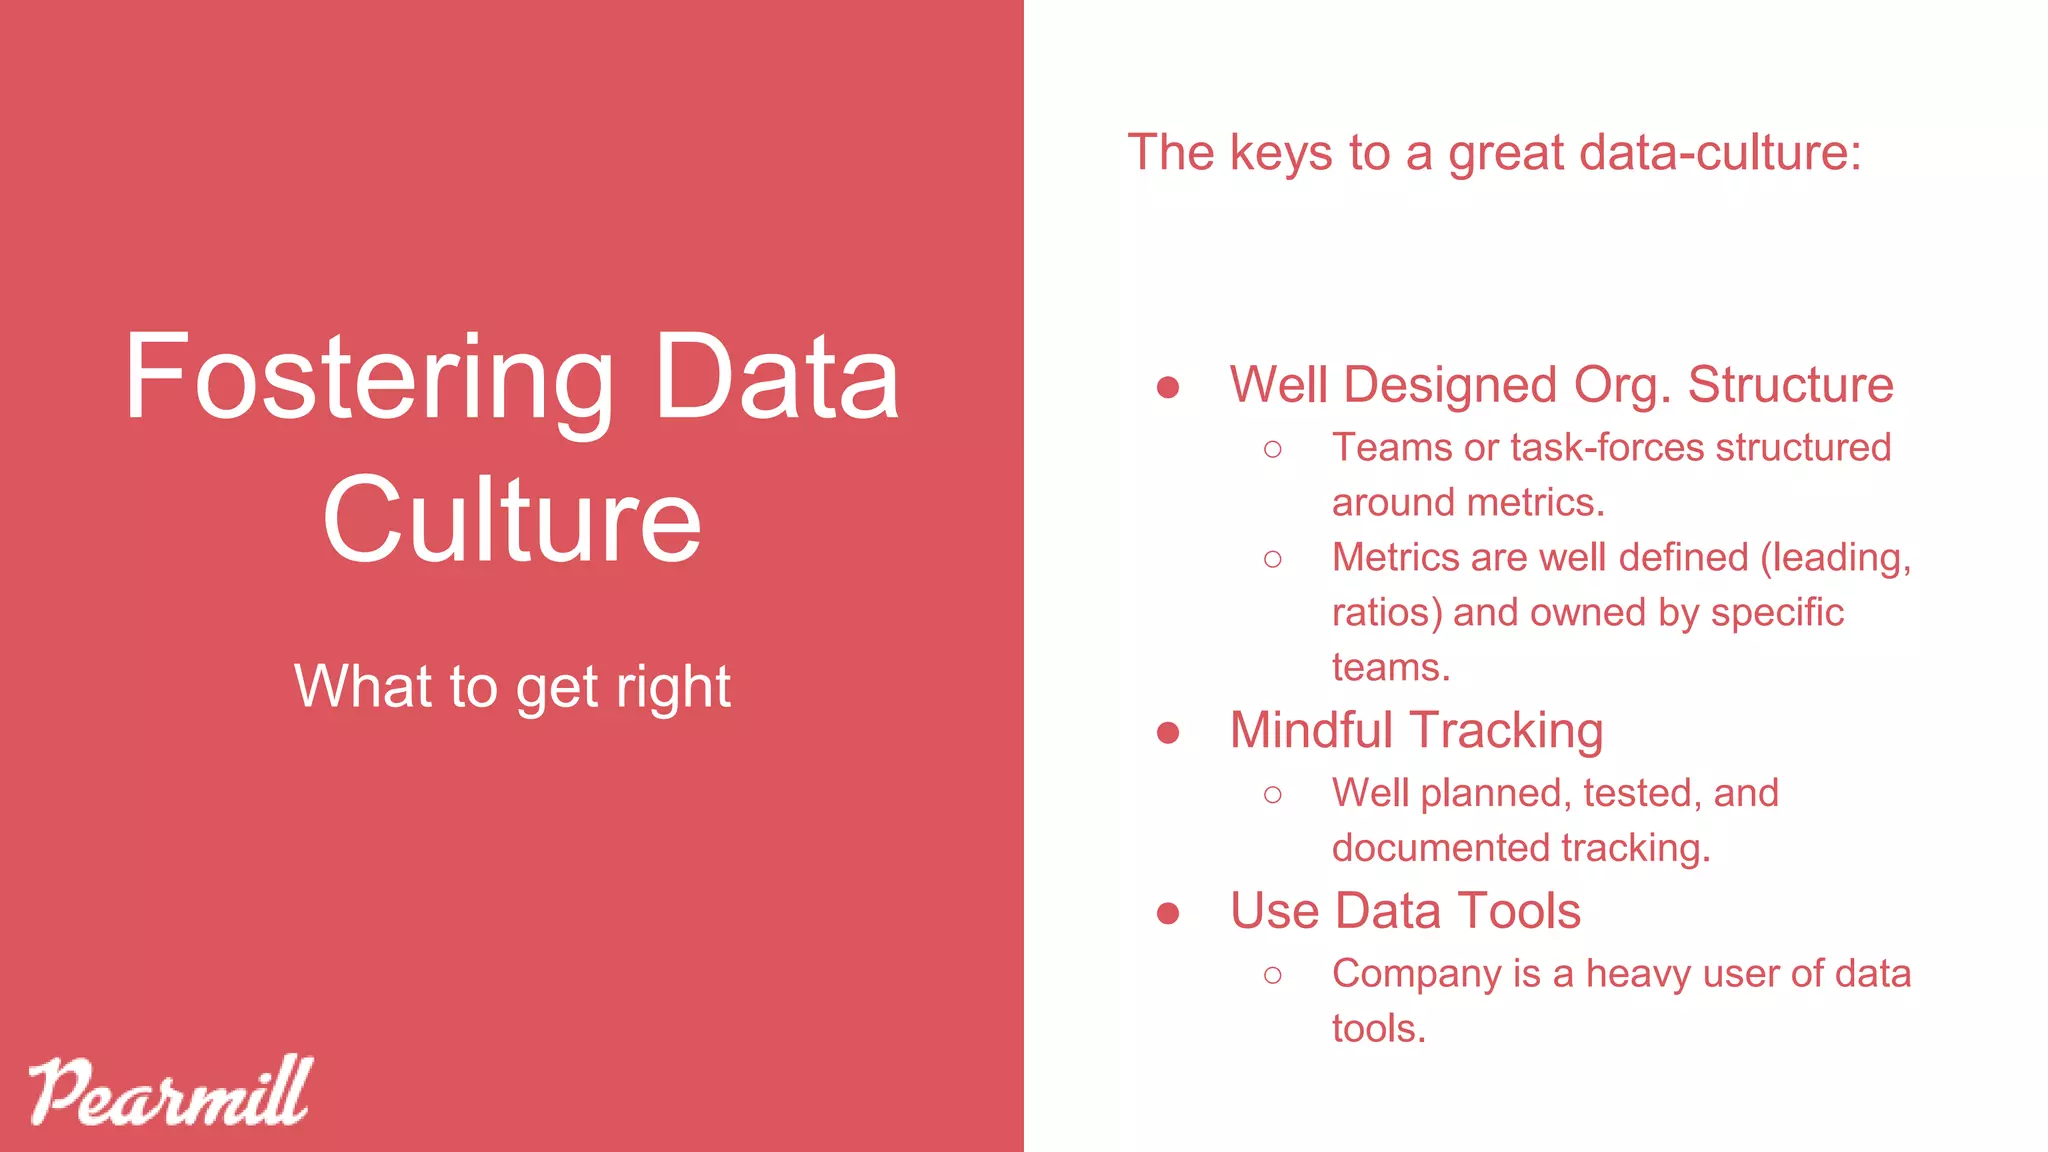
Build Product Progress With a Strong Data
Culture
Nima Gardideh Hannah Flynn
With: Moderated by:
TO USE YOUR COMPUTER'S AUDIO:
When the webinar begins, you will be connected to audio
using your computer's microphone and speakers (VoIP). A
headset is recommended.
Webinar will begin:
9:30 am, PDT
TO USE YOUR TELEPHONE:
If you prefer to use your phone, you must select "Use
Telephone" after joining the webinar and call in using the
numbers below.
United States: +1 (631) 992-3221
Access Code: 381-753-330
Audio PIN: Shown after joining the webinar
--OR--
Behavioral Product Analytics for the GDPR Era
Interana’s full-stack solution allows you to visually explore
trillions of data points from multiple data sets all in real time
without the need for ETL, data aggregation, or writing any SQL.
Data > Opinion
Data > Opinion
Knowing the right questions to ask is just the first step.
You need an analytics platform that lets you ask those questions.
Easily. Iteratively. And without writing SQL.
Experience Interana for yourself:
Interana.com/request-demo
Click on the Questions panel to
interact with the presenters
https://www.productmanagementtoday.com/webinar-series/start-with-why/
About Nima Gardideh
Nima Gardideh helps run Pearmill (https://pearmill.com/) - a tech-powered marketing agency that combines the
power of artful creative with precision targeting on major digital platforms. He works with marketing leaders to help
them reach their audience.
Previously, he's was the Head of Product at Taplytics (a YCombinator company), the Head of Mobile at Frank and
Oak and ran a venture-funded consumer company.
About Hannah Flynn
Hannah attended The University of Chicago, where she majored in Environmental Studies with a concentration in
Economics and Policy. She now works with Aggregage in product management, social media strategy, and webinar
production for Product Management Today and B2B Marketing Zone.
What We’ll Discuss
1. What’s a Data Culture and why it matters.
2. Patterns of data-driven teams.
3. Building a great culture around data.
What is a Data Culture?
Data Culture:
A integral value in the organization’s
culture to use information and data to
assist decision making.
Why having a data culture
a good thing
Benefits of a strong data-culture
● It’s a Framework for Decision Making
● It’s a Common Language
● It’s a Framework for Performance
Decision Making: You Are Not Steve Jobs
Relying on intuition to make decisions rarely works, using data you can:
● Avoid Intuition: Lots of behaviors aren’t intuitive (e.g. SnapChat)
● Prioritize: Can be used as a system to make decisions (e.g. if conv. rate is
too low in area X, then product teams needs to work on it)
● Discover & Grow: Exploring data can lead you to new market segments and
more revenue.
We All Speak Data
Metrics can become a common language across the company.
● Clarity: Everyone can easily understand how the business functions by
knowing about the different metrics the team tracks.
● Easier Onboarding: New team members can quickly learn how to talk about
product features and improvements to the business.
● Cross-Functional Productivity: Teams can communicate easier if everyone
speaks the same data language.
Performance: Internal
“Are we growing fast enough?”
Teams can own a metric and have a clear way to focus their efforts and
communicate with the rest of the company on their progress.
“How are we compared to industry standards?”
Companies can use metrics as benchmarks against the industry to understand
which parts of the business need the most attention.
E.g. if you’re a subscription SAAS business that has a > 2% yearly churn, then
you may need to focus more on retaining customers.
Performance: Industry Benchmarks
“Are we winning against our competitors?”
Metrics can be used to compare product performance against competitors.
E.g. if you’re Target and your visit to purchase conversion rate is below 13%, you
need to catch up with Amazon.
Performance: Competitors
Benefits of a strong data-culture
● It’s a Framework for Decision Making
○ Non-arguable, non-intuitive decision making can help you succeed and discover new avenues
for growth.
● It’s a Common Language
○ It can be a common language that helps you communicate internally, externally, and with new
hires.
● It’s a Framework for Performance
○ It can be used to track the performance of the team, and the product against the industry and
competitors.
Patterns of data-driven teams
What does a great Data-Culture look like?
● Metric Driven Performance
● Data Democratization
● Full Data Coverage
Data & Performance
Successful companies pair product metrics to the success of their teams.
● Metric Ownership: Team owns the growth of the metric.
● Non-Arguable Conversations: Teams prioritize and converse using facts.
● Experimentation Based Culture: Teams act as mini-scientists: hypothesize,
test, and analyze data.
● Holistic: Team’s overall performance is judged by how they impact the bigger
picture.
Data Democratization
Great companies let their employees access data easily.
● Exploratory Data Software: Teams have access to easy to use software to
look at metrics and discover new ones.
● Systematic Curiosity: Teams frequently ask questions about customer
behavior.
● Intelligent Intelligence: Teams understand statistics or have access to a
team that can help them understand the metrics.
Full Data Coverage
Successful companies have all their data in one place.
● Data Streams: Upstream (non-internal) and Downstream (internal) data are
merged and exist alongside each other.
● Data Lakes: All of the company’s data resides in one place for thorough
analysis.
● Tested Instrumentation: Rigorous tests run to ensure accuracy of data.
What does a great Data-Culture look like?
● Metric Driven Performance
○ Teams own the growth of the metric, are experimental, and argue using data.
● Data Democratization
○ They have access to great data tools, are curious, and intelligent with their analysis.
● Full Data Coverage
○ They have a robust and well maintained data pipeline (upstream+downstream).
Building a great culture
around data
Fostering Data
Culture
The keys to a great data-culture:
● Well Designed Org. Structure
● Mindful Tracking
● Use Data ToolsWhat to get right
Design Your Organization Properly
(or Communicate Better)
Product and Marketing teams should be structured around metrics.
● Metric Teams: If a person is in charge of moving a metric but two or three
teams with their own managers have to do the work – something’s wrong.
● Taskforce Model: If multiple teams are involved, create a task-force to
increase communication and help orchestrate.
Solve for the customer experience with your organization.
Customer Focused Design
Search PM Retention PM
CEO / VP
Product
Growth PM
This design doesn’t follow the customer journey, and causes feature disparity and
miscommunication within teams.
Poor Design
Web PM Mobile PM
CEO / VP
Product
To mitigate the poor design structure, create task forces to solve for
communication issues.
Poor Design? Taskforce
Web PM Mobile PM
CEO / VP
Product
Search
Taskforce
Metric Ownership
Teams should own metrics they can have directly manipulate.
● OMTM: They should own only one metric that matters.
● Ratios: OMTMs should be ratios (e.g. conversion rates, growth rates)
● Leading Metric: They should own metrics that are leading indicators of
success (e.g. checkout conversion rate) to top-level metrics (e.g. revenue) the
company cares about.
Mindful Tracking
Be very mindful of what you track and how you track it.
● Plan: Whenever launching anything new, plan ahead for what needs to be
tracked.
● Test: Regularly test the existing tracking infrastructure.
● Document: Write down how each metric is tracked.
The team is only as good as the tools they have access to.
● Dashboarding: Create visible dashboards for teams, products, and the
business to increase data transparency.
● Organizational Buy-in: Data tools need buy-in across the board to succeed.
Engineering has to maintain them, marketing and product have to heavily
invest in using them.
Purchase and use data tools
Fostering Data
Culture
The keys to a great data-culture:
● Well Designed Org. Structure
○ Teams or task-forces structured
around metrics.
○ Metrics are well defined (leading,
ratios) and owned by specific
teams.
● Mindful Tracking
○ Well planned, tested, and
documented tracking.
● Use Data Tools
○ Company is a heavy user of data
tools.
What to get right
Fostering Data
Culture
The pitfalls of data-culture
development:
● Analysis Paralysis
● Poor Analytical Understanding
What to avoid
Avoid Analysis Paralysis
Humans have issues making sense of too much information.
● OMTM: Focus each team to one metric that matters for fixed periods of time.
● Scoped Analysis: Limit each exploration to solving for OMTM.
Understand Statistics Well
Learn about statistics and avoid common mistakes.
● Survey Data: Variable Standardization
● P-Hacking & Hypothesis Design: Avoid mis-reading data
● Machine Learning: Understand how it works and where it can help you.
Standardize Data: Standardize data to avoid misreading the survey results.
E.g. If you only had 50 women submit the survey and had 200 men, you to
standardize gender as a variable before your analysis.
This is called Variable Standardization.
Survey Data: Standardize
Avoid P-Hacking Using Formal Hypothesis
Correlation isn’t causation: just because two data points correlate in the data, it
doesn’t mean they’re causing each other.
Design Experiments: Avoid p-hacking and mis-reading the data by defining the
boundaries of your experiment and having a clear hypothesis.
E.g. Hypothesis: If Credit Card is automatically chosen on the checkout page,
users purchase at a higher rate.
Remember: Ice Cream Kills!
Fostering Data
Culture
The pitfalls of data-culture
development:
● Analysis Paralysis
○ Avoid it by focusing on OMTM and
scoping analysis.
● Poor Analytical Understanding
○ Learn about common mistakes in
analysis.
What to avoid
Takeaways
1. What’s a Data Culture and why it matters.
Can be an invaluable tool to make decisions and set you up for success.
1. Patterns of data-driven teams.
Data is ingrained in the organization: teams are structured around it and data
tools are used by everyone.
1. Building a great culture around data.
Design your organization well, and focus on your OMTM.
Q&A
Hannah Flynn
With: Moderated by:
Chief Analytics and Product Strategy consultant, Y-
Perspective
Linkedin page: /in/nimagardideh/
Twitter ID: @ngardideh
Website: pearmill.com
Nima Gardideh
Site editor, Product Management Today
Linkedin page:
linkedin.com/in/hannahmichaelflynn
Twitter ID: @prodmgmttoday
Email: hannah@aggregage.com
Website: productmanagementtoday.com
https://www.productmanagementtoday.com/webinar-series/start-with-why/

Start With Why: Build Product Progress with a Strong Data Culture

  • 1.
    Build Product ProgressWith a Strong Data Culture Nima Gardideh Hannah Flynn With: Moderated by: TO USE YOUR COMPUTER'S AUDIO: When the webinar begins, you will be connected to audio using your computer's microphone and speakers (VoIP). A headset is recommended. Webinar will begin: 9:30 am, PDT TO USE YOUR TELEPHONE: If you prefer to use your phone, you must select "Use Telephone" after joining the webinar and call in using the numbers below. United States: +1 (631) 992-3221 Access Code: 381-753-330 Audio PIN: Shown after joining the webinar --OR--
  • 2.
    Behavioral Product Analyticsfor the GDPR Era Interana’s full-stack solution allows you to visually explore trillions of data points from multiple data sets all in real time without the need for ETL, data aggregation, or writing any SQL. Data > Opinion
  • 3.
    Data > Opinion Knowingthe right questions to ask is just the first step. You need an analytics platform that lets you ask those questions. Easily. Iteratively. And without writing SQL. Experience Interana for yourself: Interana.com/request-demo
  • 4.
    Click on theQuestions panel to interact with the presenters https://www.productmanagementtoday.com/webinar-series/start-with-why/
  • 5.
    About Nima Gardideh NimaGardideh helps run Pearmill (https://pearmill.com/) - a tech-powered marketing agency that combines the power of artful creative with precision targeting on major digital platforms. He works with marketing leaders to help them reach their audience. Previously, he's was the Head of Product at Taplytics (a YCombinator company), the Head of Mobile at Frank and Oak and ran a venture-funded consumer company. About Hannah Flynn Hannah attended The University of Chicago, where she majored in Environmental Studies with a concentration in Economics and Policy. She now works with Aggregage in product management, social media strategy, and webinar production for Product Management Today and B2B Marketing Zone.
  • 6.
    What We’ll Discuss 1.What’s a Data Culture and why it matters. 2. Patterns of data-driven teams. 3. Building a great culture around data.
  • 7.
    What is aData Culture?
  • 8.
    Data Culture: A integralvalue in the organization’s culture to use information and data to assist decision making.
  • 9.
    Why having adata culture a good thing
  • 10.
    Benefits of astrong data-culture ● It’s a Framework for Decision Making ● It’s a Common Language ● It’s a Framework for Performance
  • 11.
    Decision Making: YouAre Not Steve Jobs Relying on intuition to make decisions rarely works, using data you can: ● Avoid Intuition: Lots of behaviors aren’t intuitive (e.g. SnapChat) ● Prioritize: Can be used as a system to make decisions (e.g. if conv. rate is too low in area X, then product teams needs to work on it) ● Discover & Grow: Exploring data can lead you to new market segments and more revenue.
  • 12.
    We All SpeakData Metrics can become a common language across the company. ● Clarity: Everyone can easily understand how the business functions by knowing about the different metrics the team tracks. ● Easier Onboarding: New team members can quickly learn how to talk about product features and improvements to the business. ● Cross-Functional Productivity: Teams can communicate easier if everyone speaks the same data language.
  • 13.
    Performance: Internal “Are wegrowing fast enough?” Teams can own a metric and have a clear way to focus their efforts and communicate with the rest of the company on their progress.
  • 14.
    “How are wecompared to industry standards?” Companies can use metrics as benchmarks against the industry to understand which parts of the business need the most attention. E.g. if you’re a subscription SAAS business that has a > 2% yearly churn, then you may need to focus more on retaining customers. Performance: Industry Benchmarks
  • 15.
    “Are we winningagainst our competitors?” Metrics can be used to compare product performance against competitors. E.g. if you’re Target and your visit to purchase conversion rate is below 13%, you need to catch up with Amazon. Performance: Competitors
  • 16.
    Benefits of astrong data-culture ● It’s a Framework for Decision Making ○ Non-arguable, non-intuitive decision making can help you succeed and discover new avenues for growth. ● It’s a Common Language ○ It can be a common language that helps you communicate internally, externally, and with new hires. ● It’s a Framework for Performance ○ It can be used to track the performance of the team, and the product against the industry and competitors.
  • 17.
  • 18.
    What does agreat Data-Culture look like? ● Metric Driven Performance ● Data Democratization ● Full Data Coverage
  • 19.
    Data & Performance Successfulcompanies pair product metrics to the success of their teams. ● Metric Ownership: Team owns the growth of the metric. ● Non-Arguable Conversations: Teams prioritize and converse using facts. ● Experimentation Based Culture: Teams act as mini-scientists: hypothesize, test, and analyze data. ● Holistic: Team’s overall performance is judged by how they impact the bigger picture.
  • 20.
    Data Democratization Great companieslet their employees access data easily. ● Exploratory Data Software: Teams have access to easy to use software to look at metrics and discover new ones. ● Systematic Curiosity: Teams frequently ask questions about customer behavior. ● Intelligent Intelligence: Teams understand statistics or have access to a team that can help them understand the metrics.
  • 21.
    Full Data Coverage Successfulcompanies have all their data in one place. ● Data Streams: Upstream (non-internal) and Downstream (internal) data are merged and exist alongside each other. ● Data Lakes: All of the company’s data resides in one place for thorough analysis. ● Tested Instrumentation: Rigorous tests run to ensure accuracy of data.
  • 22.
    What does agreat Data-Culture look like? ● Metric Driven Performance ○ Teams own the growth of the metric, are experimental, and argue using data. ● Data Democratization ○ They have access to great data tools, are curious, and intelligent with their analysis. ● Full Data Coverage ○ They have a robust and well maintained data pipeline (upstream+downstream).
  • 23.
    Building a greatculture around data
  • 24.
    Fostering Data Culture The keysto a great data-culture: ● Well Designed Org. Structure ● Mindful Tracking ● Use Data ToolsWhat to get right
  • 25.
    Design Your OrganizationProperly (or Communicate Better) Product and Marketing teams should be structured around metrics. ● Metric Teams: If a person is in charge of moving a metric but two or three teams with their own managers have to do the work – something’s wrong. ● Taskforce Model: If multiple teams are involved, create a task-force to increase communication and help orchestrate.
  • 26.
    Solve for thecustomer experience with your organization. Customer Focused Design Search PM Retention PM CEO / VP Product Growth PM
  • 27.
    This design doesn’tfollow the customer journey, and causes feature disparity and miscommunication within teams. Poor Design Web PM Mobile PM CEO / VP Product
  • 28.
    To mitigate thepoor design structure, create task forces to solve for communication issues. Poor Design? Taskforce Web PM Mobile PM CEO / VP Product Search Taskforce
  • 29.
    Metric Ownership Teams shouldown metrics they can have directly manipulate. ● OMTM: They should own only one metric that matters. ● Ratios: OMTMs should be ratios (e.g. conversion rates, growth rates) ● Leading Metric: They should own metrics that are leading indicators of success (e.g. checkout conversion rate) to top-level metrics (e.g. revenue) the company cares about.
  • 30.
    Mindful Tracking Be verymindful of what you track and how you track it. ● Plan: Whenever launching anything new, plan ahead for what needs to be tracked. ● Test: Regularly test the existing tracking infrastructure. ● Document: Write down how each metric is tracked.
  • 31.
    The team isonly as good as the tools they have access to. ● Dashboarding: Create visible dashboards for teams, products, and the business to increase data transparency. ● Organizational Buy-in: Data tools need buy-in across the board to succeed. Engineering has to maintain them, marketing and product have to heavily invest in using them. Purchase and use data tools
  • 32.
    Fostering Data Culture The keysto a great data-culture: ● Well Designed Org. Structure ○ Teams or task-forces structured around metrics. ○ Metrics are well defined (leading, ratios) and owned by specific teams. ● Mindful Tracking ○ Well planned, tested, and documented tracking. ● Use Data Tools ○ Company is a heavy user of data tools. What to get right
  • 33.
    Fostering Data Culture The pitfallsof data-culture development: ● Analysis Paralysis ● Poor Analytical Understanding What to avoid
  • 34.
    Avoid Analysis Paralysis Humanshave issues making sense of too much information. ● OMTM: Focus each team to one metric that matters for fixed periods of time. ● Scoped Analysis: Limit each exploration to solving for OMTM.
  • 35.
    Understand Statistics Well Learnabout statistics and avoid common mistakes. ● Survey Data: Variable Standardization ● P-Hacking & Hypothesis Design: Avoid mis-reading data ● Machine Learning: Understand how it works and where it can help you.
  • 36.
    Standardize Data: Standardizedata to avoid misreading the survey results. E.g. If you only had 50 women submit the survey and had 200 men, you to standardize gender as a variable before your analysis. This is called Variable Standardization. Survey Data: Standardize
  • 37.
    Avoid P-Hacking UsingFormal Hypothesis Correlation isn’t causation: just because two data points correlate in the data, it doesn’t mean they’re causing each other. Design Experiments: Avoid p-hacking and mis-reading the data by defining the boundaries of your experiment and having a clear hypothesis. E.g. Hypothesis: If Credit Card is automatically chosen on the checkout page, users purchase at a higher rate.
  • 38.
  • 39.
    Fostering Data Culture The pitfallsof data-culture development: ● Analysis Paralysis ○ Avoid it by focusing on OMTM and scoping analysis. ● Poor Analytical Understanding ○ Learn about common mistakes in analysis. What to avoid
  • 40.
    Takeaways 1. What’s aData Culture and why it matters. Can be an invaluable tool to make decisions and set you up for success. 1. Patterns of data-driven teams. Data is ingrained in the organization: teams are structured around it and data tools are used by everyone. 1. Building a great culture around data. Design your organization well, and focus on your OMTM.
  • 41.
    Q&A Hannah Flynn With: Moderatedby: Chief Analytics and Product Strategy consultant, Y- Perspective Linkedin page: /in/nimagardideh/ Twitter ID: @ngardideh Website: pearmill.com Nima Gardideh Site editor, Product Management Today Linkedin page: linkedin.com/in/hannahmichaelflynn Twitter ID: @prodmgmttoday Email: hannah@aggregage.com Website: productmanagementtoday.com https://www.productmanagementtoday.com/webinar-series/start-with-why/