Download to read offline
![Boston
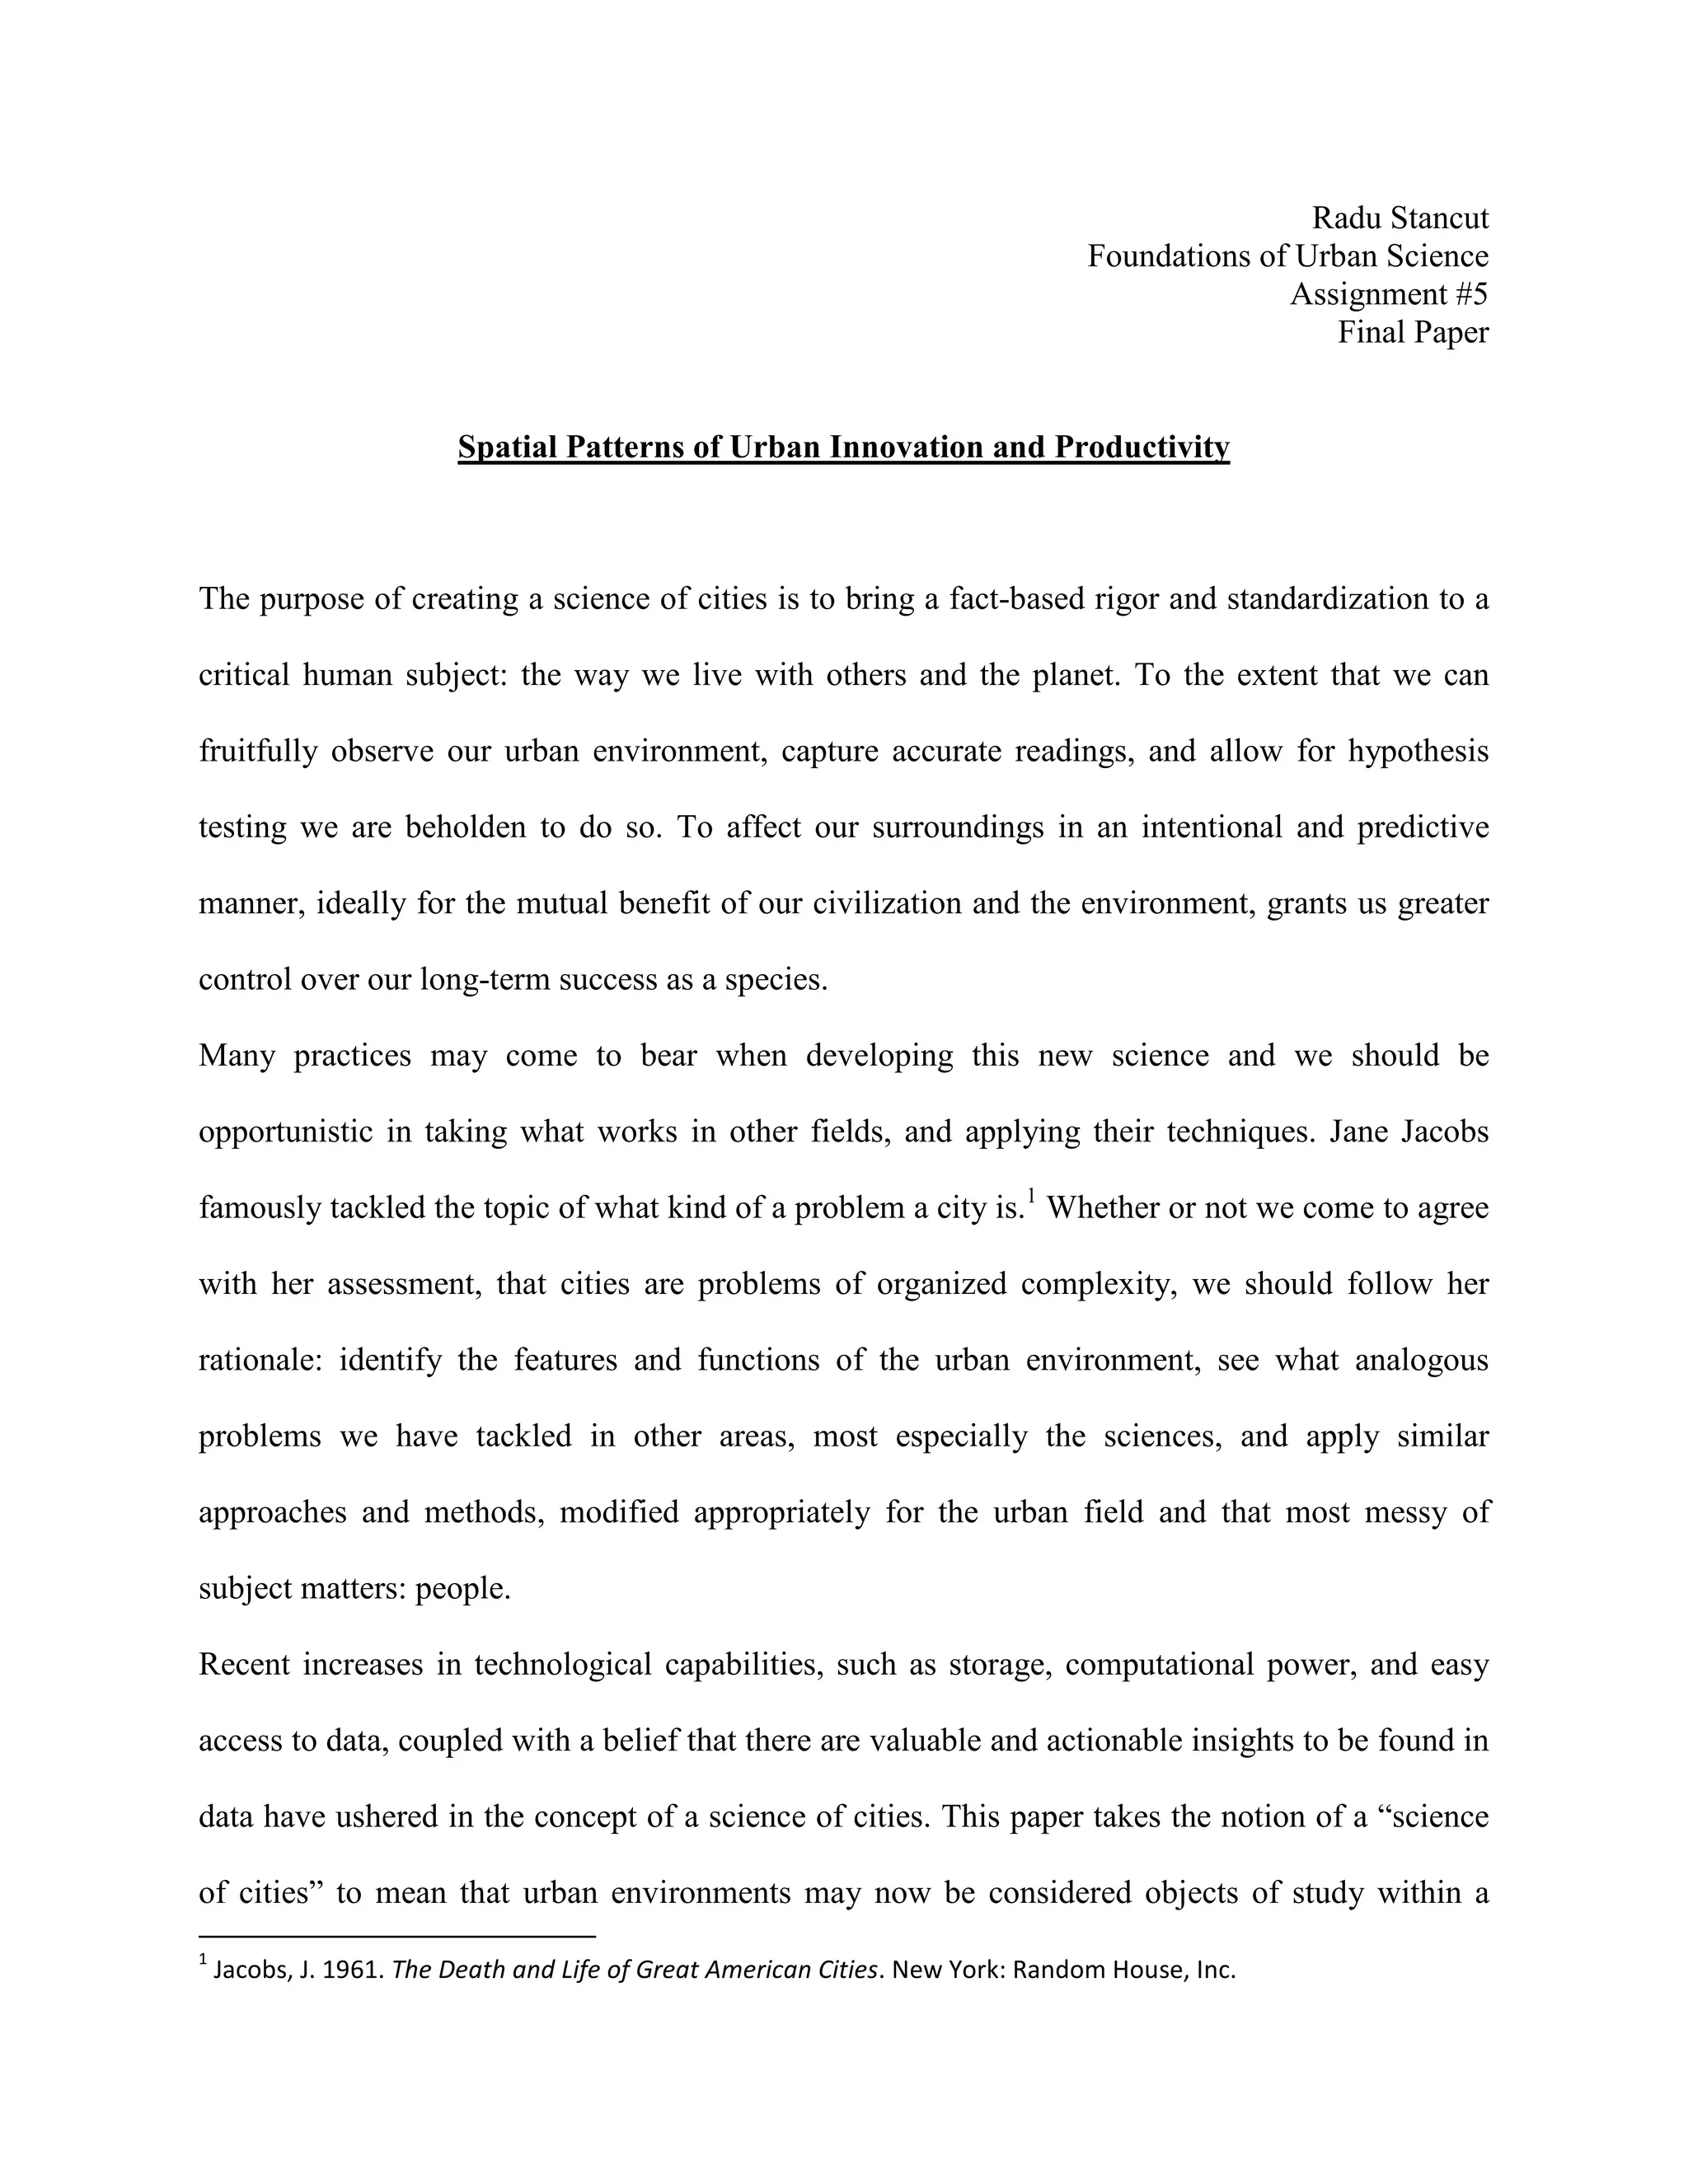
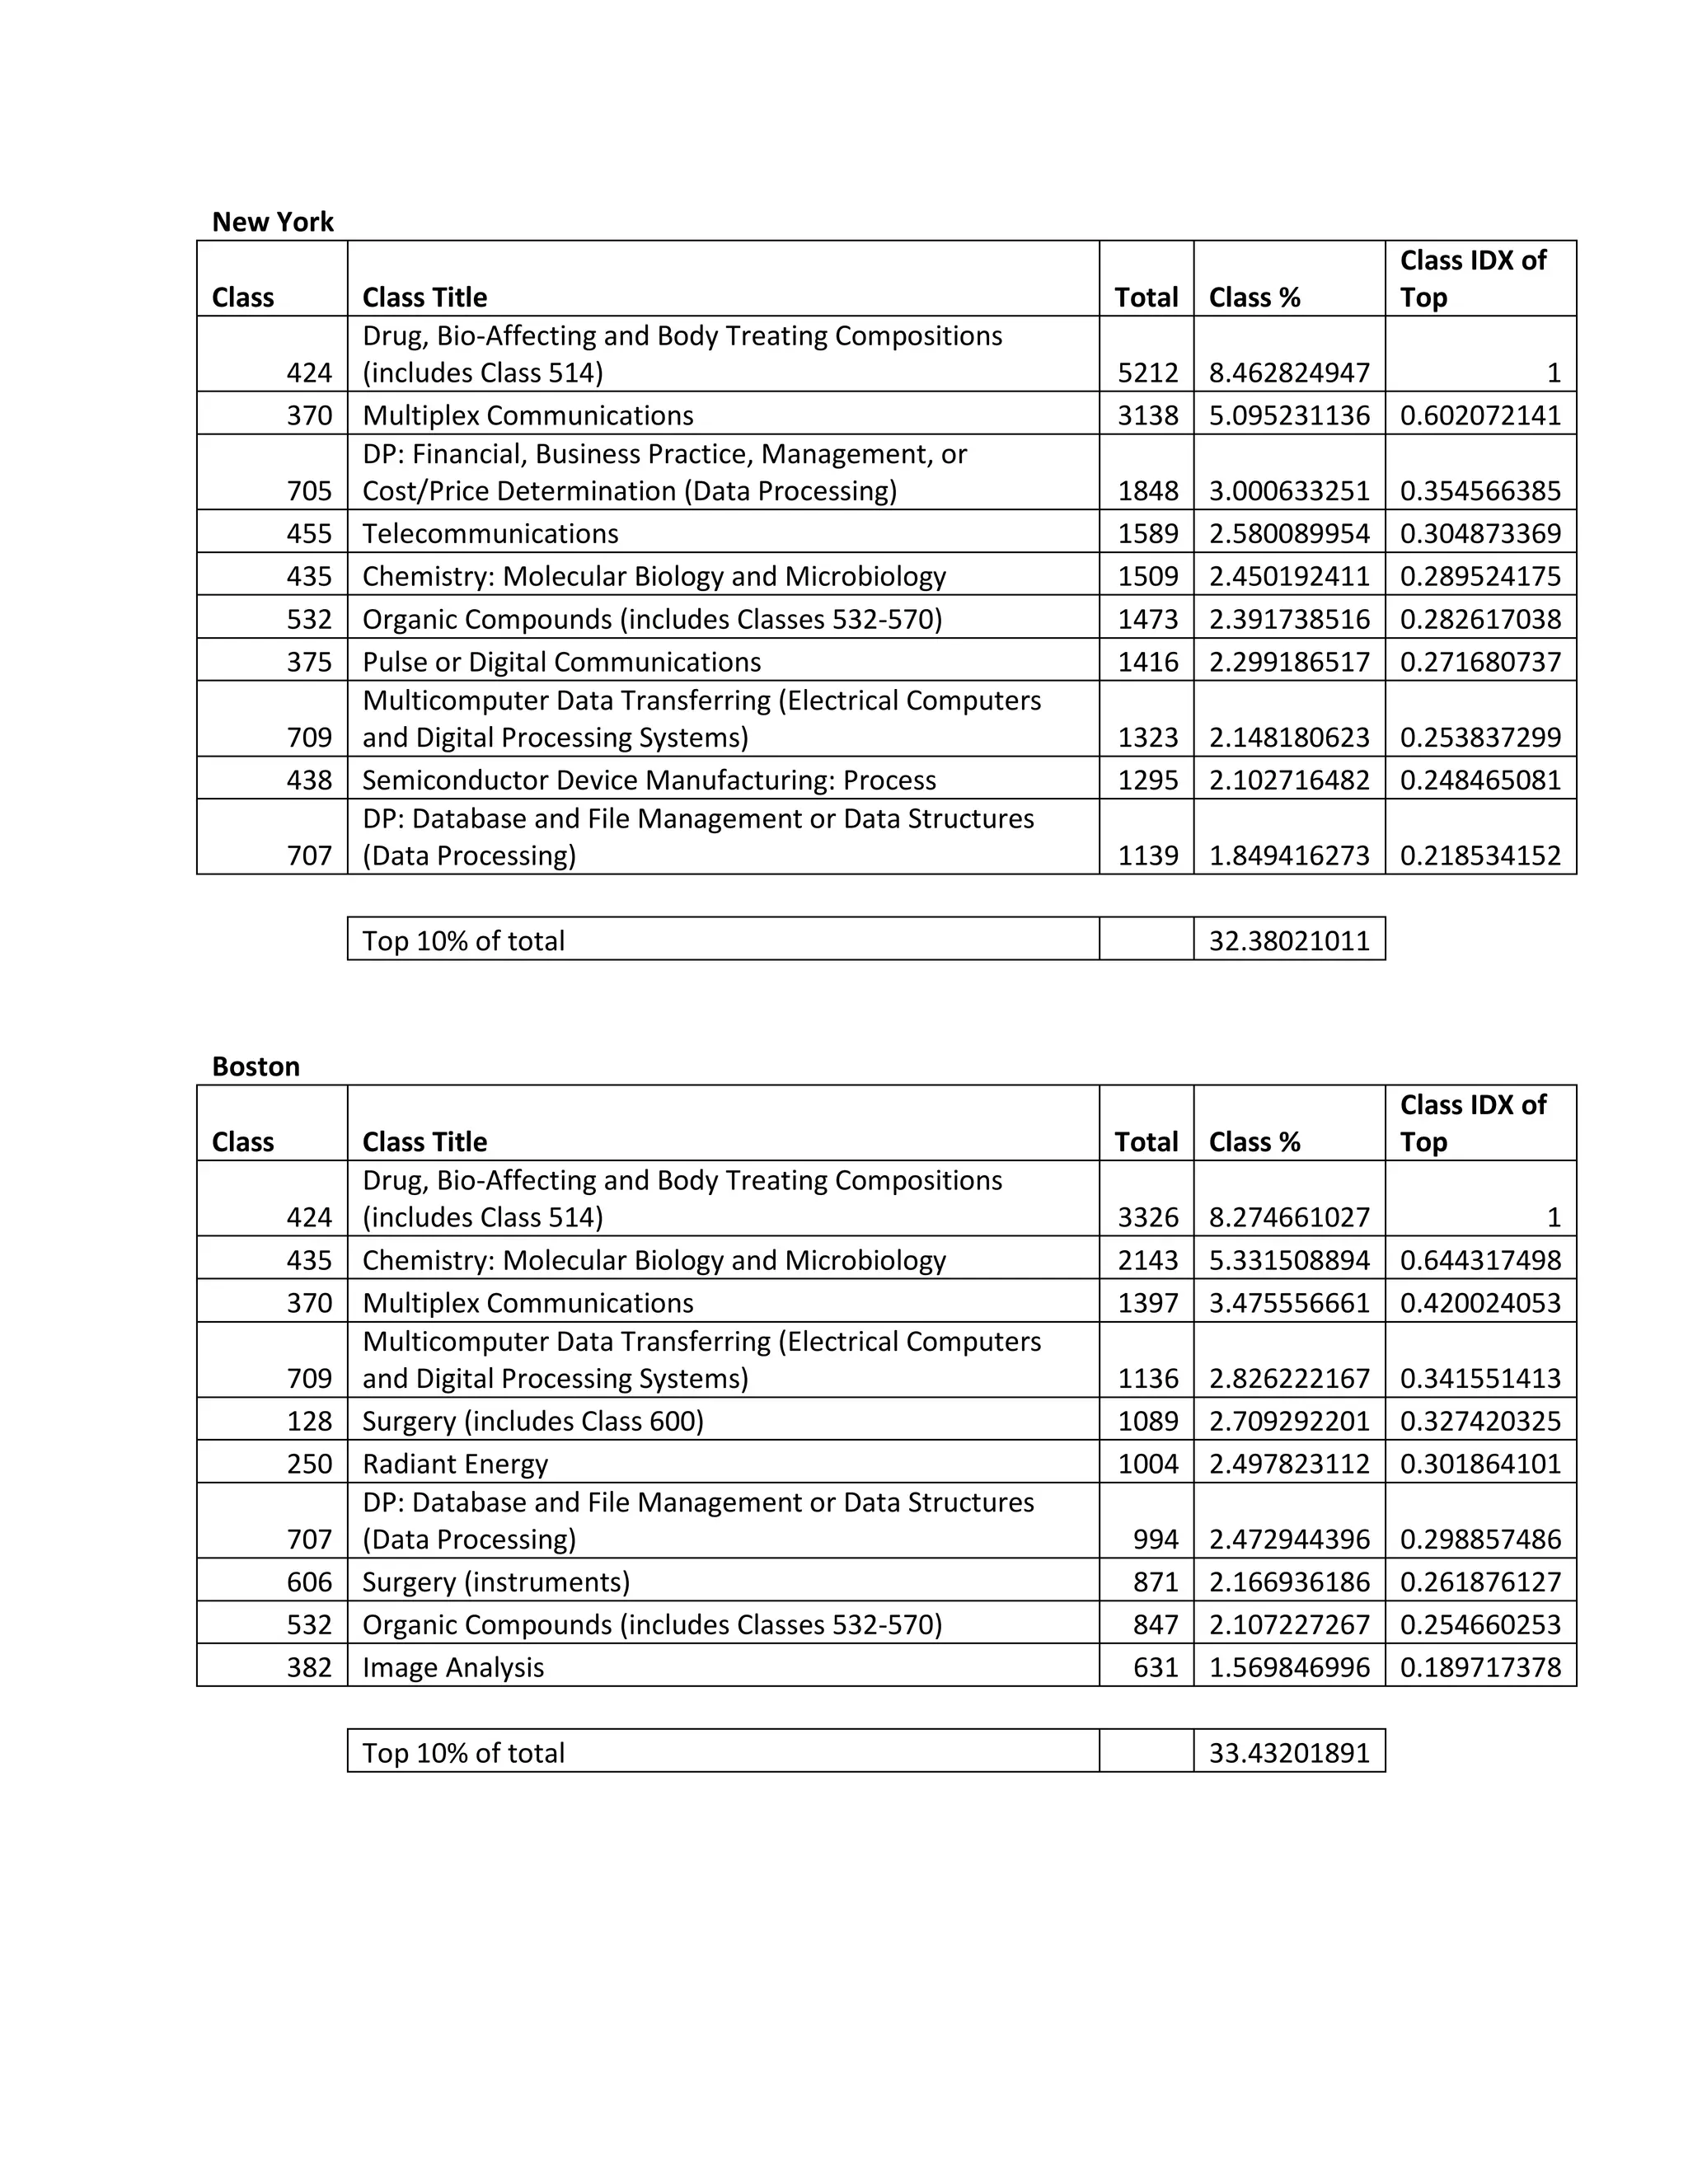
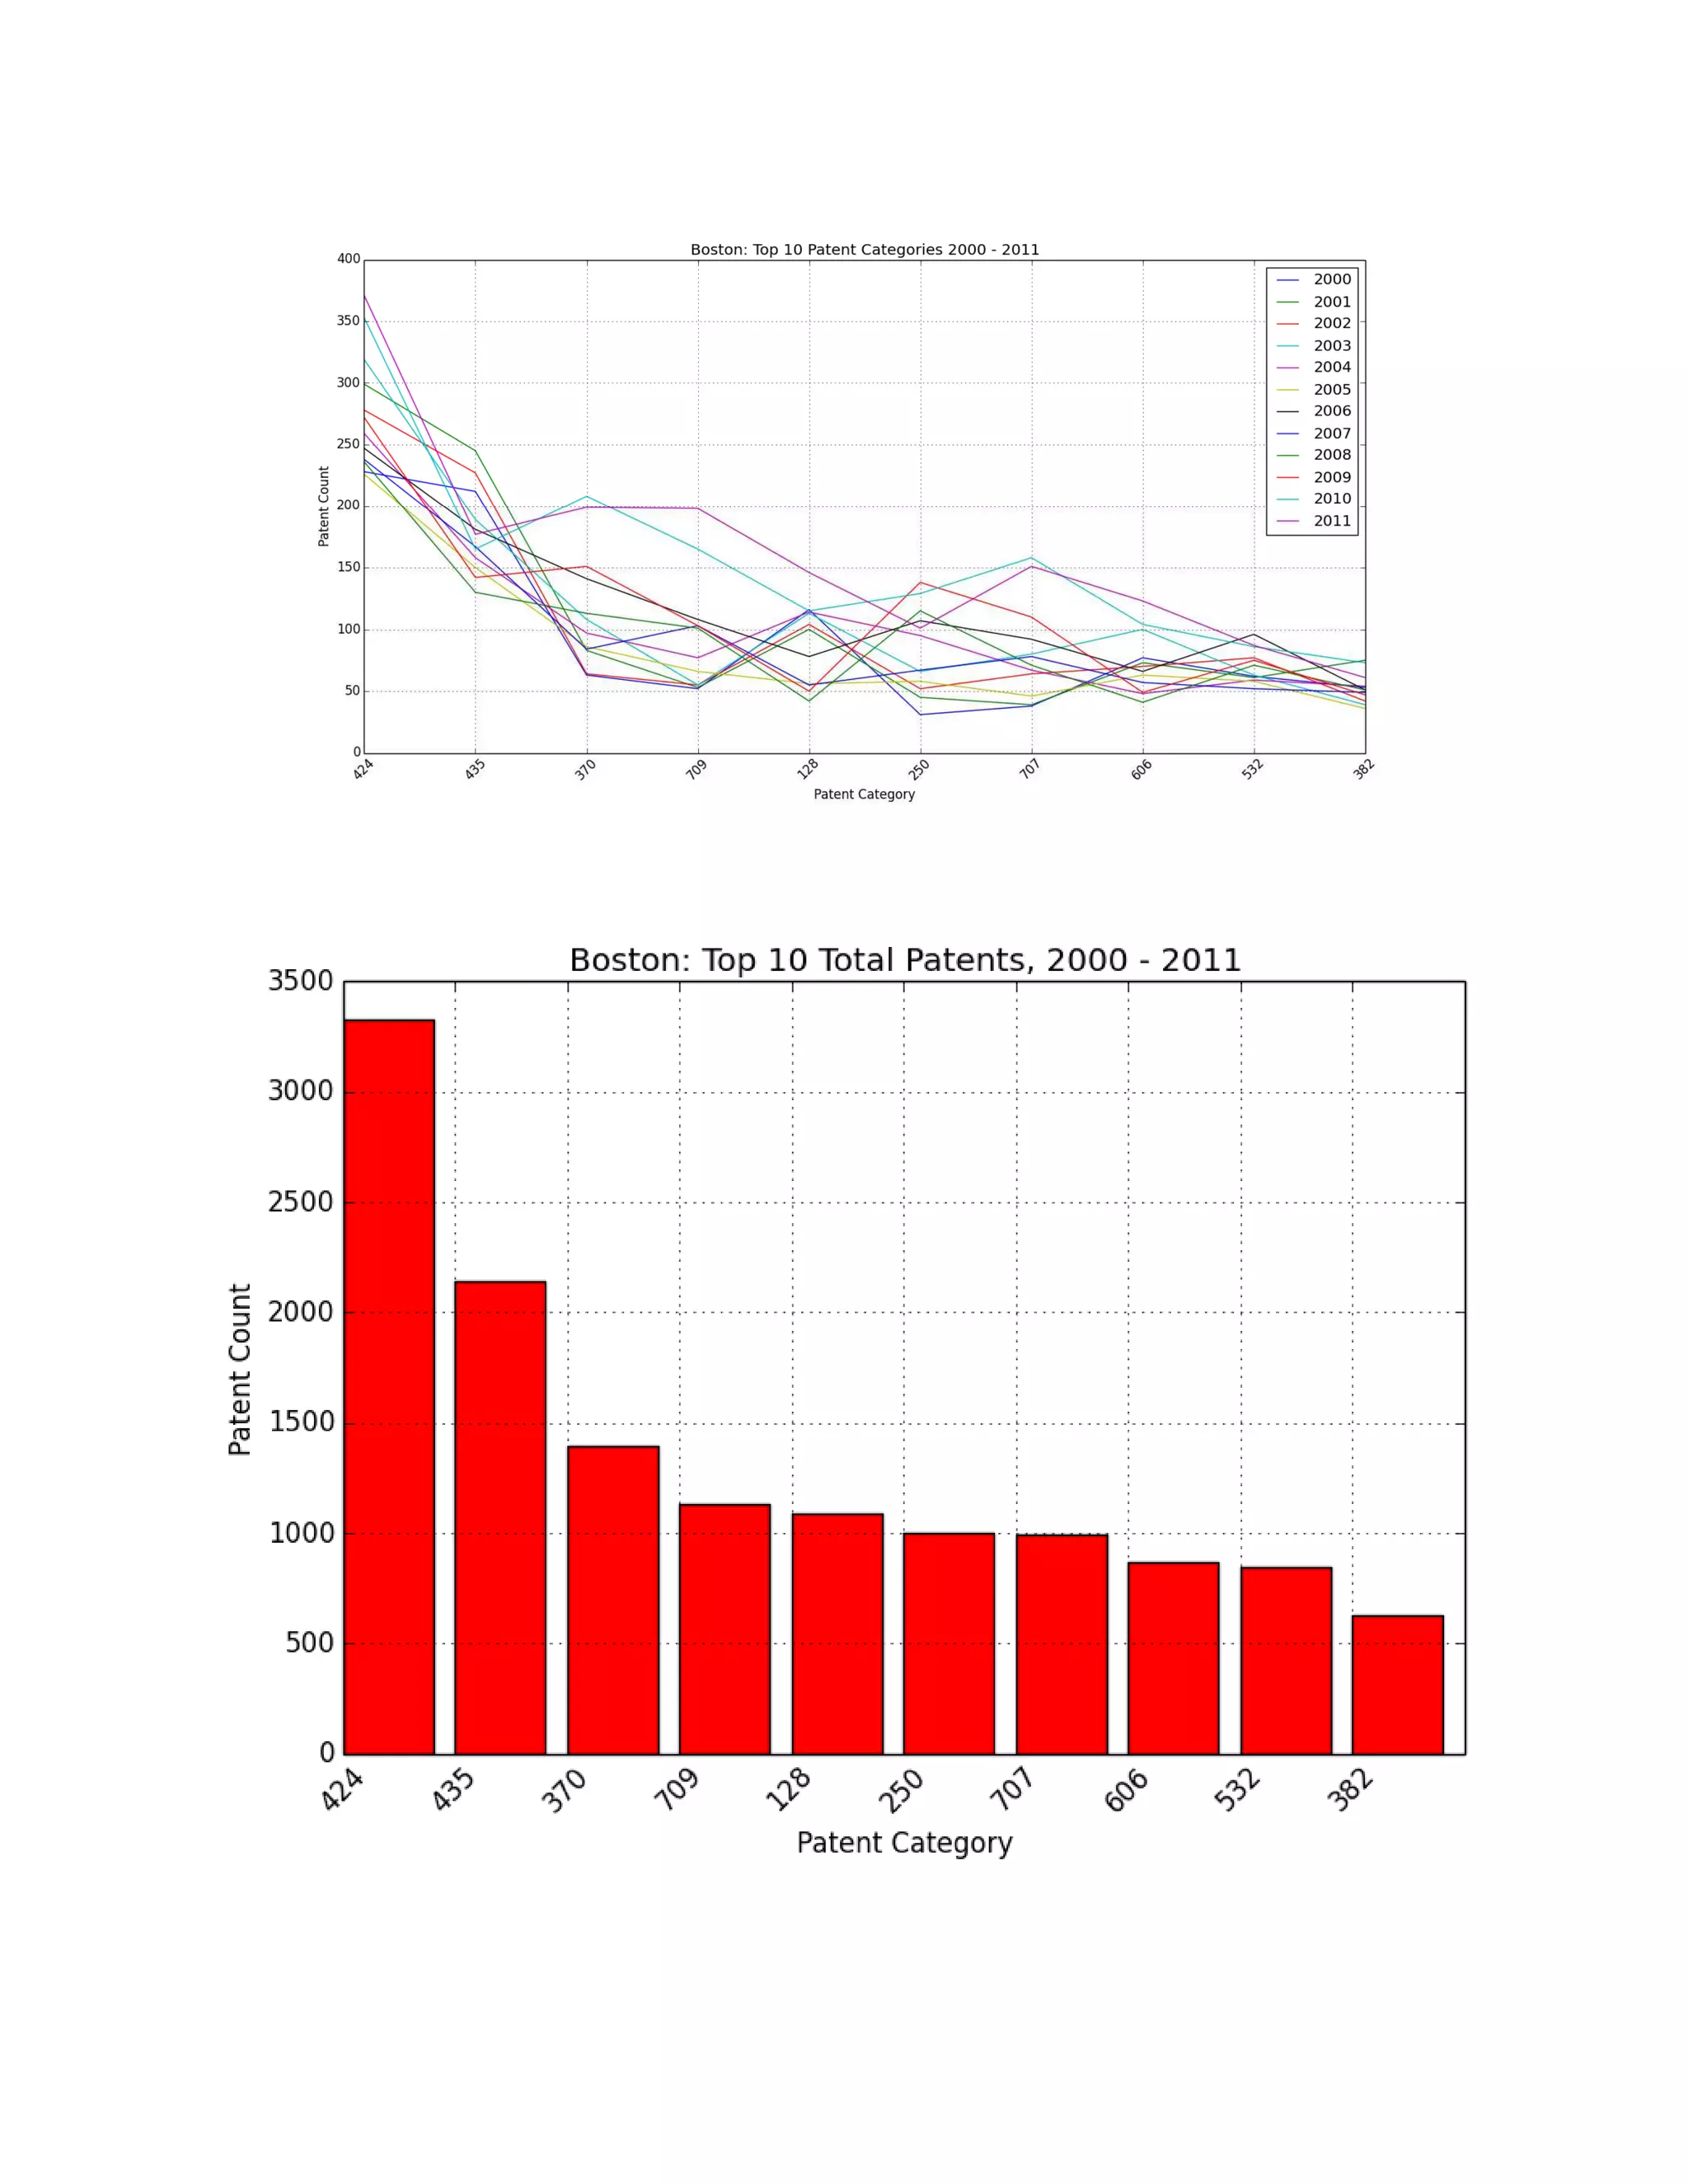
Of the three additionally selected MSAs, Boston is the one most in line with New York. Boston
technologies account for a third of all patent activity and there is a similar
(Drug, Bio-Affecting and Body Treating Compositions
and Microbiology).
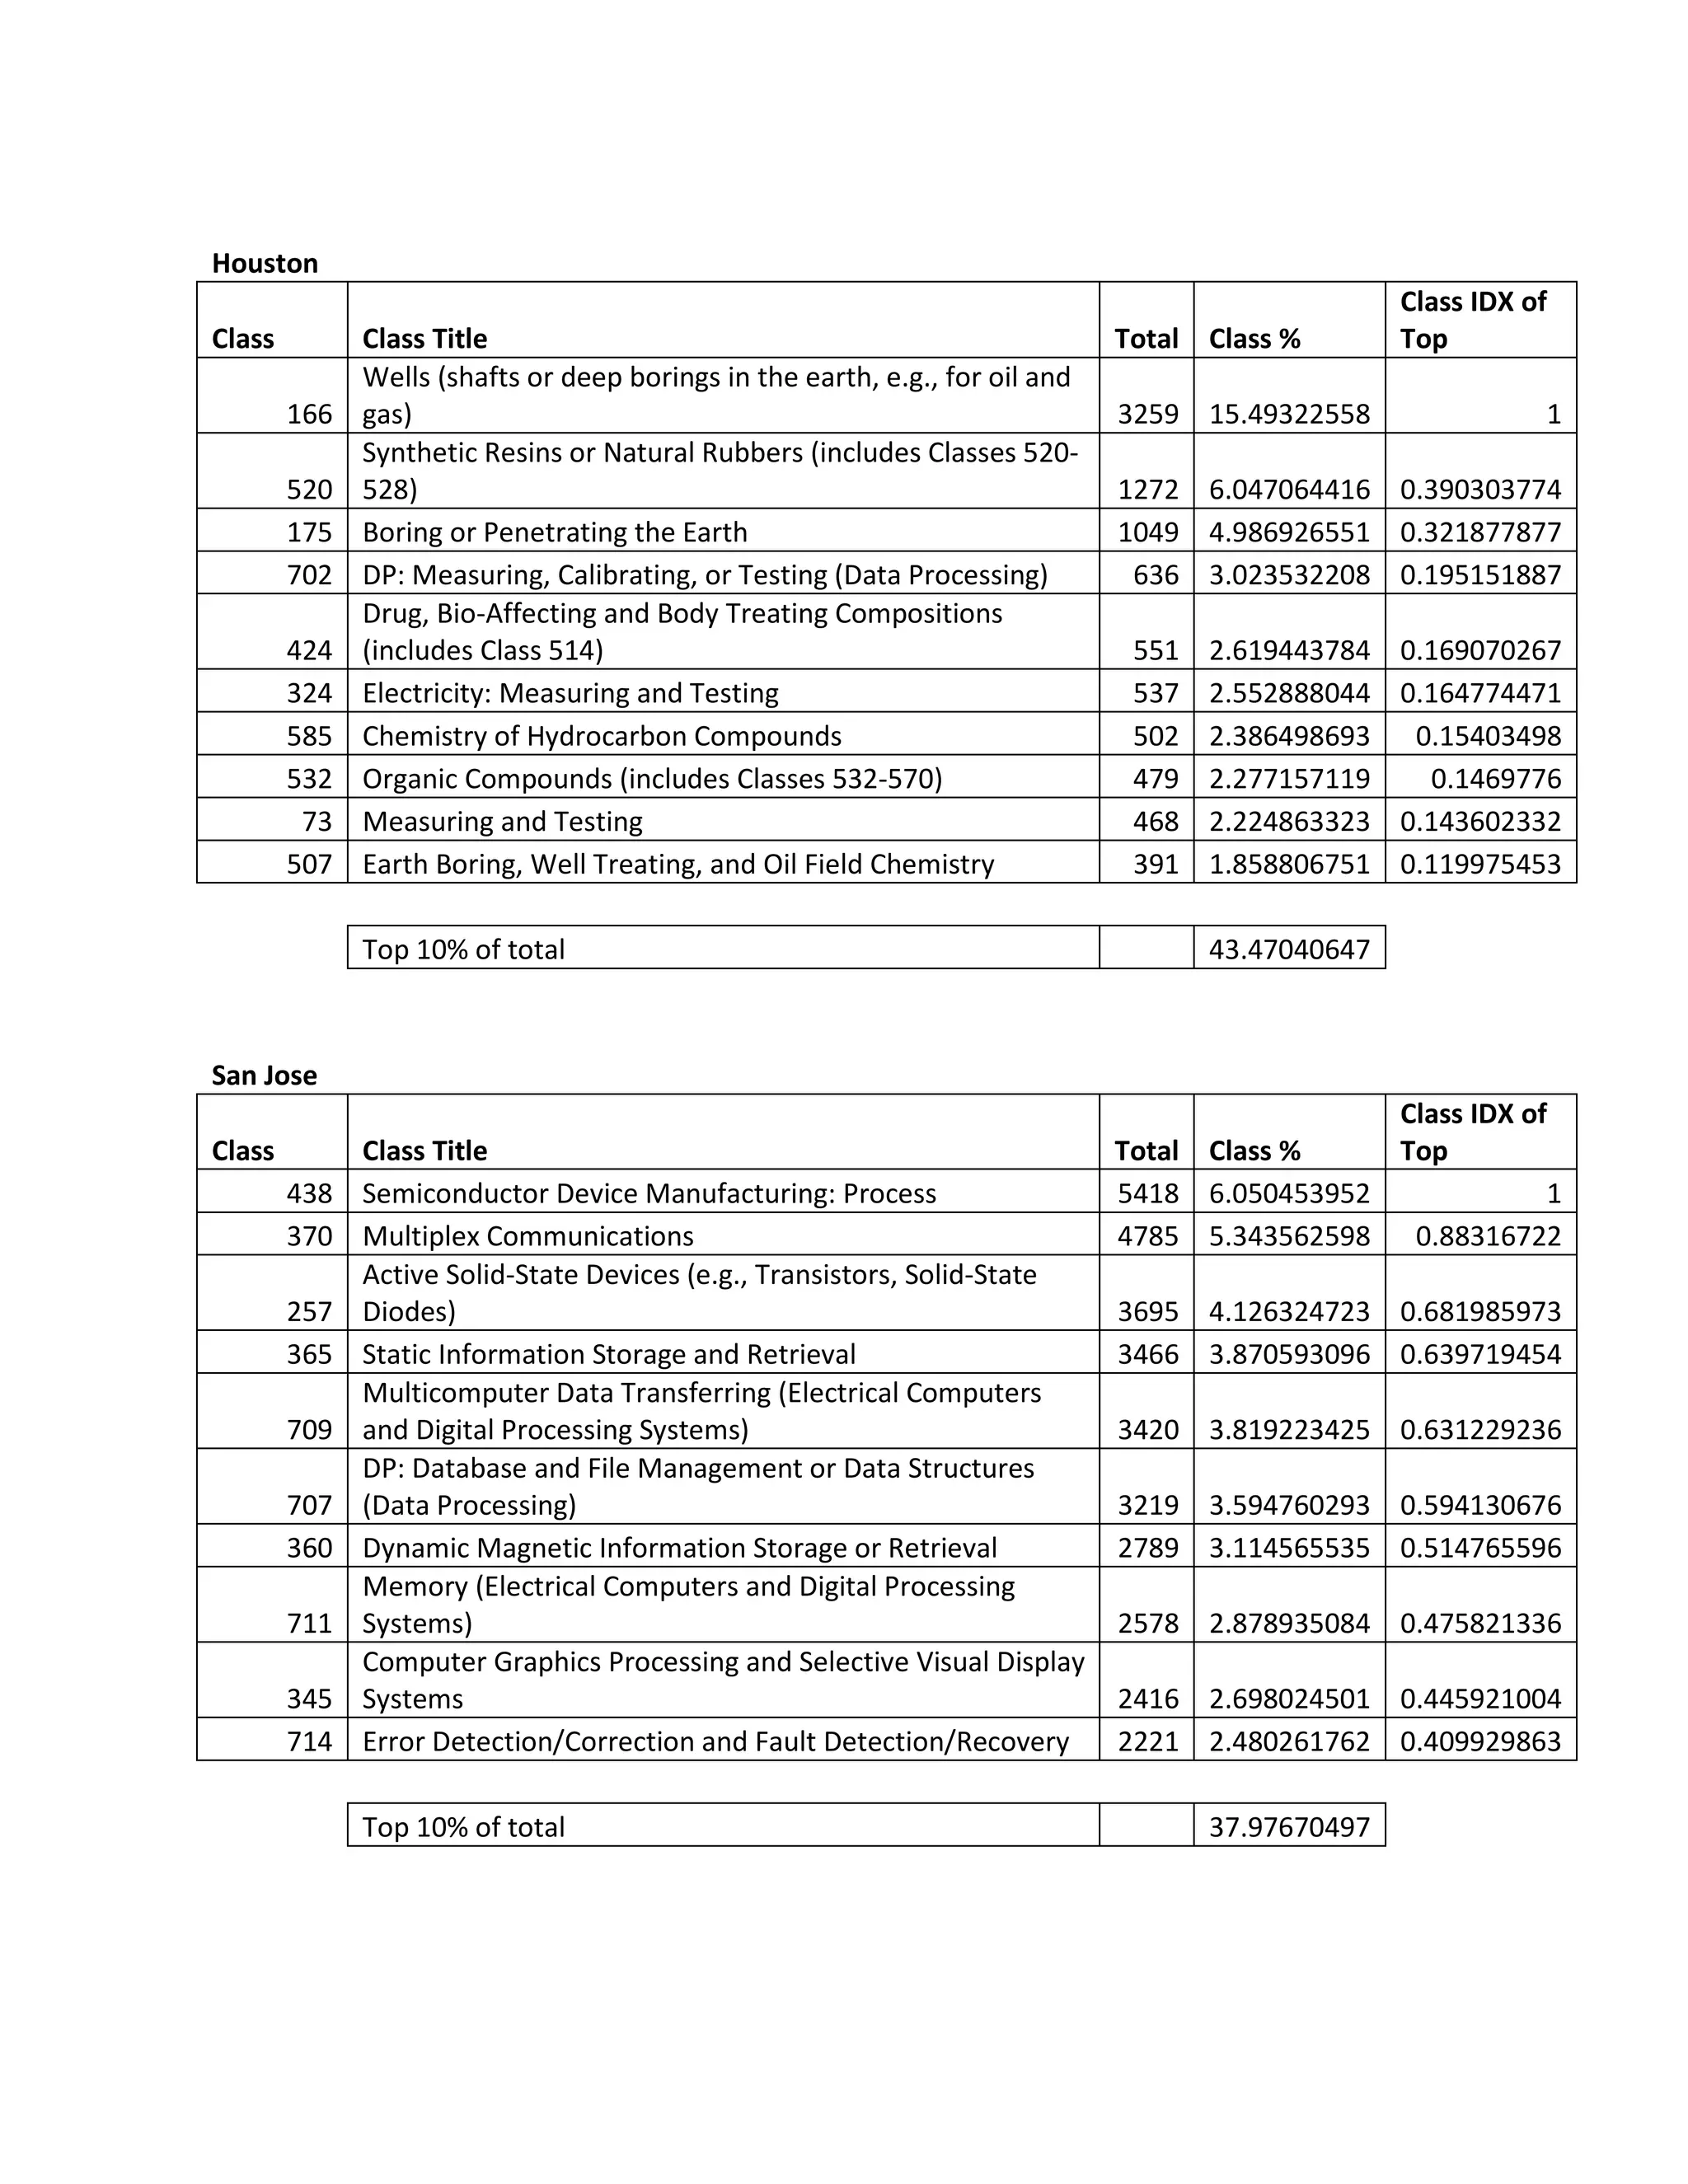
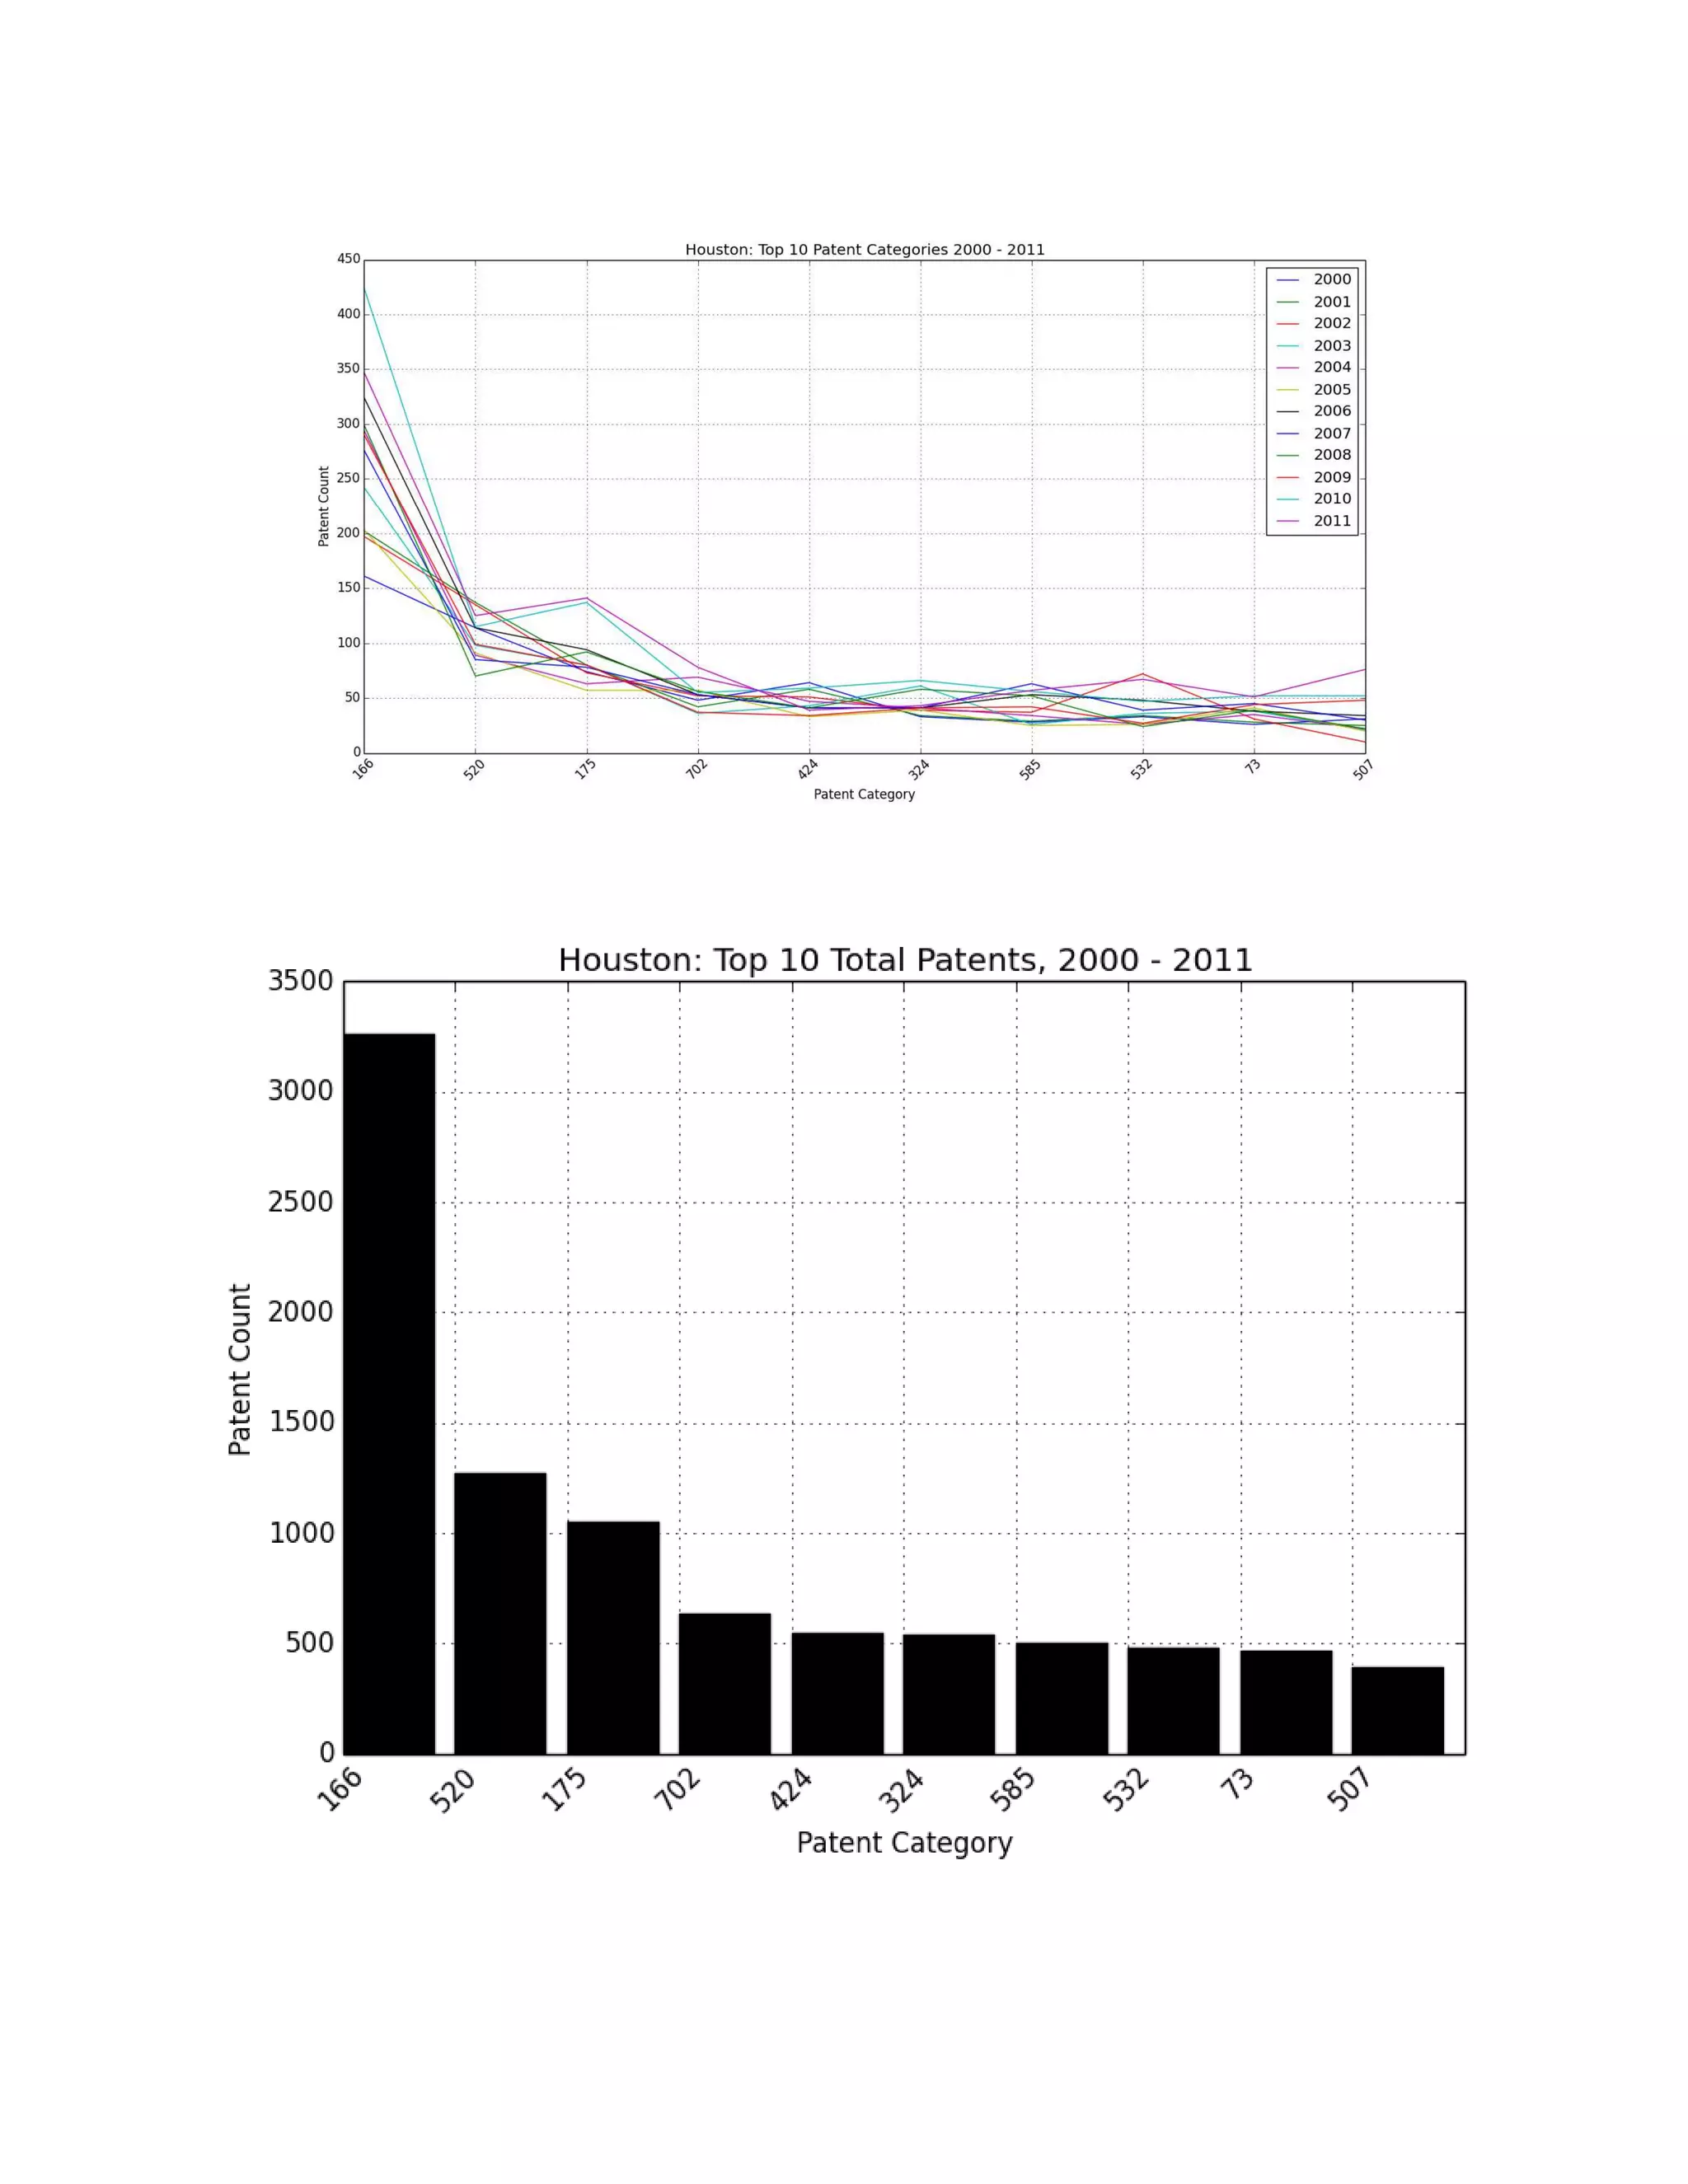
Houston
Houston introduces our first difference
northeast MSAs, with the top 10 technologies accounting for 43% of all patent activity and the drop off
from the first place patent class (Wells [
second (Synthetic Resins or Natural Rubbers
innovatively, with respect to patent activity over the past decade, of
report.
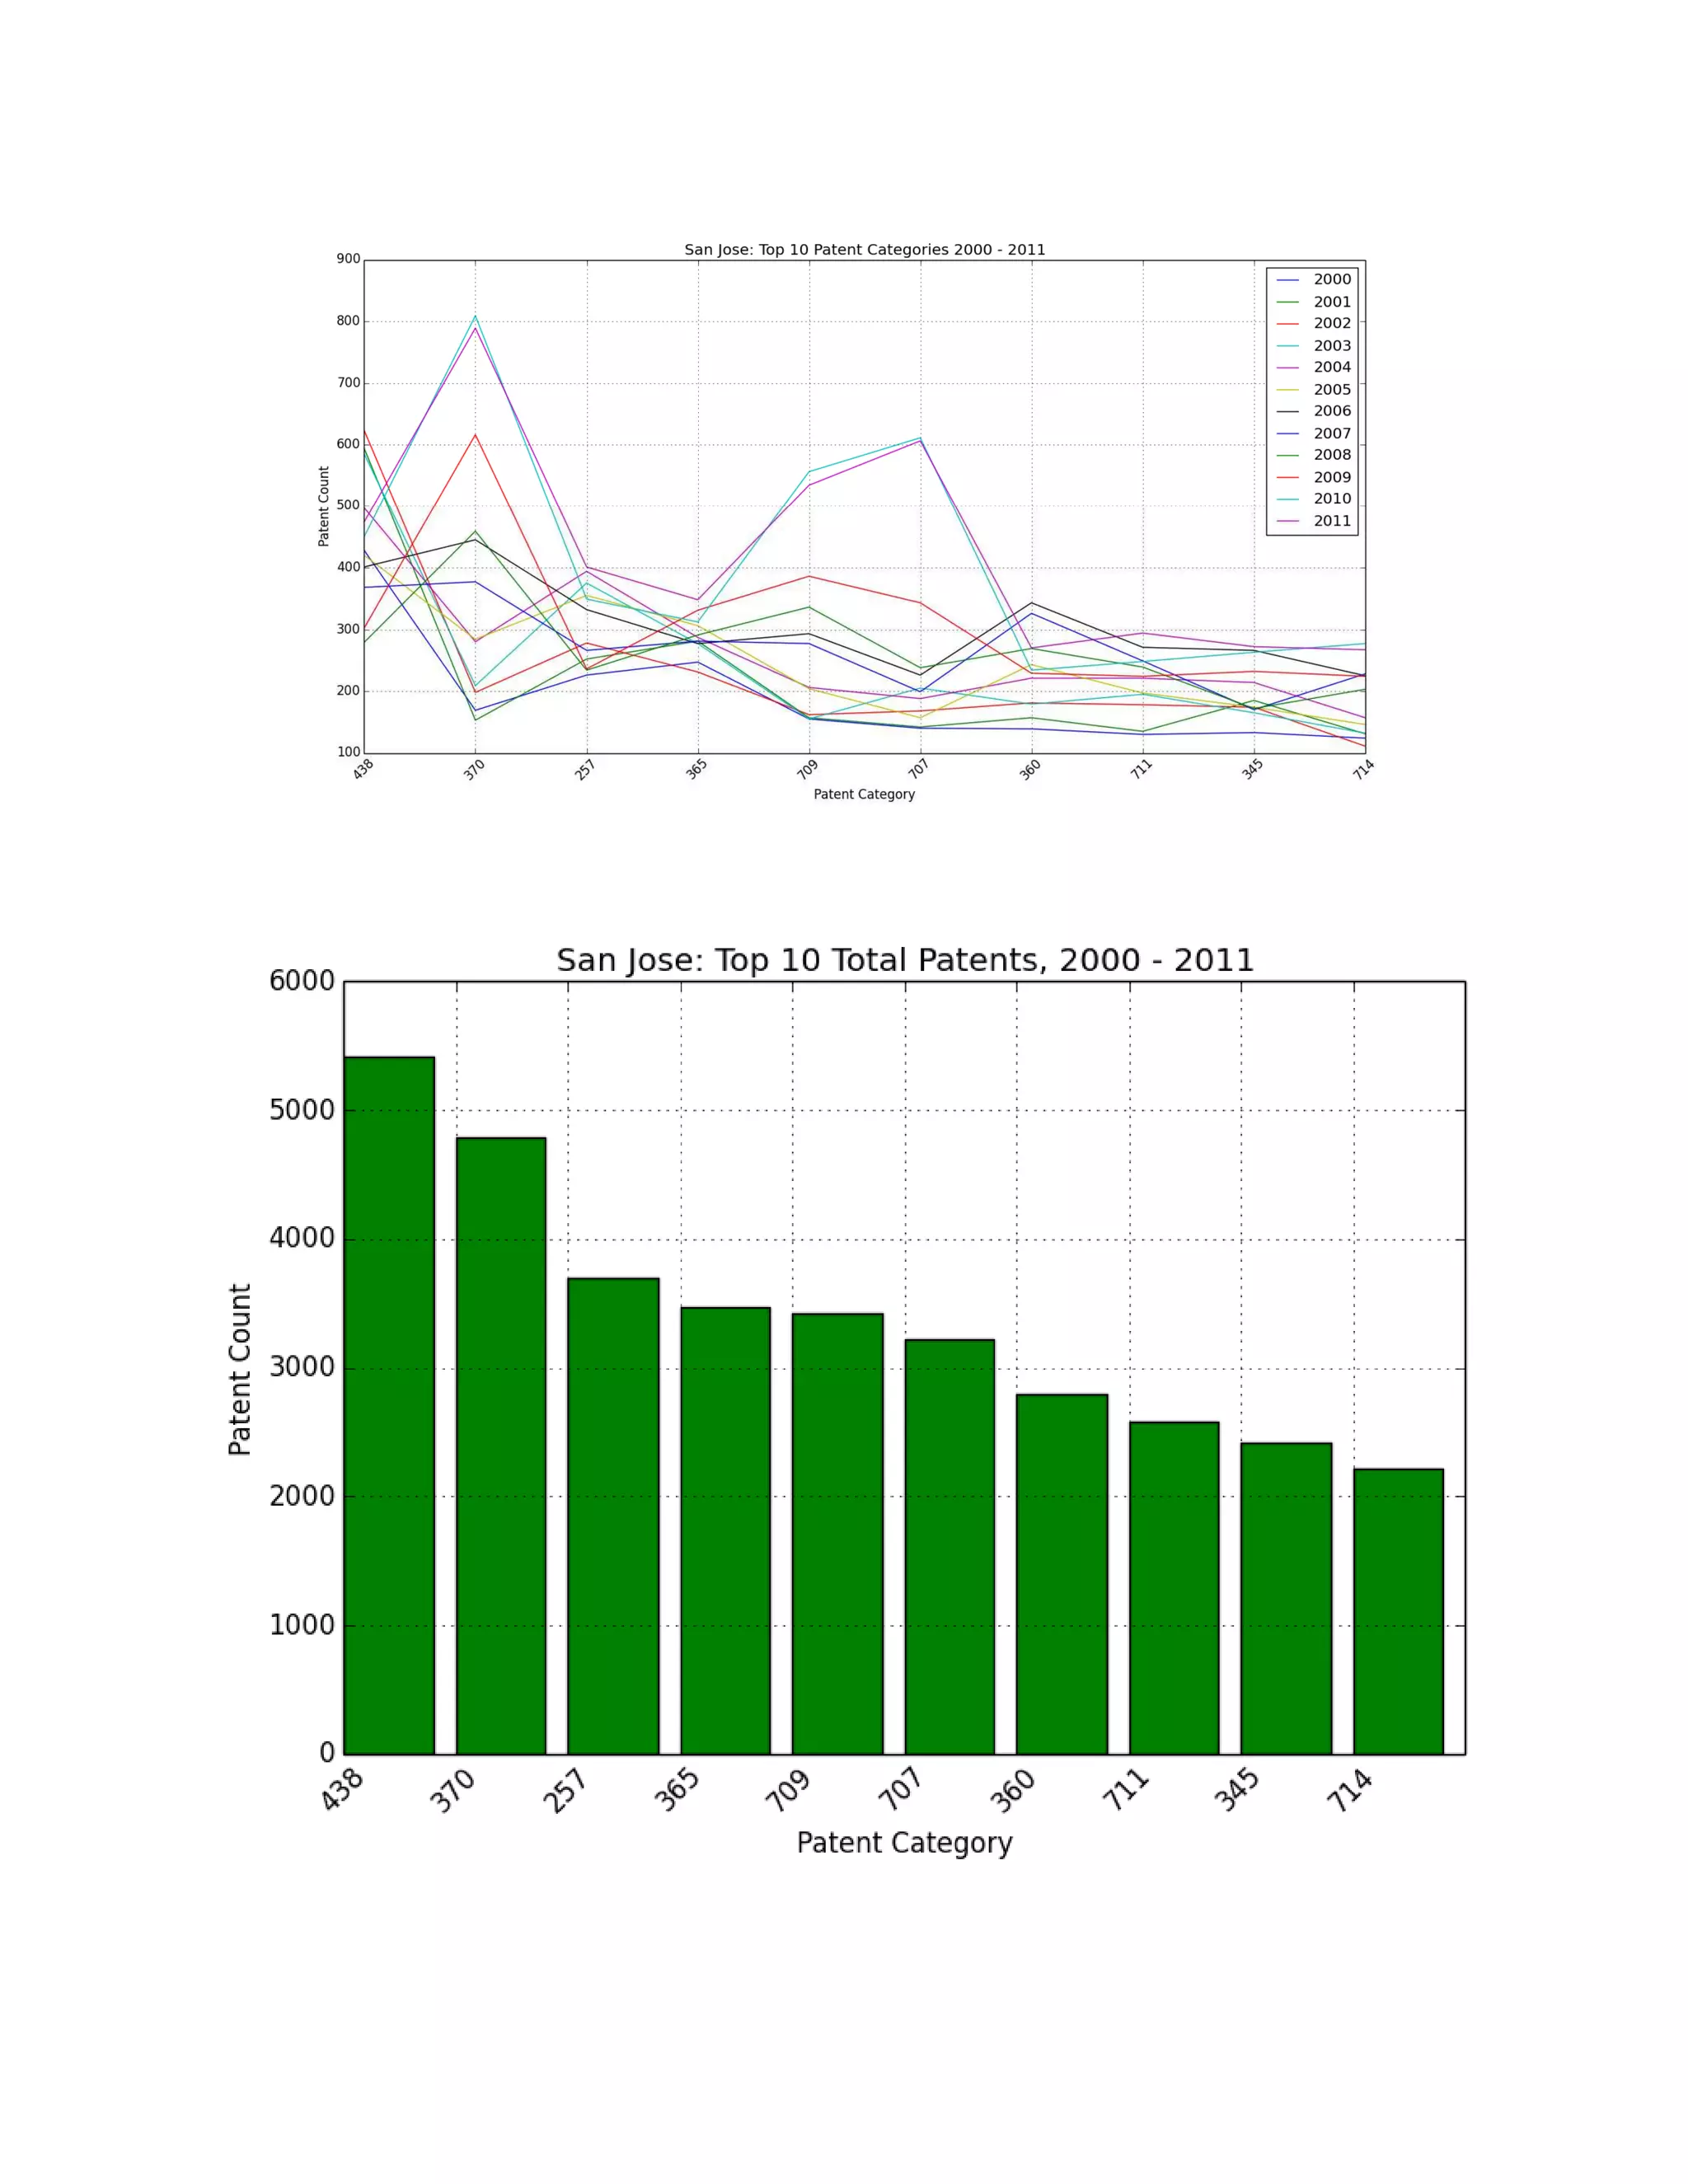
San Jose
San Jose is also unlike the northeast MSA
to be both more concentrated and more diverse
Of the three additionally selected MSAs, Boston is the one most in line with New York. Boston
a third of all patent activity and there is a similar drop off from technology #1
Affecting and Body Treating Compositions) to technology #2 (Chemistry: Molecular Biology
Houston introduces our first differences in the MSA comparison: it is more “top heavy
technologies accounting for 43% of all patent activity and the drop off
Wells [shafts or deep borings in the earth, e.g., for oil and gas]
Synthetic Resins or Natural Rubbers) is over 60%. Houston would appear to be
tent activity over the past decade, of the four MSA’s highlighted in this
the northeast MSAs but in a different way than Houston. San Jose would appear
to be both more concentrated and more diverse than New York, a paradox revealed by the numbers.
Of the three additionally selected MSAs, Boston is the one most in line with New York. Boston’s top ten
drop off from technology #1
Chemistry: Molecular Biology
top heavy” than the two
technologies accounting for 43% of all patent activity and the drop off
he earth, e.g., for oil and gas]) to the
) is over 60%. Houston would appear to be the least diverse
s highlighted in this
in a different way than Houston. San Jose would appear
revealed by the numbers.](https://image.slidesharecdn.com/stancutassign05-150613014015-lva1-app6892/75/Spatial-Patterns-of-Urban-Innovation-and-Productivity-7-2048.jpg)

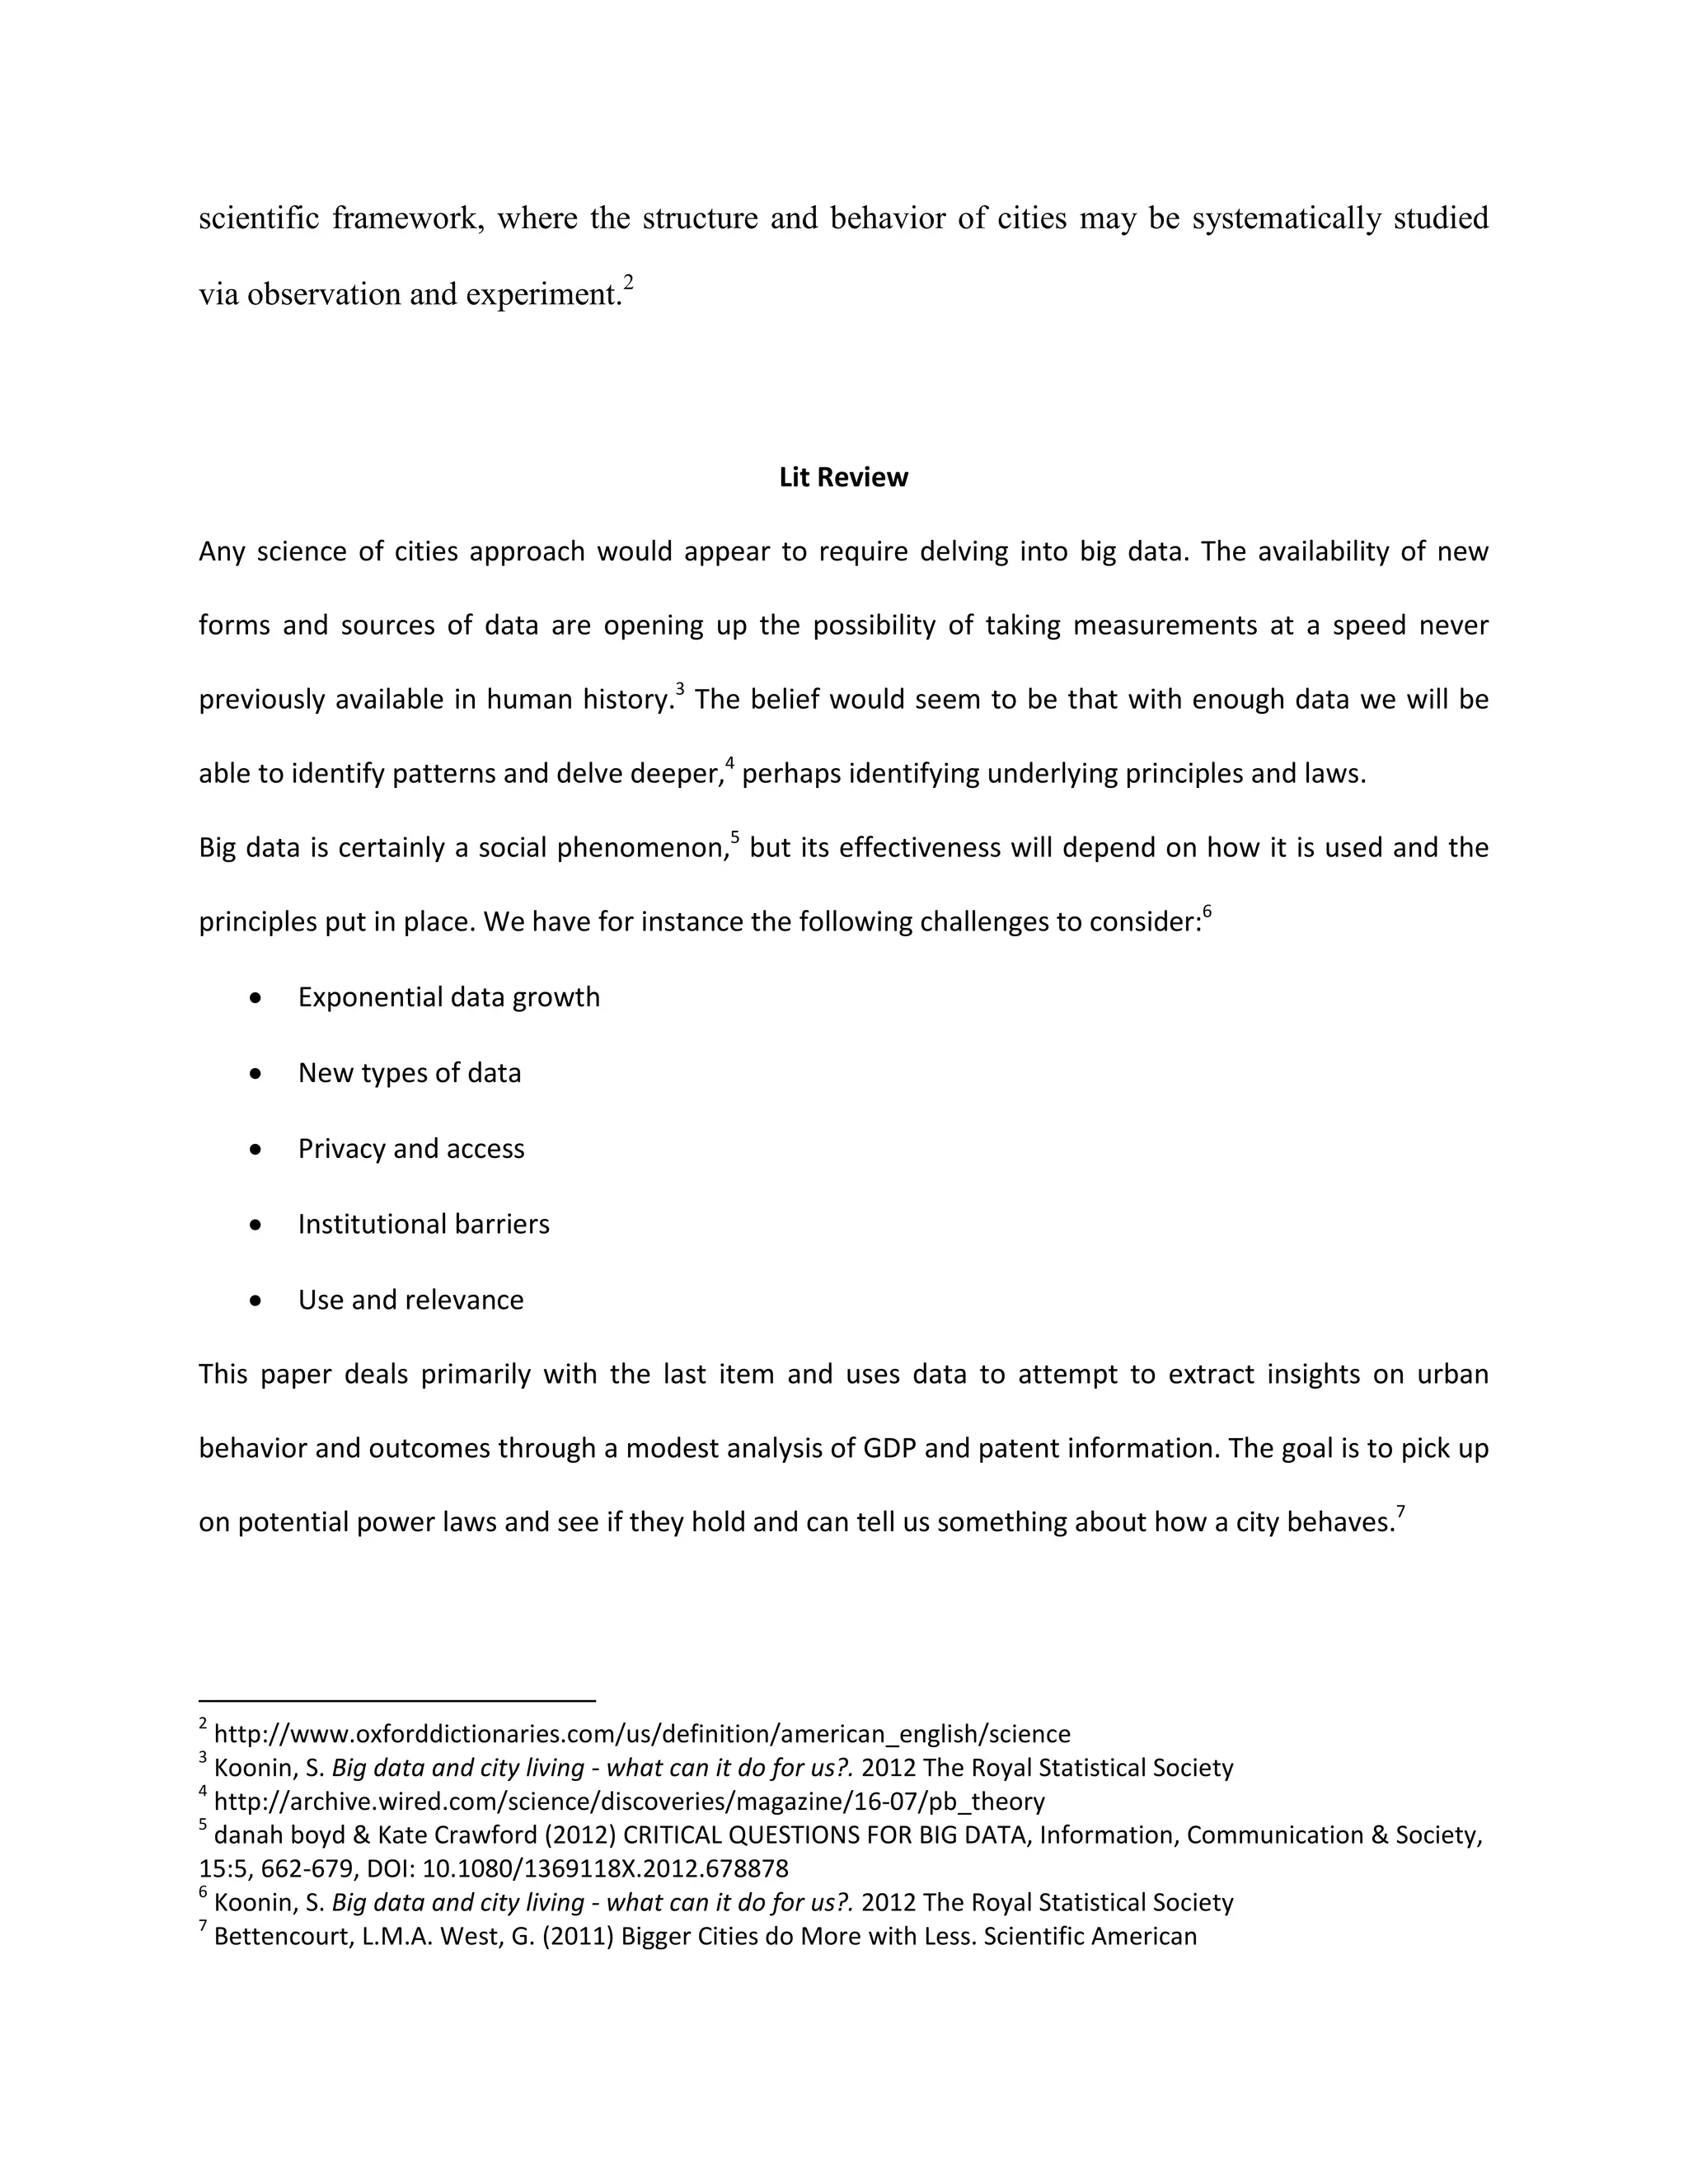
![MSA Patenting and Economic Performance
OLS Regression Results
==============================================================================
Dep. Variable: GDP Avg 2008
Model: OLS Adj. R
Method: Least Squares F
Date: Tue, 16 Dec 2014 Prob (F
Time: 12:09:49 Log
No. Observations: 344 AIC: 1886.
Df Residuals: 343 BIC: 1889.
Df Model: 1
=====================================================================================
coef std err t P>|t| [95.0% Conf. Int.]
-------------------------------------------------------------------------------------
Pat Int 2001-2005 3.4530 0.070 49.088 0.000 3.315 3.591
==============================================================================
Omnibus: 3.021 Durbin
Prob(Omnibus):
Skew:
Kurtosis: 3.222 Cond. No. 1.00
Appendix
MSA Patenting and Economic Performance
OLS Regression Results
==============================================================================
Dep. Variable: GDP Avg 2008-2012 R-squared: 0.875
Model: OLS Adj. R-squared: 0.875
Method: Least Squares F-statistic: 2410.
Date: Tue, 16 Dec 2014 Prob (F-statistic): 3.55e
Time: 12:09:49 Log-Likelihood: -
No. Observations: 344 AIC: 1886.
Df Residuals: 343 BIC: 1889.
Df Model: 1
===============================================================================
coef std err t P>|t| [95.0% Conf. Int.]
-------------------------------------------------------------------------------------
2005 3.4530 0.070 49.088 0.000 3.315 3.591
==============================================================================
Omnibus: 3.021 Durbin-Watson: 1.740
0.221 Jarque-Bera (JB): 2.732
Skew: -0.188 Prob(JB): 0.255
Kurtosis: 3.222 Cond. No. 1.00
==============================================================================
squared: 0.875
squared: 0.875
statistic: 2410.
statistic): 3.55e-157
-941.79
No. Observations: 344 AIC: 1886.
Df Residuals: 343 BIC: 1889.
Df Model: 1
===============================================================================
coef std err t P>|t| [95.0% Conf. Int.]
-------------------------------------------------------------------------------------
2005 3.4530 0.070 49.088 0.000 3.315 3.591
==============================================================================
Watson: 1.740
Bera (JB): 2.732
0.188 Prob(JB): 0.255
Kurtosis: 3.222 Cond. No. 1.00](https://image.slidesharecdn.com/stancutassign05-150613014015-lva1-app6892/75/Spatial-Patterns-of-Urban-Innovation-and-Productivity-11-2048.jpg)
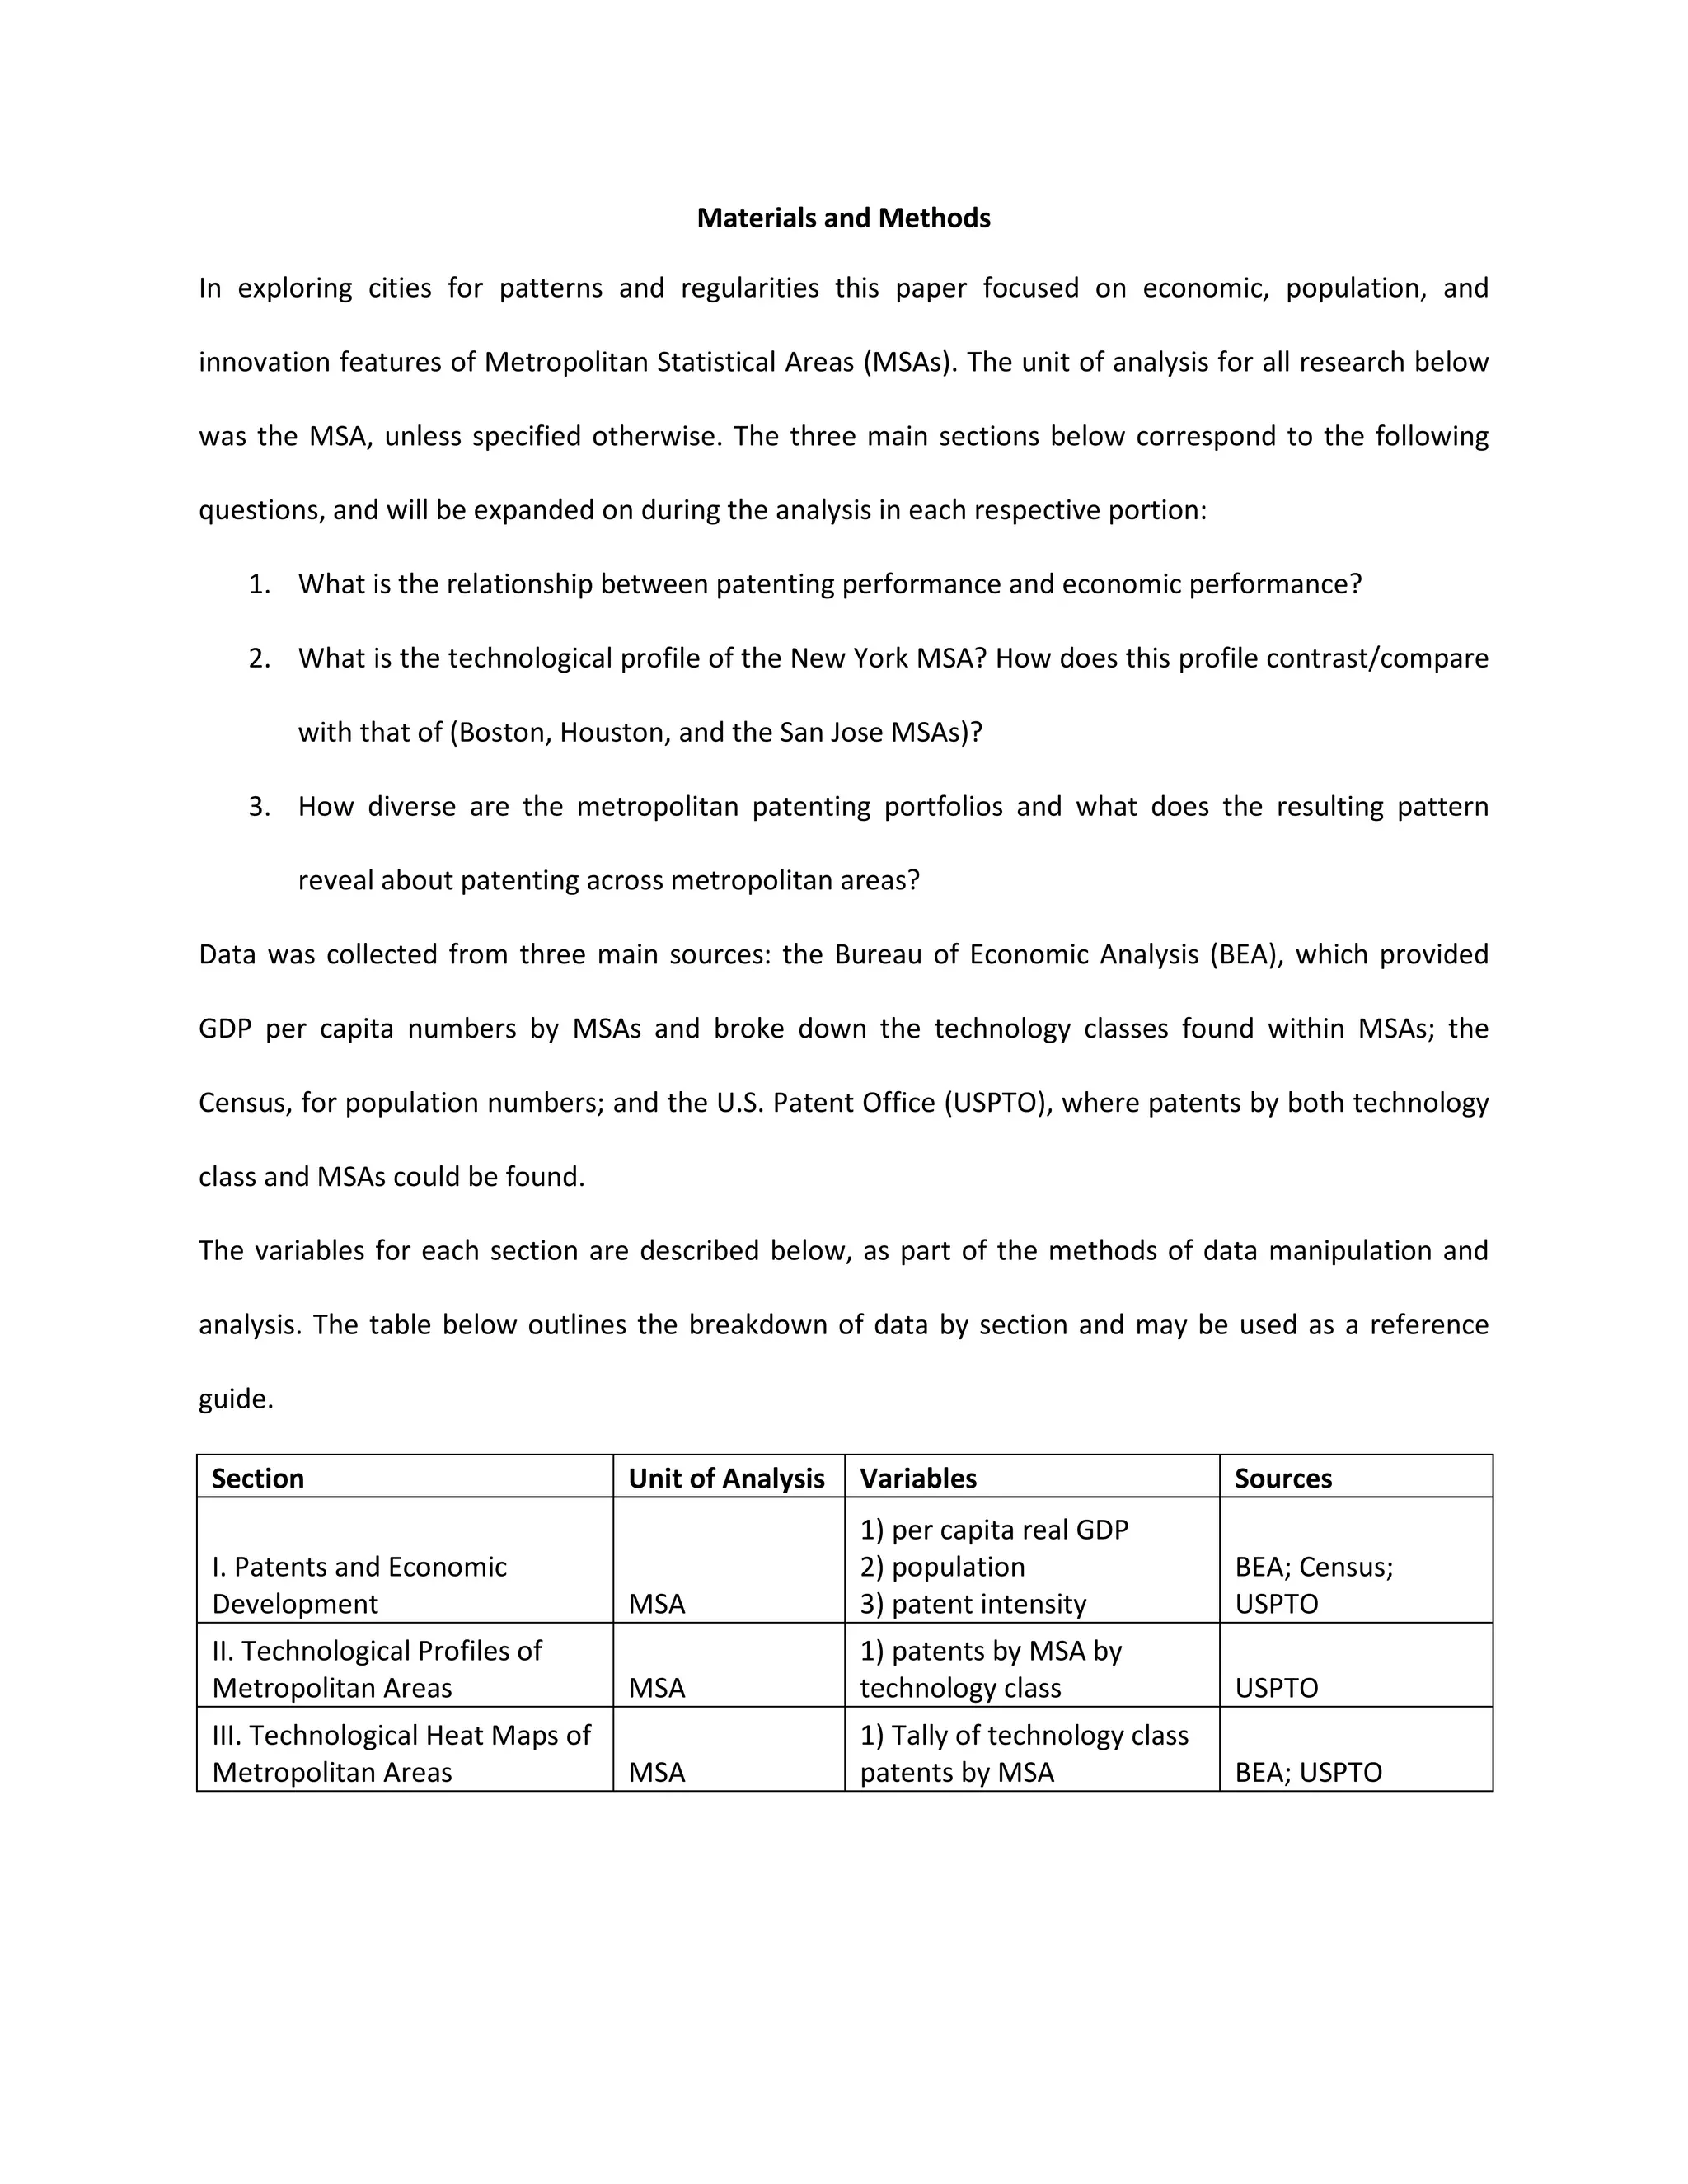
![Population Influence on Patent Intensity
OLS Regression Results
==============================================================================
Dep. Variable: Pat Int 2001
Model: OLS Adj. R
Method: Least Squares F
Date: Tue, 16 Dec 2014 Prob (F
Time: 12:09:14 Log
No. Observations: 344 AIC: 968.7
Df Residuals: 343 BIC: 972
Df Model: 1
==============================================================================
coef std err t P>|t| [95.0% Conf. Int.]
------------------------------------------------------------------------------
Pop 2000 0.2132 0.004 50.610 0.000 0.205 0.222
==============================================================================
Omnibus: 9.2
Prob(Omnibus): 0.010 Jarque
Skew: 0.314 Prob(JB): 0.00660
Kurtosis: 3.553 Cond. No.
==============================================================================
Population Influence on Patent Intensity
OLS Regression Results
==============================================================================
Dep. Variable: Pat Int 2001-2005 R-squared: 0.882
Model: OLS Adj. R-squared: 0.882
Method: Least Squares F-statistic: 2561.
Date: Tue, 16 Dec 2014 Prob (F-statistic): 3.54e
Time: 12:09:14 Log-Likelihood: -
No. Observations: 344 AIC: 968.7
Df Residuals: 343 BIC: 972
Df Model: 1
==============================================================================
coef std err t P>|t| [95.0% Conf. Int.]
--------------------------------------------------------------
Pop 2000 0.2132 0.004 50.610 0.000 0.205 0.222
==============================================================================
Omnibus: 9.290 Durbin-Watson: 1.987
Prob(Omnibus): 0.010 Jarque-Bera (JB): 10.041
Skew: 0.314 Prob(JB): 0.00660
Kurtosis: 3.553 Cond. No.
==============================================================================
==============================================================================
squared: 0.882
squared: 0.882
statistic: 2561.
): 3.54e-161
-483.37
No. Observations: 344 AIC: 968.7
Df Residuals: 343 BIC: 972.6
Df Model: 1
==============================================================================
coef std err t P>|t| [95.0% Conf. Int.]
--------------------------------------------------------------
Pop 2000 0.2132 0.004 50.610 0.000 0.205 0.222
==============================================================================
Watson: 1.987
Bera (JB): 10.041
Skew: 0.314 Prob(JB): 0.00660
1.00
==============================================================================](https://image.slidesharecdn.com/stancutassign05-150613014015-lva1-app6892/75/Spatial-Patterns-of-Urban-Innovation-and-Productivity-12-2048.jpg)
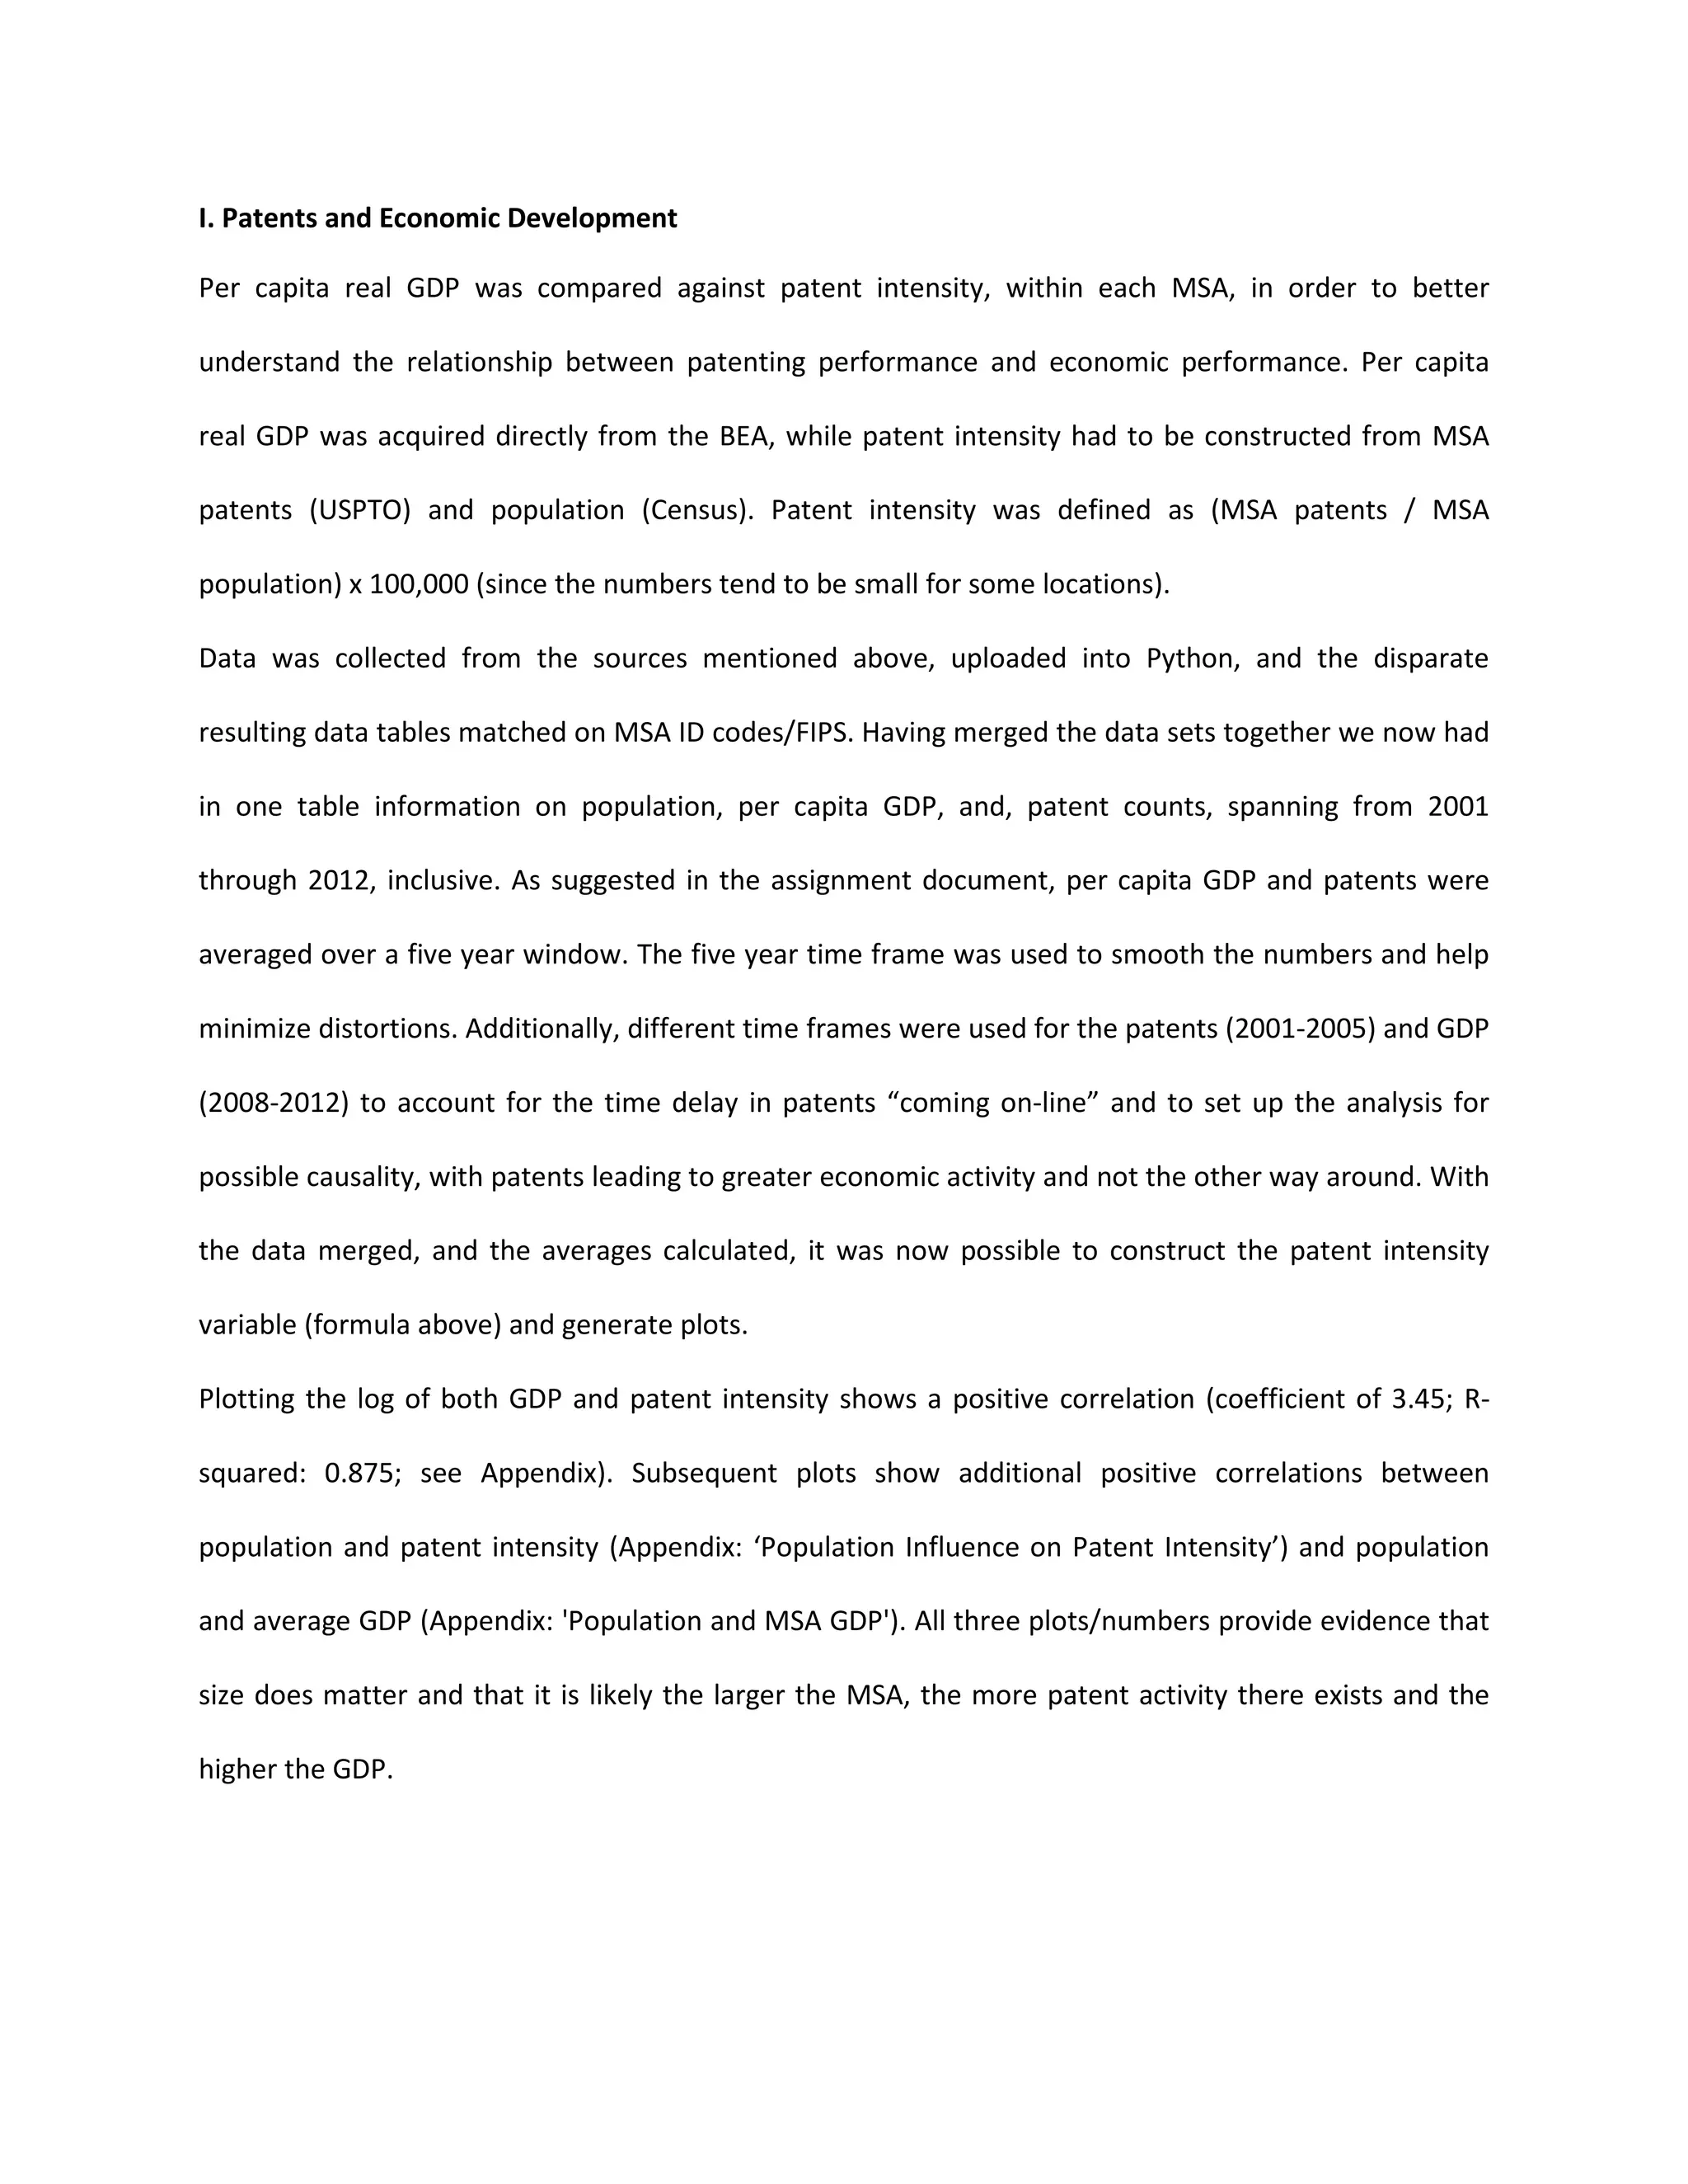
![Population and MSA GDP
OLS Regression Results
============================================================================
Dep. Variable: GDP Avg 2008
Model: OLS Adj. R
Method: Least Squares F
Date: Tue, 16 Dec 2014 Prob (F
Time: 12:08:19 Log
No. Observations: 344 AIC: 7370.
Df Residuals: 3
Df Model: 1
==============================================================================
coef std err t P>|t|
------------------------------------------------------------------------------
Pop 2000 3282.5482 46.276 70.935 0.000 3191.528 3373.568
=========================================================================
Omnibus: 120.603 Durbin
Prob(Omnibus): 0.000 Jarque
Skew: 1.506 Prob(JB): 1.18e
Kurtosis:
==============================================================================
OLS Regression Results
============================================================================
Dep. Variable: GDP Avg 2008-2012 R-squared: 0.936
Model: OLS Adj. R-squared: 0.936
Method: Least Squares F-statistic: 5032.
Tue, 16 Dec 2014 Prob (F-statistic): 4.95e
Time: 12:08:19 Log-Likelihood: -
No. Observations: 344 AIC: 7370.
Df Residuals: 343 BIC: 7374.
Df Model: 1
==============================================================================
coef std err t P>|t| [95.0% Conf. Int.]
------------------------------------------------------------------------------
Pop 2000 3282.5482 46.276 70.935 0.000 3191.528 3373.568
=========================================================================
Omnibus: 120.603 Durbin-Watson: 1.757
Prob(Omnibus): 0.000 Jarque-Bera (JB): 455.576
Skew: 1.506 Prob(JB): 1.18e
7.766 Cond. No. 1.00
==============================================================================
==============================================================================
squared: 0.936
squared: 0.936
statistic: 5032.
statistic): 4.95e-207
-3684.0
No. Observations: 344 AIC: 7370.
43 BIC: 7374.
Df Model: 1
==============================================================================
[95.0% Conf. Int.]
------------------------------------------------------------------------------
Pop 2000 3282.5482 46.276 70.935 0.000 3191.528 3373.568
==============================================================================
Watson: 1.757
Bera (JB): 455.576
Skew: 1.506 Prob(JB): 1.18e-99
7.766 Cond. No. 1.00
==============================================================================](https://image.slidesharecdn.com/stancutassign05-150613014015-lva1-app6892/75/Spatial-Patterns-of-Urban-Innovation-and-Productivity-13-2048.jpg)

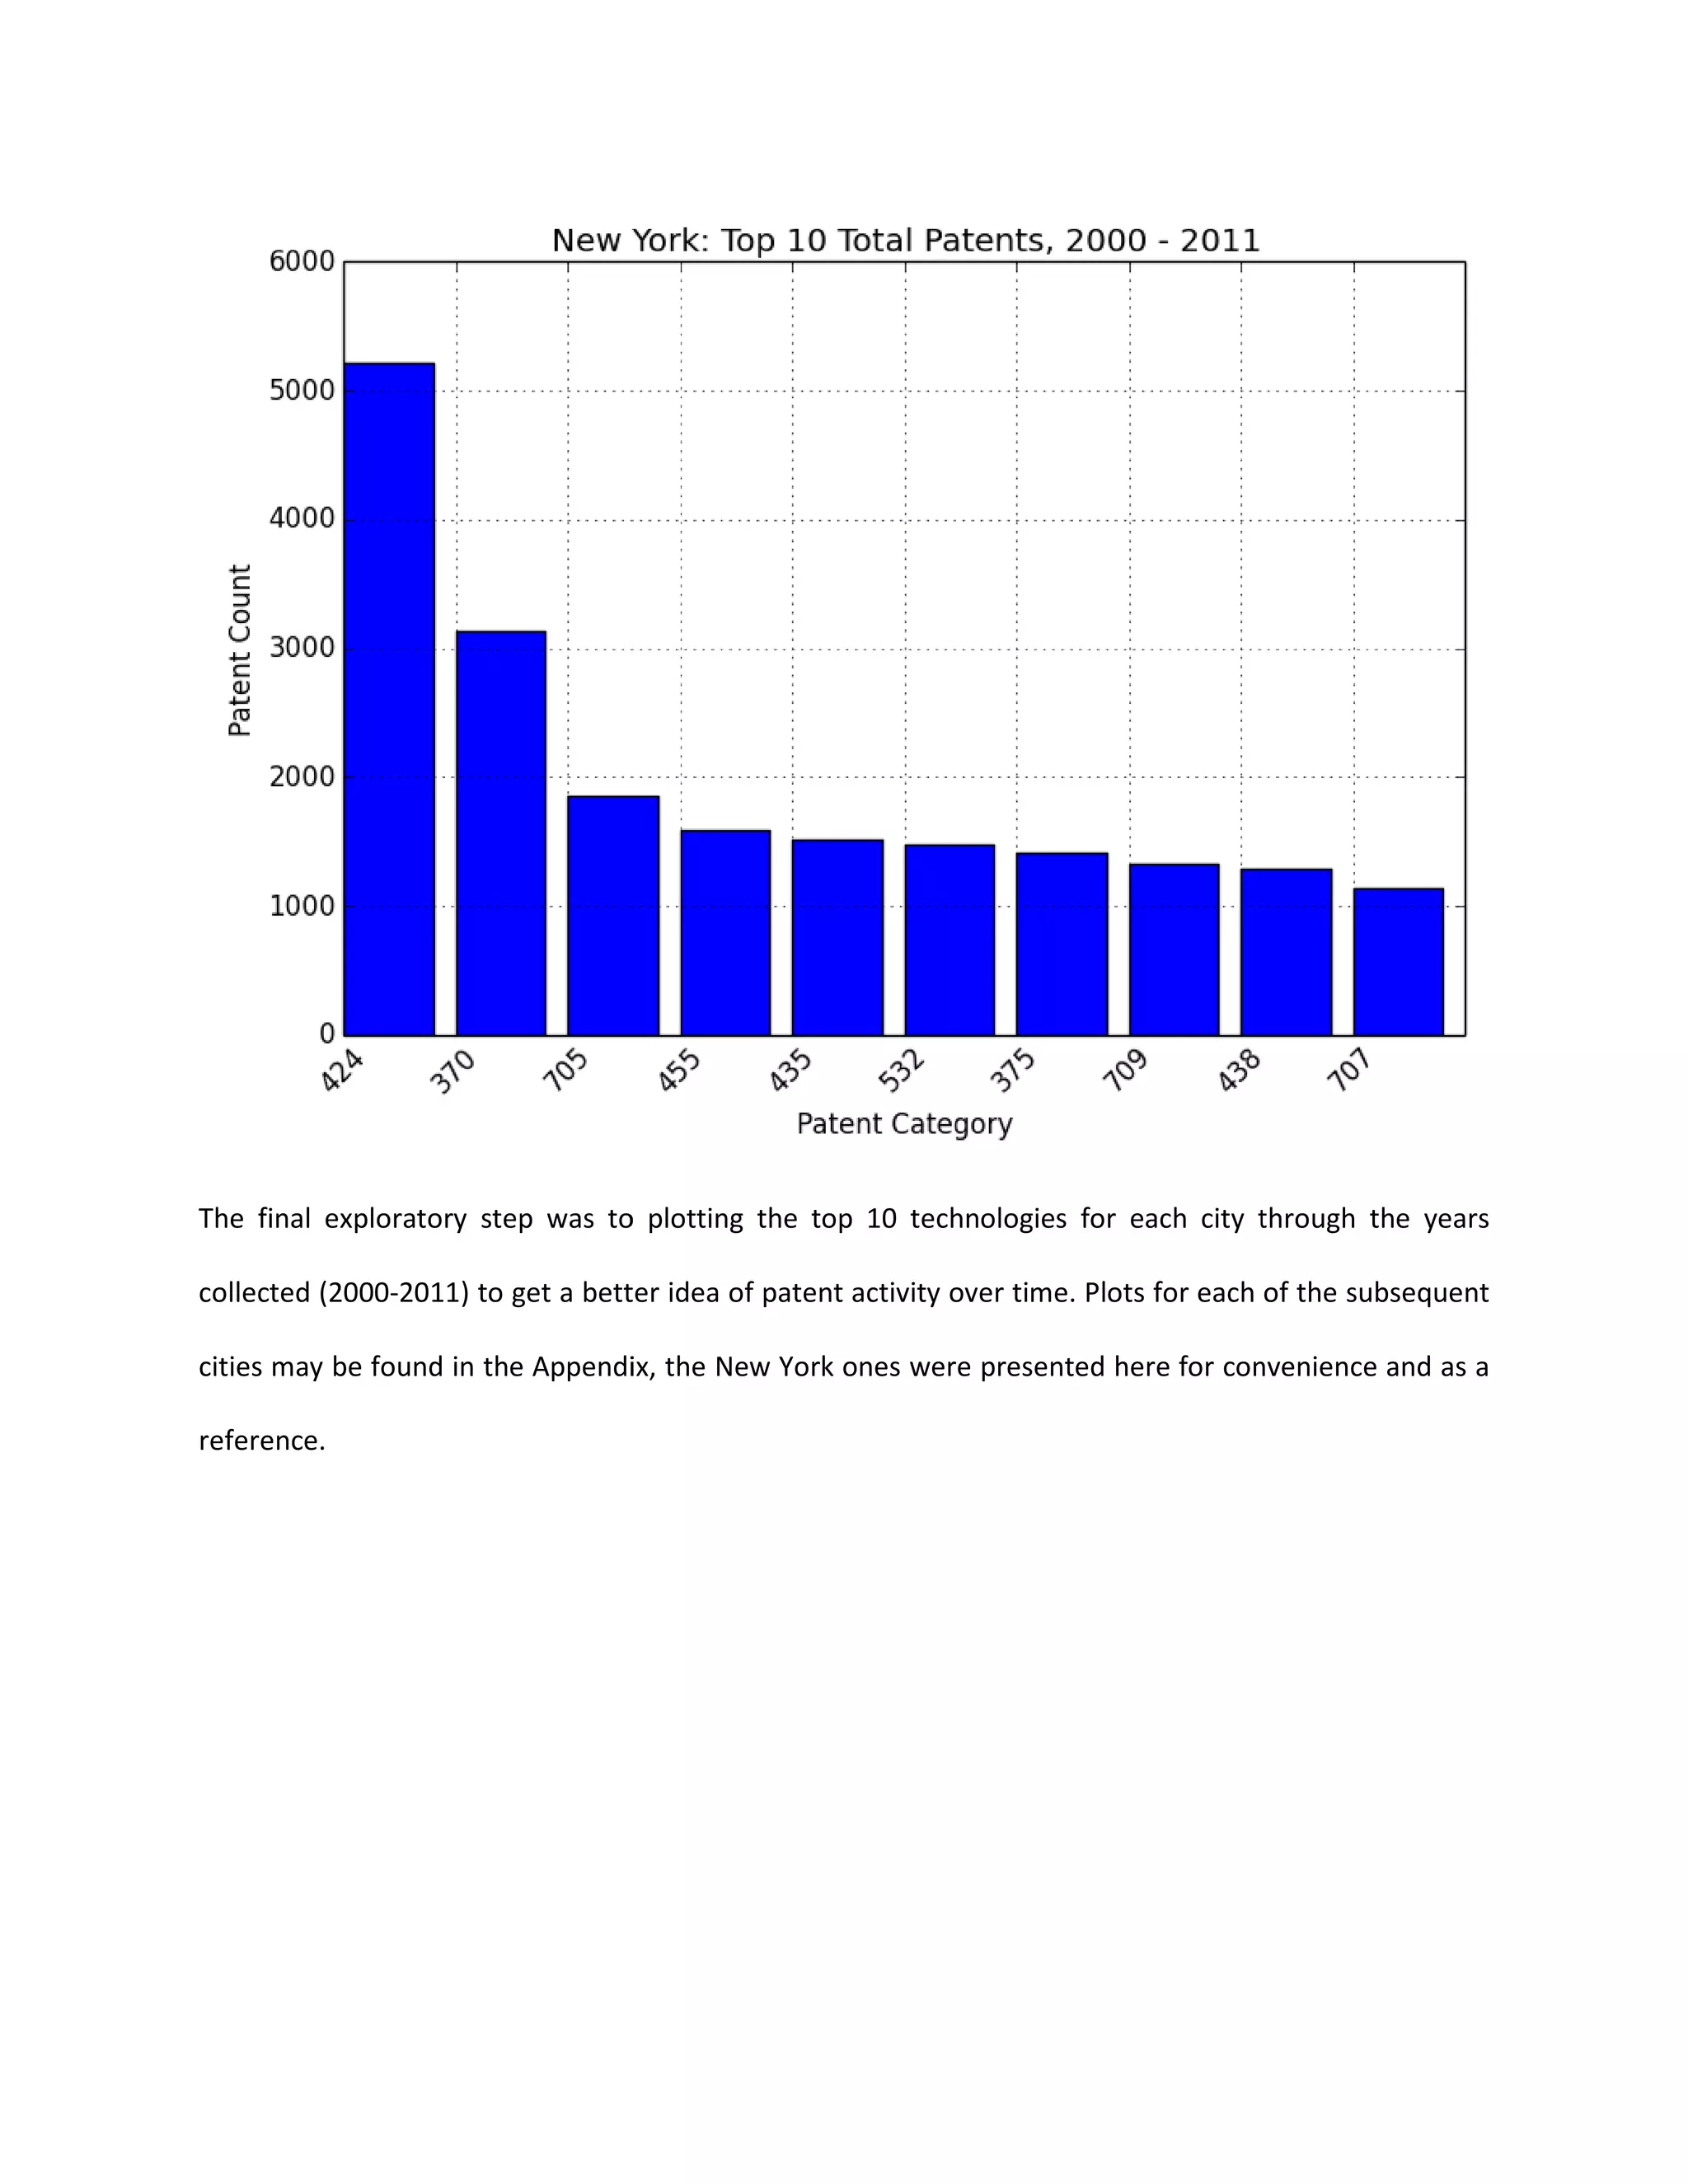
This document analyzes spatial patterns of urban innovation and productivity using data on patents and GDP from various sources. It summarizes the methodology used, which involves comparing patent intensity to GDP per capita across MSAs and analyzing technological profiles of New York, Boston, Houston, and San Jose based on counts of patents by technology class in each area. Key findings include positive correlations between size of MSA and both patent activity and GDP, as well as differences in the technological profiles and concentrations of patents across the selected MSAs.


![[DSC Europe 25] Milan Zdravkovic - The road less traveled in District Heating...](https://cdn.slidesharecdn.com/ss_thumbnails/nfaboniqwsz4ucyctnmy-2-milan-zdravkovic-dsc2025-the-road-less-traveled-in-district-heating-operation-251208151905-f56388a5-thumbnail.jpg?width=640&height=640&fit=bounds)
![[DSC Europe 25] Imai Jen-La Plante - The New Generation: AI and the Future of...](https://cdn.slidesharecdn.com/ss_thumbnails/kxi8t2l5rggivgcenyba-1-jenlaplante-dsc-251208152532-d1e076c2-thumbnail.jpg?width=640&height=640&fit=bounds)


![[DSC Europe 25] Debmalya Biswas - Agentification: the art of transforming man...](https://cdn.slidesharecdn.com/ss_thumbnails/r5azlggvtqiaiiusrqdr-4-251212103249-5a12c89b-thumbnail.jpg?width=640&height=640&fit=bounds)


![[DSC Europe 25] Ivan Peric - Intelligence Swarm Logic and Techno-Functional M...](https://cdn.slidesharecdn.com/ss_thumbnails/7my7c97fsduiccadgavw-2-251212103249-5a03f7c6-thumbnail.jpg?width=640&height=640&fit=bounds)
![[DSC Europe 25] Jon Dajci - Bridging TradFi and DeFi: Building the Future of ...](https://cdn.slidesharecdn.com/ss_thumbnails/fqmhfvlbqhkihjvqvhmu-7-251211083849-6af7e325-thumbnail.jpg?width=640&height=640&fit=bounds)


![[DSC Europe 25] Milan Sekuloski - Data, Defence, and Development: Cybersecuri...](https://cdn.slidesharecdn.com/ss_thumbnails/dfrkwwx4qly6atqpbl4z-4-251209104645-c3d4b0ca-thumbnail.jpg?width=640&height=640&fit=bounds)
![[DSC Europe 25] Katherine Forrest - AI NOW: Understanding the Velocity of Cha...](https://cdn.slidesharecdn.com/ss_thumbnails/wvvbruqfrci0sfq9xwgb-4-251212104007-e5ad1987-thumbnail.jpg?width=640&height=640&fit=bounds)
![[DSC Europe 25] Kaja Kandare - LLM as a judge.pptx](https://cdn.slidesharecdn.com/ss_thumbnails/arxyccaxsdsd1ba99wjw-7-251212104007-2b4e3f64-thumbnail.jpg?width=640&height=640&fit=bounds)


