BusVizPoster-v2
•
0 likes•182 views

This document describes a project to map bus speeds in New York City using historical and real-time MTA bus data. The project analyzes bus location pings every 30 seconds to gain insights into traffic conditions and optimize bus routes. An interactive website allows visualization of bus speeds and statistics. Data is processed using Hadoop and stored in Redis to support the visualizations. The project aims to identify issues that could improve traffic flow and transportation balance.
Recommended

Recommended
More Related Content
What's hot
What's hot (20)
Viewers also liked
Viewers also liked (9)
Similar to BusVizPoster-v2
Similar to BusVizPoster-v2 (20)
BusVizPoster-v2
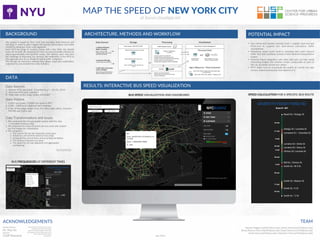
- 1. MAP THE SPEED OF NEW YORK CITY at busvis.cloudapp.net BACKGROUND Our project is based on New York City bus data, both historical and real ;me, in order to gain insights into service performance and traffic condi;ons along bus route road segments. Each MTA bus pings its loca;on (along with a few other trip details) every 30 seconds. By analyzing this data we want to enable planners to adjust appropriately and op;mize routes. We address users who face the challenge of improving bus services, like employees of the MTA or City agencies who are in charge of easing traffic conges;on. We provide an interac;ve website that allows visual data explora;on, supported by accumulated bus data sta;s;cs. DATA Data Sources 1. Historic MTA data (sta;c, 3 months) Aug 1 -‐ Oct 31, 20141 2. Real-‐;me MTA data collec;on1 3. Sta;c data on bus stops, routes, schedules2 Data Volume 1. 3,000+ bus routes, 25,000+ bus stops in NYC 2. 4,500 -‐ 5,000 buses deployed each weekday 3. 1 day of bus pings ranges from 3-‐4 million data points, between 700 MB and 1GB in size Data Transforma;ons and Issues 1. We conducted the first geospa;al analysis with this data → revealed erroneous data 2. We projected the shape ID points per bus route and created bus line shapes for visualiza;on 3. We computed : o The correct IDs for the respec;ve next stops o Actual bus arrival ;mes based on bus pings o Scheduled bus arrival ;mes and according devia;ons o The distance between bus stops o The speed for all road segments and aggregated overlappings 1) h5p://web.mta.info/developers/ 2) h5p://transi=eeds.com/p/mta ARCHITECTURE, METHODS AND WORKFLOW POTENTIAL IMPACT • Our end-‐to-‐end solu;on provides both a scalable back-‐end and front-‐end to support bus data-‐driven interac;ve traffic visualiza;ons. • Iden;fying issues could result in rerou;ng that could improve traffic flow and contribute toward a more balanced transporta;on system. • Poten;al future integra;on with other data sets can help reveal interes;ng insights into whether certain communi;es or parts of the city are beaer served than others. • MTA might have to re-‐evaluate the quality of current bus data and any analy;cal processes that depend on it. BUS FREQUENCIES AT DIFFERENT TIMES SPEED CALCULATION FOR A SPECIFIC BUS ROUTE ACKNOWLEDGEMENTS Faculty Advisor: Dr. Huy Vo Sponsor: CUSP Research TEAM Renate Pinggera (rp2427@nyu.edu) | Kania Azrina (ka1531@nyu.edu) Dimas Rinarso Putro (drp354@nyu.edu) | Radu Stancut (rs1933@nyu.edu) Jiamin Xuan (jx624@nyu.edu) | Eduardo Franco (ef1265@nyu.edu) We would like to thank Huy Vo for his inspiring mentorship, the endless supply of breakfast bagels and his help and support when we almost got lost in the erroneous data for speed calcula;ons. RESULTS: INTERACTIVE BUS SPEED VISUALIZATION BUS SPEED VISUALIZATION AND DASHBOARD July 2015 !from!MTA!Bus!Time!SIRI!API Harvest!daily!data!(for!future!use) write!1!CSV!file!per!day!and!store!on! server Hadoop!+!MapReduce! (+!Python) 2.#Real()me#MTA#data Data!Sources 1.#Historic#MTA#data# (sta)c,#3#months) Aug!1!G!Oct!31,!2014 Historical!shapes,!trips,!stops,! stop!Nmes,!bus!pings Redis!database:!keyGvalue! stored!inGmemory!chache Processing "Processed!Data" copy!data!(scp) Linux!Server:!busvis.cloudapp.net ClientGside:!HTML,!CSS,!Leaflet.js,!,!Mapbox,js,!D3 Nginx!Webserver!+!Flask!Framework VisualizaNon Linux!Server:!128.122.72.169 CUSP!Hadoop!Cluster 3.#Sta)c#data#on#bus#stops,# routes,#schedules hap://web.mta.info/developers/ hap://transiceeds.com/p/mta/ GeoJSON!files! in!file!system and Storage Historic!MTA!data!stored!as!txt!files ServerGside:!Python!scripts!query!and!prepare!data! in!JSON!format G!compute!correct!"next!stop!IDs" G!compute!distance!between!bus!stops G!compute!actual!and!scheduled!bus!arrival!Nmes! G!compute!speed!for!all!road!segments G!average!speed,!aggregate!shape!overlappings ArcGIS G!project!route!shape!ID!points G!connect!points!to!create!bus!line!routes G!convert!to!GeoJSON