Download to read offline
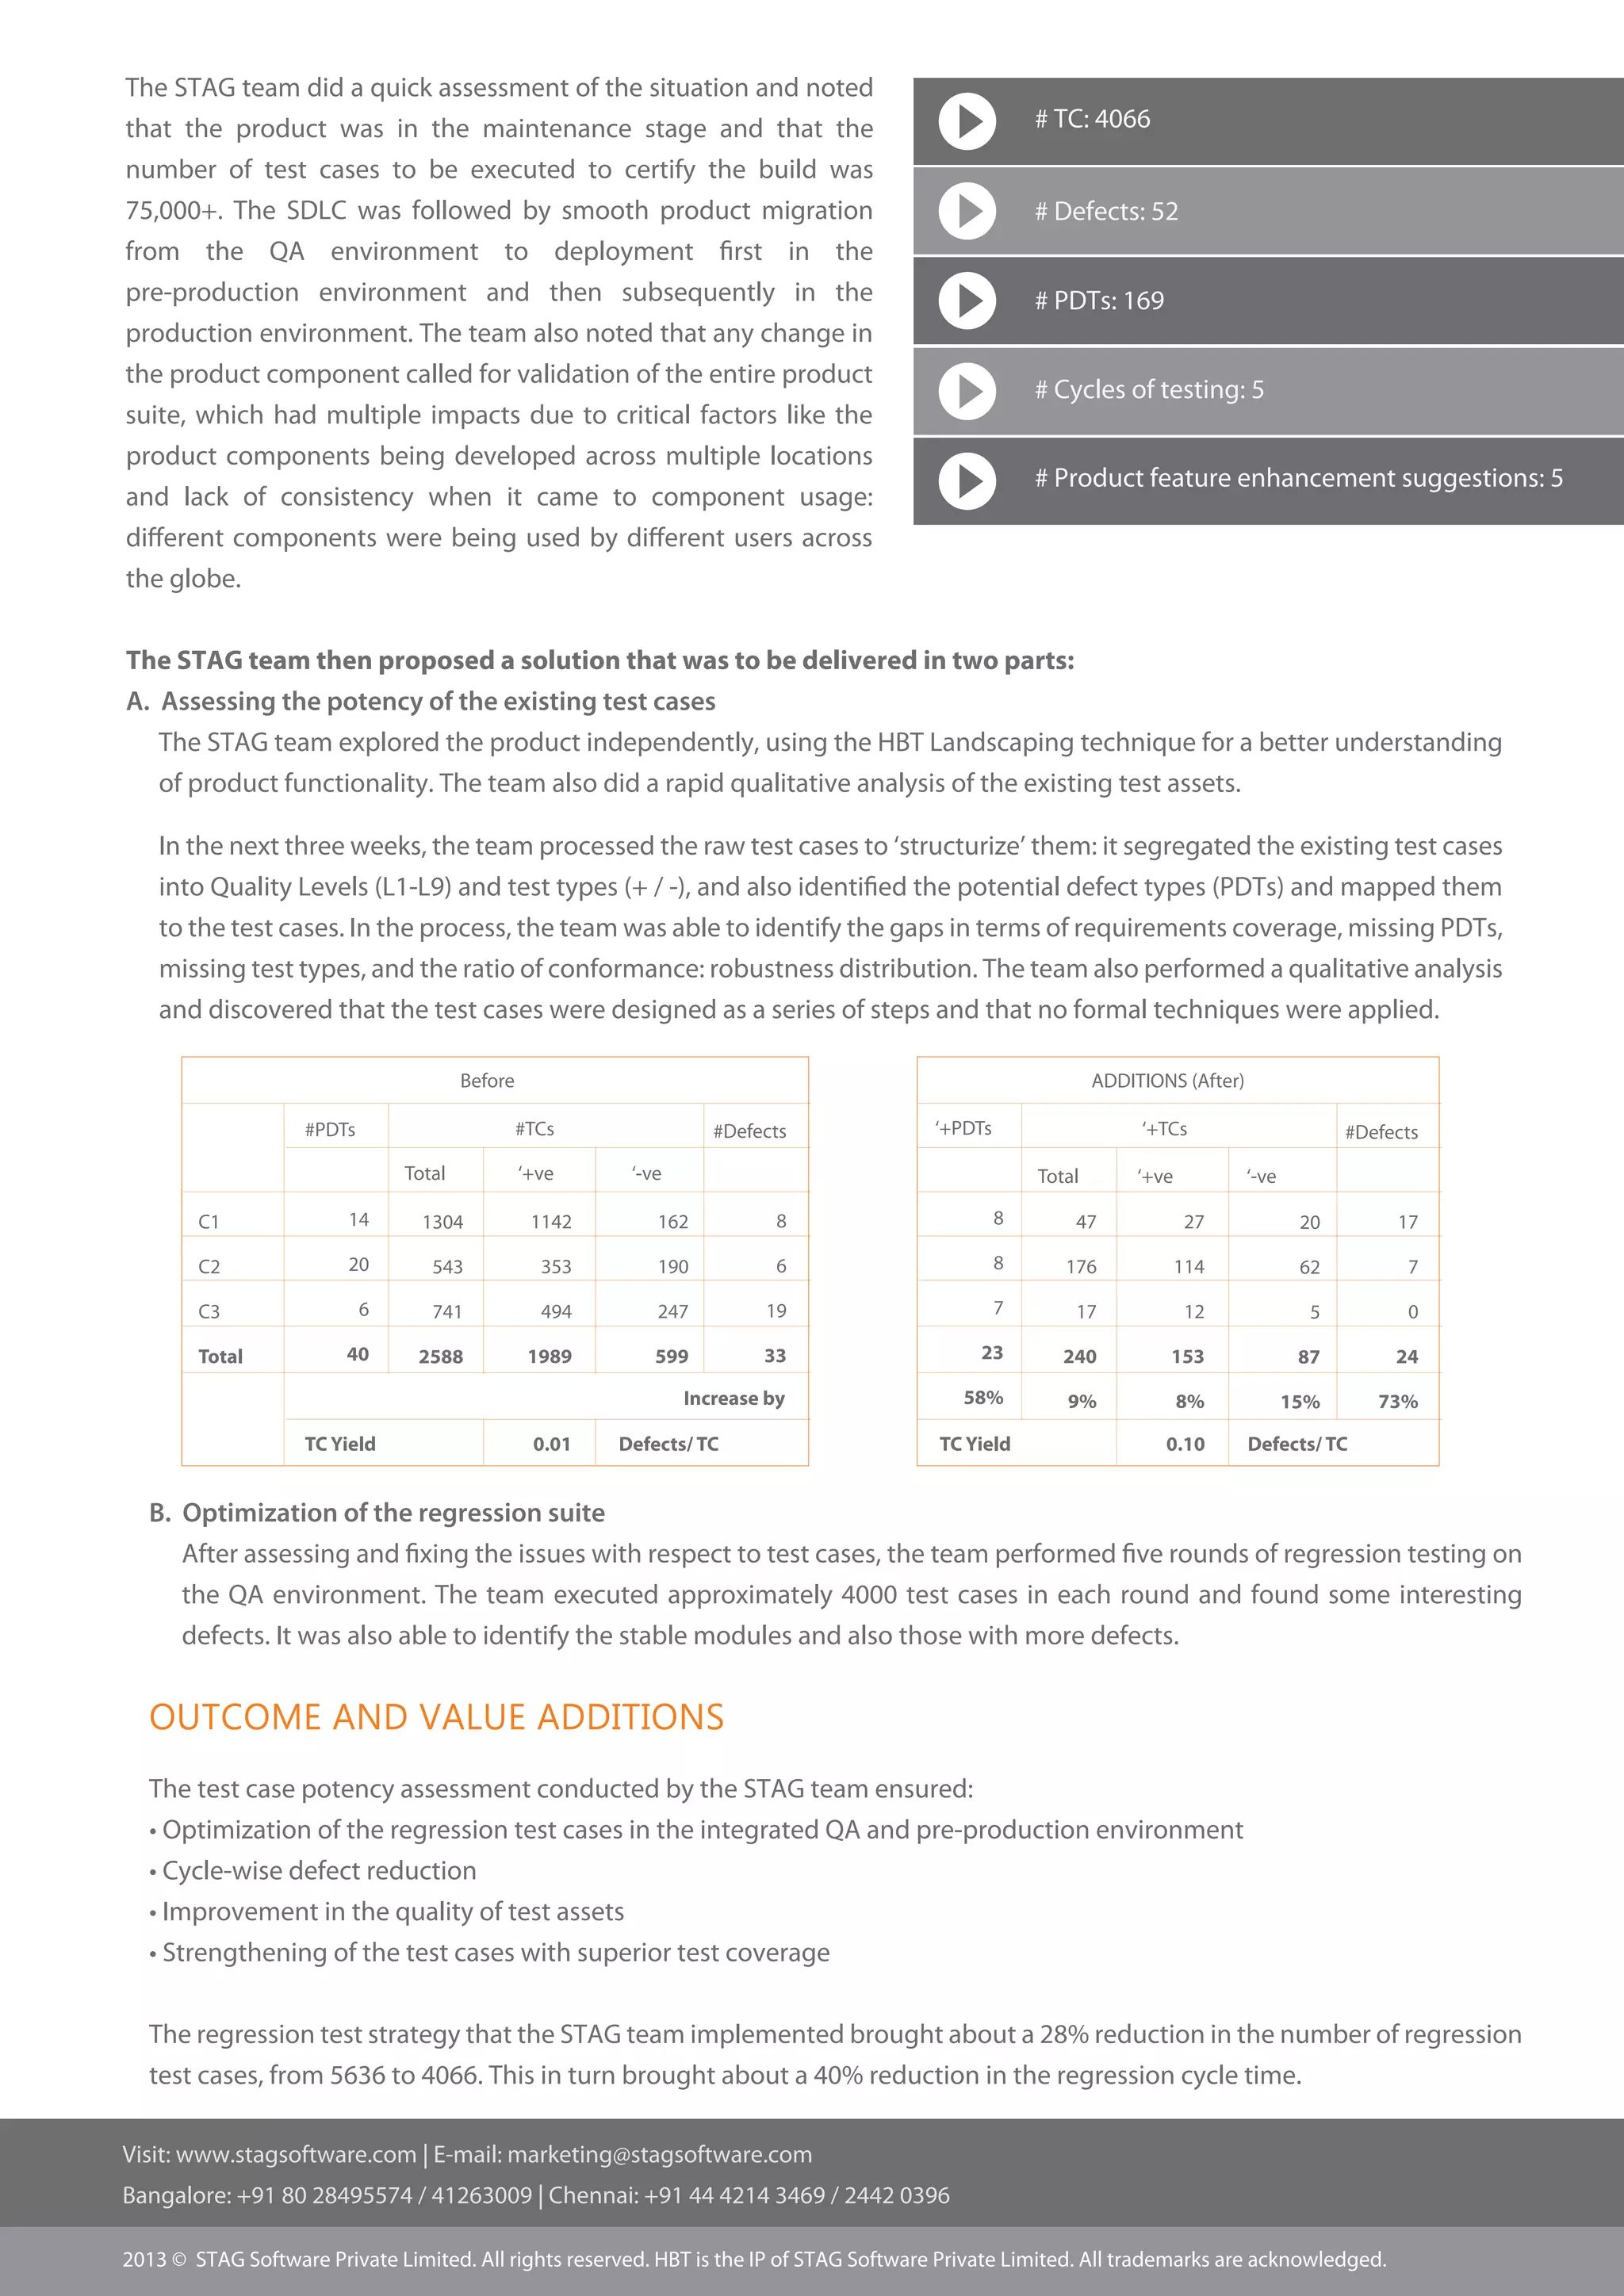

The document outlines a case study on optimizing regression testing for a B2B e-commerce platform, addressing concerns about excessive testing versus development efforts. An independent QA team assessed existing test cases, resulting in a 28% reduction in regression test cases and a 40% decrease in regression cycle time. The assessment also highlighted gaps in test coverage and quality, helping improve the overall testing process for the client.


![Vibe Coding vs. Spec-Driven Development [Free Meetup]](https://cdn.slidesharecdn.com/ss_thumbnails/vibecodingvsspecdrivendevelopment-251209105622-43f455e7-thumbnail.jpg?width=640&height=640&fit=bounds)


![Coded Agents – with UiPath SDK + LangGraph [Virtual Hands-on Workshop]](https://cdn.slidesharecdn.com/ss_thumbnails/codedagentsdeck-251215155422-5497c599-thumbnail.jpg?width=640&height=640&fit=bounds)


