Download to read offline
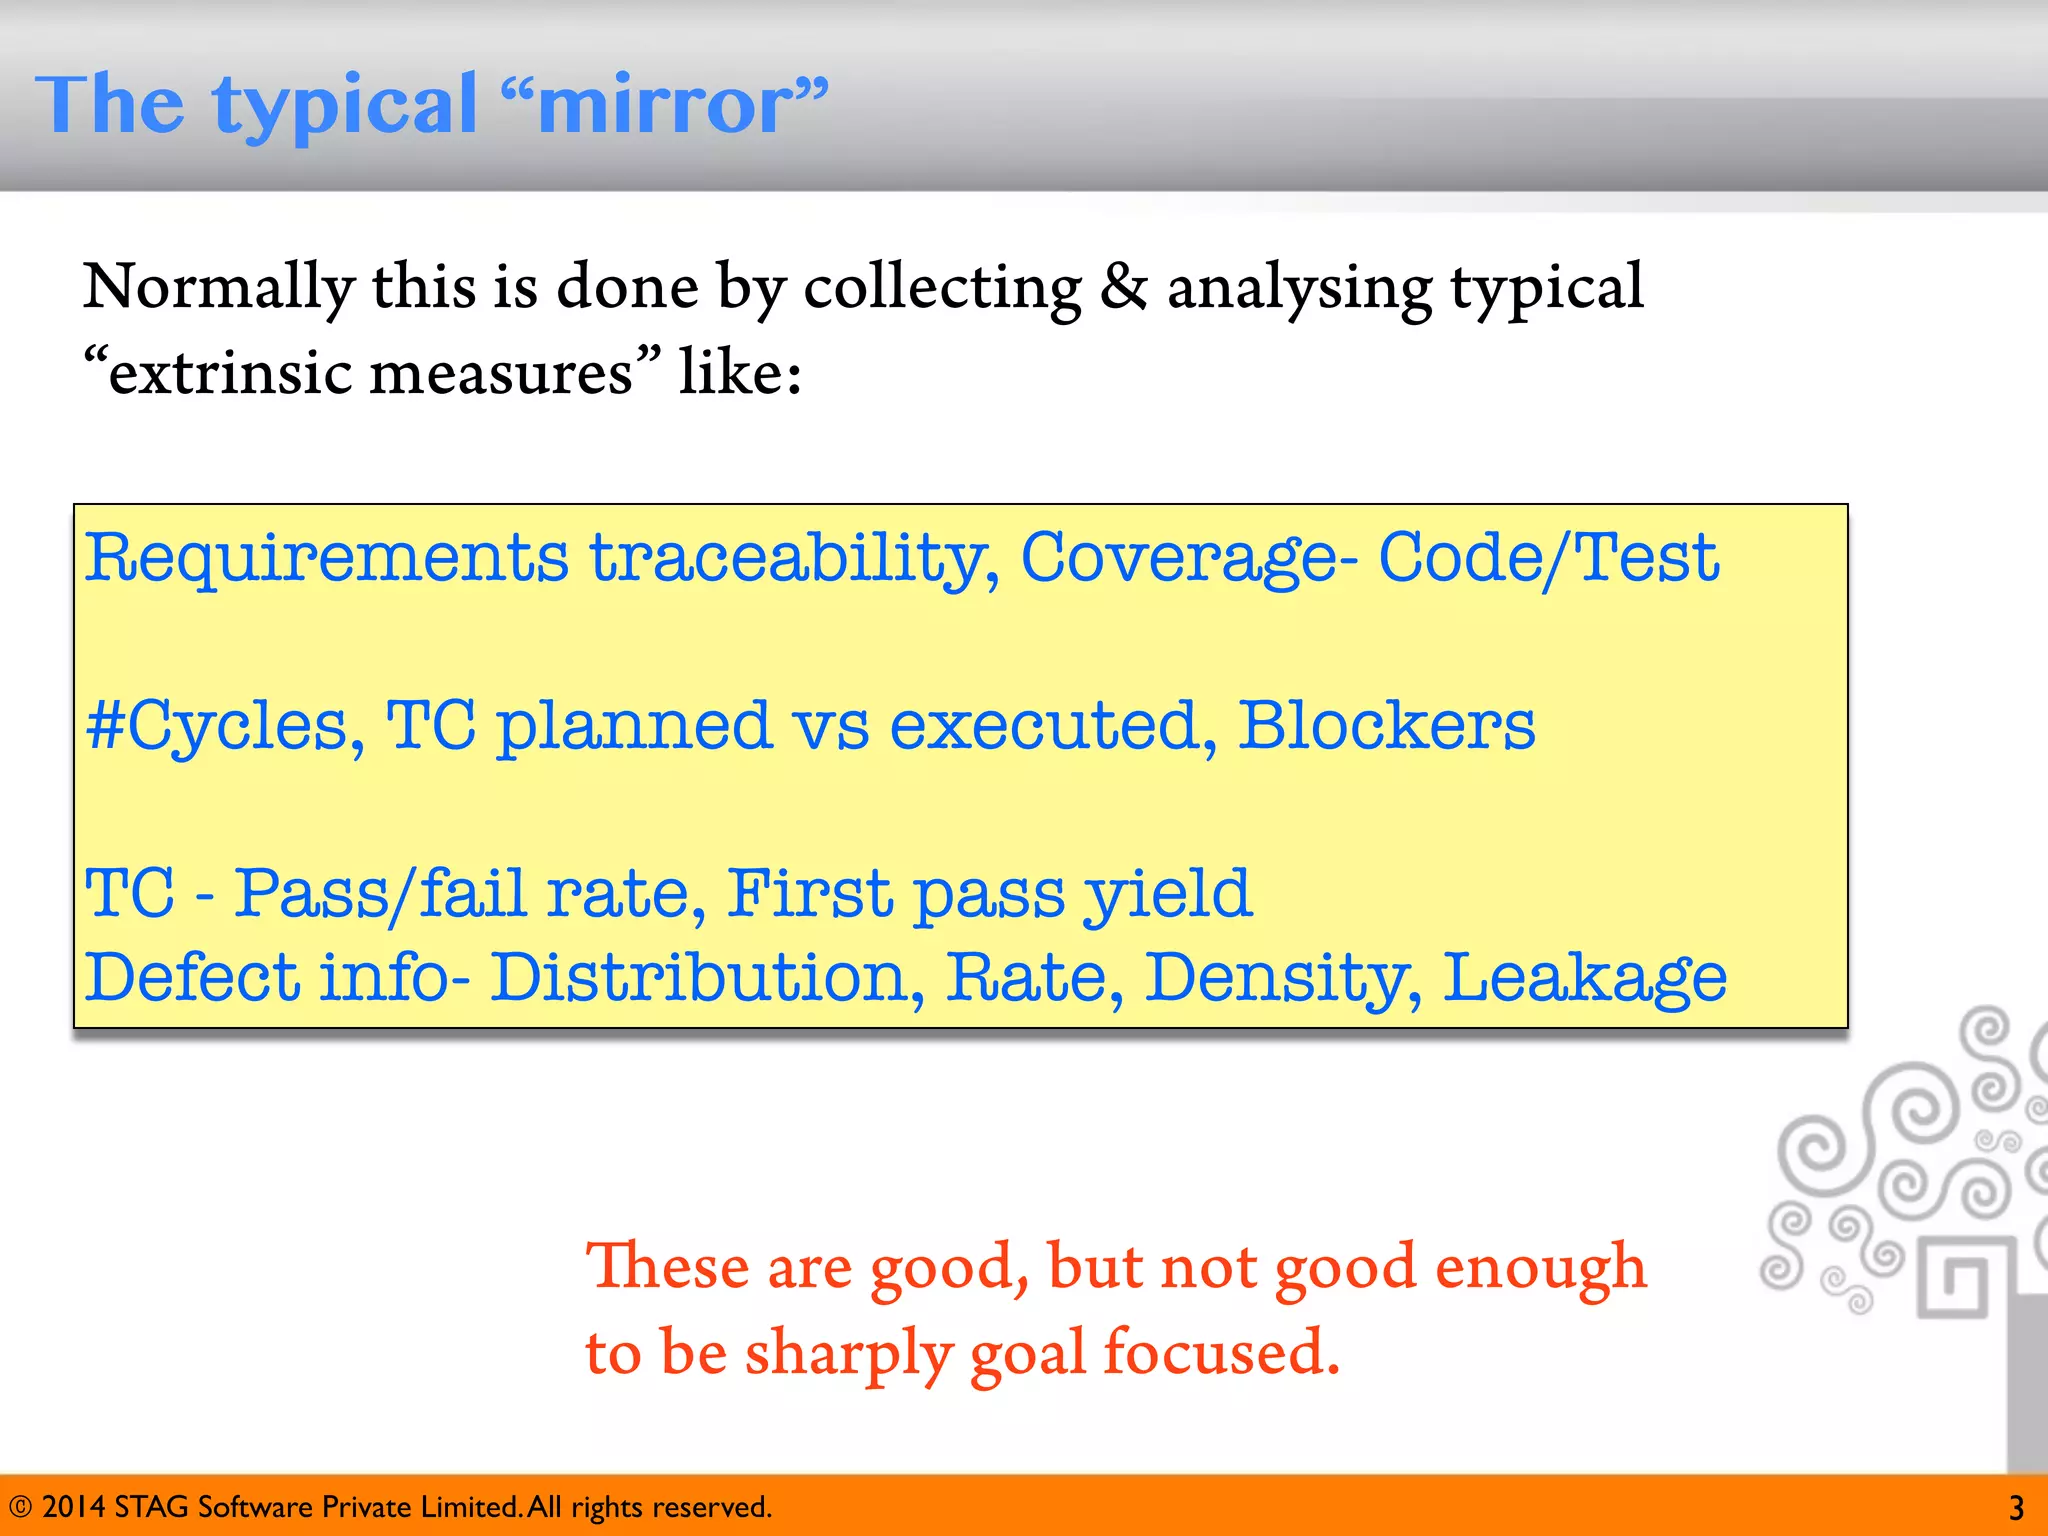
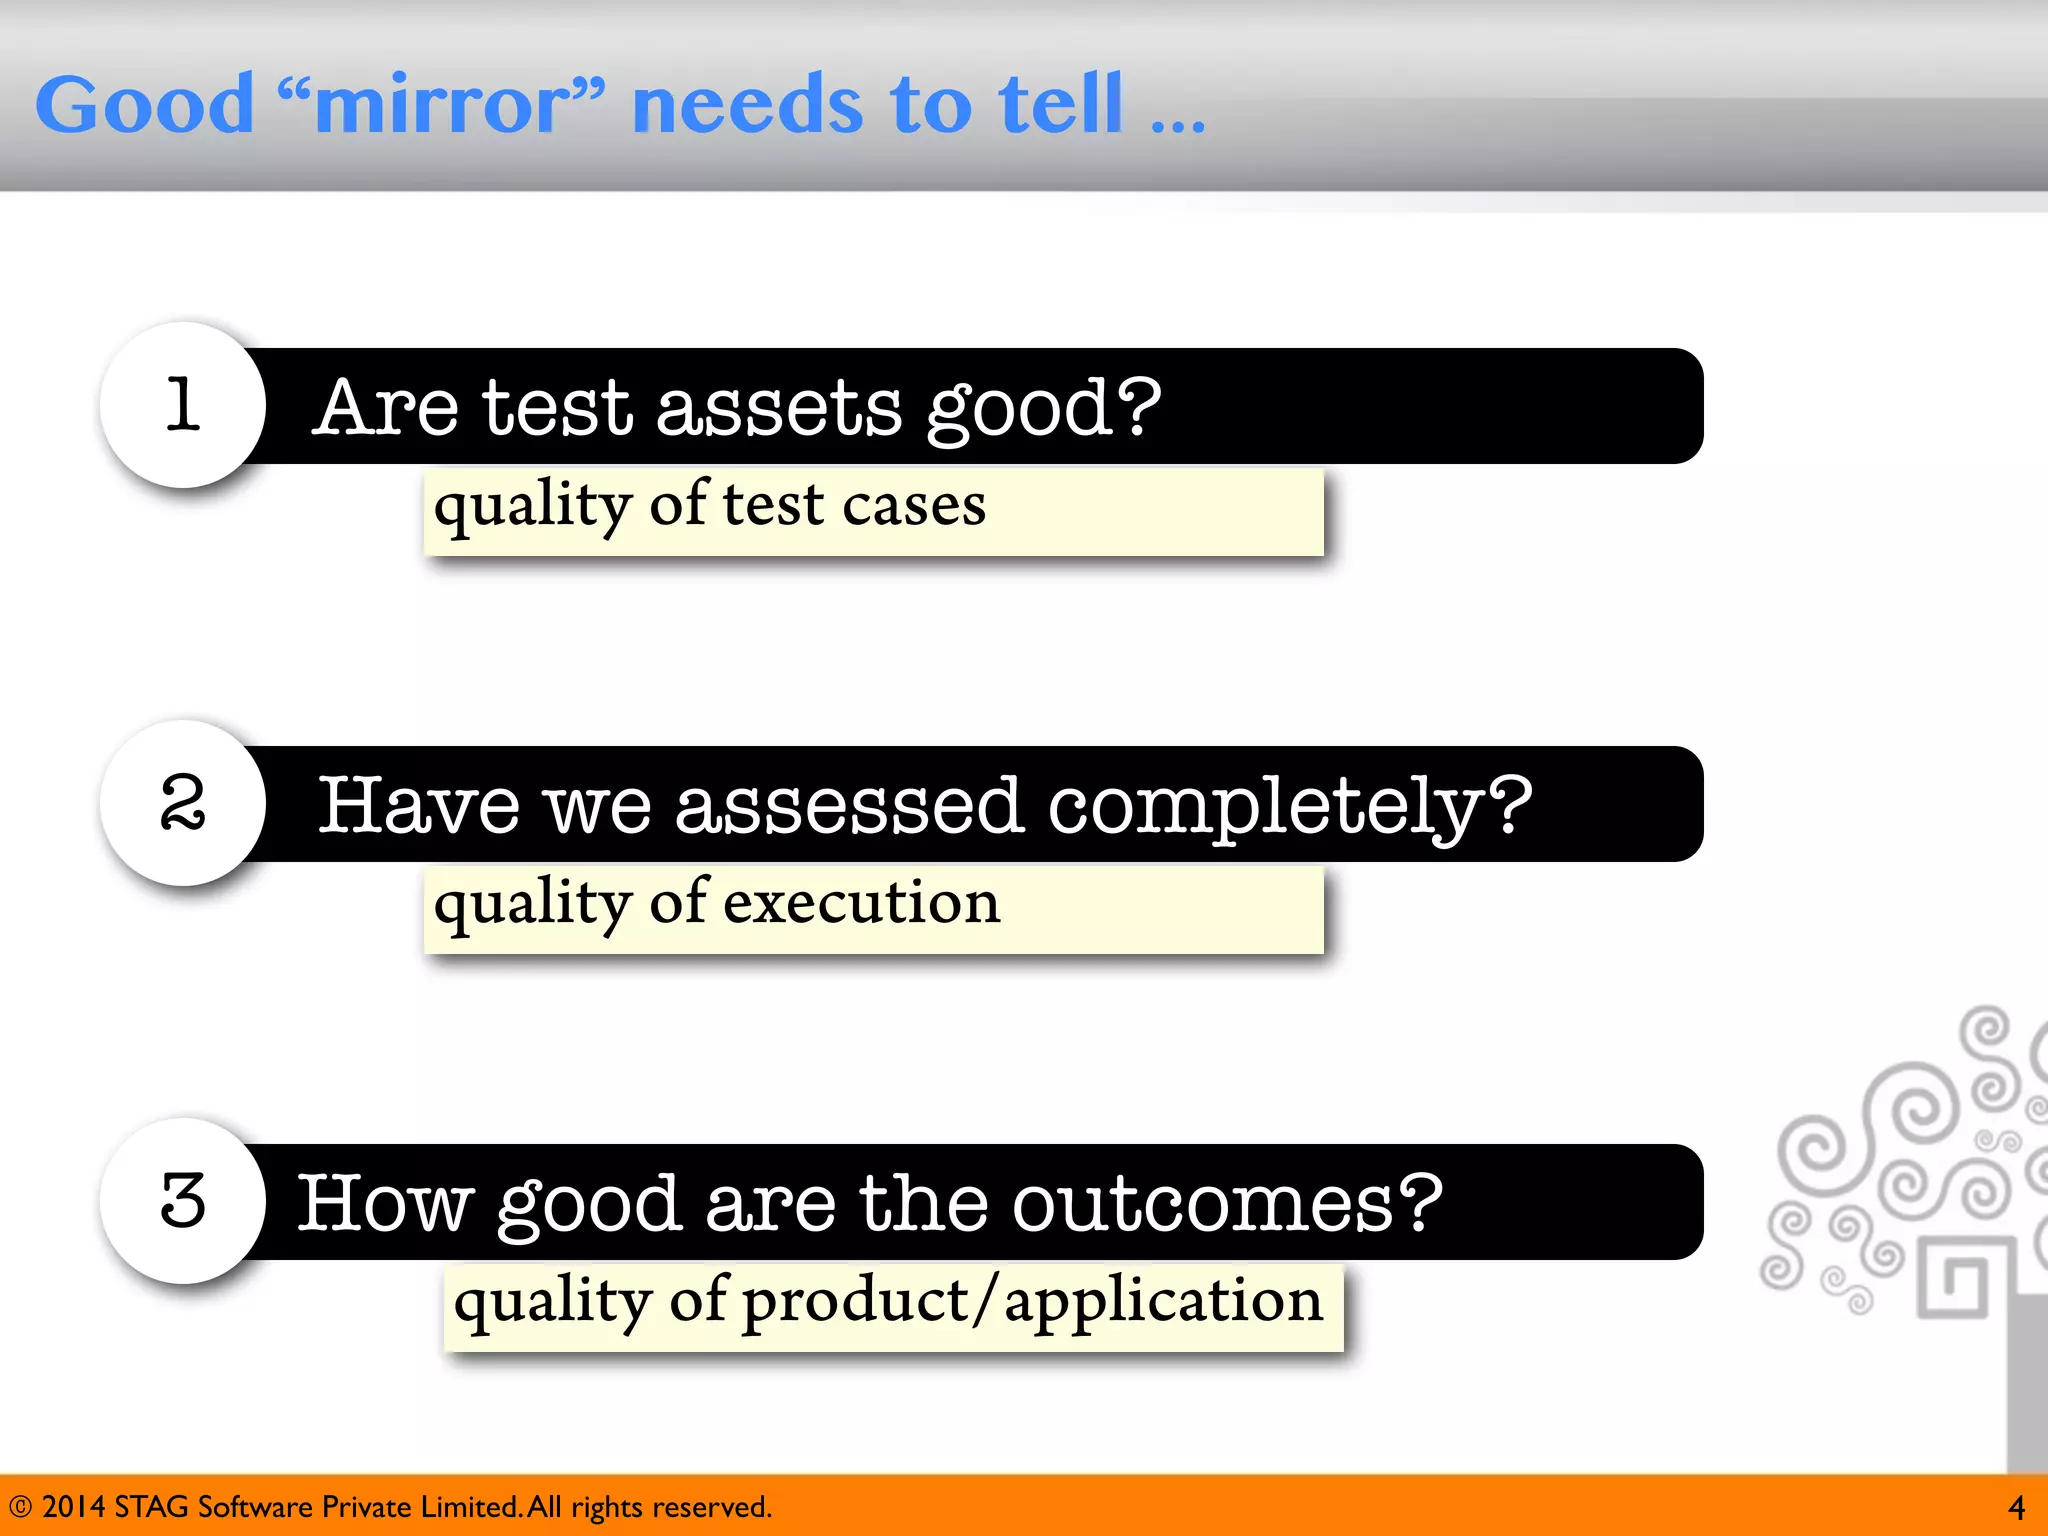
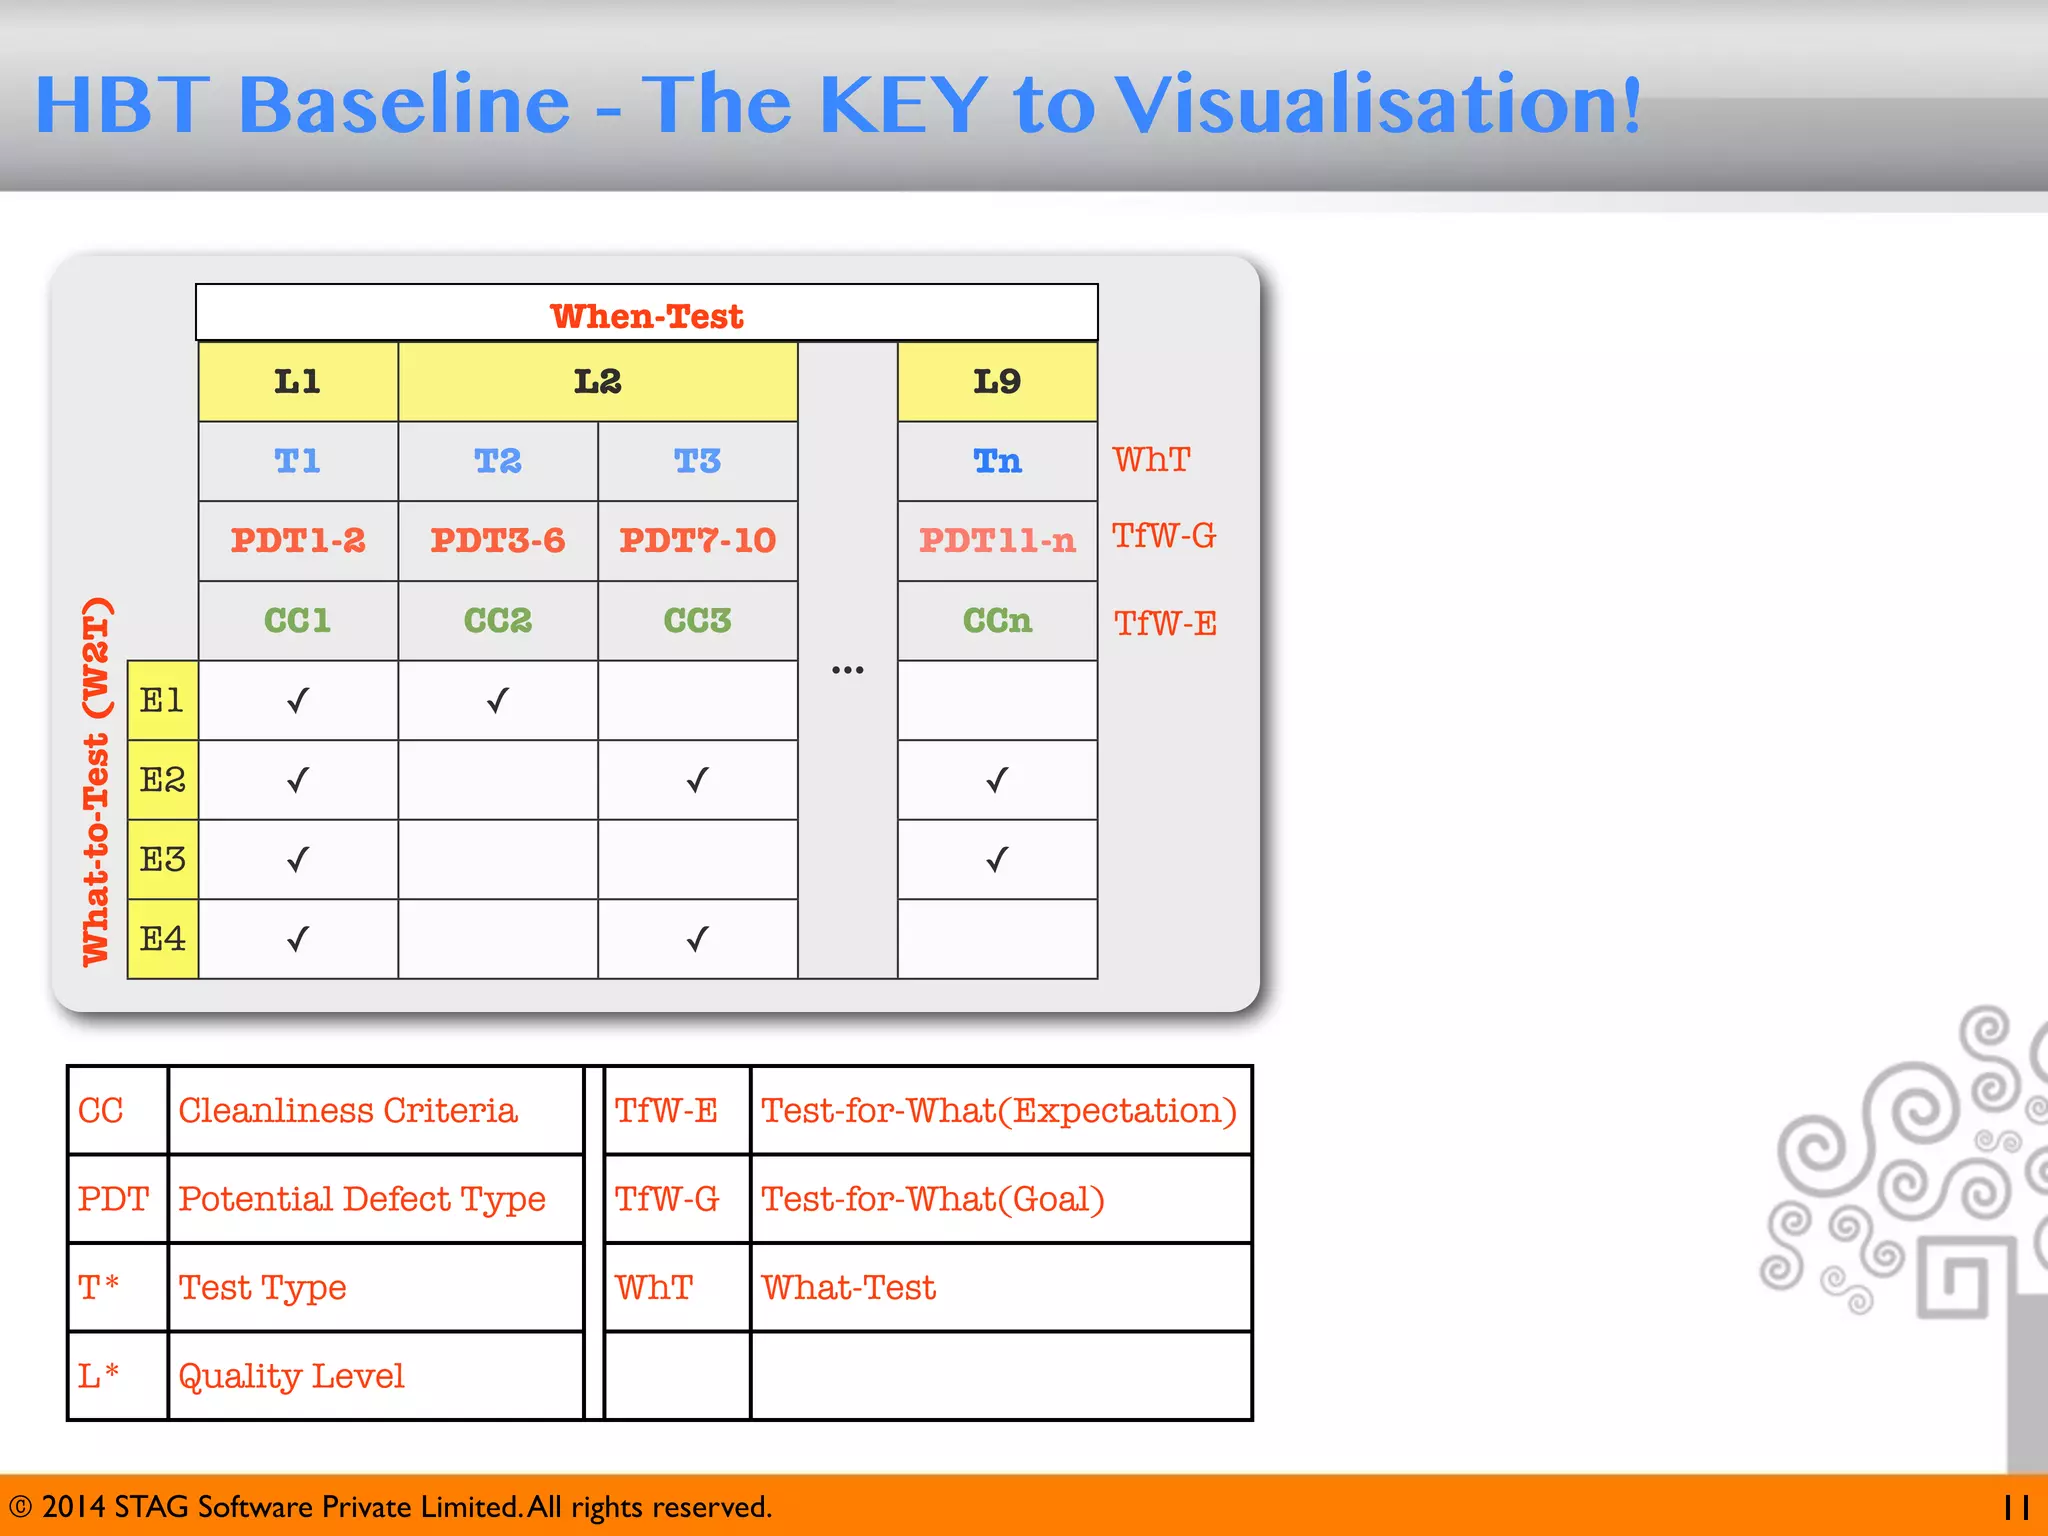
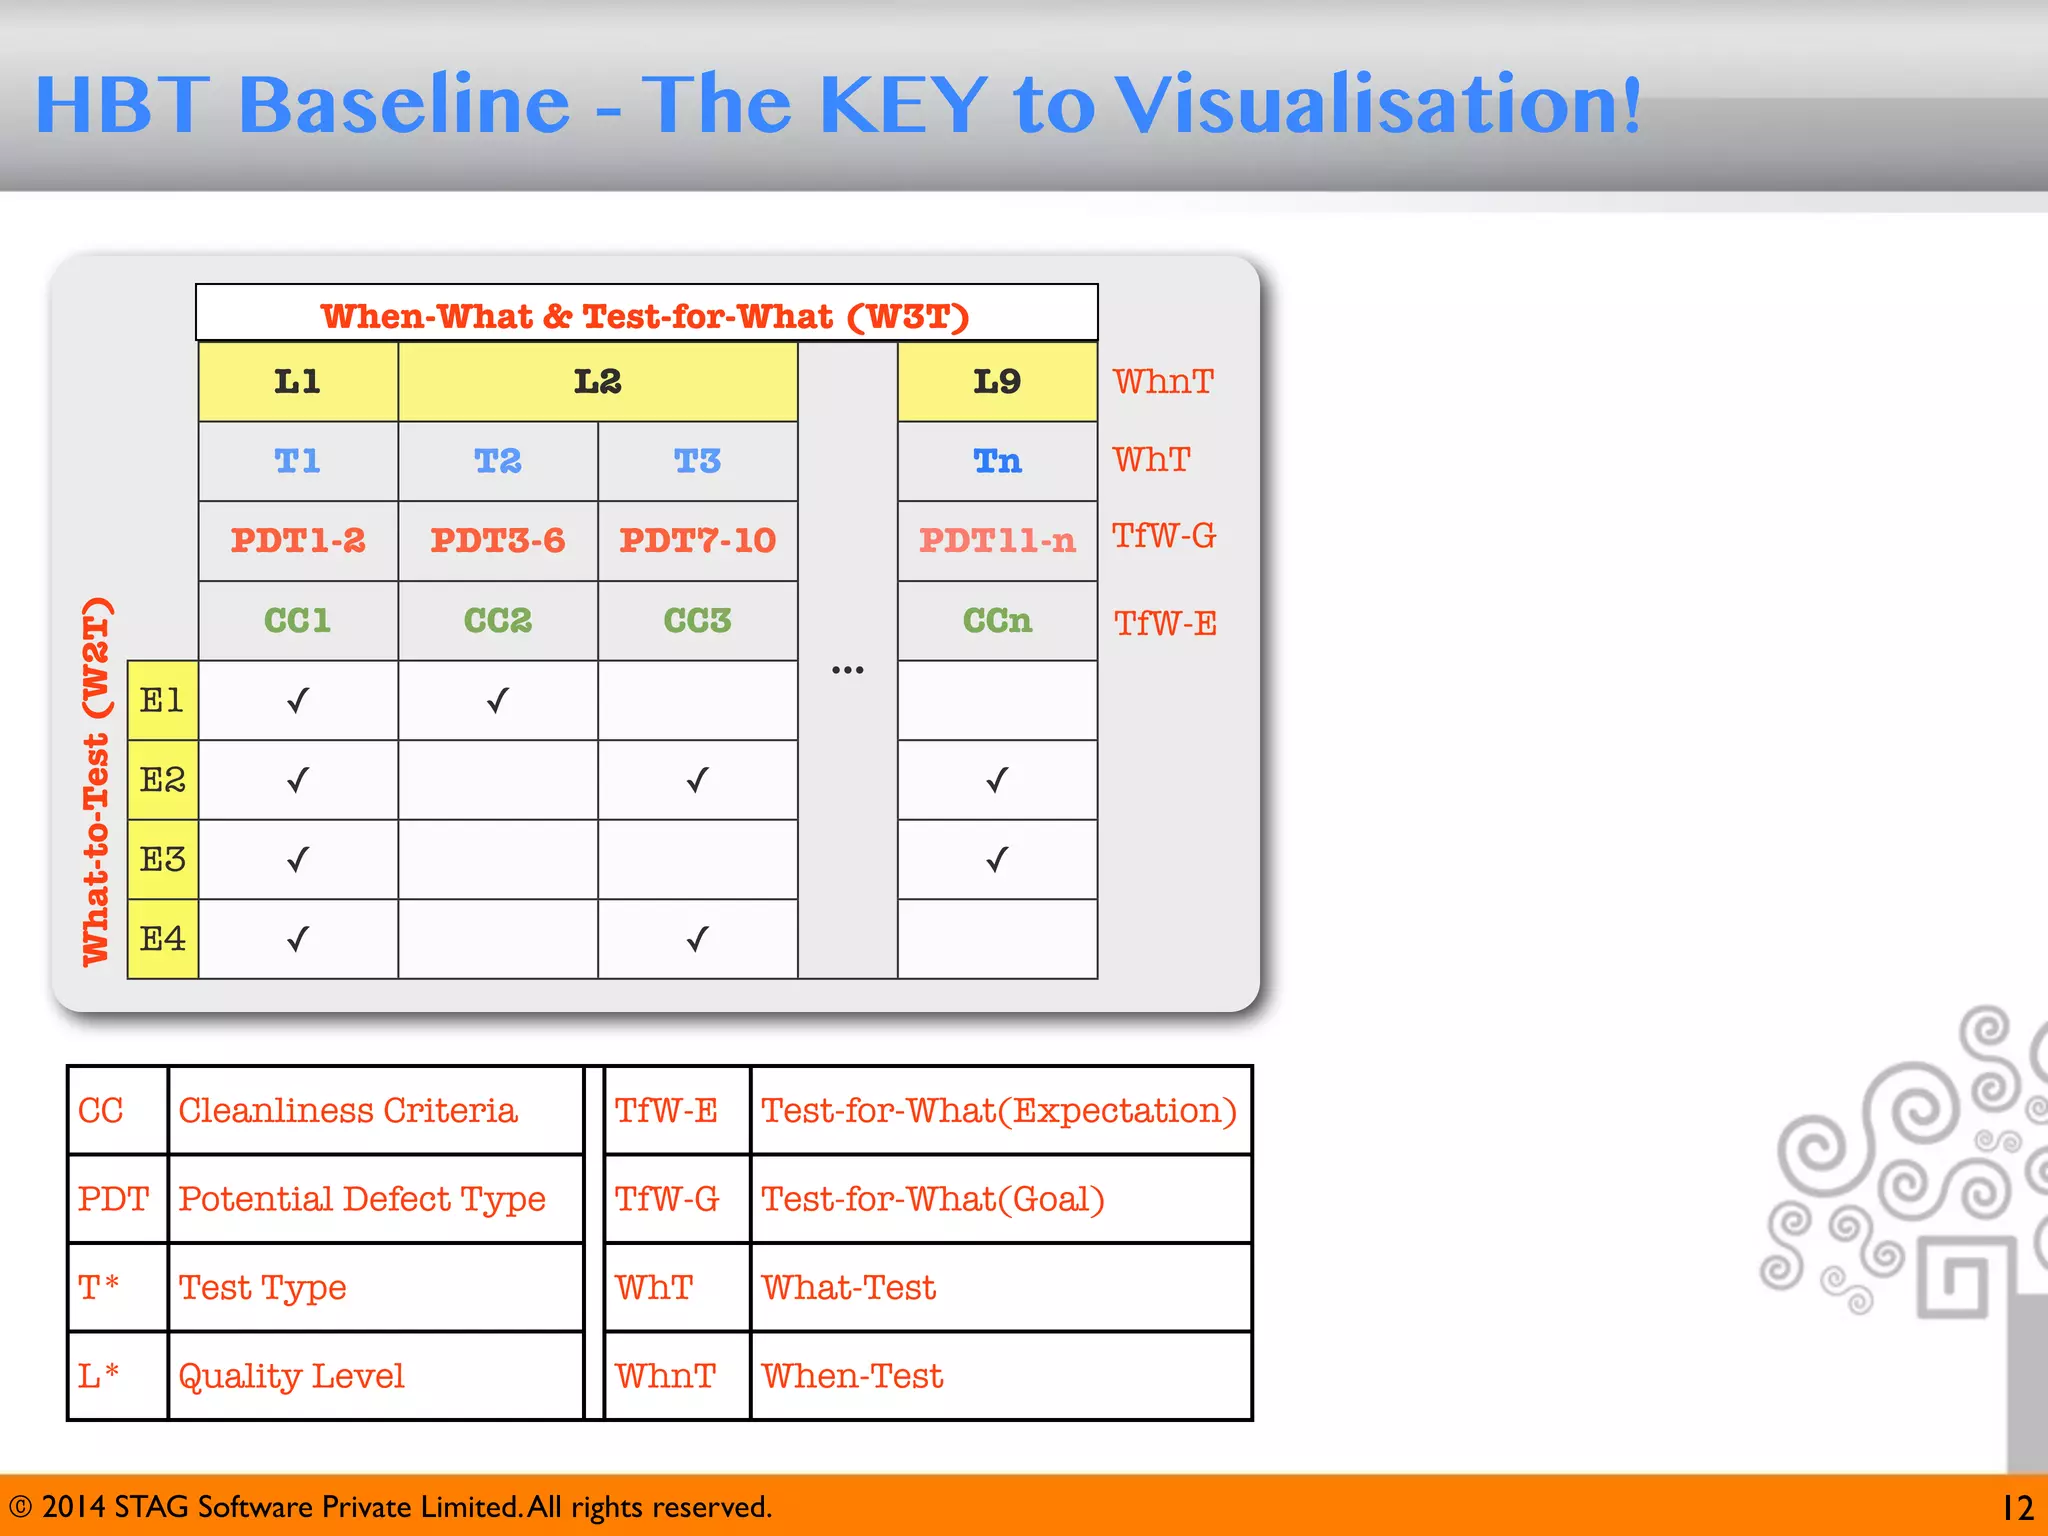
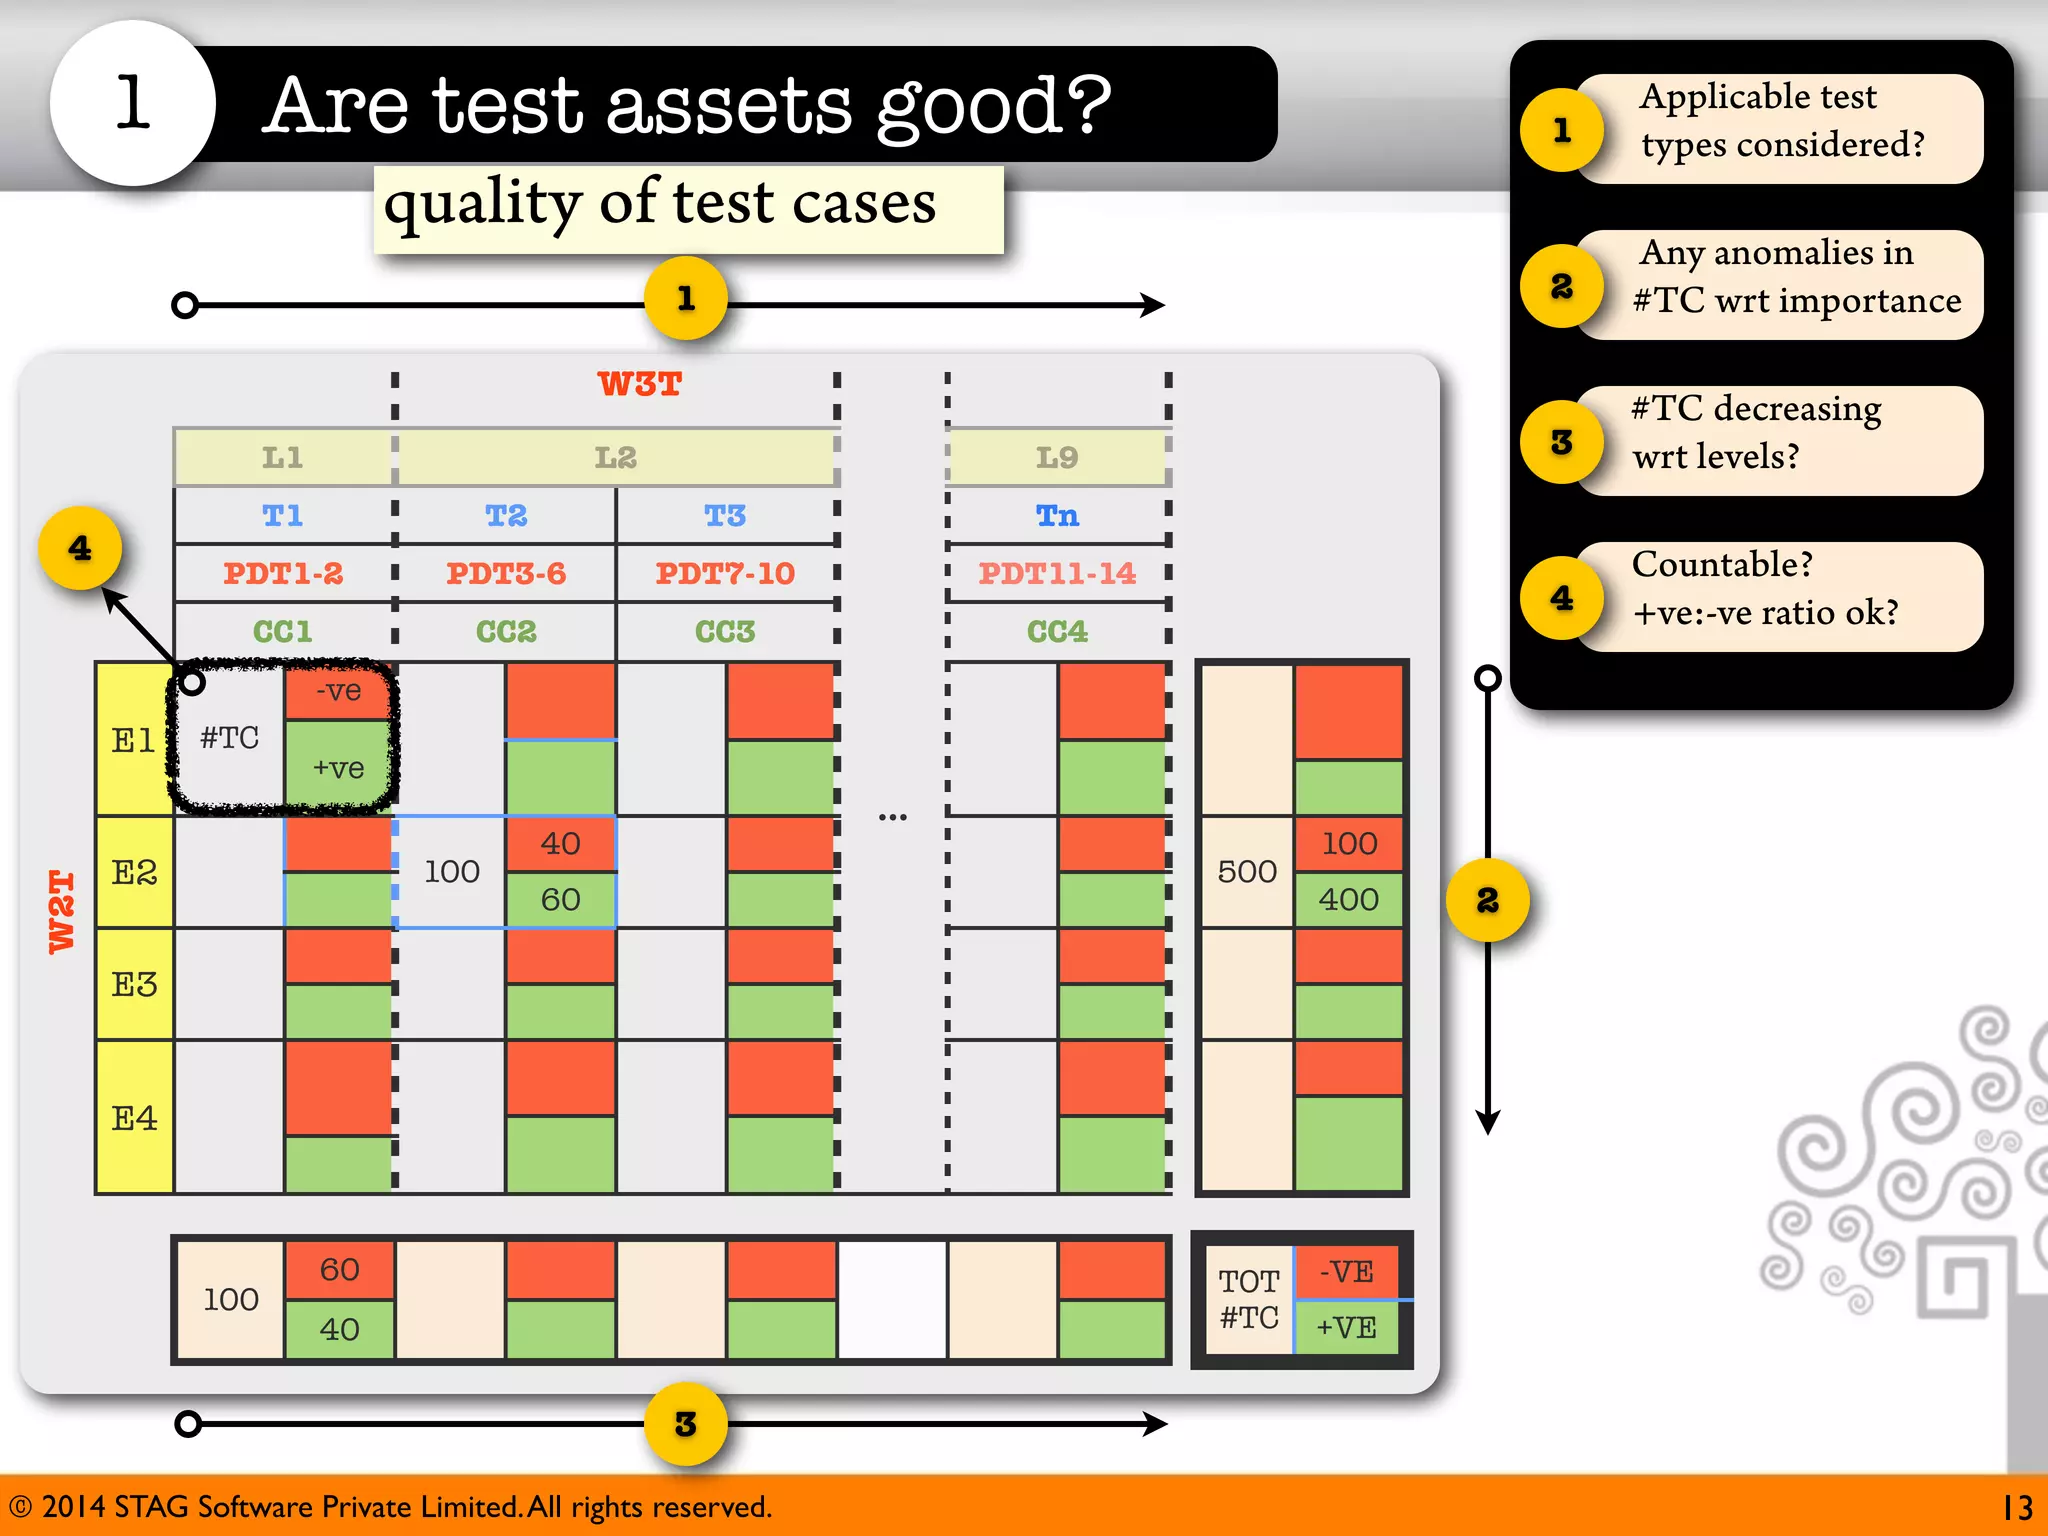
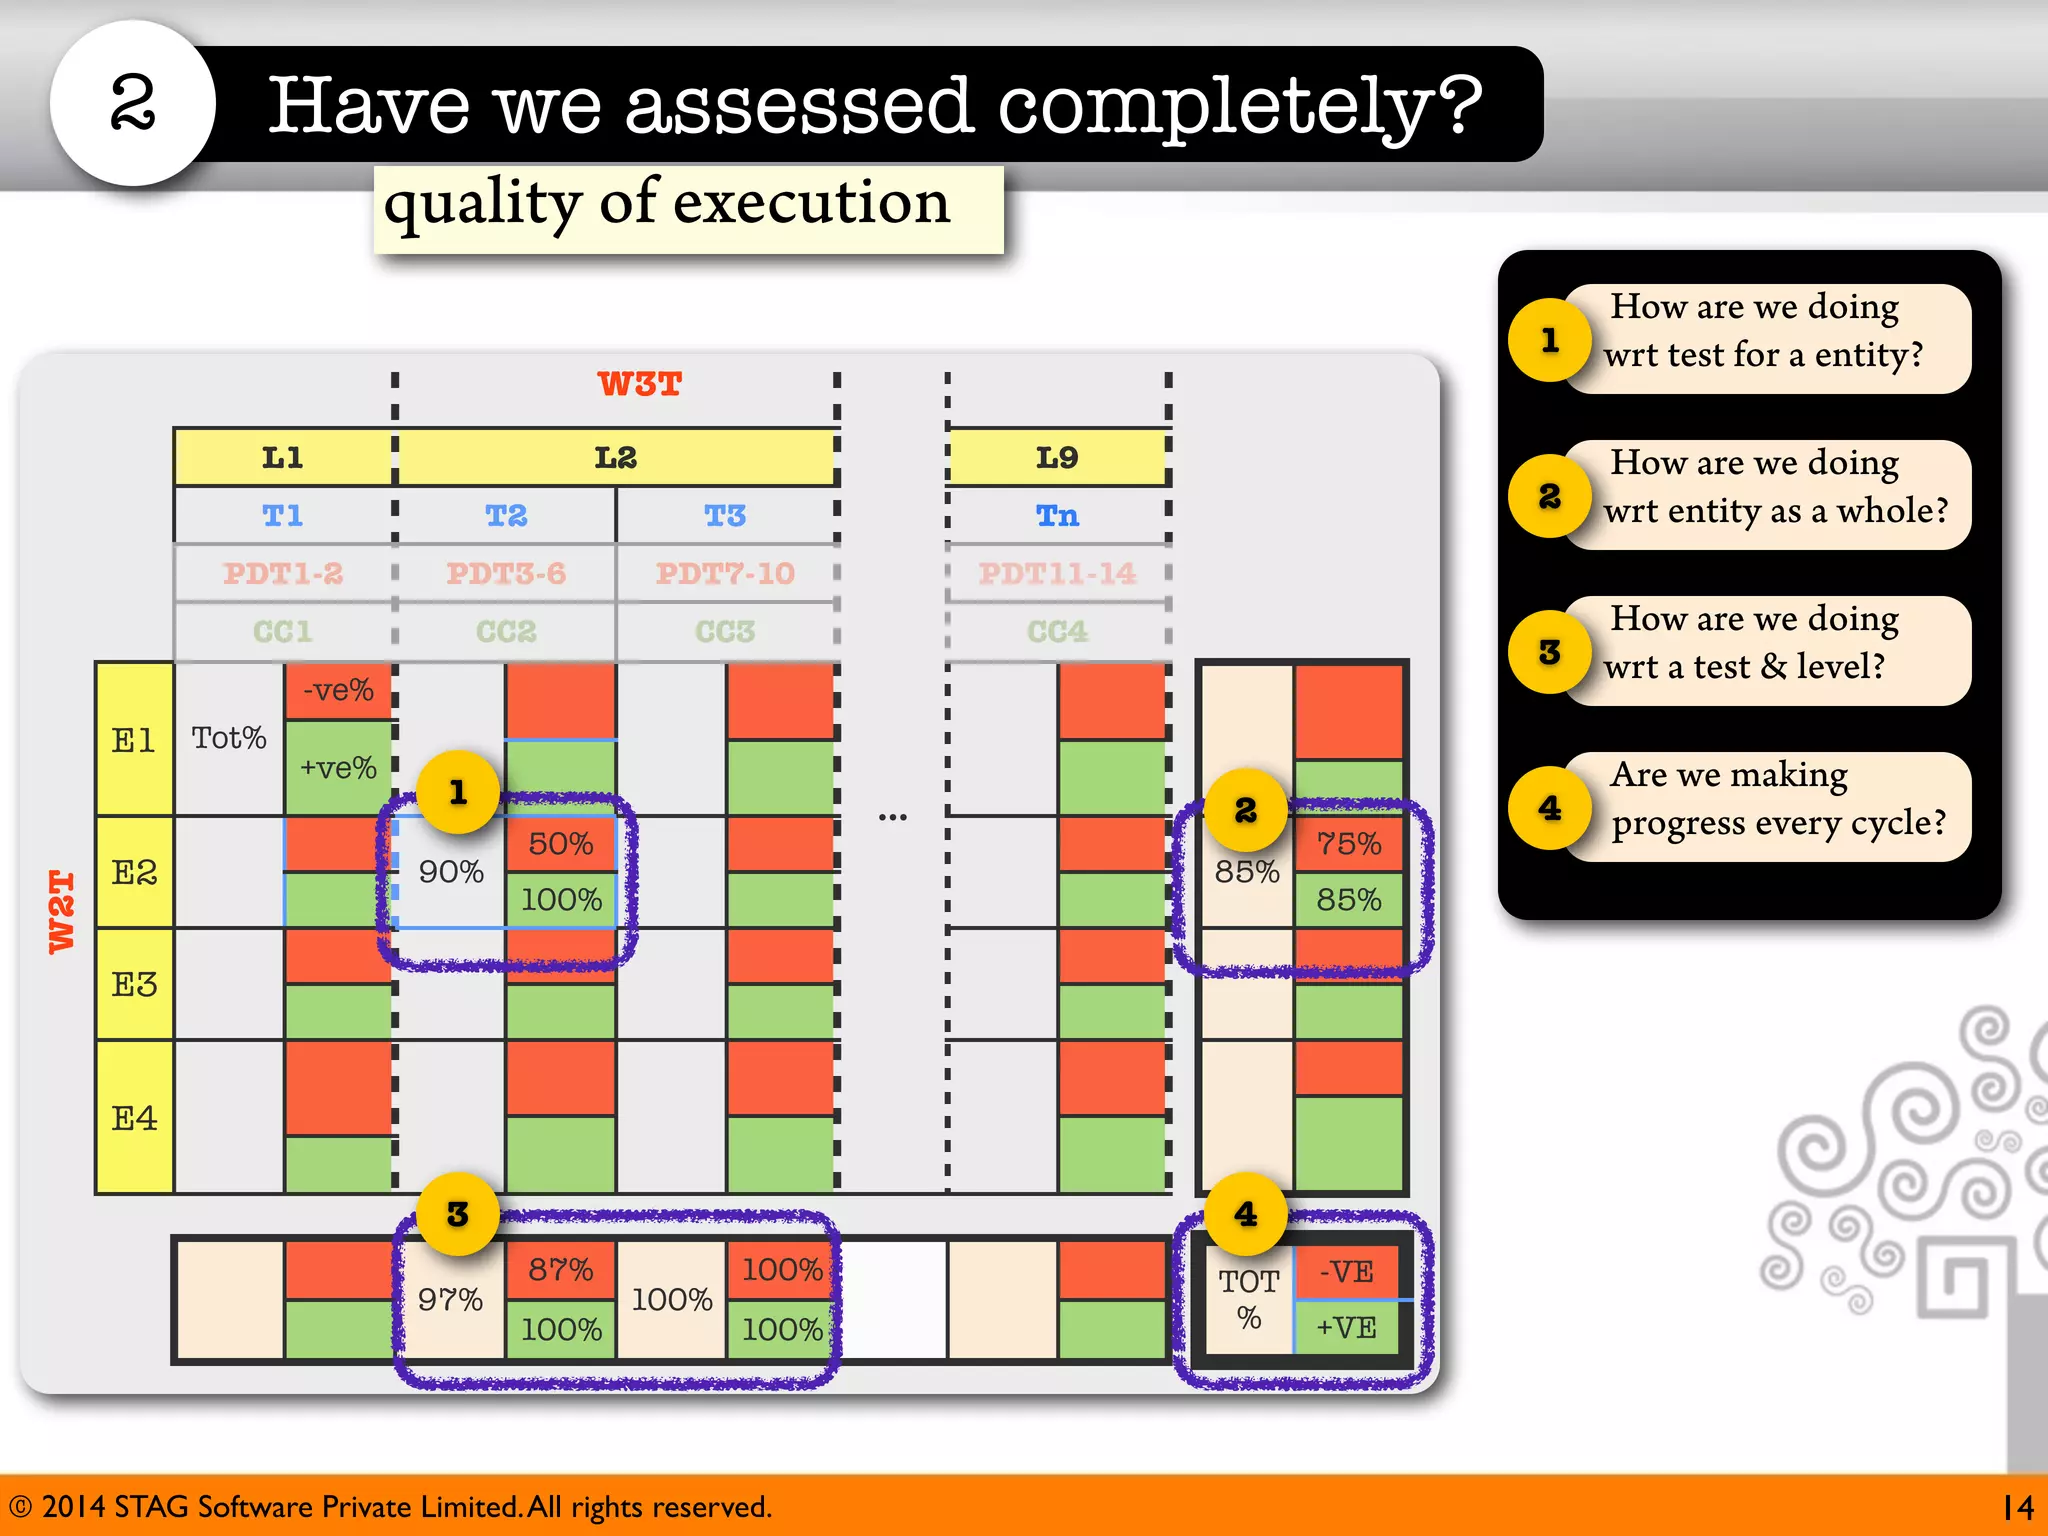
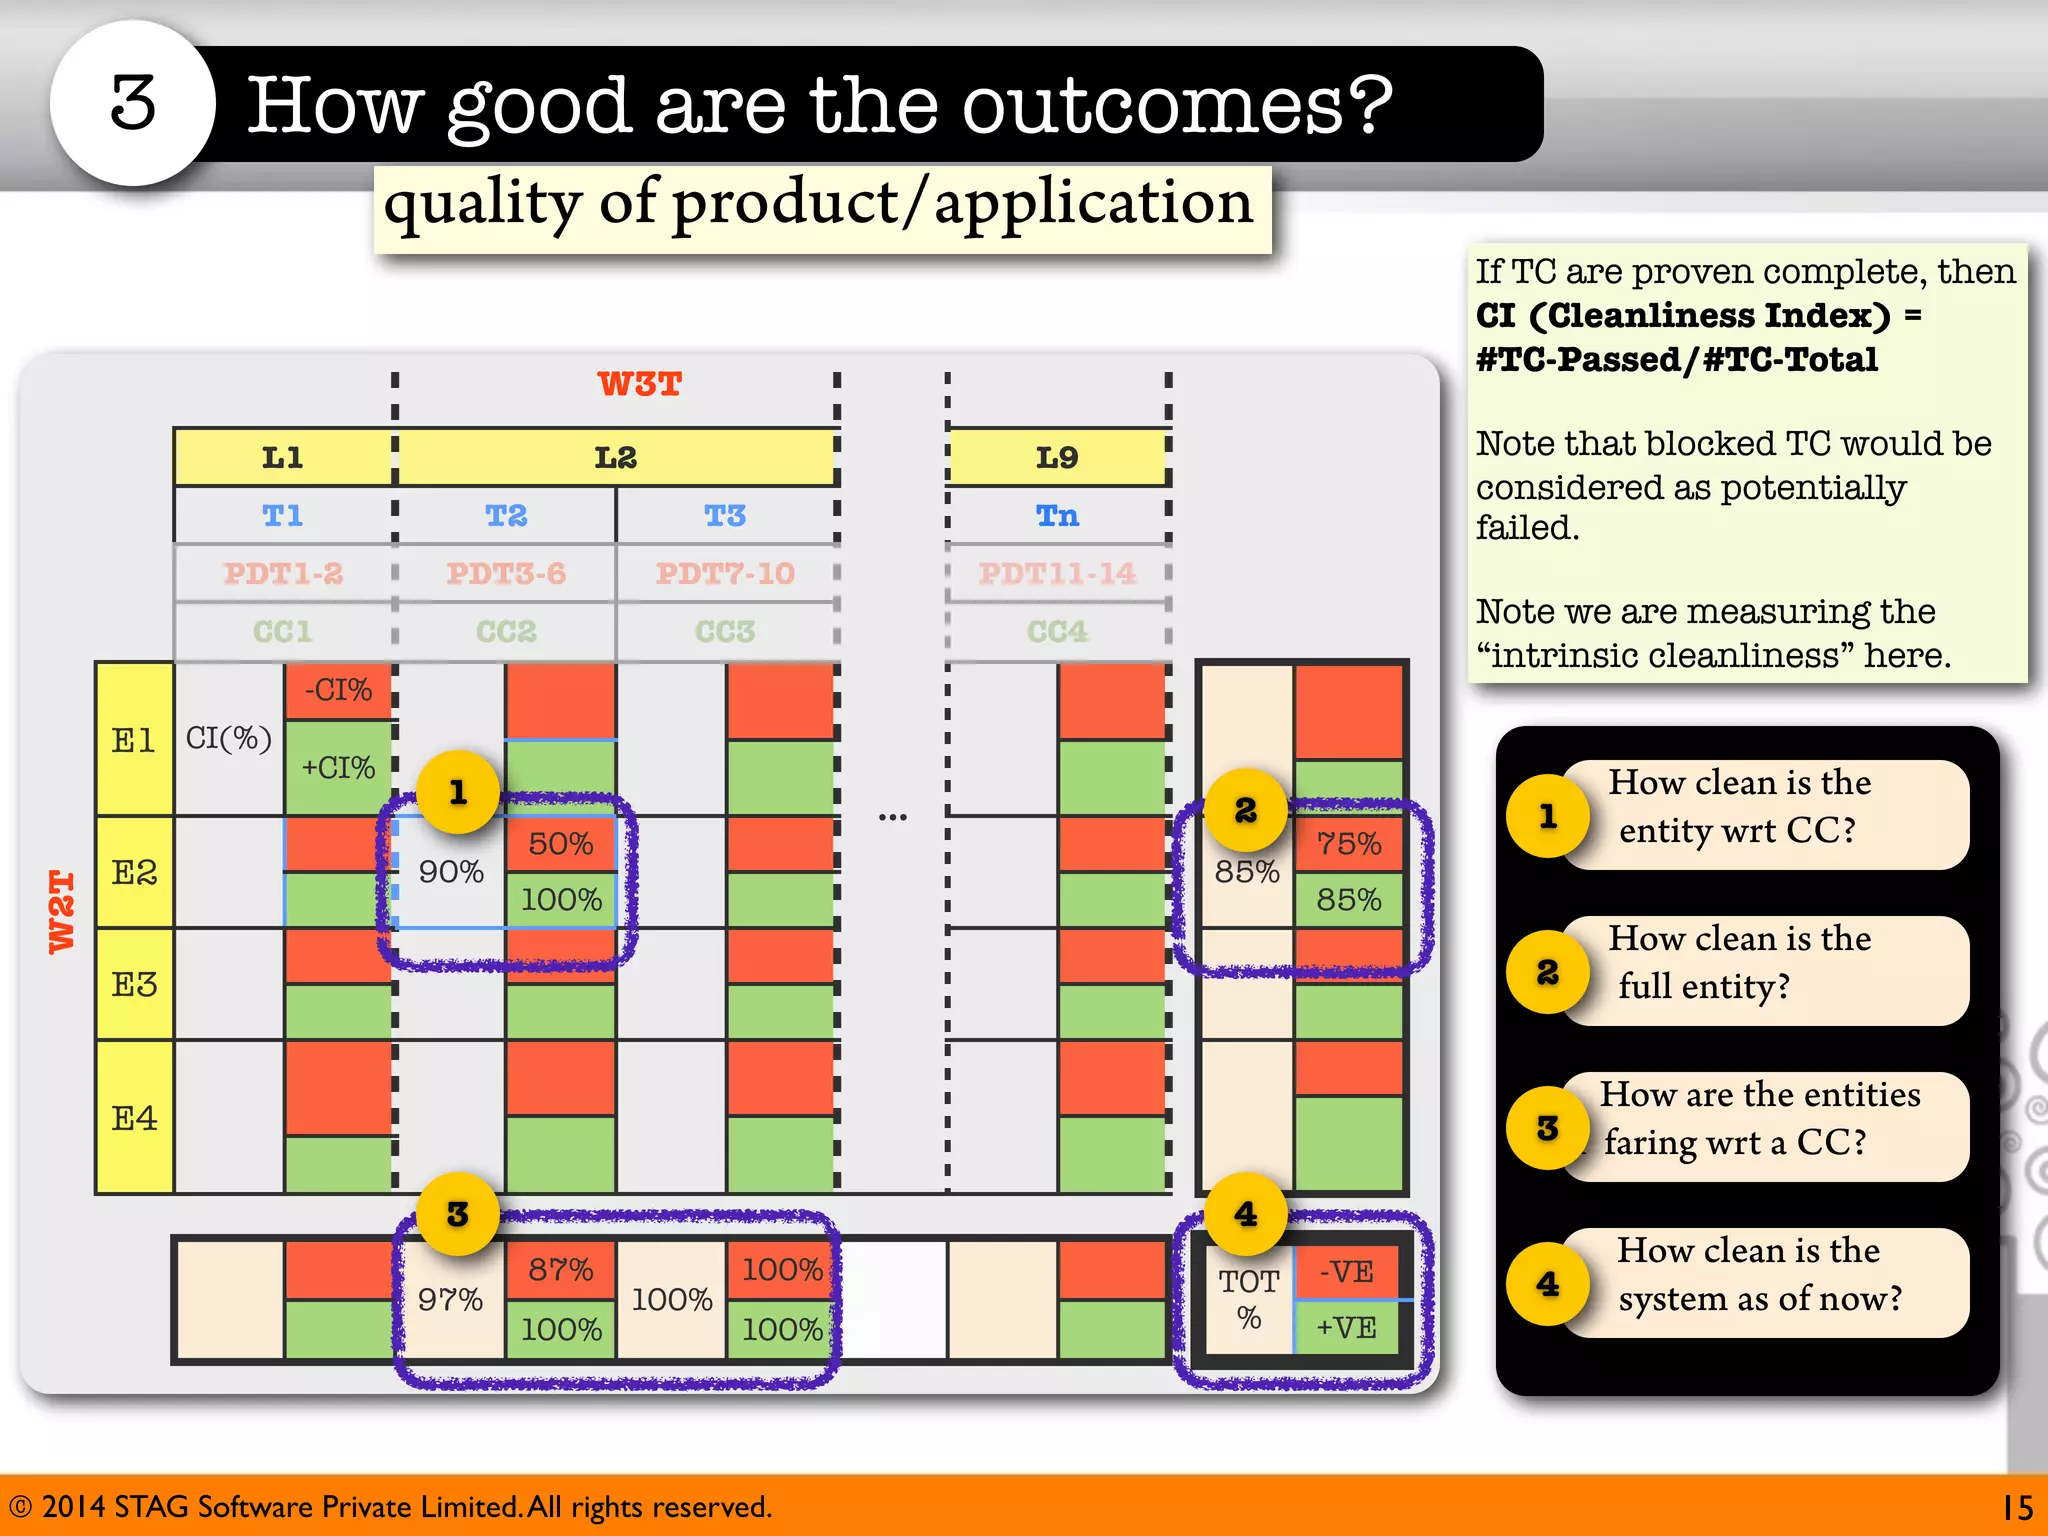
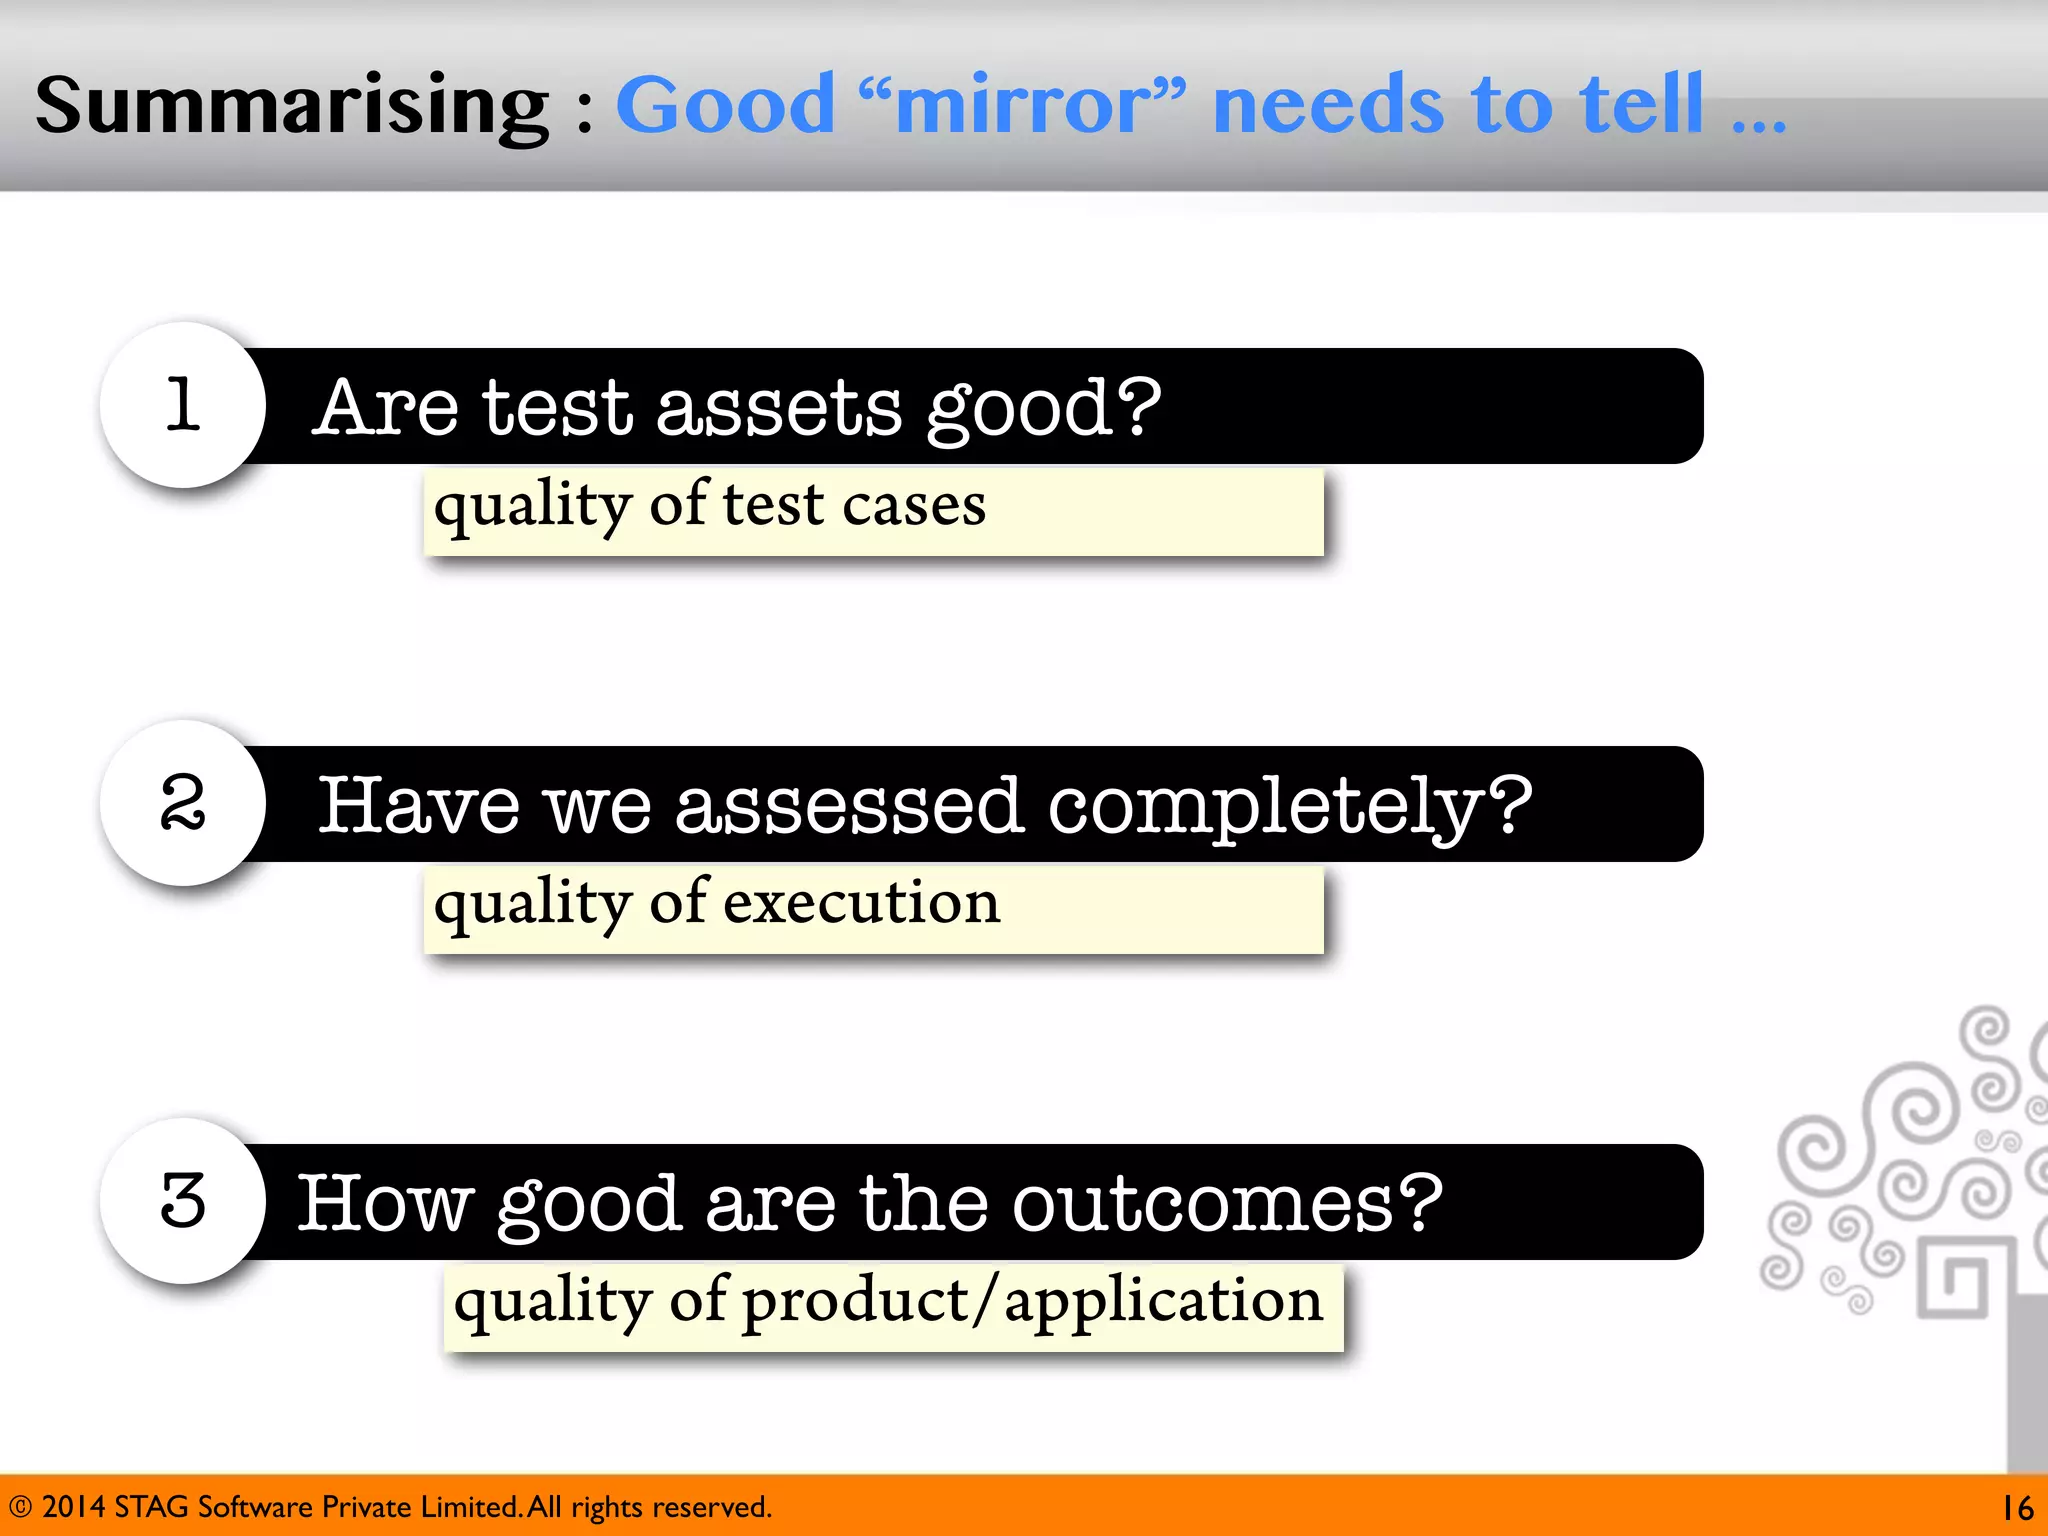
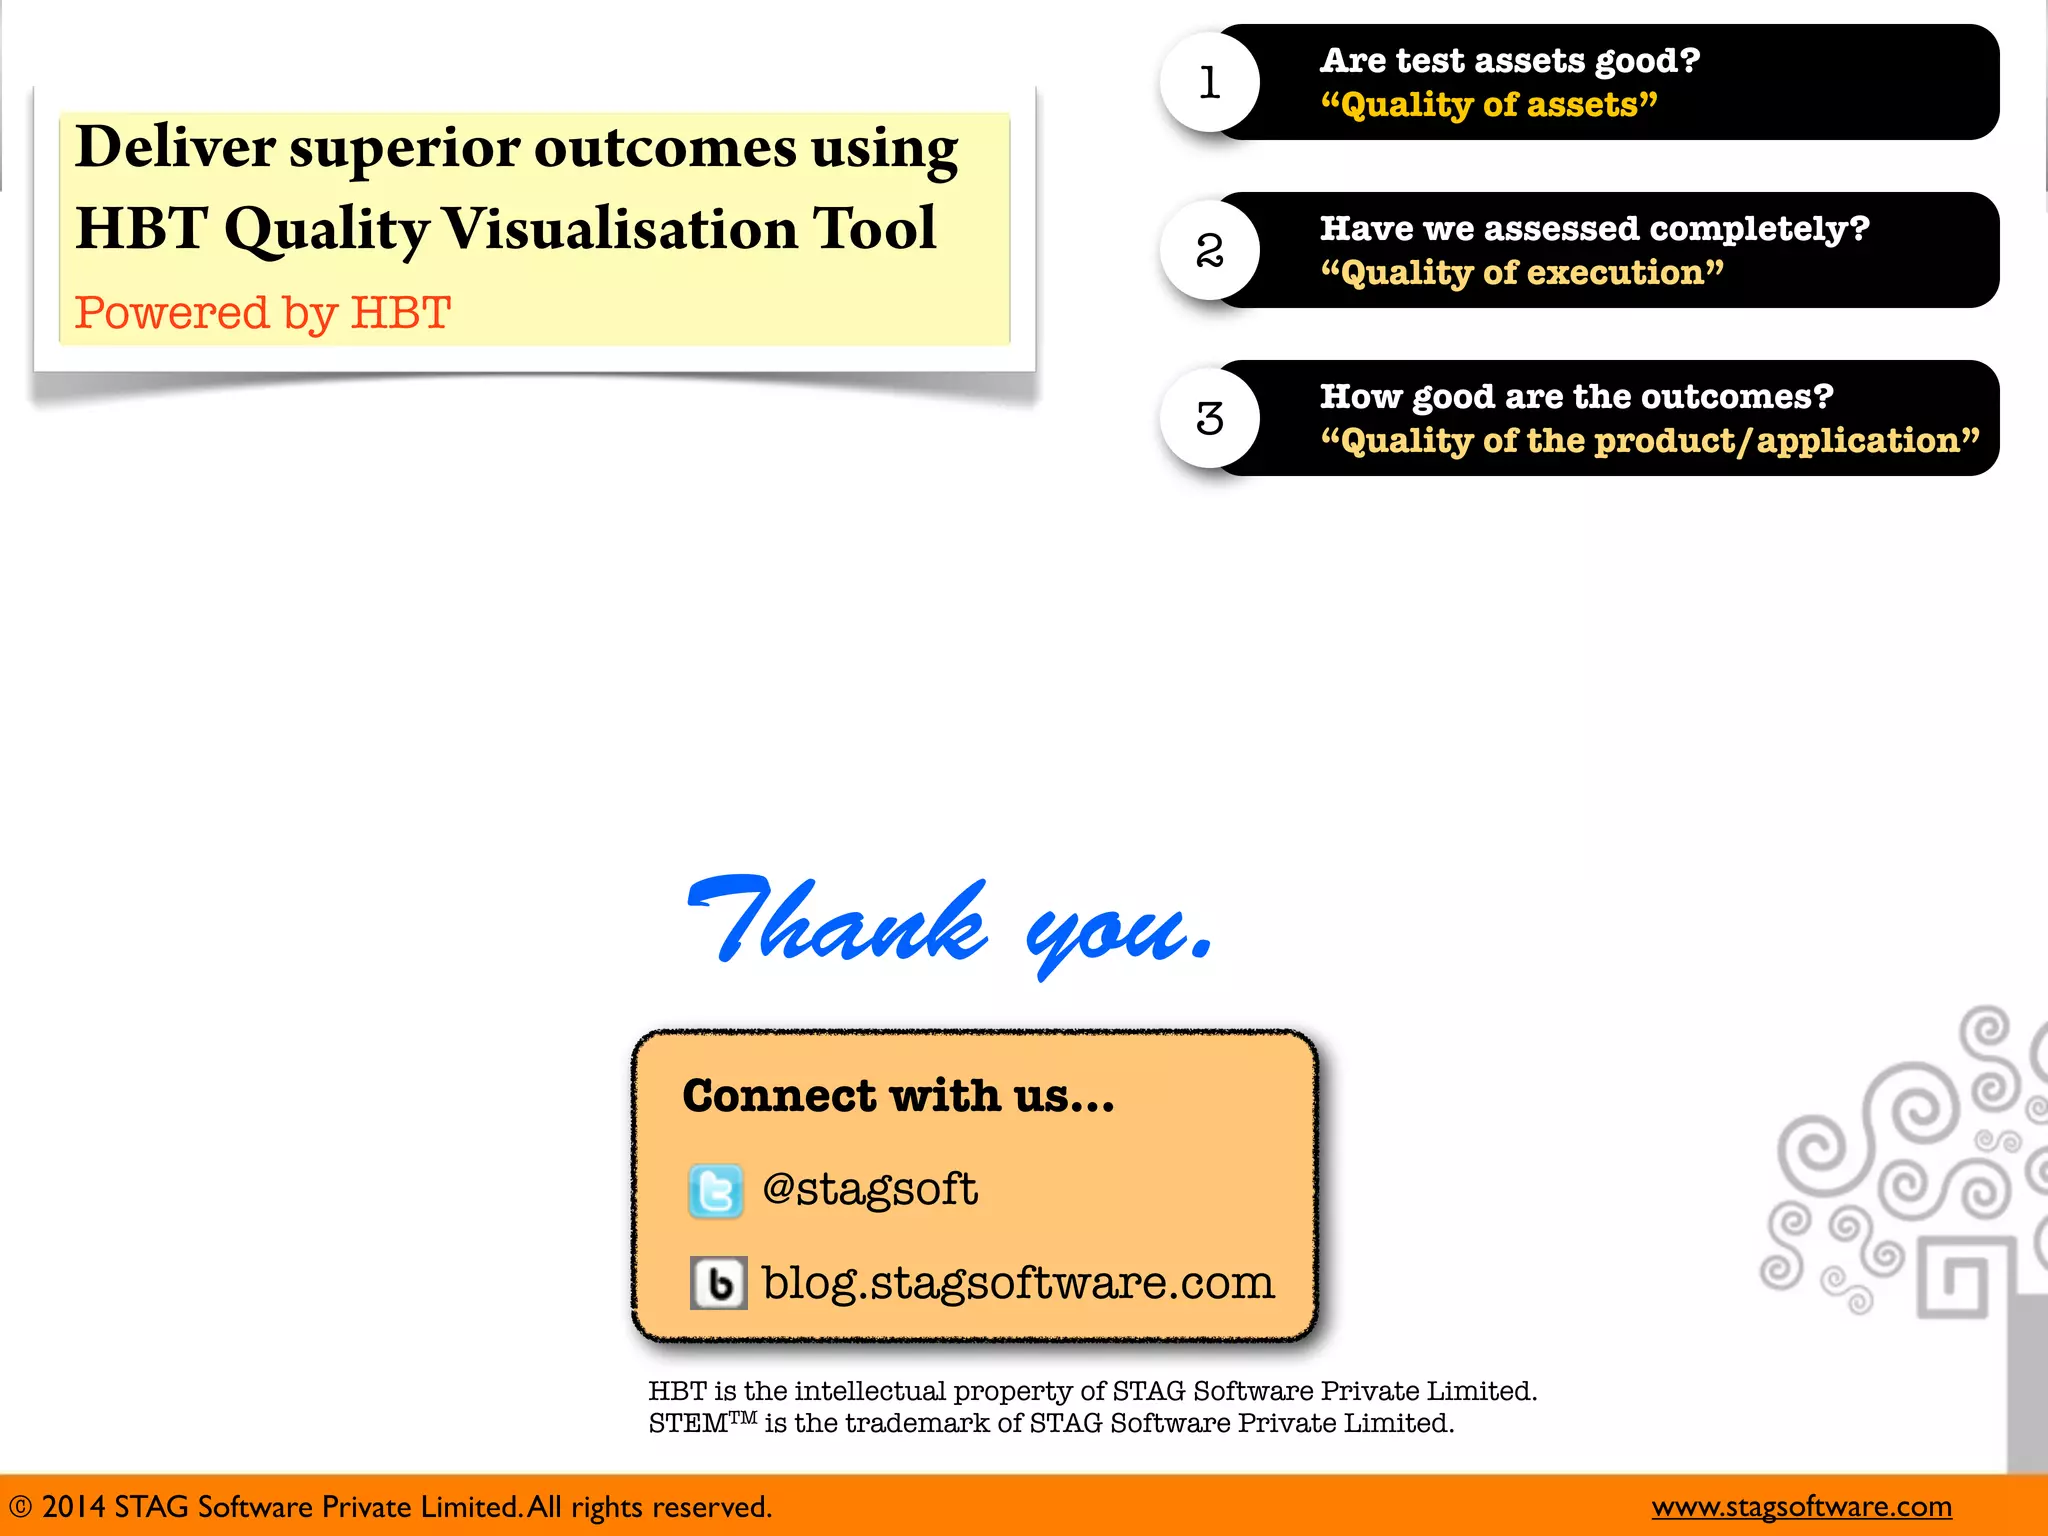

The document describes STAG Software's HBT Quality Visualization Tool. The tool allows users to assess quality across three areas in 3 sentences: 1) Are test assets good? It evaluates the quality of test cases by analyzing factors like applicable test types, test case counts by importance and quality level, and positive/negative ratios. 2) Have we assessed completely? It measures the quality of execution by analyzing execution metrics like percentages completed by test, entity, quality level, and progress over cycles. 3) How good are the outcomes? It determines the quality of the product/application by calculating a cleanliness index based on passed and total test cases, and analyzing performance by entity, cleanliness criteria, and