Downloaded 749 times

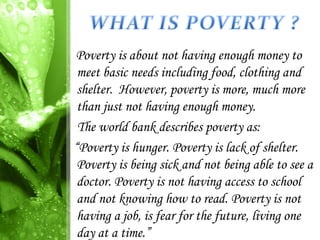
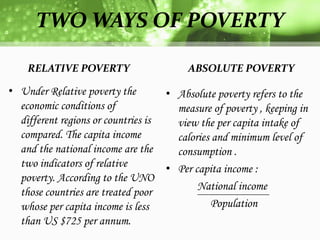
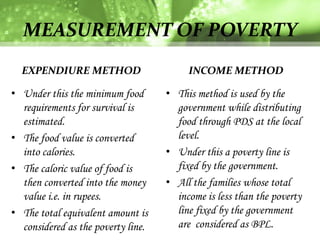
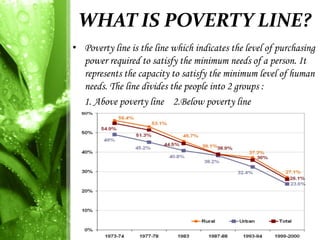
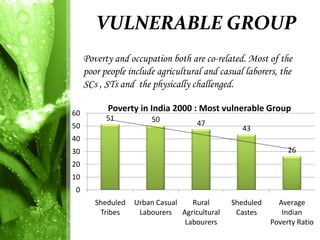
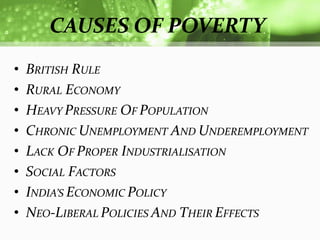


Poverty is defined as the lack of basic needs like food, clothing, and shelter. The World Bank describes poverty as hunger, lack of shelter, inability to access healthcare or education, unemployment, and living in fear without stability. There are two types of poverty - relative poverty which compares economic conditions between regions, and absolute poverty which measures minimum calorie intake and consumption levels. Poverty is measured using either expenditure or income methods to determine who falls below the poverty line, which indicates the minimum purchasing power required to meet basic needs. Vulnerable groups with high poverty rates in India include scheduled tribes, urban/rural laborers, and scheduled castes. Causes of poverty include historical factors like British rule, population pressure


