Manager Training
Making SalaryReview Decisions
Common Review Date for 2008 (CRD)
7th
-8th
January 2008
Manager Training By HR
Travelport GDS
Robert Mosley
2.
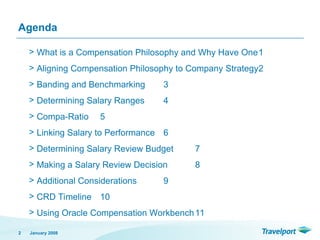
Agenda
> What isa Compensation Philosophy and Why Have One1
> Aligning Compensation Philosophy to Company Strategy2
> Banding and Benchmarking 3
> Determining Salary Ranges 4
> Compa-Ratio 5
> Linking Salary to Performance 6
> Determining Salary Review Budget 7
> Making a Salary Review Decision 8
> Additional Considerations 9
> CRD Timeline 10
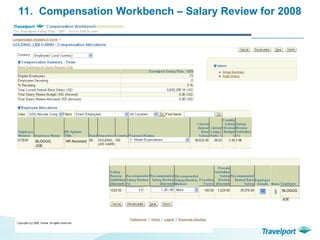
> Using Oracle Compensation Workbench11
January 2008
2
3.
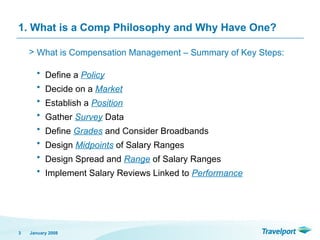
> What isCompensation Management – Summary of Key Steps:
• Define a Policy
• Decide on a Market
• Establish a Position
• Gather Survey Data
• Define Grades and Consider Broadbands
• Design Midpoints of Salary Ranges
• Design Spread and Range of Salary Ranges
• Implement Salary Reviews Linked to Performance
January 2008
3
1. What is a Comp Philosophy and Why Have One?
4.
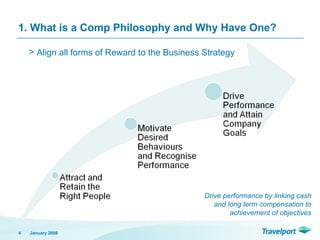
> Align allforms of Reward to the Business Strategy
1. What is a Comp Philosophy and Why Have One?
January 2008
4
Drive performance by linking cash
and long term compensation to
achievement of objectives
5.
2. Aligning CompPhilosophy to Company Strategy
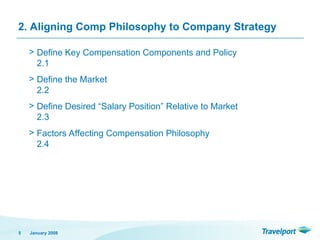
> Define Key Compensation Components and Policy
2.1
> Define the Market
2.2
> Define Desired “Salary Position” Relative to Market
2.3
> Factors Affecting Compensation Philosophy
2.4
January 2008
5
6.
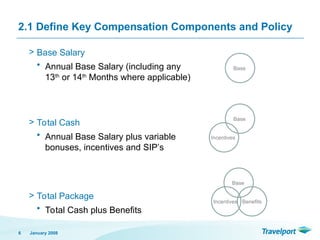
2.1 Define KeyCompensation Components and Policy
> Base Salary
• Annual Base Salary (including any
13th
or 14th
Months where applicable)
> Total Cash
• Annual Base Salary plus variable
bonuses, incentives and SIP’s
> Total Package
• Total Cash plus Benefits
January 2008
6
Base
Base
Incentives
Base
Incentives Benefits
7.
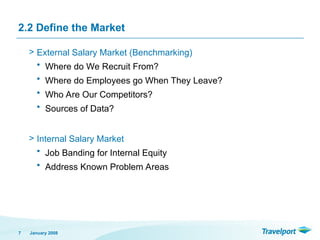
2.2 Define theMarket
> External Salary Market (Benchmarking)
• Where do We Recruit From?
• Where do Employees go When They Leave?
• Who Are Our Competitors?
• Sources of Data?
> Internal Salary Market
• Job Banding for Internal Equity
• Address Known Problem Areas
January 2008
7
8.
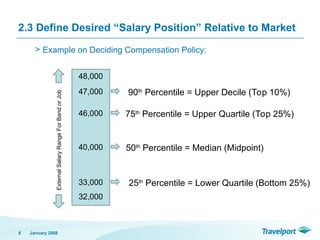
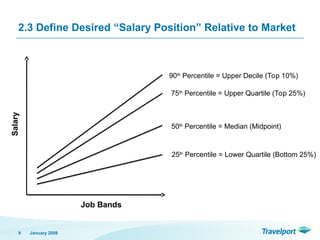
2.3 Define Desired“Salary Position” Relative to Market
> Example on Deciding Compensation Policy:
January 2008
8
32,000
48,000
External
Salary
Range
For
Band
or
Job
33,000 25th
Percentile = Lower Quartile (Bottom 25%)
40,000 50th
Percentile = Median (Midpoint)
46,000 75th
Percentile = Upper Quartile (Top 25%)
47,000 90th
Percentile = Upper Decile (Top 10%)
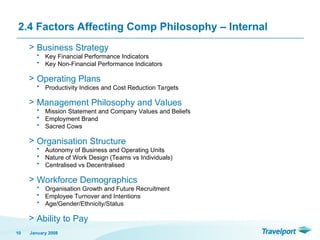
> Business Strategy
•Key Financial Performance Indicators
• Key Non-Financial Performance Indicators
> Operating Plans
• Productivity Indices and Cost Reduction Targets
> Management Philosophy and Values
• Mission Statement and Company Values and Beliefs
• Employment Brand
• Sacred Cows
> Organisation Structure
• Autonomy of Business and Operating Units
• Nature of Work Design (Teams vs Individuals)
• Centralised vs Decentralised
> Workforce Demographics
• Organisation Growth and Future Recruitment
• Employee Turnover and Intentions
• Age/Gender/Ethnicity/Status
> Ability to Pay
January 2008
10
2.4 Factors Affecting Comp Philosophy – Internal
11.
January 2008
11
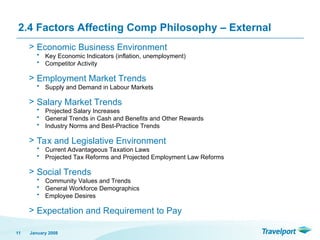
> EconomicBusiness Environment
• Key Economic Indicators (inflation, unemployment)
• Competitor Activity
> Employment Market Trends
• Supply and Demand in Labour Markets
> Salary Market Trends
• Projected Salary Increases
• General Trends in Cash and Benefits and Other Rewards
• Industry Norms and Best-Practice Trends
> Tax and Legislative Environment
• Current Advantageous Taxation Laws
• Projected Tax Reforms and Projected Employment Law Reforms
> Social Trends
• Community Values and Trends
• General Workforce Demographics
• Employee Desires
> Expectation and Requirement to Pay
2.4 Factors Affecting Comp Philosophy – External
12.
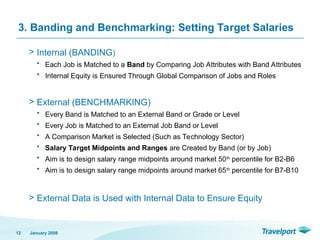
> Internal (BANDING)
•Each Job is Matched to a Band by Comparing Job Attributes with Band Attributes
• Internal Equity is Ensured Through Global Comparison of Jobs and Roles
> External (BENCHMARKING)
• Every Band is Matched to an External Band or Grade or Level
• Every Job is Matched to an External Job Band or Level
• A Comparison Market is Selected (Such as Technology Sector)
• Salary Target Midpoints and Ranges are Created by Band (or by Job)
• Aim is to design salary range midpoints around market 50th
percentile for B2-B6
• Aim is to design salary range midpoints around market 65th
percentile for B7-B10
> External Data is Used with Internal Data to Ensure Equity
January 2008
12
3. Banding and Benchmarking: Setting Target Salaries
13.
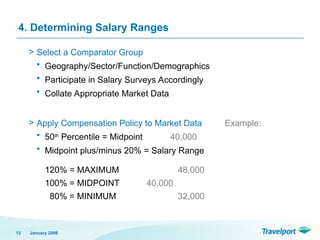
4. Determining SalaryRanges
> Select a Comparator Group
• Geography/Sector/Function/Demographics
• Participate in Salary Surveys Accordingly
• Collate Appropriate Market Data
> Apply Compensation Policy to Market Data Example:
• 50th
Percentile = Midpoint 40,000
• Midpoint plus/minus 20% = Salary Range
120% = MAXIMUM 48,000
100% = MIDPOINT 40,000
80% = MINIMUM 32,000
January 2008
13
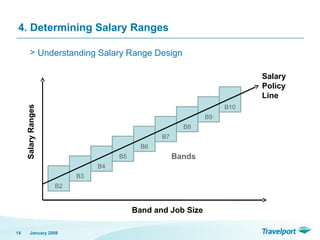
14.
> Understanding SalaryRange Design
January 2008
14
B2
B3
B4
B5
B6
B7
B8
B9
B10
Salary
Ranges
Band and Job Size
Bands
Salary
Policy
Line
4. Determining Salary Ranges
15.
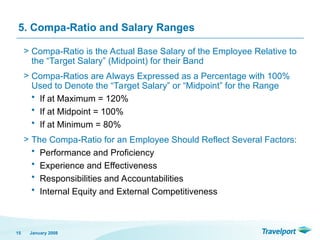
5. Compa-Ratio andSalary Ranges
> Compa-Ratio is the Actual Base Salary of the Employee Relative to
the “Target Salary” (Midpoint) for their Band
> Compa-Ratios are Always Expressed as a Percentage with 100%
Used to Denote the “Target Salary” or “Midpoint” for the Range
• If at Maximum = 120%
• If at Midpoint = 100%
• If at Minimum = 80%
> The Compa-Ratio for an Employee Should Reflect Several Factors:
• Performance and Proficiency
• Experience and Effectiveness
• Responsibilities and Accountabilities
• Internal Equity and External Competitiveness
January 2008
15
16.
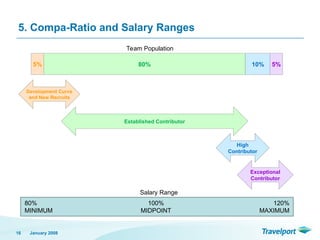
5. Compa-Ratio andSalary Ranges
January 2008
16
Team Population
5% 80% 10% 5%
Development Curve
and New Recruits
Established Contributor
Exceptional
Contributor
High
Contributor
Salary Range
80%
MINIMUM
100%
MIDPOINT
120%
MAXIMUM
17.
6. Linking Salaryto Performance
> Why Link Salary to Performance?
• Reward Employees for Personal and Company Success
• Pay Competitively Against the Marketplace
• Promote Fairness and Equity Across the Business
• Attract and Retain Top Performers
• Provide Opportunity for Increased Earnings as Results Increase
• Drive Performance Through Target Driven Incentive Plans
January 2008
17
18.
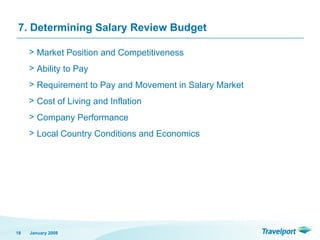
7. Determining SalaryReview Budget
> Market Position and Competitiveness
> Ability to Pay
> Requirement to Pay and Movement in Salary Market
> Cost of Living and Inflation
> Company Performance
> Local Country Conditions and Economics
January 2008
18
19.
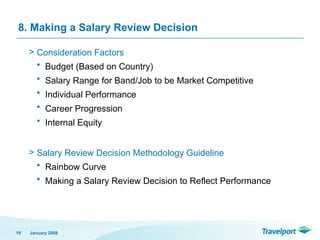
8. Making aSalary Review Decision
> Consideration Factors
• Budget (Based on Country)
• Salary Range for Band/Job to be Market Competitive
• Individual Performance
• Career Progression
• Internal Equity
> Salary Review Decision Methodology Guideline
• Rainbow Curve
• Making a Salary Review Decision to Reflect Performance
January 2008
19
20.
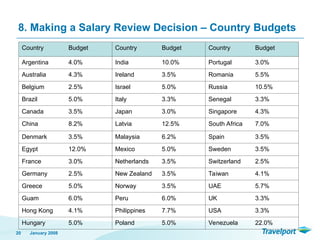
8. Making aSalary Review Decision – Country Budgets
January 2008
20
Country Budget Country Budget Country Budget
Argentina 4.0% India 10.0% Portugal 3.0%
Australia 4.3% Ireland 3.5% Romania 5.5%
Belgium 2.5% Israel 5.0% Russia 10.5%
Brazil 5.0% Italy 3.3% Senegal 3.3%
Canada 3.5% Japan 3.0% Singapore 4.3%
China 8.2% Latvia 12.5% South Africa 7.0%
Denmark 3.5% Malaysia 6.2% Spain 3.5%
Egypt 12.0% Mexico 5.0% Sweden 3.5%
France 3.0% Netherlands 3.5% Switzerland 2.5%
Germany 2.5% New Zealand 3.5% Taiwan 4.1%
Greece 5.0% Norway 3.5% UAE 5.7%
Guam 6.0% Peru 6.0% UK 3.3%
Hong Kong 4.1% Philippines 7.7% USA 3.3%
Hungary 5.0% Poland 5.0% Venezuela 22.0%
21.
8. Making aSalary Review Decision - Old Approach
January 2008
21
Performance
Rating
Description Merit
Pot
Significantly
Exceeds
Expectations
Employee consistently and significantly exceeds all of the
responsibilities of the position and the goals of the Performance and
Development Plan. This rating is reserved for those few individuals
who strive for and achieve excellence.
6.0%
Exceeds
Expectations
Employee frequently exceeds many of the responsibilities of the
position and the goals of the Performance and Development Plan,
while successfully achieving all others.
4.5%
Meets
Expectations
Employee successfully meets the responsibilities of the position and
the goals of the Performance and Development Plan.
3.0%
Meets Most
Expectations
In the majority of circumstances the employee meets position
requirements, objectives and expectations. Also recommended for
those employees who have demonstrated development, learning
and progress towards performance expectations.
2.0%
Below
Expectations
Employee does not achieve the responsibilities of the position and
the goals of the Performance and Development Plan. Immediate
improvement is required as specified in a corrective action plan.
0%
> Simple Approach Based on Salary Review Budget of 3.3%
22.
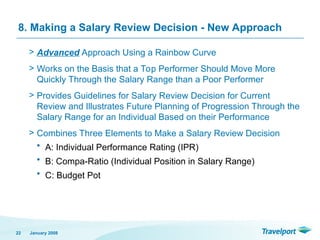
8. Making aSalary Review Decision - New Approach
> Advanced Approach Using a Rainbow Curve
> Works on the Basis that a Top Performer Should Move More
Quickly Through the Salary Range than a Poor Performer
> Provides Guidelines for Salary Review Decision for Current
Review and Illustrates Future Planning of Progression Through the
Salary Range for an Individual Based on their Performance
> Combines Three Elements to Make a Salary Review Decision
• A: Individual Performance Rating (IPR)
• B: Compa-Ratio (Individual Position in Salary Range)
• C: Budget Pot
January 2008
22
23.
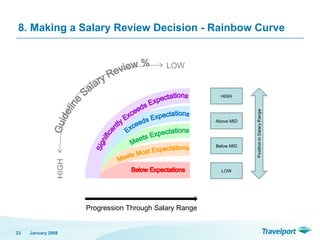
8. Making aSalary Review Decision - Rainbow Curve
January 2008
23
Progression Through Salary Range
HIGH
LOW
LOW
Below MID
Above MID
HIGH
24.
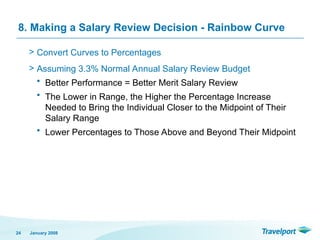
8. Making aSalary Review Decision - Rainbow Curve
> Convert Curves to Percentages
> Assuming 3.3% Normal Annual Salary Review Budget
• Better Performance = Better Merit Salary Review
• The Lower in Range, the Higher the Percentage Increase
Needed to Bring the Individual Closer to the Midpoint of Their
Salary Range
• Lower Percentages to Those Above and Beyond Their Midpoint
January 2008
24
25.
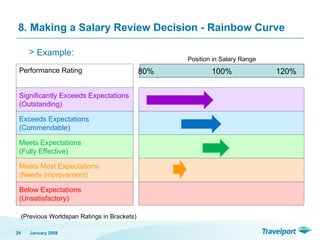
8. Making aSalary Review Decision - Rainbow Curve
January 2008
25
Performance Rating
Significantly Exceeds Expectations
(Outstanding)
Exceeds Expectations
(Commendable)
Meets Expectations
(Fully Effective)
Meets Most Expectations
(Needs Improvement)
Below Expectations
(Unsatisfactory)
Position in Salary Range
80% 100% 120%
(Previous Worldspan Ratings in Brackets)
> Example:
26.
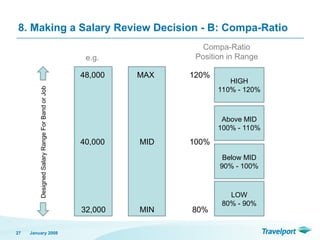
8. Making aSalary Review Decision - B: Compa-Ratio
January 2008
27
Designed
Salary
Range
For
Band
or
Job
80%
MIN
MID
MAX
100%
120%
LOW
80% - 90%
Below MID
90% - 100%
Above MID
100% - 110%
HIGH
110% - 120%
e.g.
32,000
40,000
48,000
Compa-Ratio
Position in Range
27.
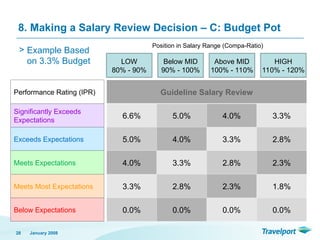
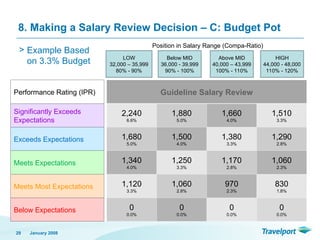
8. Making aSalary Review Decision – C: Budget Pot
January 2008
28
LOW
80% - 90%
Below MID
90% - 100%
Above MID
100% - 110%
HIGH
110% - 120%
> Example Based
on 3.3% Budget
Performance Rating (IPR)
Significantly Exceeds
Expectations
Exceeds Expectations
Meets Expectations
Meets Most Expectations
Below Expectations
Guideline Salary Review
6.6% 5.0% 4.0% 3.3%
5.0% 4.0% 3.3% 2.8%
4.0% 3.3% 2.8% 2.3%
3.3% 2.8% 2.3% 1.8%
0.0% 0.0% 0.0% 0.0%
Position in Salary Range (Compa-Ratio)
9. Additional Considerations
>Rainbow Curve Should be Used as a Guideline and is Not Rigid or Fixed
> Below Expectations Employees Should Not be Given a Salary Review
> Employees Recruited on or After the 1st
March 2007 Should Receive Reduced
Pro-Rata Review in this Years CRD Process
> Employees Who Were Recruited on or After the 1st
October 2006 and who Did
Not Receive a Salary Review on 1st
March 2007 May Need to be Awarded a
Slightly Higher Salary Review % on a Pro-Rata Basis
> Employees Already at or Above Maximum for Their Range Should Have a
Lump-Sum Award Rather than a Salary Increase
> Employees on Long Term Sick Leave and Maternity Leave Should Have their
Salaries Reviewed and Implementation will be in Accordance with Local
Employment Legislation
January 2008
30
30.
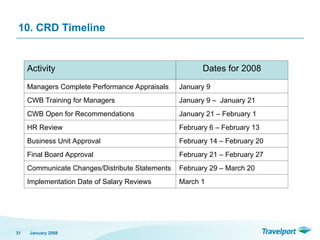
10. CRD Timeline
January2008
31
Activity Dates for 2008
Managers Complete Performance Appraisals January 9
CWB Training for Managers January 9 – January 21
CWB Open for Recommendations January 21 – February 1
HR Review February 6 – February 13
Business Unit Approval February 14 – February 20
Final Board Approval February 21 – February 27
Communicate Changes/Distribute Statements February 29 – March 20
Implementation Date of Salary Reviews March 1