Download to read offline


![MEAN TIME TO FAILURE [MMTF]
Where f(t) is the failure probability density function](https://image.slidesharecdn.com/random-251120173613-daf465a2/75/slide-83-2048.jpg)
![MEAN TIME TO REPAIR [MTTR]](https://image.slidesharecdn.com/random-251120173613-daf465a2/75/slide-84-2048.jpg)


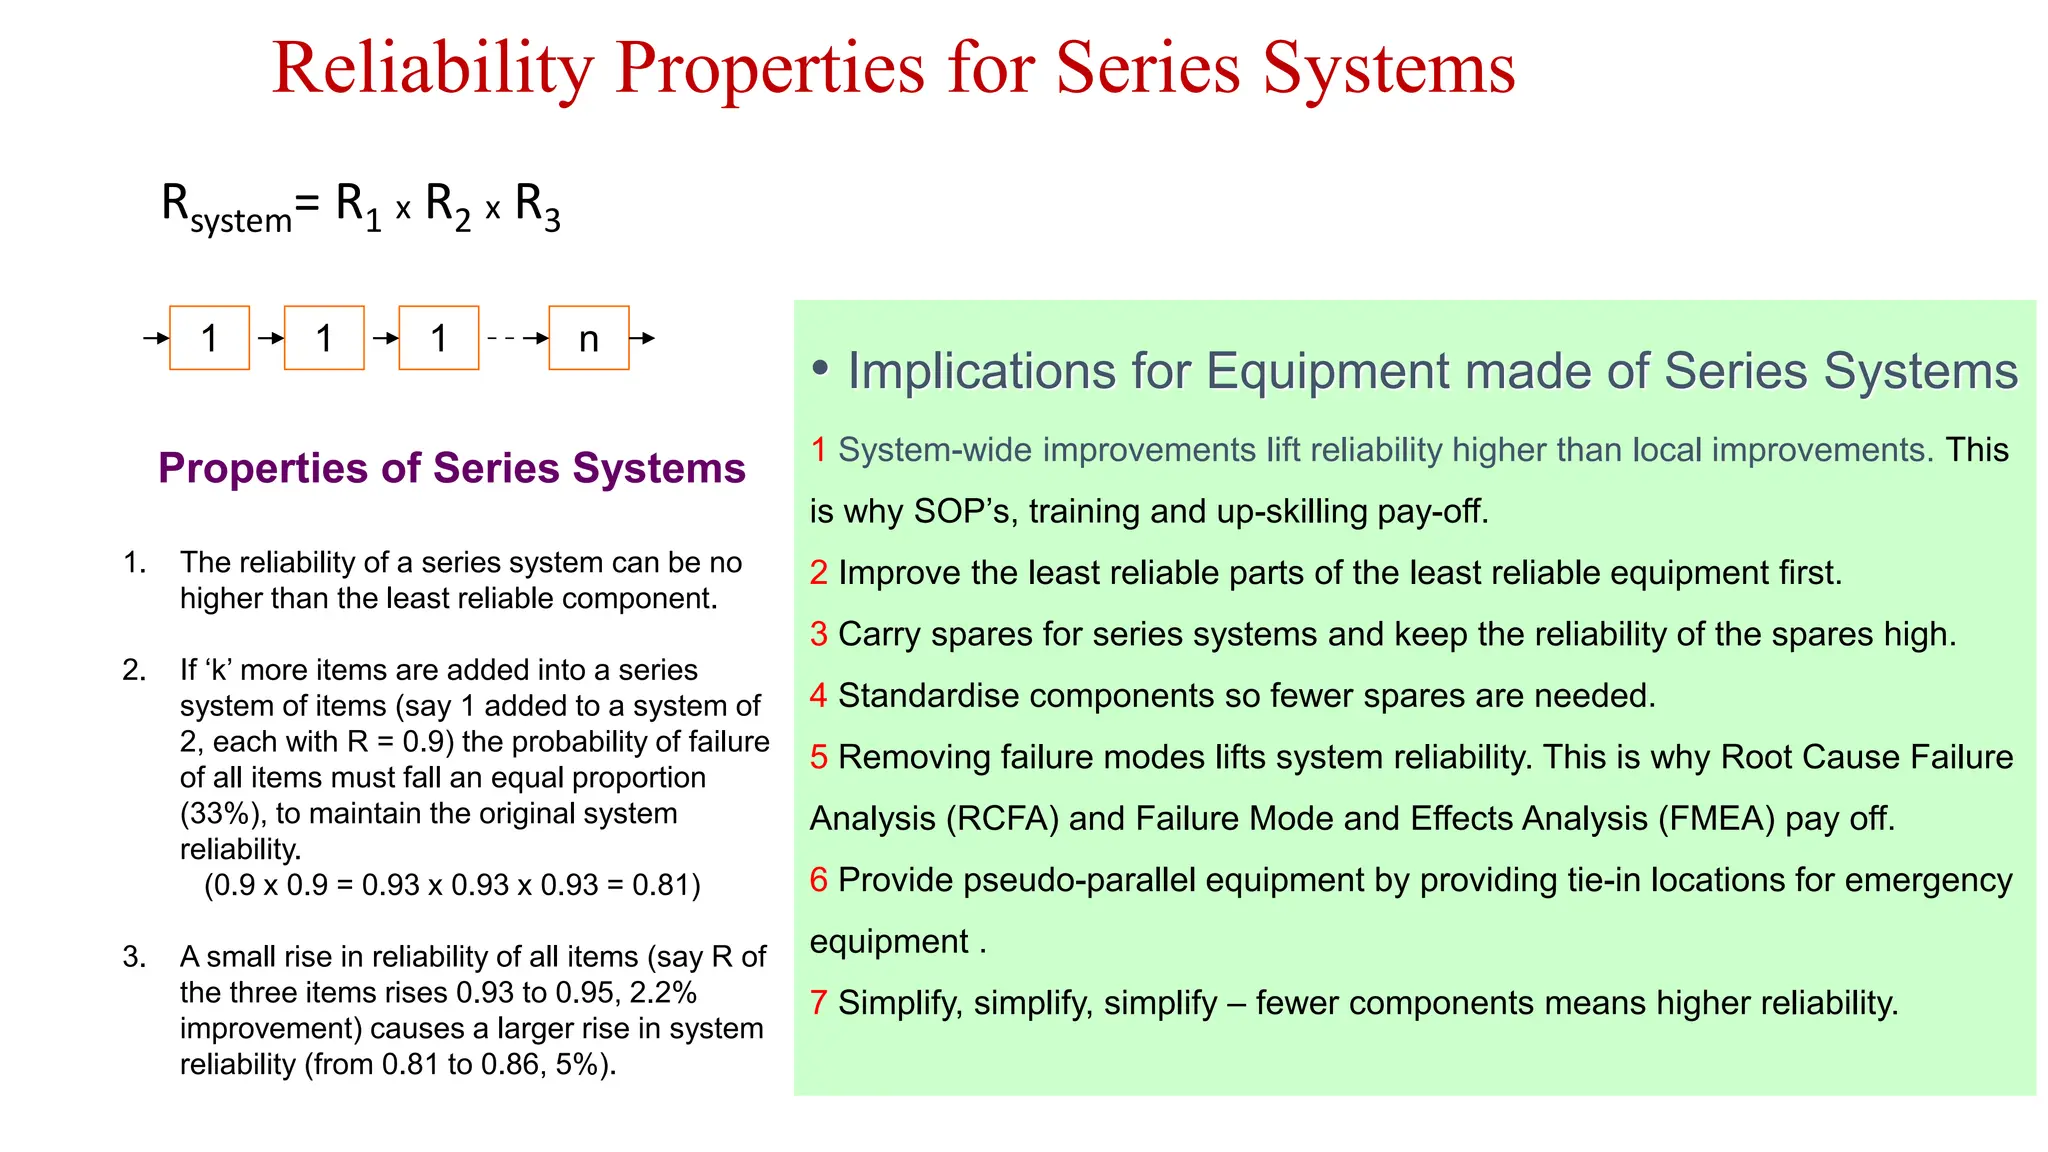
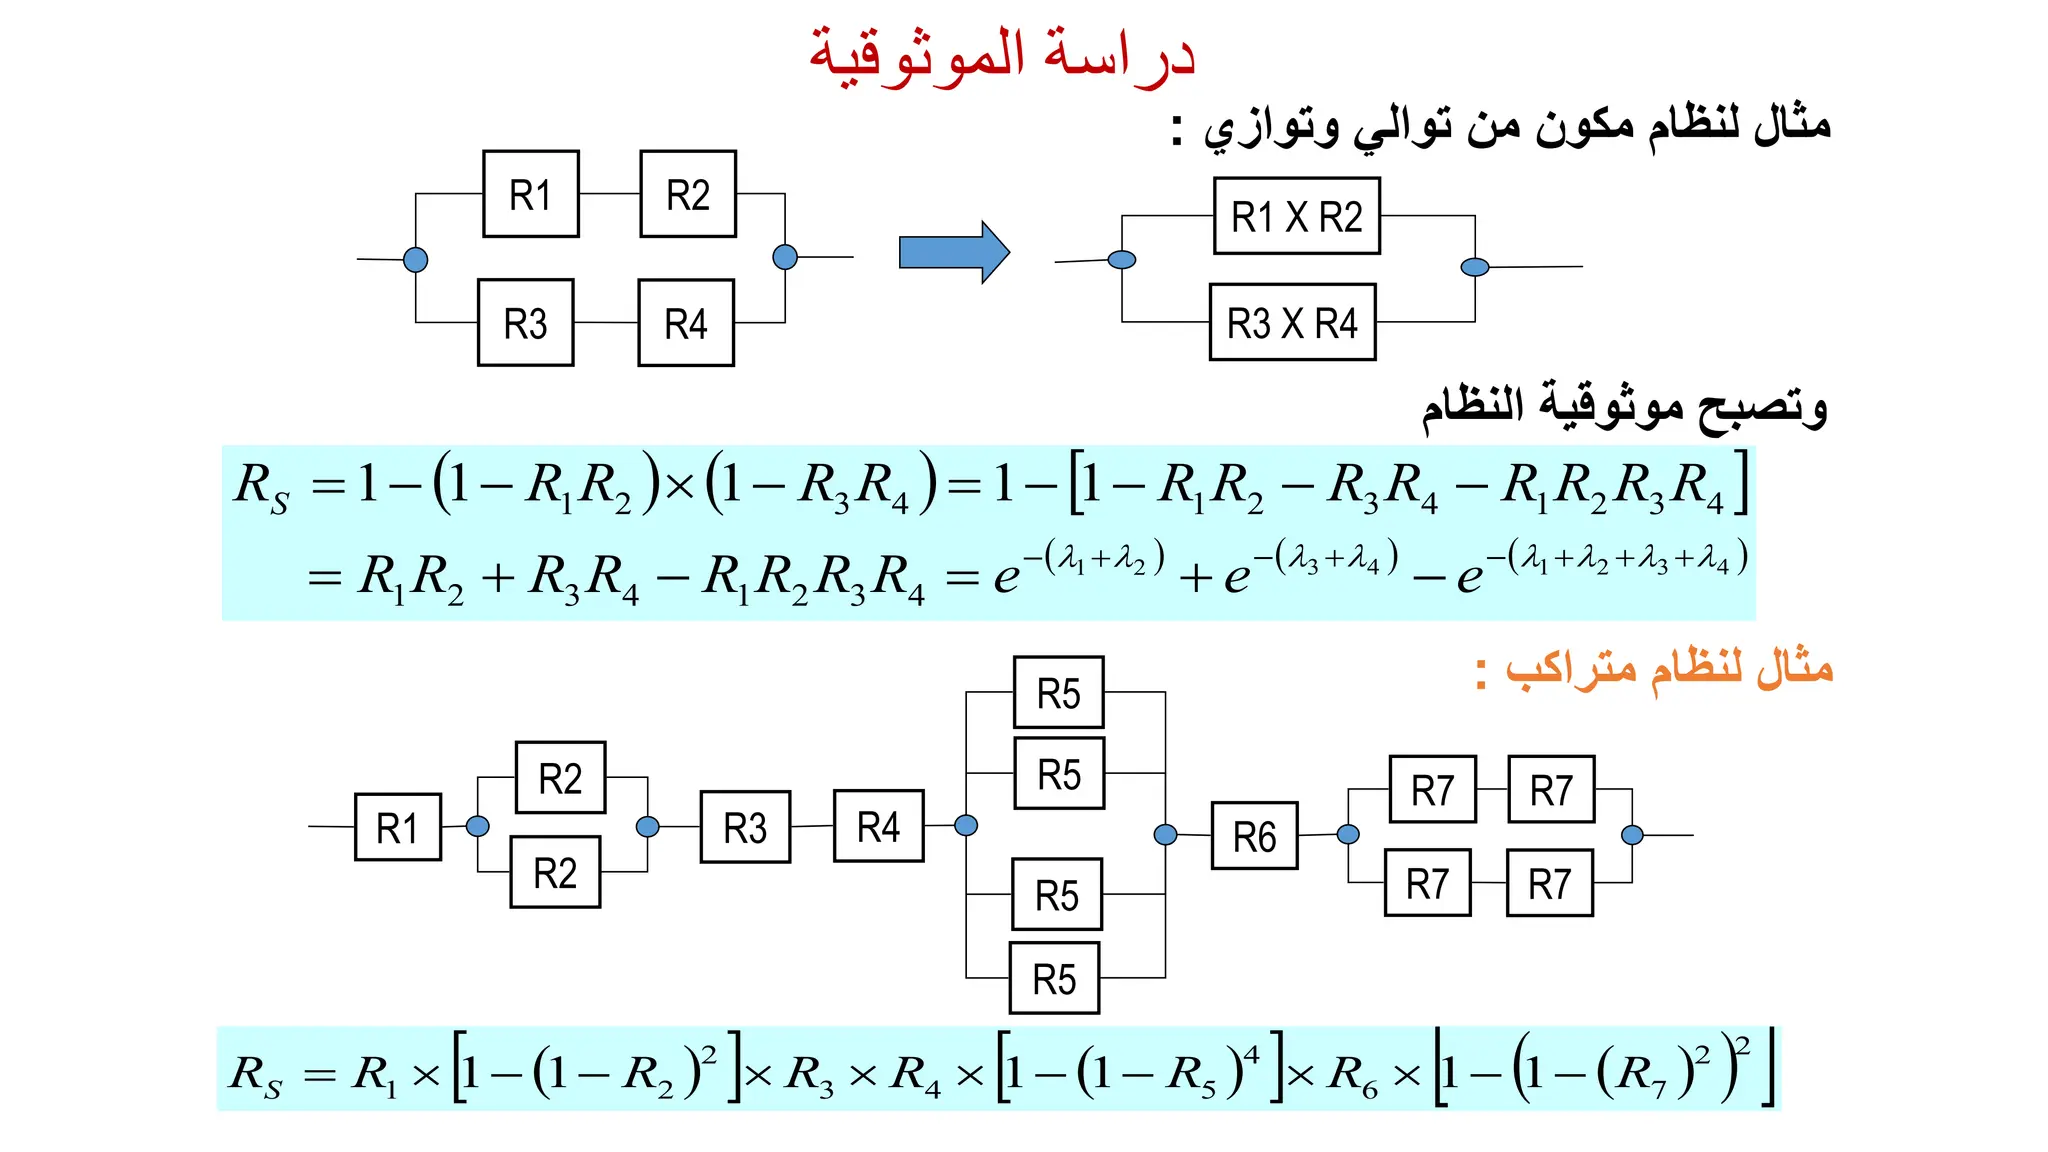
![Reliability Properties for Systems
• Series Systems
Rsystem= R1 x R2 x R3
• Parallel Systems
Rsystem= 1-[(1- R1)x(1- R2)x(1-R3)]
1
1
1
n
1 1 1 n
R = 0.95 x 0.95 = 0.9025
R = 1 – [(1 - 0.6) x (1 - 0.6)] = 0.84
The mathematics can be difficult. But you need to know that such mathematics exists
and be able to use the principles to optimise maintenance.](https://image.slidesharecdn.com/random-251120173613-daf465a2/75/slide-88-2048.jpg)
![Reliability Properties for Parallel Systems
1 1 1 n
Rsystem= 1-[(1- R1)x(1- R2)x(1-R3)]
Properties of Parallel Systems
1. The more number of components in
parallel the higher the system reliability.
2. The reliability of the parallel arrangement
is higher than the reliability of the most
reliable component.
m
m m
m
m
m m
m
Which arrangement is more reliable if m = 0.9?
• Implications of Parallel Systems for
Equipment
1 Use parallel arrangements when the risk of failure has high DAFT
Cost consequences.
2 Consider providing various paths for product to take in production
plants with in-series equipment.
3 Build redundancy into your systems so there is more than one
way to do a thing.](https://image.slidesharecdn.com/random-251120173613-daf465a2/75/slide-90-2048.jpg)


![دراسة
الموثوقية
تعرف
اإلتاحة
بمقدار
االستعداد
واحتمالية
اتاحتها
للعمل
تحت
الطلب؛
ومفهو
م
اإلتاحة
يجمع
ما
بين
الموثوقية
وقابلية
الصيانة
حيث
يعبر
عنها
بالتالي
:
3
-
اإلتاحة
ِ
Availability
MTTR
MTBF
MTBF
A
حيث
MTBF
=
متوسط
الزمن
بين
األعطال
(
الفشل
)
MTTR
=
متوسط
الزمن
لإلصالح
وعليه
تعتمد
اإلتاحة
على
مقدار
موثوقية
المعدة
أو
الجزء
للعمل
,
ومقدار
الزمن
الم
طلوب
للقيام
باإلصالح
وهي
تتأثر
بالتالي
:
مقدار
اإلتاحة
لقطع
الغيار
ويحسب
من
احتمالية
توفر
مستويات
االستيداع
.
عامل
االستخدام
=
{
زمن
التشغيل
(t1)
[/
زمن
التشغيل
(t1)
+
زمن
الصيانة
(t2)
+
زمن
توقف
(t3)
]
}
مقدار
إتاحة
افراد
الصيانة
ويحسب
وفقا
الحتمال
توفر
العمالة
المتخصصة
.](https://image.slidesharecdn.com/random-251120173613-daf465a2/75/slide-106-2048.jpg)


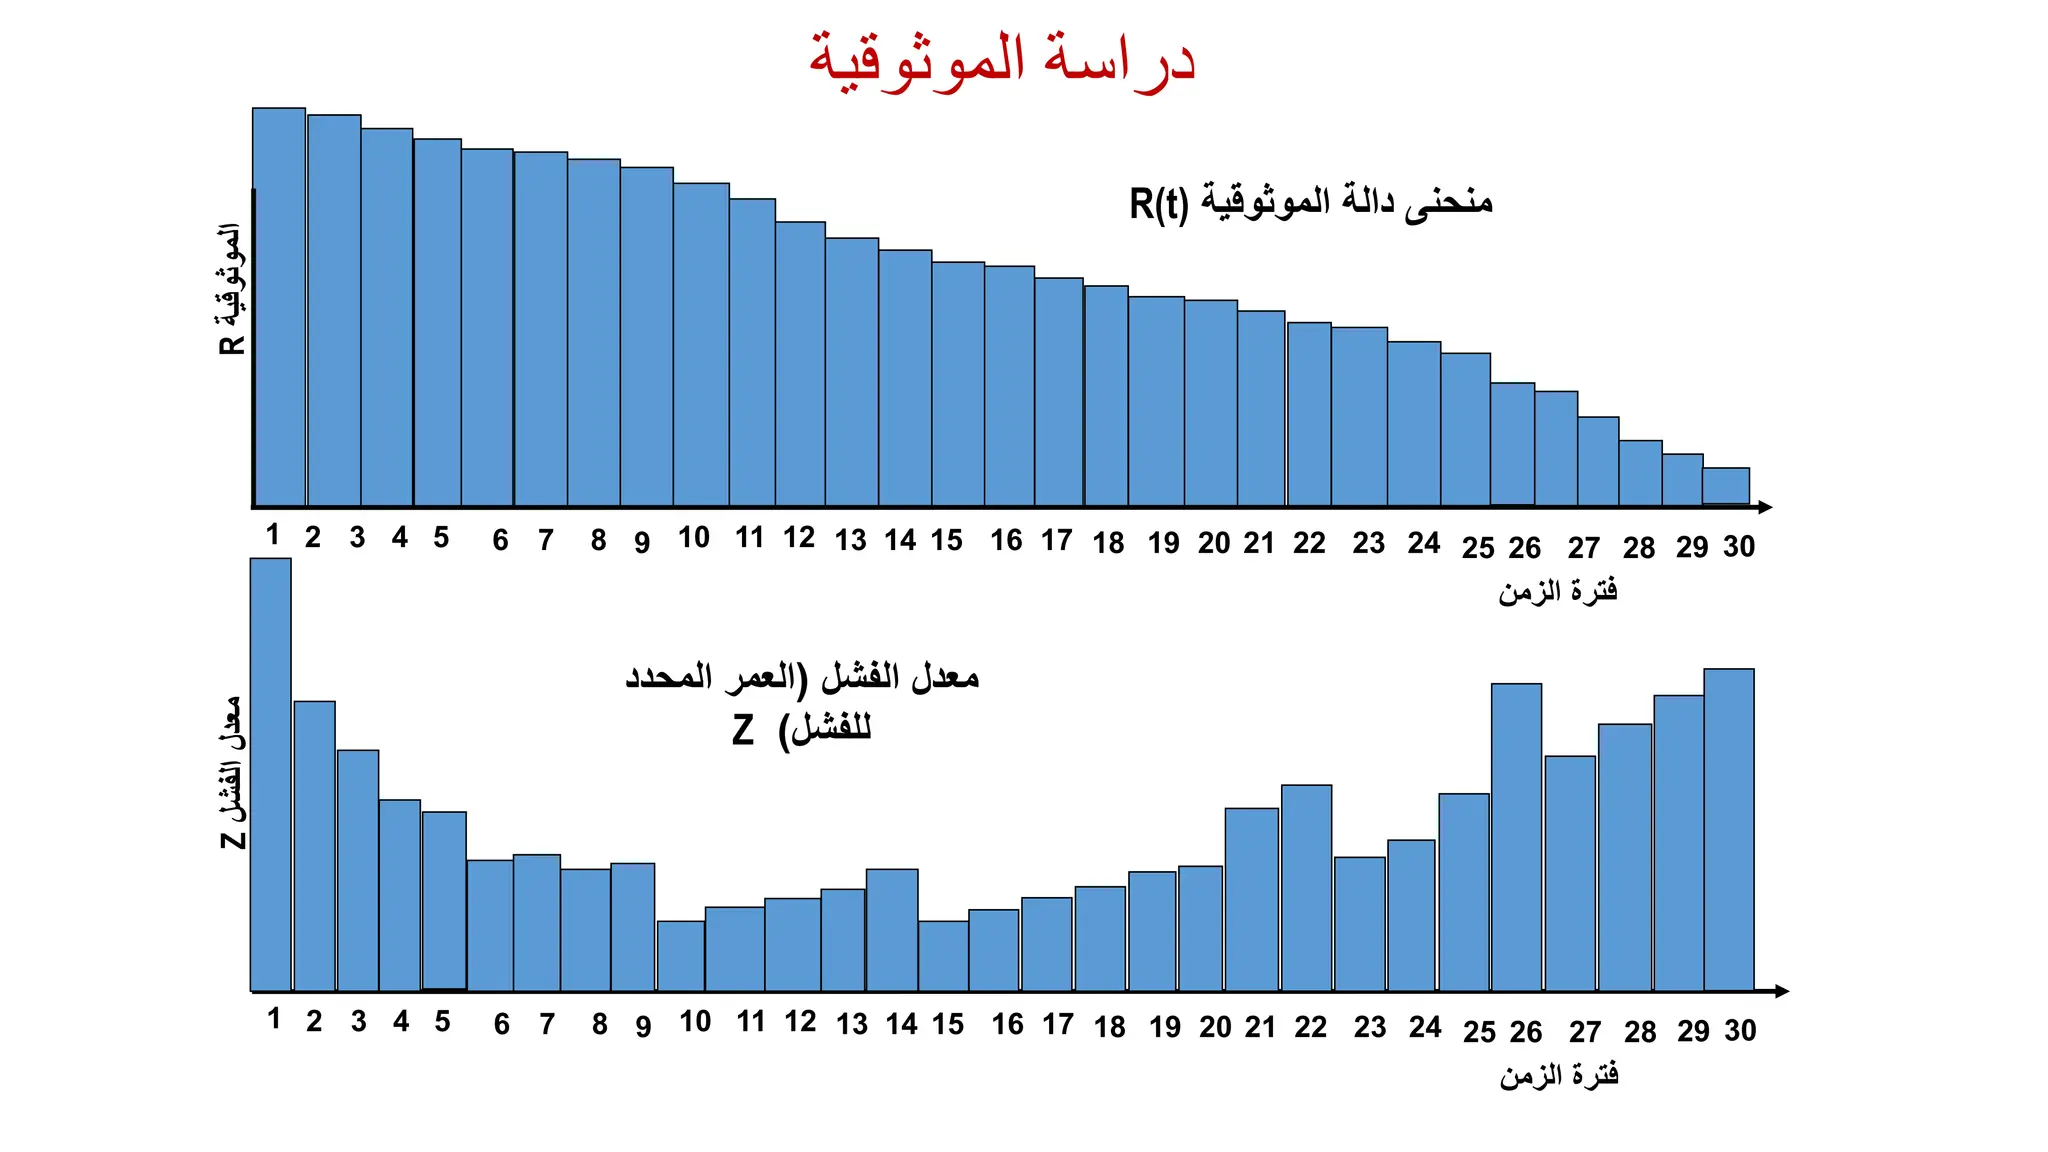
عينة من المحتوى : تحليل معدلات الاحتمالية إيجاد أنماط الفشل: حساب احتمالات الفشل والموثوقية ، دراسة احتمالات العطل من البيانات التاريخية والخبرات المكتسبة عن العطل تحليل التكلفة المترتبة على الفشل تكلفة الإصلاح ، تكلفة صيانة المعدة وتكاليف الهلاك والإحلال تكلفة الفقد، تكلفة توقف المنظومة هن العمل تكلفة الفرصة المفقودة ، تكلفة عدم اكتمال الصيانة


![002 Maintenance M Overview 20 06 06[1]](https://cdn.slidesharecdn.com/ss_thumbnails/002-maintenance-m-overview-20-06-061-1221944333735887-9-thumbnail.jpg?width=640&height=640&fit=bounds)
![Presentation1 709[1]](https://cdn.slidesharecdn.com/ss_thumbnails/presentation17091-120813044045-phpapp01-thumbnail.jpg?width=640&height=640&fit=bounds)