Downloaded 31 times


![OPTIMIZATION
op ti mize [op-tuh-mahyz]
Verb
1. To make as effective, or useful as possible.
Website Optimization delivers relevancy to customers,
ROI to clients
Improve site performance (business objectives)
Bounce
Engage more users Rate
Increase sales and profits
KPIs
Improve lead generation and opt-ins
Validate assumptions
Discover what content resonates with target audience(s)](https://image.slidesharecdn.com/russiaperformancemktgworkshop-final-arial1-121022072111-phpapp01/85/Peter-Ernst-9-320.jpg)
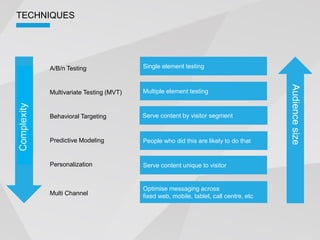
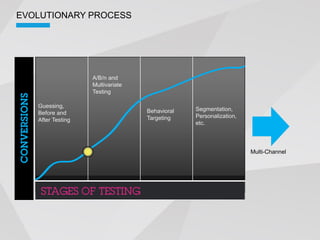

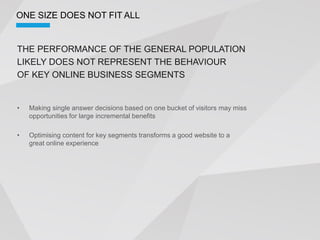

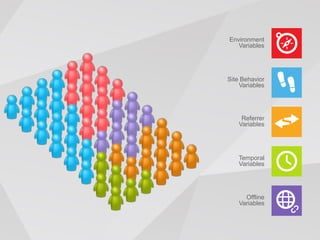
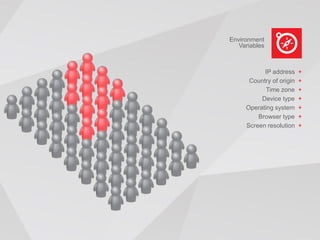

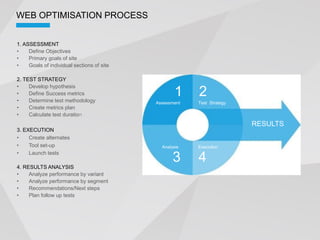


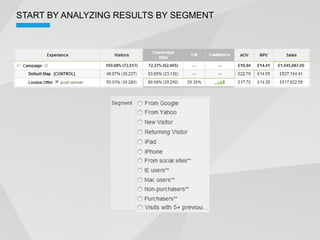
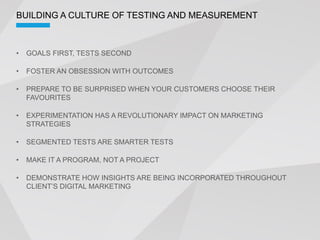


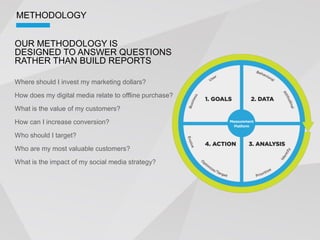
The document outlines a methodology for web optimization that focuses on testing content to enhance user experience and drive business value. It emphasizes the importance of data analysis, segmentation, and personalized content delivery to improve conversion rates and ROI. Key strategies include A/B testing, multivariate testing, and a culture of continuous measurement and learning to meet audience needs effectively.