
Recommended
Recommended
More Related Content
What's hot
What's hot (19)
Viewers also liked
Viewers also liked (8)
Similar to Spring2015_Newsletter
Similar to Spring2015_Newsletter (20)
Spring2015_Newsletter
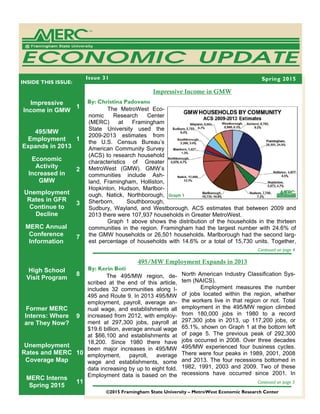
- 1. Impressive Income in GMW 1 495/MW Employment Expands in 2013 1 2 Unemployment Rates in GFR Continue to Decline 3 7 Former MERC Interns: Where are They Now? 9 Unemployment Rates and MERC Coverage Map 10 MERC Interns Spring 2015 11 High School Visit Program 8 INSIDE THIS ISSUE: 495/MW Employment Expands in 2013 The 495/MW region, de- scribed at the end of this article, includes 32 communities along I- 495 and Route 9. In 2013 495/MW employment, payroll, average an- nual wage, and establishments all increased from 2012, with employ- ment at 297,300 jobs, payroll at $19.6 billion, average annual wage at $66,100 and establishments at 18,200. Since 1980 there have been major increases in 495/MW employment, payroll, average wage and establishments, some data increasing by up to eight fold. Employment data is based on the Issue 31 The MetroWest Eco- nomic Research Center (MERC) at Framingham State University used the 2009-2013 estimates from the U.S. Census Bureau’s American Community Survey (ACS) to research household characteristics of Greater MetroWest (GMW). GMW’s communities include Ash- land, Framingham, Holliston, Hopkinton, Hudson, Marlbor- ough, Natick, Northborough, Sherborn, Southborough, Sudbury, Wayland, and Westborough. ACS estimates that between 2009 and 2013 there were 107,937 households in Greater MetroWest. Graph 1 above shows the distribution of the households in the thirteen communities in the region. Framingham had the largest number with 24.6% of the GMW households or 26,501 households. Marlborough had the second larg- est percentage of households with 14.6% or a total of 15,730 units. Together, By: Christina Padovano Continued on page 4 Continued on page 5 ©2015 Framingham State University – MetroWest Economic Research Center By: Kerin Boti North American Industry Classification Sys- tem (NAICS). Employment measures the number of jobs located within the region, whether the workers live in that region or not. Total employment in the 495/MW region climbed from 180,000 jobs in 1980 to a record 297,300 jobs in 2013, up 117,200 jobs, or 65.1%, shown on Graph 1 at the bottom left of page 5. The previous peak of 292,300 jobs occurred in 2008. Over three decades 495/MW experienced four business cycles. There were four peaks in 1989, 2001, 2008 and 2013. The four recessions bottomed in 1982, 1991, 2003 and 2009. Two of these recessions have occurred since 2001. In Spring 2015 Graph 1 Impressive Income in GMW Economic Activity Increased in GMW MERC Annual Conference Information
- 2. The MERC Eco- nomic Index (MEI) was created to track the eco- nomic activity in the thir- teen communities that make up the Greater MetroWest region. The in- dex, below in graph 1, de- picts the state of economic activity using monthly val- ues. Positive values indi- cate greater expansion in economic activity. At zero on the vertical axis the Greater MetroWest econo- my is expanding at its long run stable trend. Negative values indicate a decrease in economic activity below the trend. The Index has been divided into quarters to make it easier to interpret economic activity not only throughout the year but also when com- paring years. Quarter 1 shown in orange typical- ly posts values higher than the end of the quar- ter with the lowest point occurring in February or March. The exception was in 2012 when Q1 ended higher than it began. The largest increase in economic activity occurs in Quarter 2, shown in green. Of the last ten years, 2008 and 2009 had the smallest second quarter improvements, which is to be expected due to the effects of the Great Recession. The index typically posts its highest values in Quarter 3, shown in red. For most years, the highest value is in July with the exception of 2010 and 2012 when the peak oc- curred in August. The peak is typically followed by the largest annual contraction. For each of the years from 2010 to 2014 the increase in the in- dex during Q2 was greater than the decrease in Q3. Quarter 4, in purple, shows the least change of all quarters. Values at the end of Q4 were higher than values at the beginning of the quarter 70% of the time The MERC Economic In- dex uses a combination of leading and coincident indicators. Leading indicators typically change di- rection before the business cycle changes direc- tion and can be used to predict when a change in the business cycle will occur. An increase in new building permits, one of the MEI leading indica- tors, typically precedes an increase in construc- tion related jobs which may stimulate a period of economic expansion. Initial jobless claims, also a leading indicator, react quickly to changes in eco- nomic activity. Coincident indicators are concurrent with business cycle changes and reflect the current state of the economy. The coincident indicators used in the MEI are NAICS employment by super sector, the Framingham NECTA total employ- ment from the Bureau of Labor Statistics, and un- employment rate. Typically when economic activ- ity declines, employment decreases and unem- ployment increases. Together, the coincident in- dicators reflect a true picture of the current state of the economy. The purpose of the MERC Economic In- dex is to not only identify expansions and contractions of economic activity, but also anticipate turning points when the busi- ness cycle shifts through periods of in- creased and decreased economic activi- ty. Businesses in the Greater MetroWest region can utilize the MEI as a resource in their decision making process. The MEI provides economic data analysis that is unique to Greater MetroWest and in- creases awareness about the local econ- omy of this region while serving as a tool to promote informed decision making. MERC is currently collecting the most up to date data and expects to publish the Quarterly Economic Activity Reports. ■ Economic Activity Increased in Greater MetroWest Page 2 MERC Economic Update By: Jeffrey Hollow Jeffrey Hollow Intern II Focus Economic Index Major Finance YOG 2015 Graph 1
- 3. The Greater Frank- lin Region (GFR) is com- posed of nine communities: Bellingham, Blackstone, Foxborough, Franklin, Medfield, Medway, Millis, Norfolk, and Wrentham. Among the nine communi- ties in GFR, Blackstone posted the highest unem- ployment rate in December 2014 at 5.1%, followed by Bellingham with a rate of 4.7%. Medfield, on the oth- er hand, had the lowest unemployment rate in the region at 3.4%, followed by Norfolk at 3.8%. All of the nine communities in the region posted unemployment rates below that of the nation and the state, with the excep- tion of Blackstone. Blackstone had an unem- ployment rate higher than the state’s rate of 4.9% in December 2014 but below the U.S. rate of 5.4%. See Graph 1 below. The total number of unemployed individ- uals in GFR in December 2014 was recorded at 2,957 individuals. Compared with the other communities in GFR, Franklin had the largest number of unemployed with 690 individuals or about 23% of the total unemployed in the re- Page 3 MERC Economic Update Unemployment Rates in Greater Franklin Region Continue to Decline Continued on page 8 By: Kristen Hurley gion. Although Franklin had the largest number of unemployed individuals in the region, it did not post the region’s highest unemployment rate. Belling- ham and Foxborough had the next highest number of unemployed in the region with 467 and 407 indi- viduals, respectively. These three communities together accounted for more than half of the total unemployed individuals in the region. Millis, on the other hand, had the lowest number of unemployed with 186 individuals, representing 6% of the total number of the unemployed in GFR. It is interesting to note that although Millis had the lowest number of unemployed, it did not have the lowest unem- ployment rate in the region. Following Millis, Nor- folk and Medfield posted the next low- est unemployment levels with 195 and 215 individuals, respectively. To- gether, these three communities rep- resented about 20% of the total num- ber of unemployed individuals in the region. See Map 1 above. Throughout the past twenty- five years, the unemployment rates in the region have fluctuated greatly. The unemployment rates in both GFR and Massachusetts reached their peaks in 1991 at 8.0% and 8.6%, re- spectively, while the United States reached its highest unemployment rate in 2010 at 9.6%. The region, state, and nation all achieved their lowest rates in 2000 at 2.3%, 2.7%, Kristen Hurley Intern III Focus Unemployment Major Business Admin. YOG 2015 GFR UNEMPLOYED INDIVIDUALS December 2014: Total 2,957 401 - 550 100 - 250 251 - 400 551 - 700 Medfield 215Millis 186Medway 277 Blackstone 267 Bellingham 467 Franklin 690 Norfolk 195 Wrentham 253 Foxborough 407 Map 1 Graph 1
- 4. Page 4 MERC Economic Update Impressive Income in GMW Framingham and Marl- borough made up over 1/3 of the total house- holds in GMW. Three communities, Framing- ham, Marlborough and Natick, accounted for over half or 50.9% of the region’s households. The smallest number of households was record- ed in Sherborn with 1,427 households or 1.3% of the regional to- tal. There were five other communities that made up less than 5% of GMW’s total households. These included Hopkin- ton, Northborough, and Wayland with 4.7% each, Holliston with 4.5% and Southborough with 3%. Westborough accounted for 6.5% of the region’s households, or 6,980 units. Graph 2 below shows the composition of family and non-family households in the individ- ual communities, the region, the state and the nation. A household is considered to be all indi- viduals who occupy a housing unit regardless of relationship, while a family is considered to be related individuals residing in the same housing unit. A single male or female would be counted Continued from page 1 as a household while married individuals with children, or single parents with children would be counted as families. Sudbury had the highest percentage of households that were families with 89% of the town’s households while Sherborn was second with 87%. The two communities in GMW with the lowest percentages were Marlbor- ough with 60% and Natick with 63%. Of the households in the United States, 66% were con- sidered families. The Massachusetts percentage of families to households was lower at 64%. In GMW, 69% of households were considered fami- lies, higher than that of the United States and Massachusetts. Graph 3 below shows the median family and median household income in GMW, the state and the nation. Greater MetroWest had the highest median fami- ly income at $116,665 compared to $84,900 in Massachusetts and $64,719 in the United States. The median family income in GMW was almost double that of the United States. Sudbury recorded the highest median family income in the region at $186,507. While Marlborough recorded the lowest at $83,756. Every GMW community had a median family income higher than Massachusetts and the U.S. with the exception of Marlbor- ough. GMW also had the highest median household income at $91,020 compared to $66,866 in Massachusetts and Graph 2 Christina Padovano Intern II Focus Census Major Business Admin. YOG 2015 Continued on page 7 Graph 3
- 5. 495/MW Employment Expands in 2013 Page 5 MERC Economic Update Continued from page 1 2001-03, jobs fell 4.3% and in 2008-09, fell 4.6%. Since 2009 the region’s employment has increased every year. In 2013 employment to- taled 297,300, up from 288,800 in 2012, a 2.9% gain or over 8,000 jobs. Five MetroWest commu- nities: Framingham, Hopkinton, Marlborough, Natick and Westborough produced 44% of the region’s employment. Graph 2 on the right shows total payroll in the 495/MW region climbing almost eight fold from $2.6 billion in 1980 to a record of $19.6 billion in 2013, a gain of $17 bil- lion. Payroll refers to all wages and salaries paid to employees, including commissions, bonuses, stock options, overtime and sick pay. From 1980 to 2001, the region’s payroll rose five fold. Similar to em- ployment, two rapid declines in payroll since 2001 occurred during recessions. From 2001 to 2002 the region’s total payroll fell sharply from $14.3 billion to $13.5 billion, down 5.3%. From 2007 to 2009, total payroll again fell from $17.7 billion to $16.9 billion, a 4.6% decrease. Since 2009 the region’s payroll has risen every year. Total 495/MW 2013 Kerin Boti Intern II Focus Employment Major Economics YOG 2016 payroll rose $19 billion to $19.6 billion, up 3.3% from 2012. In 2013 those same five MetroWest communities: Framingham, Hopkinton, Marlbor- ough, Natick and Westborough generated half of the 495/MW total payroll. Like employment and pay- roll, the average annual wage for the 495/MW region peaked in 2013 at approximately $66,100. Average annual wage is computed by divid- ing the gross annual payroll by the average annual employment. Graph 3 on page 6 shows the re- gion’s average annual wage rising four fold over three decades from $14,300 in 1980 to $66,100 in 2013, with two exceptions. Since 2000 there have been two declines: in 2000-02, down 2.8% and in 2008, down 1.1%. Over the entire period the 495/MW average annual wage outpaced the Massachusetts Continued on page 6 Graph 1 Graph 2 “Total employment in the 495/MW region climbed from 180,000 jobs in 1980 to a record 297,300 jobs in 2013, up 117,200 jobs, or 65.1%” Graph 1
- 6. Page 6Issue 31 Intern of the Week Look for updates on MERC’s Face- book and Twitter about the intern of the week. The interns who are highlighted are chosen based upon their hard work and dedication to MERC. average annual wage and the United States average annual wage. By 2013 the region’s average annual wage exceeded the state’s average annual wage of $61,800 by 6.9% and the nation’s average annual wage of $49,800 by 32.7%. From 1980 to 2013, establishments more than doubled from 8,100 to 18,200. Establishments are defined as separate places of work. Employment, payroll and average wage all peaked in 2013, but not establishments. Instead, the total number of establishments in this region peaked in 2011, at 18,600, seen on graph 4. The largest decline in establishments occurred in 1990-92, dropping from 13,900 to 13,000. In just two years, almost 900 plac- es of work vanished. Between 2012 and 2013, the region’s total establishments rose slightly from 18,100 to 18,200. In summary, 2013 495/MW jobs, payroll, average wage and establishments increased from 2012. Employment, payroll and average annual wage all peaked in 2013 at record levels, with employment at 297,300, payroll at $19.6 billion, and aver- age annual wage at $66,100. Establish- ments have only slightly increased to 18,200. *495/MW communities: Acton, Ashland, Bellingham, Berlin, Bolton, Boxborough, Foxborough, Framingham, Franklin, Har- vard, Holliston, Hopedale, Hopkinton, Hud- son, Littleton, Marlborough, Maynard, Medfield, Medway, Milford, Millis, Natick, Norfolk, Northborough, Sherborn, Shrews- bury, Southborough, Stow, Sudbury, Way- land, Westborough, Wrentham. ■ 495/MW Employment Expands in 2013 FOLLOW MERC ON YOUR FAVORITE SOCIAL MEDIA Follow MERC on social networks to receive economic updates and learn about MERC research. www.merc-online.org Graph 3 Graph 4 Continued from page 5
- 7. $53,046 in the U.S. Sudbury also recorded the highest median household income at $170,924 and the lowest occurred in Framingham at $67,915. Every Greater MetroWest community had a higher median household income than Massachusetts and the United States. Graph 4 below shows the family income distribution in GMW, the state and the nation. In Massachusetts, 21% of families fell in the $150,000 or more category. The highest proportion of GMW families fell in the same category, but with a notably larger percentage of 34.5%. The highest percentage of fami- lies in the United States, at 19%, fell in the $50,000 to $74,999 category. The second largest percentage of families in GMW and Massachusetts, at 23.3% and 20.5% fell in the $100,000 to $149,000 category. The next largest percentage of U.S. families at 17.1% fell in the category of $15,000 to $34,999. GMW, Massa- chusetts and the United States all had their lowest percentages of families at 2.9%, 6.1% and 7.9% respectively, fall into the less than $14,999 category. ■ Page 7Issue 31 Continued from page 4 Impressive Income in GMW Graph 4
- 8. Page 8Issue 31 and 4.0%, respectively. The un- employment rates in the region were consistently lower than both the nation’s rate and the state’s rate during the twenty-five year period, except from 1990 through 1992 and in 2006 when the re- gion’s unemployment rates ex- ceeded the state’s rates. See Graph 2 at left. In December 2014, the to- tal labor force in GFR was record- ed at 71,662 individuals. Among the nine communities in the re- gion, Franklin had the largest number of individuals in the labor force with 17,494 individuals, rep- resenting 24.4% or almost one- fourth of the total GFR labor force. This implies that about one out of every four individuals in the labor force in the region lived in Frank- lin. Bellingham and Foxborough contributed 13.9% and 13.6%, re- spectively, to the total labor force. The combination of the labor forc- es in Franklin, Bellingham, and Foxborough accounted for more than half of the labor force in GFR. Millis, on the other hand, had the smallest labor force of the region, contributing only 5.9% to the total labor force with 4,240 individuals. See Graph 3 at left. ■ Continued from page 3 Graph 2 Unemployment Rates in Greater Franklin Region Continue to Decline Graph 3 During the fall 2014 semester, two MERC interns embarked on a mission to develop interest in economics at area high schools. Jay Nicholls and Andre Fernandes visited three high schools around the state and presented ‘Economics and Applied Concepts’ to economics courses mainly comprised of juniors and seniors. The goal of this project was to get students thinking about economics and business related fields as potential majors in college. This road show started at Seekonk High School, then went on to Bedford High and finally to Newton North. The program received great reviews from students and teachers alike. MERC hopes to continue this program every semester as it looks to expand its community outreach. High School Visit Program
- 9. Page 9Issue 31 Since MERC’s founding in 1991, more than 180 students have have participated in the MERC Internship Program. We reached out to a few of the former interns to see where their careers have taken them since leaving MERC and graduating from Framingham State Univer- sity. We received many responses and have high- lighted a few of them. Katelyn Correa in- terned with MERC from 2012 to 2013 and is now an Account Manager at Thrive Networks, an information technology outsourc- ing company located in Tewksbury, Massachu- setts. Katelyn reports that MERC helped pre- pare her for her current position in many ways, including mastering Excel, which she uses dai- ly. Katelyn also analyzes data and must ad- here to strict deadlines in order to meet goals for her team. She enjoys working in a team environment similar to the MERC office. Herbert Kyles, was a MERC intern in 2012 and 2013 and is currently a Financial Ad- visor at AspenCross Financial Group located in Westborough, Massachusetts. He assists indi- viduals, families and small businesses with their retirement planning, asset protection and wealth management. Herbert’s experience at MERC helped influence his career choice by exposing him to data regarding the economy and how it affects our everyday lives. He be- gan to notice how the repercussions of eco- nomic events were substantial for those who didn’t have plans in place. Herbert soon real- ized that he sought a career path where he could make a difference in people’s lives. Lecia Shronce joined MERC in 2002 and is now a Corporate Safety Professional with JF White Contracting Company located in Framingham. She is also a member of MERC’s Jay Nicholls Intern IV Focus Cost of Living Major Finance YOG 2015 Advisory Board. MERC helped her gain expe- rience in creating databases which she uses for tracking all general ledger, workers com- pensation and auto liability claims. Aggregat- ing large amounts of data at MERC translated well into her current role. Lecia encourages current MERC interns to understand the ‘big picture’ when working with data as it will bene- fit them in the future. From 2009 until 2011, Jon Murphy worked as an intern at MERC, and is now an economist for ITR Economics, which is an in- ternational business consulting and forecast- ing company located in Manchester, New Hampshire. His line of work is very much re- lated to MERC. The firm tracks approximately 8,000 economic indicators and provides mac- roeconomic, microeconomic, and company- specific forecasts for clients. ITR also publish- es a monthly newsletter, similar to the MERC newsletter, and a monthly economic report that tracks approximately 100 U.S. and inter- national economic indicators. MERC provided guidance for Jon as to what a real world re- search job is like; this helped him prepare for life after college. The MERC faculty and current interns are quite impressed with the graduates of the MERC Internship Program. Former MERC Interns: Where are They Now? Left: Herbert Kyles Above: Katelyn Correa with Professor Dunne By: Jay Nicholls
- 10. Page 10 MERC Economic Update Measures: U.S. February 2015 U-1 Persons unemployed 15 weeks or longer, as a percentage of the civil- ian labor force U-2 Job losers and persons who completed temporary jobs, as a percent- age of the civilian labor force U-3 Total unemployed persons, as a percentage of the civilian labor force ( the official unemployment rate) U-4 Total unemployed persons plus discouraged workers, as a percentage of the civilian labor force plus discourage workers U-5 (U-4) plus all other “marginal attached” workers, as a percentage of the civilian labor force plus all “marginally attached” workers U-6 Total unemployed persons, plus all “marginally attached” workers, plus all persons employed part time for economic reasons, as a percentage of the civilian labor force plus all “marginally attached” workers 2.7% 3.0% 5.8% 6.3% 7.1% 11.4% There are several categories of unemployment rates. U-1 through U-6, not sea- sonally adjusted, are reported below for the U.S. period rates in February 2015. MERC uses the U-3 rate, which is the official unemployment rate. MERC SUBSTATE REGIONS MAP MERC provides economic data and analysis for the 6 sub-state regions shown on the map: MetroWest CCSA™, Greater Marlborough Region, Greater Franklin Region, Blackstone Valley, 495/MetroWest Corridor, and the South Shore CCSA™. February 2015 UNEMPLOYMENT RATES Not Seasonally Adjusted (Preliminary Data) 495/MW 4.2% Blackstone Valley 5.2% Blackstone 6.1% Douglas 4.7% Grafton 4.7% Hopedale 4.7% Mendon 4.5% Millbury 5.4% Millville 5.9% Northbridge 5.8% Sutton 5.1% Upton 4.4% Uxbridge 5.5% Greater Franklin 4.6% Bellingham 5.3% Blackstone 6.1% Foxborough 4.6% Franklin 4.2% Medfield 3.5% Medway 4.2% Millis 5.6% Norfolk 4.5% Wrentham 4.6% Greater Marlborough 4.5% Hudson 5.4% Marlborough 4.6% Northborough 4.3% Westborough 3.3% MetroWest 3.7% Ashland 3.9% Framingham 3.8% Holliston 4.4% Hopkinton 3.9% Natick 3.5% Sherborn 3.2% Southborough 3.3% Sudbury 3.2% Wayland 3.5% Milford 5.4% South Shore 5.1% Abington 6.0% Braintree 4.7% Cohasset 3.6% Hanover 4.3% Hingham 3.8% Milton 4.2% Norwell 4.5% Quincy 5.1% Randolph 6.1% Rockland 6.0% Weymouth 5.5% Massachusetts 5.4% United States 5.8%
- 11. A Peek Inside MERC Page 11Issue 31 MERC Interns: Spring 2015 Back Row: Christina Padovano, Kristen Hurley, Kerin Boti, Marcella Bentes, Samantha Irvine, Romery Gonzalez, Priscilla Olicio, Sara Pandolfino, Nanci Felton, Kira Crocker Front Row: Zacharey Leach, Steven Porcello, Jay Nicholls, Wagner Sena, Jeffrey Hollow
- 12. THANK YOU TO OUR 2015 SPONSORS Issue 31www.merc-online.org Phone:(508)626-4033 Fax:(508)626-4018 www.merc-online.org MERCExecutiveBoard: MaureenDunne DonaldMacRitchie MarthaMeaney FahlinoSjuib NewsletterEditor: KerinBoti MetroWestEconomicResearchCenter FraminghamStateUniversity 100StateStreet Framingham,MA01701-9101