SlideShare a Scribd company logo
1 of 4
Download to read offline
Global Economy Watch
Economic integration: the key to unlocking
ASEAN’s export potential?
Fig 1: ASEAN is the world’s fourth largest trading bloc in terms of GDP, with a value of $2.7
trillion. ASEAN is behind only NAFTA, the EU, and MERCOSUR.
Visit our blog for periodic updates at:
pwc.blogs.com/economics_in_business
Kind regards
Barret Kupelian
PwC | Senior Economist
October 2017
Sources: PwC analysis, IMF
$0.8 tn
$2.7 tn
$2.9 tn
$16 tn
$22 tn
$0 $5 $10 $15 $20 $25
Gross domestic product at current prices (2017 estimate), USD trillion
NAFTA
(North America)
EU
(European Union)
MERCOSUR
(Argentina, Brazil,
Paraguay, Uruguay)
AFTA
(ASEAN)
COMESA
(Eastern & Southern
Africa)
Dear readers,
When discussing the state of the global economy, a
key theme has been the slow-down in world trade
growth in recent years. However, one part of the
world is defying this trend—South East Asia.
In November, South East Asia will be at the front of
the global economic stage, when both the Asia-
Pacific Economic Cooperation (APEC) and the
Association of South East Asian Nations (ASEAN)
meet. Since its formation in 1967, ASEAN has
facilitated several free trade agreements which have
seen the region’s nations become increasingly
integrated, as they work towards the free movement
of goods and skilled labour.
In this edition, we have looked in more detail at the
ASEAN nations, and how further economic
integration could expand their intra-regional export
market. Our analysis shows that:
• The region is well suited to export expansion,
given its strong and consistent output growth
and its vast working age population. Supporting
this, our upcoming APEC survey to be released
in November shows over 88% of ASEAN
respondents were confident of revenue growth
over the next 12 months.
• ASEAN intra-regional export volumes are on
course to grow from $330 billion currently to
$375 by 2025 (1.5% p/annum growth rate). If,
for illustrative purposes, the implementation of
‘Blueprint 2025’ led to a 1pp increase in the
growth rate, intra-ASEAN exports could reach
$410 billion. Achieving growth of near this order
is dependent upon further trade liberalisation.
We don’t expect this expansion to be uniform—as
some of the less developed economies within the
ASEAN bloc and those that are more specialised in
services exports are better placed to grow their
export share. To maximise their own trade volumes,
ASEAN exporters could target these higher growth
potential markets.
In our economic update, we present the results of
our ‘nowcasting’ model for the US economy which
was constructed using the same approach as for the
UK GDP nowcasting model set out in our July UK
Economic Outlook. For the US, we project GDP to
expand by 2.2% this year, faster than the 1.5%
growth registered last year but still relatively modest
by pre-crisis standards.
Finally this month we have looked at the economics
of natural disasters, which tragically have been all
too frequent recently. Our analysis shows that such
disasters do appear to be occurring more often on
average since the late 1990s than in earlier decades,
although their impact can sometimes be mitigated to
a degree now by preventative measures such as
better early warning systems.
Fig 2: In 2017 we project real GDP growth of 2.2%
Sources: PwC analysis
Economic update: US data points to gradual Fed
tightening
Unfortunately, natural disasters are back in the
spotlight and these events are above all human
tragedies. However, they also tend to disrupt
households, businesses and governments, and
some can have macroeconomic effects.
The latest data from the Centre for Research on
the Epidemiology of Disasters (CRED)
estimates there were 348 natural disasters1 in
2016 that cost approximately $150 billion2 in
total. This sum is a very partial measure of cost,
as it does not quantify loss of life or revenue as a
result of natural disasters. Subject to these
limitations, we deflated this data to get a picture
of real costs over time (Figure 3). We should be
cautious about putting too much weight on
precise conclusions from this, due to the
volatility of costs and the unique nature of
natural disasters. However there has been a
gradual upward trend in both the number and
total real cost of natural disasters since the
1970s – what are the key factors behind these
trends?
The megatrends of climate change,
urbanisation and technology play a
role…
NASA estimates 16 out of the 17 warmest years
in the last 136 years have all occurred since
20013. A warmer atmosphere will have a higher
average moisture content, creating the potential
for more extreme precipitation events. The Paris
Climate Agreement seeks to co-ordinate
government commitments and action to limit
global warming to below two degrees. PwC
analysis in the Low Carbon Economy Index
shows while record progress has been made, it
still falls short of the rapid reductions needed to
achieve the two degree goal.
Second, urbanisation and rapid population
growth have pushed around one quarter of the
world’s population to live in areas classified as
high risk from natural disasters4. This problem
is particularly acute in less developed
economies, where the reward of higher salaries
in high-risk urban areas is often judged to
outweigh the risk of living in a high-risk area.
Finally, some of this increase may be “artificial”,
as enhanced communication networks and
technological advances have enabled scientists
to notice natural disasters more frequently than
in the past.
…but preventative measures have helped
to mitigate some of the costs of disasters
Taken at face value, Figure 3 implies the cost of
physical damage per natural disaster has fallen
by around a third in real terms since 1970.
Again, we should be cautious about putting too
much weight on precise estimates, however a
plausible explanation for this apparent trend is
that enhanced preventative measures have
helped to limit costs. These range from early
warning systems, which detect weather patterns
that lead to hurricanes and tornadoes at a more
localised level, to planning laws that encourage
maintaining wetlands in flood prone areas to
absorb excess water.
On a regional level, the destruction of tangible
assets leads to a deterioration in productive
capacity, while consumer spending on non-
essential items generally falls in the immediate
aftermath of a disaster. However at a macro
level, academic evidence is mixed as to the net
impact on GDP growth. For example, rebuilding
efforts can offset the loss of assets and an influx
of aid can help restore production, so leading
any initial drop in GDP due to the disaster to be
reversed relatively quickly.
However, while output as measured by GDP
may not be significantly impacted beyond the
short term, natural disasters cause devastation
for those affected and may be becoming more
prevalent for the reasons discussed above.
Significant investment in increasing the risk-
resilience of infrastructure and our ability to
manage the impacts of extreme events is
therefore also becoming an increasing priority
for governments and business.
1 For a disaster to be recorded, one of the following criteria must be
met: 10 people reported killed, 100 people report affected,
declaration of a state of emergency or a call for international
assistance is made. 2 Cost of damage was deflated using World Bank
data, and is measured in 2016 USD throughout (i.e. excluding the
impact of general price inflation). 3 NASA Global Climate Change
Facts, 2016. 4 World Bank, Natural Disaster Hotspots, 2005.
Natural disasters are occurring more often, but how much do they cost?
Sources: PwC analysis, CRED, World Bank
Fig 3: The real cost of damages from natural
disasters is increasing
0
100
200
300
400
500
0
200
400
600
1970 1980 1990 2000 2010
Economicdamage,2016
USDbillions
No.ofnaturaldisastersper
year
No. of natural disasters (LHS)
Natural disasters economic damage (RHS)
0%
1%
2%
3%
4%
2012 2013 2014 2015 2016 2017
RealUSGDPgrowthp/annum,percentage
GDP growth Out of sample model prediction
Reasonable outlook for the US for remainder of year
Building on the UK GDP nowcasting model published in our July UK Economic
Outlook, we have built a US GDP nowcasting model. This follows the same basic
machine learning principles as the UK model and, as before, we have tested the
historic accuracy of the US model, which has performed well in predicting actual
GDP growth for the past five years based on data available at the time (see Figure
2).
Our nowcasting model suggests that the US economy is on track to grow by 2.2%
this year, slightly below the median GDP growth forecast of the Federal Reserve.
This implies average quarter-on-quarter growth of about 0.5% (2% annualised) in
the second half of 2017, although this could be temporarily affected by the recent
hurricanes. Survey data also confirms the buoyant nature of the US labour market,
with a recent National Federation of Small Business (NFSB) survey reporting that
finding qualified labour is now the single most important business problem in the
US.
Fed prepares to raise rates again … but fiscal policy remains uncertain
However, what businesses are currently monitoring is the policymaking
environment in the US. September saw the Federal Reserve outline its plans in
detail on the form of future monetary tightening, including the planned reduction
of its balance sheet. As regards interest rates, the Fed’s updated median
projections indicate another rate hike by the end of the year (but this should be of
less concern to business as it is well signposted).
The key area of focus in the next few months will be on fiscal policy. More
specifically, what form the proposed corporate tax cuts will take, if indeed they can
be passed through Congress.
0 5 10
Average real GDP growth per annum, %
2000-09 2010-16
This year marks the 50th anniversary of the establishment of ASEAN. Since its formation
it has expanded to ten countries (as listed in Figure 6) and total ASEAN GDP has
expanded from 1% to 3.4% of global output1. If it were a single country, ASEAN would be
the world’s seventh largest economy, with a GDP of around $2.7 trillion2, and the third
most populous area of the world with around 635 million people, of which over 430
million are of working age.
In 2015, the ASEAN Economic Community (AEC) formally launched and adopted
Blueprint 2025. This outlines their strategy to achieve a ‘deeply integrated and highly
cohesive’ economy, a single market allowing the free movement of goods and people.
And there has been already been great progress on this – in 2016, for example, 96% of
tariff lines on intra-regional trade were zero. This November, the Philippines will host
the 31st ASEAN summit where furthering regional integration is top of the agenda. So
how well equipped is ASEAN to further integrate its economies?
Strong and stable growth in the ASEAN economies should benefit
regional trade
A key challenge for any business is planning ahead. Prospective exporters face the
additional challenge of planning for business cycle fluctuations in foreign markets,
which can disrupt revenue flows. The average ASEAN GDP-weighted growth rate since
2000 has been 5.2% per annum - this is notable not just because it is faster than the
global average of 3.8% per annum3, but also because of its stability.
Specifically, when we compare the standard deviations of GDP growth across high-
growth regions since 2000, ASEAN compares favourably. Sub-Saharan Africa came
narrowly second, while the Emerging Markets, China and the Middle East & North Africa
were all more turbulent. For example, Figure 4 shows how little difference there was in
average ASEAN output growth between 2000-09 and 2010-16 – it’s worth noting this
was a period encompassing the Global, but not the Asian, Financial Crisis.
Given its stable footing, how large could intra-regional ASEAN trade grow by 2025?
Intra-ASEAN trade could reach between $375 and $410 billion by 2025
Exports in the ASEAN economies are growing, but not as fast as GDP – the compound
annual growth rates since 2010 were 2.9% and 4.9% respectively. In 2016, total exports
from ASEAN countries accounted for 7% of global exports, or $1.1 trillion. This total
contribution was behind only the EU (24%), US (13%) and China (9%)4. However intra-
regional trade is a markedly smaller market than this - in 2016, intra-ASEAN exports
were valued at only just over $330 billion. For context, the EU’s single market saw $3.4
trillion of exports within its borders.
Assuming the current rate of post-crisis growth continues, we project intra-ASEAN
exports could surpass $375 billion by 2025. However, various academic studies show
that single market access has a positive effect on intra-trade volumes, in some cases by
up to 115% in the long run5. Therefore if, for purely illustrative purposes, we assume an
acceleration to the tune of 1 percentage point per year due to the implementation of
Blueprint 2025 – intra-ASEAN export volumes could reach $410 billion, as shown in
Figure 5.
These overall estimates for ASEAN disguise significant heterogeneity across sectors and
countries. For example, the data shows that intra-regional services exports have been
growing almost 4 pp per year faster than goods exports since the financial crisis.
Likewise, the relatively less developed economies of Myanmar and Vietnam have seen
double digit intra-regional export growth, while Singapore and Malaysia have
experienced slower growth per annum.
Diversification is needed for evenly distributed benefits across ASEAN
This heterogeneity becomes even more apparent when we breakdown individual ASEAN
nation’s total exports. As a whole, ASEAN is a net exporter and the majority of exports
are goods - but which nations are most likely to benefit from the high export growth
potential in services sectors? Cambodia and the Philippines were the only nations where
services comprised over 30% of total exports (see Figure 6). Travel and business services
provided the majority of service exports for Cambodia and the Philippines respectively.
When we look at the change in services exports since 2010, we can see which countries
have made the most progress towards diversifying away from goods exports. Myanmar
(25%) and Thailand (23%) made the largest moves (from 4% and 15% respectively).
ASEAN as a whole has increased its share of services exports by 5 percentage points to
22% - and continuing to focus on service exports should keep it well positioned in the
global economy for years to come.
The ASEAN region is culturally, linguistically and politically diverse. Therefore any
integration needs to be highly customised, while common interests need to be identified
and exploited. Although integration is still relatively limited in comparison to the EU,
things are moving forward. If ASEAN policymakers can implement Blueprint 2025, the
removal of barriers to further integration could see ASEAN become an even more
significant global market.
1 World Bank, market exchange rates. 2 2017 estimate, current prices. 3 At market exchange rates. 4 IMF Direction of
Trade Statistics, Value of Good exports, 2017. 5 “EU membership boosts intra-EU trade by 115% relative to a position
of WTO membership” HM Treasury, 2016.
Economic integration: the key to unlocking
ASEAN’s export potential?
Fig 4: ASEAN economic growth has proven consistently
strong
Fig 5: ASEAN is on course to surpass $375 billion of
intra-regional trade by 2025
Fig 6: Mineral & Chemical products, and Metals,
Machinery & Transport dominate ASEAN exports
Sources: PwC analysis, IMF
Sources: PwC analysis, ASEANstats
ASEAN 10*
Emerging
Markets
Sub-Saharan
Africa
US
China
EU
World
0
100
200
300
400
500
600
700
2007 2017 2027 2037
Volumeofintra-ASEANexports,
USDbillions
Projections
Main scenario
Strong growth
(1pp above trend)
1 2 3 4 5 6
Brunei 0.2 84 5 1 3 7
Cambodia 3 50 13 3 22 9
Indonesia 18 42 24 2 7 7
Lao PDR 24 30 24 1 18 3
Malaysia 9 26 44 5 8 8
Myanmar 29 34 11 1 14 10
Philippines 6 12 43 4 6 30
Singapore 2 37 32 6 3 21
Thailand 11 19 44 3 17 6
Vietnam 12 25 49 7 4 2
ASEAN 10 9 24 40 5 8 14
Goods
1 Animal &
Foodstuffs
2 Mineral &
Chemical
Products
3 Metals,
Machinery and
Transport
4 Other
Services
5 Travel
6 Other
Composition of total exports in 2016, %
Red < 10% Orange 10%-25%, Green 25%+
*GDP weighted growth
2017 GDP,
USD tn.
$11.8
$2.7
$31.1
$1.5
$78.0
$19.4
$16.1
Share of 2016 world GDP
PPP MER 2017p 2018p 2019-2023p 2017p 2018p 2019-2023p
Global (Market Exchange Rates) 100.0% 3.0 2.9 3.0 2.5 2.4 2.5
Global (PPP rates) 100.0% 3.6 3.5 3.6 2.4 2.7 2.7
G7 31.0% 47.1% 1.9 1.8 1.9 1.8 1.8 1.8
E7 36.9% 25.8% 5.3 5.2 5.1 3.2 3.3 3.6
United States 15.5% 24.7% 2.2 2.2 2.3 2.2 2.1 2.0
China 17.8% 14.9% 6.6 6.2 5.7 2.0 2.2 2.8
Japan 4.4% 6.6% 1.2 0.7 0.8 0.5 0.9 1.5
United Kingdom 2.3% 3.5% 1.5 1.4 2.0 2.7 2.7 2.2
Eurozone 10.4% 13.9% 2.0 1.7 1.5 1.4 1.4 1.4
France 2.3% 3.3% 1.6 1.6 1.6 1.0 1.2 1.2
Germany 3.3% 4.6% 1.9 1.7 1.4 1.8 1.7 1.7
Greece 0.2% 0.3% 0.7 1.7 1.8 1.1 1.1 1.1
Ireland 0.3% 0.4% 4.3 3.4 2.6 0.4 0.9 1.5
Italy 1.9% 2.5% 1.2 1.1 1.2 1.2 1.2 1.4
Netherlands 0.7% 1.0% 2.8 2.1 1.8 1.4 1.5 1.3
Portugal 0.2% 0.3% 2.6 1.8 1.1 1.6 1.5 1.4
Spain 1.4% 1.6% 3.1 2.3 2.0 1.8 1.2 1.2
Poland 0.9% 0.6% 3.4 3.3 3.5 1.8 2.0 2.4
Russia 3.2% 1.7% 1.3 1.4 1.5 4.2 4.0 4.0
Turkey 1.7% 1.1% 4.1 3.2 3.4 10.0 8.1 7.0
Australia 1.0% 1.7% 2.7 2.8 2.7 1.9 2.3 2.5
India 7.2% 3.0% 6.9 7.4 7.7 3.6 5.0 5.0
Indonesia 2.5% 1.2% 5.1 5.3 5.4 4.2 4.6 5.1
South Korea 1.6% 1.9% 2.9 3.0 3.0 2.2 2.5 2.7
Argentina 0.7% 0.7% 2.6 2.8 3.0 25.0 - -
Brazil 2.6% 2.4% 0.5 1.7 2.6 4.0 4.5 4.5
Canada 1.4% 2.0% 2.4 1.9 2.2 1.9 1.8 2.0
Mexico 1.9% 1.4% 1.8 1.9 3.0 5.4 3.5 3.0
South Africa 0.6% 0.4% 0.8 1.2 3.0 6.1 5.8 5.5
Nigeria 0.9% 0.5% 0.7 1.8 4.2 15.0 14.1 12.0
Saudi Arabia 1.5% 0.8% 0.8 1.5 3.5 3.5 4.8 2.5
Real GDP growth Inflation
Projections: October 2017
Interest rate outlook of major economies
Current rate (Last change) Expectation Next meeting
Federal Reserve 1.25% (June 2017) Further gradual tightening in the next two quarters 31 October – 1 November
European Central Bank 0.00% (March 2016) No rate rise for the foreseeable future 26 October
Bank of England 0.25% (August 2016) Rates could increase within next few months 2 November
This publication has been prepared for general guidance on matters of interest only, and does not constitute professional advice. You should not act upon the information contained in this
publication without obtaining specific professional advice. No representation or warranty (express or implied) is given as to the accuracy or completeness of the information contained in this
publication, and, to the extent permitted by law, PricewaterhouseCoopers LLP, its members, employees and agents do not accept or assume any liability, responsibility or duty of care for any
consequences of you or anyone else acting, or refraining to act, in reliance on the information contained in this publication or for any decision based on it.
© 2017 PricewaterhouseCoopers LLP. All rights reserved. In this document, “PwC” refers to the UK member firm, and may sometimes refer to the PwC network. Each member firm is a separate
legal entity. Please see www.pwc.com/structure for further details.
We help you understand how big economic, demographic, social, and environmental changes affect your organisation by setting
out scenarios that identify growth opportunities and risks on a global, regional, national and local level. We help make strategic
and tactical operational, pricing and investment decisions to support business value creation. We work together with you to
achieve sustainable growth. Do get in contact with one of the team if you would like to discuss any of these topics.
Sources: PwC analysis, National statistical authorities, Datastream and IMF. All inflation indicators relate to the Consumer Price Index (CPI). Argentina has
recently launched a new CPI measure, which only contains data from April 2016. Therefore we only project inflation for 2017, and will provide 2018 and 2019-2023
projections once a longer series is available. Note that the tables above form our main scenario projections and are therefore subject to considerable uncertainties. We
recommend that our clients look at a range of alternative scenarios.
Barret Kupelian
T: + 44 (0) 20 7213 1579
E: barret.g.kupelian@pwc.com
Chart of the month
Beijing’s currency support
and crackdown on outflow
channels seems to be
working. Net capital inflows
to the country turned positive
in the first half of this year.
Compared to a $420 billion
deficit in 2016, China ran a
$16 billion surplus in H1
2017.
Source: FT, CEIC
Net capital inflows to China turned positive in H1
2017
James Loughridge
T: +44 (0) 780 266 0106
E: james.r.loughridge@pwc.com
Balanceofpaymentsoutflowsand
inflows(excl.centralbank
intervention),USDbillions
-250
-150
-50
50
150
2015 2016 2017

More Related Content

What's hot

Macro Strategy Review Summary Jan 2014-Aug 2015
Macro Strategy Review Summary Jan 2014-Aug 2015Macro Strategy Review Summary Jan 2014-Aug 2015
Macro Strategy Review Summary Jan 2014-Aug 2015Jim Welsh
 
Financial Globalization_Executive_Summary_2013
Financial Globalization_Executive_Summary_2013Financial Globalization_Executive_Summary_2013
Financial Globalization_Executive_Summary_2013BURESI
 
Fixed Income Market Update (4-30-10)
Fixed Income Market Update (4-30-10)Fixed Income Market Update (4-30-10)
Fixed Income Market Update (4-30-10)Michael Matthews
 
Ivo Pezzuto - "FED BITES THE BULLET - Implements First Rate Hike in Nearly a ...
Ivo Pezzuto - "FED BITES THE BULLET - Implements First Rate Hike in Nearly a ...Ivo Pezzuto - "FED BITES THE BULLET - Implements First Rate Hike in Nearly a ...
Ivo Pezzuto - "FED BITES THE BULLET - Implements First Rate Hike in Nearly a ...Dr. Ivo Pezzuto
 
PwC Global Economy Watch (oct. 2013)
PwC Global Economy Watch (oct. 2013)PwC Global Economy Watch (oct. 2013)
PwC Global Economy Watch (oct. 2013)PwC France
 
Gi French Connection
Gi French ConnectionGi French Connection
Gi French ConnectionDavid Apted
 
European Economy Report
European Economy ReportEuropean Economy Report
European Economy Reportdrramya
 
Economic Indicators for Week of September 27-October 1, 2010
Economic Indicators for Week of September 27-October 1, 2010Economic Indicators for Week of September 27-October 1, 2010
Economic Indicators for Week of September 27-October 1, 2010NAR Research
 
Contemplating Covid 19 Economic Recovery and a Market Performance Comparison ...
Contemplating Covid 19 Economic Recovery and a Market Performance Comparison ...Contemplating Covid 19 Economic Recovery and a Market Performance Comparison ...
Contemplating Covid 19 Economic Recovery and a Market Performance Comparison ...Niraj Singhvi
 
OECD Global Interim Economic Outlook February 2016 presentation
OECD Global Interim Economic Outlook February 2016 presentationOECD Global Interim Economic Outlook February 2016 presentation
OECD Global Interim Economic Outlook February 2016 presentationOECD, Economics Department
 
Viability of Nigeria State Governments Independent of Statutory Allocations: ...
Viability of Nigeria State Governments Independent of Statutory Allocations: ...Viability of Nigeria State Governments Independent of Statutory Allocations: ...
Viability of Nigeria State Governments Independent of Statutory Allocations: ...paperpublications3
 
The saturday economist 18th august
The saturday economist 18th augustThe saturday economist 18th august
The saturday economist 18th augustJohn Ashcroft
 
Global Wage Report 2012/13 Executive Summary
Global Wage Report 2012/13 Executive SummaryGlobal Wage Report 2012/13 Executive Summary
Global Wage Report 2012/13 Executive SummaryDr Lendy Spires
 
Esri Trend Analysis: 2010–2015
Esri Trend Analysis: 2010–2015Esri Trend Analysis: 2010–2015
Esri Trend Analysis: 2010–2015Esri
 

What's hot (19)

Macro Strategy Review Summary Jan 2014-Aug 2015
Macro Strategy Review Summary Jan 2014-Aug 2015Macro Strategy Review Summary Jan 2014-Aug 2015
Macro Strategy Review Summary Jan 2014-Aug 2015
 
Financial Globalization_Executive_Summary_2013
Financial Globalization_Executive_Summary_2013Financial Globalization_Executive_Summary_2013
Financial Globalization_Executive_Summary_2013
 
Fixed Income Market Update (4-30-10)
Fixed Income Market Update (4-30-10)Fixed Income Market Update (4-30-10)
Fixed Income Market Update (4-30-10)
 
Ivo Pezzuto - "FED BITES THE BULLET - Implements First Rate Hike in Nearly a ...
Ivo Pezzuto - "FED BITES THE BULLET - Implements First Rate Hike in Nearly a ...Ivo Pezzuto - "FED BITES THE BULLET - Implements First Rate Hike in Nearly a ...
Ivo Pezzuto - "FED BITES THE BULLET - Implements First Rate Hike in Nearly a ...
 
PwC Global Economy Watch (oct. 2013)
PwC Global Economy Watch (oct. 2013)PwC Global Economy Watch (oct. 2013)
PwC Global Economy Watch (oct. 2013)
 
Gi French Connection
Gi French ConnectionGi French Connection
Gi French Connection
 
Coming Soon April 2016
Coming Soon April 2016Coming Soon April 2016
Coming Soon April 2016
 
European Economy Report
European Economy ReportEuropean Economy Report
European Economy Report
 
Economic Indicators for Week of September 27-October 1, 2010
Economic Indicators for Week of September 27-October 1, 2010Economic Indicators for Week of September 27-October 1, 2010
Economic Indicators for Week of September 27-October 1, 2010
 
Georgia business brokers 3 28-17
Georgia business brokers 3 28-17Georgia business brokers 3 28-17
Georgia business brokers 3 28-17
 
Contemplating Covid 19 Economic Recovery and a Market Performance Comparison ...
Contemplating Covid 19 Economic Recovery and a Market Performance Comparison ...Contemplating Covid 19 Economic Recovery and a Market Performance Comparison ...
Contemplating Covid 19 Economic Recovery and a Market Performance Comparison ...
 
OECD Global Interim Economic Outlook February 2016 presentation
OECD Global Interim Economic Outlook February 2016 presentationOECD Global Interim Economic Outlook February 2016 presentation
OECD Global Interim Economic Outlook February 2016 presentation
 
Viability of Nigeria State Governments Independent of Statutory Allocations: ...
Viability of Nigeria State Governments Independent of Statutory Allocations: ...Viability of Nigeria State Governments Independent of Statutory Allocations: ...
Viability of Nigeria State Governments Independent of Statutory Allocations: ...
 
FNB
FNBFNB
FNB
 
Covid-19 and Fiscal Policy
Covid-19 and Fiscal Policy Covid-19 and Fiscal Policy
Covid-19 and Fiscal Policy
 
The saturday economist 18th august
The saturday economist 18th augustThe saturday economist 18th august
The saturday economist 18th august
 
Report march 2020
Report march 2020Report march 2020
Report march 2020
 
Global Wage Report 2012/13 Executive Summary
Global Wage Report 2012/13 Executive SummaryGlobal Wage Report 2012/13 Executive Summary
Global Wage Report 2012/13 Executive Summary
 
Esri Trend Analysis: 2010–2015
Esri Trend Analysis: 2010–2015Esri Trend Analysis: 2010–2015
Esri Trend Analysis: 2010–2015
 

Similar to Economic integration: the key to unlocking ASEAN’s export potential?

Bain brief 8_macrotrends
Bain brief 8_macrotrendsBain brief 8_macrotrends
Bain brief 8_macrotrendsvrajesh1
 
Bain brief 8_macrotrends
Bain brief 8_macrotrendsBain brief 8_macrotrends
Bain brief 8_macrotrendsLance Conn
 
Economic Volatility: How Covid-19 is Affecting Our Communities
Economic Volatility: How Covid-19 is Affecting Our CommunitiesEconomic Volatility: How Covid-19 is Affecting Our Communities
Economic Volatility: How Covid-19 is Affecting Our CommunitiesNicolasMontenegro13
 
Global economy-watch-may-2015
Global economy-watch-may-2015Global economy-watch-may-2015
Global economy-watch-may-2015PwC España
 
Etude PwC Global Economy Watch (mai 2015)
Etude PwC Global Economy Watch (mai 2015)Etude PwC Global Economy Watch (mai 2015)
Etude PwC Global Economy Watch (mai 2015)PwC France
 
Where's the money going
Where's the money going Where's the money going
Where's the money going TariqCarrimjee
 
Articles
ArticlesArticles
ArticlesSHK
 
global-wealth-report-2020-en.pdf
global-wealth-report-2020-en.pdfglobal-wealth-report-2020-en.pdf
global-wealth-report-2020-en.pdfShreeram Rane
 
Group m tyny global forecast
Group m tyny global forecastGroup m tyny global forecast
Group m tyny global forecastSocial Samosa
 
This Year, Next Year: Global Mid-Year Forecast Report
This Year, Next Year: Global Mid-Year Forecast ReportThis Year, Next Year: Global Mid-Year Forecast Report
This Year, Next Year: Global Mid-Year Forecast ReportHarsha MV
 
The Adam Smith Plan to Save Markets and the Climate: The Climate is Too Big t...
The Adam Smith Plan to Save Markets and the Climate: The Climate is Too Big t...The Adam Smith Plan to Save Markets and the Climate: The Climate is Too Big t...
The Adam Smith Plan to Save Markets and the Climate: The Climate is Too Big t...Nancy Skinner
 
Swiss Re sigma 3/2019: World insurance: the great pivot east continues
Swiss Re sigma 3/2019: World insurance: the great pivot east continuesSwiss Re sigma 3/2019: World insurance: the great pivot east continues
Swiss Re sigma 3/2019: World insurance: the great pivot east continuesΔρ. Γιώργος K. Κασάπης
 
The Impact of Covid-19 Outbreak on World GDP
The Impact of Covid-19 Outbreak on World GDPThe Impact of Covid-19 Outbreak on World GDP
The Impact of Covid-19 Outbreak on World GDPIRJET Journal
 
Prezentācija "Globālās ekonomikas tendences"
Prezentācija "Globālās ekonomikas tendences"Prezentācija "Globālās ekonomikas tendences"
Prezentācija "Globālās ekonomikas tendences"Latvijas Banka
 
The New Normal (with Covid-19) from here on
The New Normal (with Covid-19) from here onThe New Normal (with Covid-19) from here on
The New Normal (with Covid-19) from here onAmalist Client Services
 
Our new-world - Mary Meeker and BOND report on COVID19
Our new-world - Mary Meeker and BOND report on COVID19Our new-world - Mary Meeker and BOND report on COVID19
Our new-world - Mary Meeker and BOND report on COVID19Uri Goren
 

Similar to Economic integration: the key to unlocking ASEAN’s export potential? (20)

Johnson Fall JP final
Johnson Fall JP finalJohnson Fall JP final
Johnson Fall JP final
 
Activity 4.4
Activity 4.4Activity 4.4
Activity 4.4
 
Bain brief 8_macrotrends
Bain brief 8_macrotrendsBain brief 8_macrotrends
Bain brief 8_macrotrends
 
Bain brief 8_macrotrends
Bain brief 8_macrotrendsBain brief 8_macrotrends
Bain brief 8_macrotrends
 
Economic Volatility: How Covid-19 is Affecting Our Communities
Economic Volatility: How Covid-19 is Affecting Our CommunitiesEconomic Volatility: How Covid-19 is Affecting Our Communities
Economic Volatility: How Covid-19 is Affecting Our Communities
 
Global economy-watch-may-2015
Global economy-watch-may-2015Global economy-watch-may-2015
Global economy-watch-may-2015
 
Etude PwC Global Economy Watch (mai 2015)
Etude PwC Global Economy Watch (mai 2015)Etude PwC Global Economy Watch (mai 2015)
Etude PwC Global Economy Watch (mai 2015)
 
Where's the money going
Where's the money going Where's the money going
Where's the money going
 
Articles
ArticlesArticles
Articles
 
global-wealth-report-2020-en.pdf
global-wealth-report-2020-en.pdfglobal-wealth-report-2020-en.pdf
global-wealth-report-2020-en.pdf
 
Argentina final
Argentina finalArgentina final
Argentina final
 
Group m tyny global forecast
Group m tyny global forecastGroup m tyny global forecast
Group m tyny global forecast
 
This Year, Next Year: Global Mid-Year Forecast Report
This Year, Next Year: Global Mid-Year Forecast ReportThis Year, Next Year: Global Mid-Year Forecast Report
This Year, Next Year: Global Mid-Year Forecast Report
 
The Adam Smith Plan to Save Markets and the Climate: The Climate is Too Big t...
The Adam Smith Plan to Save Markets and the Climate: The Climate is Too Big t...The Adam Smith Plan to Save Markets and the Climate: The Climate is Too Big t...
The Adam Smith Plan to Save Markets and the Climate: The Climate is Too Big t...
 
Presentation
PresentationPresentation
Presentation
 
Swiss Re sigma 3/2019: World insurance: the great pivot east continues
Swiss Re sigma 3/2019: World insurance: the great pivot east continuesSwiss Re sigma 3/2019: World insurance: the great pivot east continues
Swiss Re sigma 3/2019: World insurance: the great pivot east continues
 
The Impact of Covid-19 Outbreak on World GDP
The Impact of Covid-19 Outbreak on World GDPThe Impact of Covid-19 Outbreak on World GDP
The Impact of Covid-19 Outbreak on World GDP
 
Prezentācija "Globālās ekonomikas tendences"
Prezentācija "Globālās ekonomikas tendences"Prezentācija "Globālās ekonomikas tendences"
Prezentācija "Globālās ekonomikas tendences"
 
The New Normal (with Covid-19) from here on
The New Normal (with Covid-19) from here onThe New Normal (with Covid-19) from here on
The New Normal (with Covid-19) from here on
 
Our new-world - Mary Meeker and BOND report on COVID19
Our new-world - Mary Meeker and BOND report on COVID19Our new-world - Mary Meeker and BOND report on COVID19
Our new-world - Mary Meeker and BOND report on COVID19
 

Recently uploaded

cost-volume-profit analysis.ppt(managerial accounting).pptx
cost-volume-profit analysis.ppt(managerial accounting).pptxcost-volume-profit analysis.ppt(managerial accounting).pptx
cost-volume-profit analysis.ppt(managerial accounting).pptxazadalisthp2020i
 
Black magic specialist in Saudi Arabia (Kala jadu expert in UK) Bangali Amil ...
Black magic specialist in Saudi Arabia (Kala jadu expert in UK) Bangali Amil ...Black magic specialist in Saudi Arabia (Kala jadu expert in UK) Bangali Amil ...
Black magic specialist in Saudi Arabia (Kala jadu expert in UK) Bangali Amil ...batoole333
 
Strategic Resources May 2024 Corporate Presentation
Strategic Resources May 2024 Corporate PresentationStrategic Resources May 2024 Corporate Presentation
Strategic Resources May 2024 Corporate PresentationAdnet Communications
 
20240419-SMC-submission-Annual-Superannuation-Performance-Test-–-design-optio...
20240419-SMC-submission-Annual-Superannuation-Performance-Test-–-design-optio...20240419-SMC-submission-Annual-Superannuation-Performance-Test-–-design-optio...
20240419-SMC-submission-Annual-Superannuation-Performance-Test-–-design-optio...Henry Tapper
 
Famous Kala Jadu, Kala ilam specialist in USA and Bangali Amil baba in Saudi ...
Famous Kala Jadu, Kala ilam specialist in USA and Bangali Amil baba in Saudi ...Famous Kala Jadu, Kala ilam specialist in USA and Bangali Amil baba in Saudi ...
Famous Kala Jadu, Kala ilam specialist in USA and Bangali Amil baba in Saudi ...mazhshah570
 
Webinar on E-Invoicing for Fintech Belgium
Webinar on E-Invoicing for Fintech BelgiumWebinar on E-Invoicing for Fintech Belgium
Webinar on E-Invoicing for Fintech BelgiumFinTech Belgium
 
Collecting banker, Capacity of collecting Banker, conditions under section 13...
Collecting banker, Capacity of collecting Banker, conditions under section 13...Collecting banker, Capacity of collecting Banker, conditions under section 13...
Collecting banker, Capacity of collecting Banker, conditions under section 13...RaniT11
 
Test bank for advanced assessment interpreting findings and formulating diffe...
Test bank for advanced assessment interpreting findings and formulating diffe...Test bank for advanced assessment interpreting findings and formulating diffe...
Test bank for advanced assessment interpreting findings and formulating diffe...robinsonayot
 
Abhay Bhutada: Driving Digital Transformation in NBFC Sector
Abhay Bhutada: Driving Digital Transformation in NBFC SectorAbhay Bhutada: Driving Digital Transformation in NBFC Sector
Abhay Bhutada: Driving Digital Transformation in NBFC Sectornickysharmasucks
 
Production and Cost of the firm with curves
Production and Cost of the firm with curvesProduction and Cost of the firm with curves
Production and Cost of the firm with curvesArifa Saeed
 
Solution Manual For Financial Statement Analysis, 13th Edition By Charles H. ...
Solution Manual For Financial Statement Analysis, 13th Edition By Charles H. ...Solution Manual For Financial Statement Analysis, 13th Edition By Charles H. ...
Solution Manual For Financial Statement Analysis, 13th Edition By Charles H. ...rightmanforbloodline
 
amil baba in australia amil baba in canada amil baba in london amil baba in g...
amil baba in australia amil baba in canada amil baba in london amil baba in g...amil baba in australia amil baba in canada amil baba in london amil baba in g...
amil baba in australia amil baba in canada amil baba in london amil baba in g...israjan914
 
Current scenario of Energy Retail utilities market in UK
Current scenario of Energy Retail utilities market in UKCurrent scenario of Energy Retail utilities market in UK
Current scenario of Energy Retail utilities market in UKParas Gupta
 
Black magic specialist in Canada (Kala ilam specialist in UK) Bangali Amil ba...
Black magic specialist in Canada (Kala ilam specialist in UK) Bangali Amil ba...Black magic specialist in Canada (Kala ilam specialist in UK) Bangali Amil ba...
Black magic specialist in Canada (Kala ilam specialist in UK) Bangali Amil ba...batoole333
 
najoomi asli amil baba kala jadu expert rawalpindi bangladesh uk usa
najoomi asli amil baba kala jadu expert rawalpindi bangladesh uk usanajoomi asli amil baba kala jadu expert rawalpindi bangladesh uk usa
najoomi asli amil baba kala jadu expert rawalpindi bangladesh uk usabatoole333
 
Benefits & Risk Of Stock Loans
Benefits & Risk Of Stock LoansBenefits & Risk Of Stock Loans
Benefits & Risk Of Stock LoansMartinRowse
 
najoomi asli amil baba kala jadu expert rawalpindi bangladesh uk usa
najoomi asli amil baba kala jadu expert rawalpindi bangladesh uk usanajoomi asli amil baba kala jadu expert rawalpindi bangladesh uk usa
najoomi asli amil baba kala jadu expert rawalpindi bangladesh uk usamazhshah570
 
GIFT City Overview India's Gateway to Global Finance
GIFT City Overview  India's Gateway to Global FinanceGIFT City Overview  India's Gateway to Global Finance
GIFT City Overview India's Gateway to Global FinanceGaurav Kanudawala
 

Recently uploaded (20)

Obat Penggugur Kandungan Aman Bagi Ibu Menyusui 087776558899
Obat Penggugur Kandungan Aman Bagi Ibu Menyusui  087776558899Obat Penggugur Kandungan Aman Bagi Ibu Menyusui  087776558899
Obat Penggugur Kandungan Aman Bagi Ibu Menyusui 087776558899
 
cost-volume-profit analysis.ppt(managerial accounting).pptx
cost-volume-profit analysis.ppt(managerial accounting).pptxcost-volume-profit analysis.ppt(managerial accounting).pptx
cost-volume-profit analysis.ppt(managerial accounting).pptx
 
Black magic specialist in Saudi Arabia (Kala jadu expert in UK) Bangali Amil ...
Black magic specialist in Saudi Arabia (Kala jadu expert in UK) Bangali Amil ...Black magic specialist in Saudi Arabia (Kala jadu expert in UK) Bangali Amil ...
Black magic specialist in Saudi Arabia (Kala jadu expert in UK) Bangali Amil ...
 
Strategic Resources May 2024 Corporate Presentation
Strategic Resources May 2024 Corporate PresentationStrategic Resources May 2024 Corporate Presentation
Strategic Resources May 2024 Corporate Presentation
 
20240419-SMC-submission-Annual-Superannuation-Performance-Test-–-design-optio...
20240419-SMC-submission-Annual-Superannuation-Performance-Test-–-design-optio...20240419-SMC-submission-Annual-Superannuation-Performance-Test-–-design-optio...
20240419-SMC-submission-Annual-Superannuation-Performance-Test-–-design-optio...
 
Famous Kala Jadu, Kala ilam specialist in USA and Bangali Amil baba in Saudi ...
Famous Kala Jadu, Kala ilam specialist in USA and Bangali Amil baba in Saudi ...Famous Kala Jadu, Kala ilam specialist in USA and Bangali Amil baba in Saudi ...
Famous Kala Jadu, Kala ilam specialist in USA and Bangali Amil baba in Saudi ...
 
Webinar on E-Invoicing for Fintech Belgium
Webinar on E-Invoicing for Fintech BelgiumWebinar on E-Invoicing for Fintech Belgium
Webinar on E-Invoicing for Fintech Belgium
 
DIGITAL COMMERCE SHAPE VIETNAMESE SHOPPING HABIT IN 4.0 INDUSTRY
DIGITAL COMMERCE SHAPE VIETNAMESE SHOPPING HABIT IN 4.0 INDUSTRYDIGITAL COMMERCE SHAPE VIETNAMESE SHOPPING HABIT IN 4.0 INDUSTRY
DIGITAL COMMERCE SHAPE VIETNAMESE SHOPPING HABIT IN 4.0 INDUSTRY
 
Collecting banker, Capacity of collecting Banker, conditions under section 13...
Collecting banker, Capacity of collecting Banker, conditions under section 13...Collecting banker, Capacity of collecting Banker, conditions under section 13...
Collecting banker, Capacity of collecting Banker, conditions under section 13...
 
Test bank for advanced assessment interpreting findings and formulating diffe...
Test bank for advanced assessment interpreting findings and formulating diffe...Test bank for advanced assessment interpreting findings and formulating diffe...
Test bank for advanced assessment interpreting findings and formulating diffe...
 
Abhay Bhutada: Driving Digital Transformation in NBFC Sector
Abhay Bhutada: Driving Digital Transformation in NBFC SectorAbhay Bhutada: Driving Digital Transformation in NBFC Sector
Abhay Bhutada: Driving Digital Transformation in NBFC Sector
 
Production and Cost of the firm with curves
Production and Cost of the firm with curvesProduction and Cost of the firm with curves
Production and Cost of the firm with curves
 
Solution Manual For Financial Statement Analysis, 13th Edition By Charles H. ...
Solution Manual For Financial Statement Analysis, 13th Edition By Charles H. ...Solution Manual For Financial Statement Analysis, 13th Edition By Charles H. ...
Solution Manual For Financial Statement Analysis, 13th Edition By Charles H. ...
 
amil baba in australia amil baba in canada amil baba in london amil baba in g...
amil baba in australia amil baba in canada amil baba in london amil baba in g...amil baba in australia amil baba in canada amil baba in london amil baba in g...
amil baba in australia amil baba in canada amil baba in london amil baba in g...
 
Current scenario of Energy Retail utilities market in UK
Current scenario of Energy Retail utilities market in UKCurrent scenario of Energy Retail utilities market in UK
Current scenario of Energy Retail utilities market in UK
 
Black magic specialist in Canada (Kala ilam specialist in UK) Bangali Amil ba...
Black magic specialist in Canada (Kala ilam specialist in UK) Bangali Amil ba...Black magic specialist in Canada (Kala ilam specialist in UK) Bangali Amil ba...
Black magic specialist in Canada (Kala ilam specialist in UK) Bangali Amil ba...
 
najoomi asli amil baba kala jadu expert rawalpindi bangladesh uk usa
najoomi asli amil baba kala jadu expert rawalpindi bangladesh uk usanajoomi asli amil baba kala jadu expert rawalpindi bangladesh uk usa
najoomi asli amil baba kala jadu expert rawalpindi bangladesh uk usa
 
Benefits & Risk Of Stock Loans
Benefits & Risk Of Stock LoansBenefits & Risk Of Stock Loans
Benefits & Risk Of Stock Loans
 
najoomi asli amil baba kala jadu expert rawalpindi bangladesh uk usa
najoomi asli amil baba kala jadu expert rawalpindi bangladesh uk usanajoomi asli amil baba kala jadu expert rawalpindi bangladesh uk usa
najoomi asli amil baba kala jadu expert rawalpindi bangladesh uk usa
 
GIFT City Overview India's Gateway to Global Finance
GIFT City Overview  India's Gateway to Global FinanceGIFT City Overview  India's Gateway to Global Finance
GIFT City Overview India's Gateway to Global Finance
 

Economic integration: the key to unlocking ASEAN’s export potential?

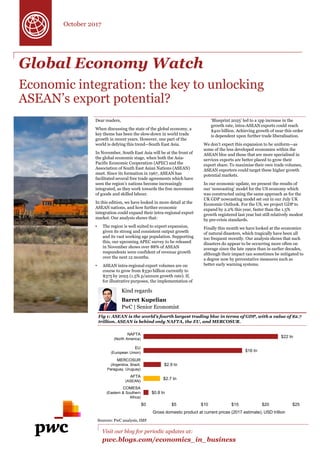
  • 1. Global Economy Watch Economic integration: the key to unlocking ASEAN’s export potential? Fig 1: ASEAN is the world’s fourth largest trading bloc in terms of GDP, with a value of $2.7 trillion. ASEAN is behind only NAFTA, the EU, and MERCOSUR. Visit our blog for periodic updates at: pwc.blogs.com/economics_in_business Kind regards Barret Kupelian PwC | Senior Economist October 2017 Sources: PwC analysis, IMF $0.8 tn $2.7 tn $2.9 tn $16 tn $22 tn $0 $5 $10 $15 $20 $25 Gross domestic product at current prices (2017 estimate), USD trillion NAFTA (North America) EU (European Union) MERCOSUR (Argentina, Brazil, Paraguay, Uruguay) AFTA (ASEAN) COMESA (Eastern & Southern Africa) Dear readers, When discussing the state of the global economy, a key theme has been the slow-down in world trade growth in recent years. However, one part of the world is defying this trend—South East Asia. In November, South East Asia will be at the front of the global economic stage, when both the Asia- Pacific Economic Cooperation (APEC) and the Association of South East Asian Nations (ASEAN) meet. Since its formation in 1967, ASEAN has facilitated several free trade agreements which have seen the region’s nations become increasingly integrated, as they work towards the free movement of goods and skilled labour. In this edition, we have looked in more detail at the ASEAN nations, and how further economic integration could expand their intra-regional export market. Our analysis shows that: • The region is well suited to export expansion, given its strong and consistent output growth and its vast working age population. Supporting this, our upcoming APEC survey to be released in November shows over 88% of ASEAN respondents were confident of revenue growth over the next 12 months. • ASEAN intra-regional export volumes are on course to grow from $330 billion currently to $375 by 2025 (1.5% p/annum growth rate). If, for illustrative purposes, the implementation of ‘Blueprint 2025’ led to a 1pp increase in the growth rate, intra-ASEAN exports could reach $410 billion. Achieving growth of near this order is dependent upon further trade liberalisation. We don’t expect this expansion to be uniform—as some of the less developed economies within the ASEAN bloc and those that are more specialised in services exports are better placed to grow their export share. To maximise their own trade volumes, ASEAN exporters could target these higher growth potential markets. In our economic update, we present the results of our ‘nowcasting’ model for the US economy which was constructed using the same approach as for the UK GDP nowcasting model set out in our July UK Economic Outlook. For the US, we project GDP to expand by 2.2% this year, faster than the 1.5% growth registered last year but still relatively modest by pre-crisis standards. Finally this month we have looked at the economics of natural disasters, which tragically have been all too frequent recently. Our analysis shows that such disasters do appear to be occurring more often on average since the late 1990s than in earlier decades, although their impact can sometimes be mitigated to a degree now by preventative measures such as better early warning systems.
  • 2. Fig 2: In 2017 we project real GDP growth of 2.2% Sources: PwC analysis Economic update: US data points to gradual Fed tightening Unfortunately, natural disasters are back in the spotlight and these events are above all human tragedies. However, they also tend to disrupt households, businesses and governments, and some can have macroeconomic effects. The latest data from the Centre for Research on the Epidemiology of Disasters (CRED) estimates there were 348 natural disasters1 in 2016 that cost approximately $150 billion2 in total. This sum is a very partial measure of cost, as it does not quantify loss of life or revenue as a result of natural disasters. Subject to these limitations, we deflated this data to get a picture of real costs over time (Figure 3). We should be cautious about putting too much weight on precise conclusions from this, due to the volatility of costs and the unique nature of natural disasters. However there has been a gradual upward trend in both the number and total real cost of natural disasters since the 1970s – what are the key factors behind these trends? The megatrends of climate change, urbanisation and technology play a role… NASA estimates 16 out of the 17 warmest years in the last 136 years have all occurred since 20013. A warmer atmosphere will have a higher average moisture content, creating the potential for more extreme precipitation events. The Paris Climate Agreement seeks to co-ordinate government commitments and action to limit global warming to below two degrees. PwC analysis in the Low Carbon Economy Index shows while record progress has been made, it still falls short of the rapid reductions needed to achieve the two degree goal. Second, urbanisation and rapid population growth have pushed around one quarter of the world’s population to live in areas classified as high risk from natural disasters4. This problem is particularly acute in less developed economies, where the reward of higher salaries in high-risk urban areas is often judged to outweigh the risk of living in a high-risk area. Finally, some of this increase may be “artificial”, as enhanced communication networks and technological advances have enabled scientists to notice natural disasters more frequently than in the past. …but preventative measures have helped to mitigate some of the costs of disasters Taken at face value, Figure 3 implies the cost of physical damage per natural disaster has fallen by around a third in real terms since 1970. Again, we should be cautious about putting too much weight on precise estimates, however a plausible explanation for this apparent trend is that enhanced preventative measures have helped to limit costs. These range from early warning systems, which detect weather patterns that lead to hurricanes and tornadoes at a more localised level, to planning laws that encourage maintaining wetlands in flood prone areas to absorb excess water. On a regional level, the destruction of tangible assets leads to a deterioration in productive capacity, while consumer spending on non- essential items generally falls in the immediate aftermath of a disaster. However at a macro level, academic evidence is mixed as to the net impact on GDP growth. For example, rebuilding efforts can offset the loss of assets and an influx of aid can help restore production, so leading any initial drop in GDP due to the disaster to be reversed relatively quickly. However, while output as measured by GDP may not be significantly impacted beyond the short term, natural disasters cause devastation for those affected and may be becoming more prevalent for the reasons discussed above. Significant investment in increasing the risk- resilience of infrastructure and our ability to manage the impacts of extreme events is therefore also becoming an increasing priority for governments and business. 1 For a disaster to be recorded, one of the following criteria must be met: 10 people reported killed, 100 people report affected, declaration of a state of emergency or a call for international assistance is made. 2 Cost of damage was deflated using World Bank data, and is measured in 2016 USD throughout (i.e. excluding the impact of general price inflation). 3 NASA Global Climate Change Facts, 2016. 4 World Bank, Natural Disaster Hotspots, 2005. Natural disasters are occurring more often, but how much do they cost? Sources: PwC analysis, CRED, World Bank Fig 3: The real cost of damages from natural disasters is increasing 0 100 200 300 400 500 0 200 400 600 1970 1980 1990 2000 2010 Economicdamage,2016 USDbillions No.ofnaturaldisastersper year No. of natural disasters (LHS) Natural disasters economic damage (RHS) 0% 1% 2% 3% 4% 2012 2013 2014 2015 2016 2017 RealUSGDPgrowthp/annum,percentage GDP growth Out of sample model prediction Reasonable outlook for the US for remainder of year Building on the UK GDP nowcasting model published in our July UK Economic Outlook, we have built a US GDP nowcasting model. This follows the same basic machine learning principles as the UK model and, as before, we have tested the historic accuracy of the US model, which has performed well in predicting actual GDP growth for the past five years based on data available at the time (see Figure 2). Our nowcasting model suggests that the US economy is on track to grow by 2.2% this year, slightly below the median GDP growth forecast of the Federal Reserve. This implies average quarter-on-quarter growth of about 0.5% (2% annualised) in the second half of 2017, although this could be temporarily affected by the recent hurricanes. Survey data also confirms the buoyant nature of the US labour market, with a recent National Federation of Small Business (NFSB) survey reporting that finding qualified labour is now the single most important business problem in the US. Fed prepares to raise rates again … but fiscal policy remains uncertain However, what businesses are currently monitoring is the policymaking environment in the US. September saw the Federal Reserve outline its plans in detail on the form of future monetary tightening, including the planned reduction of its balance sheet. As regards interest rates, the Fed’s updated median projections indicate another rate hike by the end of the year (but this should be of less concern to business as it is well signposted). The key area of focus in the next few months will be on fiscal policy. More specifically, what form the proposed corporate tax cuts will take, if indeed they can be passed through Congress.
  • 3. 0 5 10 Average real GDP growth per annum, % 2000-09 2010-16 This year marks the 50th anniversary of the establishment of ASEAN. Since its formation it has expanded to ten countries (as listed in Figure 6) and total ASEAN GDP has expanded from 1% to 3.4% of global output1. If it were a single country, ASEAN would be the world’s seventh largest economy, with a GDP of around $2.7 trillion2, and the third most populous area of the world with around 635 million people, of which over 430 million are of working age. In 2015, the ASEAN Economic Community (AEC) formally launched and adopted Blueprint 2025. This outlines their strategy to achieve a ‘deeply integrated and highly cohesive’ economy, a single market allowing the free movement of goods and people. And there has been already been great progress on this – in 2016, for example, 96% of tariff lines on intra-regional trade were zero. This November, the Philippines will host the 31st ASEAN summit where furthering regional integration is top of the agenda. So how well equipped is ASEAN to further integrate its economies? Strong and stable growth in the ASEAN economies should benefit regional trade A key challenge for any business is planning ahead. Prospective exporters face the additional challenge of planning for business cycle fluctuations in foreign markets, which can disrupt revenue flows. The average ASEAN GDP-weighted growth rate since 2000 has been 5.2% per annum - this is notable not just because it is faster than the global average of 3.8% per annum3, but also because of its stability. Specifically, when we compare the standard deviations of GDP growth across high- growth regions since 2000, ASEAN compares favourably. Sub-Saharan Africa came narrowly second, while the Emerging Markets, China and the Middle East & North Africa were all more turbulent. For example, Figure 4 shows how little difference there was in average ASEAN output growth between 2000-09 and 2010-16 – it’s worth noting this was a period encompassing the Global, but not the Asian, Financial Crisis. Given its stable footing, how large could intra-regional ASEAN trade grow by 2025? Intra-ASEAN trade could reach between $375 and $410 billion by 2025 Exports in the ASEAN economies are growing, but not as fast as GDP – the compound annual growth rates since 2010 were 2.9% and 4.9% respectively. In 2016, total exports from ASEAN countries accounted for 7% of global exports, or $1.1 trillion. This total contribution was behind only the EU (24%), US (13%) and China (9%)4. However intra- regional trade is a markedly smaller market than this - in 2016, intra-ASEAN exports were valued at only just over $330 billion. For context, the EU’s single market saw $3.4 trillion of exports within its borders. Assuming the current rate of post-crisis growth continues, we project intra-ASEAN exports could surpass $375 billion by 2025. However, various academic studies show that single market access has a positive effect on intra-trade volumes, in some cases by up to 115% in the long run5. Therefore if, for purely illustrative purposes, we assume an acceleration to the tune of 1 percentage point per year due to the implementation of Blueprint 2025 – intra-ASEAN export volumes could reach $410 billion, as shown in Figure 5. These overall estimates for ASEAN disguise significant heterogeneity across sectors and countries. For example, the data shows that intra-regional services exports have been growing almost 4 pp per year faster than goods exports since the financial crisis. Likewise, the relatively less developed economies of Myanmar and Vietnam have seen double digit intra-regional export growth, while Singapore and Malaysia have experienced slower growth per annum. Diversification is needed for evenly distributed benefits across ASEAN This heterogeneity becomes even more apparent when we breakdown individual ASEAN nation’s total exports. As a whole, ASEAN is a net exporter and the majority of exports are goods - but which nations are most likely to benefit from the high export growth potential in services sectors? Cambodia and the Philippines were the only nations where services comprised over 30% of total exports (see Figure 6). Travel and business services provided the majority of service exports for Cambodia and the Philippines respectively. When we look at the change in services exports since 2010, we can see which countries have made the most progress towards diversifying away from goods exports. Myanmar (25%) and Thailand (23%) made the largest moves (from 4% and 15% respectively). ASEAN as a whole has increased its share of services exports by 5 percentage points to 22% - and continuing to focus on service exports should keep it well positioned in the global economy for years to come. The ASEAN region is culturally, linguistically and politically diverse. Therefore any integration needs to be highly customised, while common interests need to be identified and exploited. Although integration is still relatively limited in comparison to the EU, things are moving forward. If ASEAN policymakers can implement Blueprint 2025, the removal of barriers to further integration could see ASEAN become an even more significant global market. 1 World Bank, market exchange rates. 2 2017 estimate, current prices. 3 At market exchange rates. 4 IMF Direction of Trade Statistics, Value of Good exports, 2017. 5 “EU membership boosts intra-EU trade by 115% relative to a position of WTO membership” HM Treasury, 2016. Economic integration: the key to unlocking ASEAN’s export potential? Fig 4: ASEAN economic growth has proven consistently strong Fig 5: ASEAN is on course to surpass $375 billion of intra-regional trade by 2025 Fig 6: Mineral & Chemical products, and Metals, Machinery & Transport dominate ASEAN exports Sources: PwC analysis, IMF Sources: PwC analysis, ASEANstats Sources: PwC analysis, ASEANstats ASEAN 10* Emerging Markets Sub-Saharan Africa US China EU World 0 100 200 300 400 500 600 700 2007 2017 2027 2037 Volumeofintra-ASEANexports, USDbillions Projections Main scenario Strong growth (1pp above trend) 1 2 3 4 5 6 Brunei 0.2 84 5 1 3 7 Cambodia 3 50 13 3 22 9 Indonesia 18 42 24 2 7 7 Lao PDR 24 30 24 1 18 3 Malaysia 9 26 44 5 8 8 Myanmar 29 34 11 1 14 10 Philippines 6 12 43 4 6 30 Singapore 2 37 32 6 3 21 Thailand 11 19 44 3 17 6 Vietnam 12 25 49 7 4 2 ASEAN 10 9 24 40 5 8 14 Goods 1 Animal & Foodstuffs 2 Mineral & Chemical Products 3 Metals, Machinery and Transport 4 Other Services 5 Travel 6 Other Composition of total exports in 2016, % Red < 10% Orange 10%-25%, Green 25%+ *GDP weighted growth 2017 GDP, USD tn. $11.8 $2.7 $31.1 $1.5 $78.0 $19.4 $16.1
  • 4. Share of 2016 world GDP PPP MER 2017p 2018p 2019-2023p 2017p 2018p 2019-2023p Global (Market Exchange Rates) 100.0% 3.0 2.9 3.0 2.5 2.4 2.5 Global (PPP rates) 100.0% 3.6 3.5 3.6 2.4 2.7 2.7 G7 31.0% 47.1% 1.9 1.8 1.9 1.8 1.8 1.8 E7 36.9% 25.8% 5.3 5.2 5.1 3.2 3.3 3.6 United States 15.5% 24.7% 2.2 2.2 2.3 2.2 2.1 2.0 China 17.8% 14.9% 6.6 6.2 5.7 2.0 2.2 2.8 Japan 4.4% 6.6% 1.2 0.7 0.8 0.5 0.9 1.5 United Kingdom 2.3% 3.5% 1.5 1.4 2.0 2.7 2.7 2.2 Eurozone 10.4% 13.9% 2.0 1.7 1.5 1.4 1.4 1.4 France 2.3% 3.3% 1.6 1.6 1.6 1.0 1.2 1.2 Germany 3.3% 4.6% 1.9 1.7 1.4 1.8 1.7 1.7 Greece 0.2% 0.3% 0.7 1.7 1.8 1.1 1.1 1.1 Ireland 0.3% 0.4% 4.3 3.4 2.6 0.4 0.9 1.5 Italy 1.9% 2.5% 1.2 1.1 1.2 1.2 1.2 1.4 Netherlands 0.7% 1.0% 2.8 2.1 1.8 1.4 1.5 1.3 Portugal 0.2% 0.3% 2.6 1.8 1.1 1.6 1.5 1.4 Spain 1.4% 1.6% 3.1 2.3 2.0 1.8 1.2 1.2 Poland 0.9% 0.6% 3.4 3.3 3.5 1.8 2.0 2.4 Russia 3.2% 1.7% 1.3 1.4 1.5 4.2 4.0 4.0 Turkey 1.7% 1.1% 4.1 3.2 3.4 10.0 8.1 7.0 Australia 1.0% 1.7% 2.7 2.8 2.7 1.9 2.3 2.5 India 7.2% 3.0% 6.9 7.4 7.7 3.6 5.0 5.0 Indonesia 2.5% 1.2% 5.1 5.3 5.4 4.2 4.6 5.1 South Korea 1.6% 1.9% 2.9 3.0 3.0 2.2 2.5 2.7 Argentina 0.7% 0.7% 2.6 2.8 3.0 25.0 - - Brazil 2.6% 2.4% 0.5 1.7 2.6 4.0 4.5 4.5 Canada 1.4% 2.0% 2.4 1.9 2.2 1.9 1.8 2.0 Mexico 1.9% 1.4% 1.8 1.9 3.0 5.4 3.5 3.0 South Africa 0.6% 0.4% 0.8 1.2 3.0 6.1 5.8 5.5 Nigeria 0.9% 0.5% 0.7 1.8 4.2 15.0 14.1 12.0 Saudi Arabia 1.5% 0.8% 0.8 1.5 3.5 3.5 4.8 2.5 Real GDP growth Inflation Projections: October 2017 Interest rate outlook of major economies Current rate (Last change) Expectation Next meeting Federal Reserve 1.25% (June 2017) Further gradual tightening in the next two quarters 31 October – 1 November European Central Bank 0.00% (March 2016) No rate rise for the foreseeable future 26 October Bank of England 0.25% (August 2016) Rates could increase within next few months 2 November This publication has been prepared for general guidance on matters of interest only, and does not constitute professional advice. You should not act upon the information contained in this publication without obtaining specific professional advice. No representation or warranty (express or implied) is given as to the accuracy or completeness of the information contained in this publication, and, to the extent permitted by law, PricewaterhouseCoopers LLP, its members, employees and agents do not accept or assume any liability, responsibility or duty of care for any consequences of you or anyone else acting, or refraining to act, in reliance on the information contained in this publication or for any decision based on it. © 2017 PricewaterhouseCoopers LLP. All rights reserved. In this document, “PwC” refers to the UK member firm, and may sometimes refer to the PwC network. Each member firm is a separate legal entity. Please see www.pwc.com/structure for further details. We help you understand how big economic, demographic, social, and environmental changes affect your organisation by setting out scenarios that identify growth opportunities and risks on a global, regional, national and local level. We help make strategic and tactical operational, pricing and investment decisions to support business value creation. We work together with you to achieve sustainable growth. Do get in contact with one of the team if you would like to discuss any of these topics. Sources: PwC analysis, National statistical authorities, Datastream and IMF. All inflation indicators relate to the Consumer Price Index (CPI). Argentina has recently launched a new CPI measure, which only contains data from April 2016. Therefore we only project inflation for 2017, and will provide 2018 and 2019-2023 projections once a longer series is available. Note that the tables above form our main scenario projections and are therefore subject to considerable uncertainties. We recommend that our clients look at a range of alternative scenarios. Barret Kupelian T: + 44 (0) 20 7213 1579 E: barret.g.kupelian@pwc.com Chart of the month Beijing’s currency support and crackdown on outflow channels seems to be working. Net capital inflows to the country turned positive in the first half of this year. Compared to a $420 billion deficit in 2016, China ran a $16 billion surplus in H1 2017. Source: FT, CEIC Net capital inflows to China turned positive in H1 2017 James Loughridge T: +44 (0) 780 266 0106 E: james.r.loughridge@pwc.com Balanceofpaymentsoutflowsand inflows(excl.centralbank intervention),USDbillions -250 -150 -50 50 150 2015 2016 2017