This document discusses spoken language identification using i-vectors and x-vectors for feature extraction, and PLDA and logistic regression for classification. It examines extracting features from Javanese, Sundanese, and Minangkabau languages, then classifying the languages using various parameters. The study finds that x-vector outperforms i-vector when using PLDA classification, except when using logistic regression, where i-vector performs better. It tunes parameters for i-vector UBM size, i-vector dimension, x-vector max frame size, and num repeats, reporting equal error rates to evaluate performance on test segments of 3, 10 and 30 seconds.
![Bulletin of Electrical Engineering and Informatics
Vol. 10, No. 4, August 2021, pp. 2237~2244
ISSN: 2302-9285, DOI: 10.11591/eei.v10i4.2893 2237
Journal homepage: http://beei.org
Spoken language identification using i-vectors, x-vectors, PLDA
and logistic regression
Ahmad Iqbal Abdurrahman, Amalia Zahra
Computer Science Department, Bina Nusantara University, Indonesia
Article Info ABSTRACT
Article history:
Received Feb 19, 2021
Revised May 20, 2021
Accepted Jun 22, 2021
In this paper, i-vector and x-vector is used to extract the features from speech
signal from local Indonesia languages, namely Javanese, Sundanese and
Minang languages to help classifier identify the language spoken by the
speaker. Probabilistic linear discriminant analysis (PLDA) are used as the
baseline classifier and logistic regression technique are used because of prior
studies showing logistic regression has better performance than PLDA for
classifying speech data. Once these features are extracted. The feature is going
to be classified using the classifier mentioned before. In the experiment, we
tried to segment the test data to three segment such as 3, 10, and 30 seconds.
This study is expanded by testing multiple parameters on the i-vector and x-
vector method then comparing PLDA and logistic regression performance as
its classifier. The x-vector has better score than i-vector for every segmented
data while using PLDA as its classifier, except where the i-vector and x-vector
is using logistic regression, i-vector still has better accuracy compared to x-
vector.
Keywords:
Equal error rate
I-vector
Logistic regression
PLDA
Spoken language recognition
X-vector
This is an open access article under the CC BY-SA license.
Corresponding Author:
Ahmad Iqbal Abdurrahman
Computer Science Department
Bina Nusantara University
Jakarta, Indonesia 11480
Email: ahmad.abdurrahman@binus.ac.id
1. INTRODUCTION
The number of regional languages in Indonesia that is recorded by Ministry of education and
culture's national agency for language development and books is 652 languages. There is one language to
bridge every language are called Bahasa Indonesia. This language is constructed from hundreds of languages
that is used in Indonesia. But there are many Indonesian people that is not fluent at speaking Bahasa
Indonesia. This matter can hinder people when they are speaking to the other. One example is if they are
calling customer service and they are not using Bahasa Indonesia, the people in customer services may be
experiencing difficulties when communicating with those people. Until now, there are 11 extinct regional
languages. One of the reasons that language going extinct is, there are globalization effect, so people are
learning global language like English for communicating with international people and using Bahasa
Indonesia to communicate with domestic people. And they rarely used their own regional language.
Based on the problem written above, there is a technology called spoken language identification [1]
to help people when they are visiting another region. This technology can help people by receiving input in
the form of spoken sound, and then the system is going to select the matching language. These technology
needs speech data for them to work. When collecting the dataset for this technology. It can also help to
preserve regional language by archiving the dataset.](https://image.slidesharecdn.com/542893-210819040123/85/Spoken-language-identification-using-i-vectors-x-vectors-PLDA-and-logistic-regression-1-320.jpg)
![Bulletin of Electrical Engineering and Informatics
Vol. 10, No. 4, August 2021, pp. 2237~2244
ISSN: 2302-9285, DOI: 10.11591/eei.v10i4.2893 2237
Journal homepage: http://beei.org
Spoken language identification using i-vectors, x-vectors, PLDA
and logistic regression
Ahmad Iqbal Abdurrahman, Amalia Zahra
Computer Science Department, Bina Nusantara University, Indonesia
Article Info ABSTRACT
Article history:
Received Feb 19, 2021
Revised May 20, 2021
Accepted Jun 22, 2021
In this paper, i-vector and x-vector is used to extract the features from speech
signal from local Indonesia languages, namely Javanese, Sundanese and
Minang languages to help classifier identify the language spoken by the
speaker. Probabilistic linear discriminant analysis (PLDA) are used as the
baseline classifier and logistic regression technique are used because of prior
studies showing logistic regression has better performance than PLDA for
classifying speech data. Once these features are extracted. The feature is going
to be classified using the classifier mentioned before. In the experiment, we
tried to segment the test data to three segment such as 3, 10, and 30 seconds.
This study is expanded by testing multiple parameters on the i-vector and x-
vector method then comparing PLDA and logistic regression performance as
its classifier. The x-vector has better score than i-vector for every segmented
data while using PLDA as its classifier, except where the i-vector and x-vector
is using logistic regression, i-vector still has better accuracy compared to x-
vector.
Keywords:
Equal error rate
I-vector
Logistic regression
PLDA
Spoken language recognition
X-vector
This is an open access article under the CC BY-SA license.
Corresponding Author:
Ahmad Iqbal Abdurrahman
Computer Science Department
Bina Nusantara University
Jakarta, Indonesia 11480
Email: ahmad.abdurrahman@binus.ac.id
1. INTRODUCTION
The number of regional languages in Indonesia that is recorded by Ministry of education and
culture's national agency for language development and books is 652 languages. There is one language to
bridge every language are called Bahasa Indonesia. This language is constructed from hundreds of languages
that is used in Indonesia. But there are many Indonesian people that is not fluent at speaking Bahasa
Indonesia. This matter can hinder people when they are speaking to the other. One example is if they are
calling customer service and they are not using Bahasa Indonesia, the people in customer services may be
experiencing difficulties when communicating with those people. Until now, there are 11 extinct regional
languages. One of the reasons that language going extinct is, there are globalization effect, so people are
learning global language like English for communicating with international people and using Bahasa
Indonesia to communicate with domestic people. And they rarely used their own regional language.
Based on the problem written above, there is a technology called spoken language identification [1]
to help people when they are visiting another region. This technology can help people by receiving input in
the form of spoken sound, and then the system is going to select the matching language. These technology
needs speech data for them to work. When collecting the dataset for this technology. It can also help to
preserve regional language by archiving the dataset.](https://image.slidesharecdn.com/542893-210819040123/75/Spoken-language-identification-using-i-vectors-x-vectors-PLDA-and-logistic-regression-1-2048.jpg)
![ ISSN: 2302-9285
Bulletin of Electr Eng & Inf, Vol. 10, No. 4, August 2021 : 2237 – 2244
2238
With this technology, we can develop models that can recognize the language. If in the future a
language translation system is made that can be integrated with the system in this study, regional language
users can communicate directly with foreign language users when communicating. So that users can use their
local language while using certain technologies, this will allow users to still use their own local language
without fear of being affected by globalization.
There are several steps to identify language, starting from cleaning the data from noise to help the
system get better accuracy, extracting the feature from speech data, and classifying the language. There are
several techniques to classify the language spoken, including neural networks [2], convolutional neural
networks [3]-[6], logistic regression [7], PLDA [8], gaussian mixture model [9], [10], support vector machine
[11], [12], and several techniques to extract the features from the recording, such as MFCC [13], [14], i-
vector [15]-[17], and x-vector [18].
Jain, et al. [19] builds two systems, a system that uses the Mel-frequency cepstral coefficients
(MFCC) and shifted delta cepstrum (SDC) features. At the time of testing, the result of a significant increase
in accuracy on features, because MFCC performs better than SDC, therefore his research with MFCC. They
use the support vector machine (SVM) classification technique combined with the singular value
decomposition (SVD) technique to reduce its dimensions. This study produces a model with the best
accuracy of 93.50% on a 30-minute pronunciation test with the callfriend corpus dataset (Martin and
Przybocki, 2003) which has a total of twelve languages.
Venkatesan, et al. [20] used the MFCC technique which mimics parts of sound perception and
production to get the details of the message uttered by the speaker. In this study, the dataset used has 4
languages, namely English, Hindi, Tamil, and Telugu, this sound file is sent to an extraction program that
uses each sound chunk, then stored in CSV form. Acoustic models used for language identification are
decision-tree classifier and SVM. This study produces 76% accuracy using SVM methods and 73% accuracy
using decision tree classifier.
Sarthak, et al. [21] used raw audio waveforms as sound input which provide increased performance
by avoiding overheads in calculating log-Mel spectrum for each audio file. This study uses the convolutional
neural networks classification method because based on the journals studied, convolutional neural networks
have very good performance compared to other machine learning techniques, the sound input data used is
raw audio waveform because it is quite popular, because raw audio waveforms have advantages. That is, it
can retrieve several features in the sound that cannot be extracted properly by several other feature extraction
techniques such as MFCC, constant q transform (CQT), and fast fourier transform (FFT). In this study, 3
models were made, namely 1D ConvNet, 2D ConvNet, 2D ConvNet with Attention and GRU. 1D ConvNet
has a hyper parameter random search algorithm that is useful for finding the optimal group of hyper
parameters based on the given parameters. 2D ConvNet with Attention and bi-directional GRU models are
added with a residual connection at each convolutional layer. This function is to find the optimal number of
layers to train and eliminate the problem of vanishing gradients, there is also additional spatial attention that
serves to help the model focus more on a specific part of the image, and this model also adds channel
attention to help the model look for inter- dependencies between color channels in the log-Mel spectra.
ConvNet 2D model explained that this model is like 2D ConvNet model with Attention and bi-directional
GRU, but this model does not have the skip connection, attention layers, bi-directional GRU, and layers that
were in the previous model. This study produces 93.7% accuracy using 1D ConvNet, 95.4% accuracy using
2D ConvNet, 95.0% accuracy using 2D ConvNet-Bidirectional + GRUAttention, and 96.6 accuracy from 2D
ConvNet alone.
Heracleous, et al. [22] uses feature extraction i-vector techniques for language identification. The
research was conducted using three classification techniques, namely deep neural network (DNN),
convolutional neural network (CNN) and support vector machines (SVM). The dataset used in this study is
NIST LRE 2015 (NIST, 2015) which has 50 languages to classify. Their system has a score of 1.89 EER
from DNN technique. 2.00 EER from CNN technique, and 2.42 EER from SVM techniques.
Safitri, et al. [23] using the phone recognition method followed by language modeling (PRLM) and
parallel phone recognition followed by language modeling (PPRLM) to identify the three selected languages.
The difference between the two methods is the number of telephone identifiers used, if PRLM only uses one
telephone identifier, PPRLM can use more than one telephone identifier for the language classification
process. In this study, three languages were obtained with an average total sound duration per language of
about 244 minutes. The voice data used are recordings of speakers reading scripts in their local language. The
script contains articles or short stories in their local language. The experimental results compared were
accuracy, false positive values, precision, and repeatability. PRLM experiments were carried out by trying
each language module in PRLM. The existing modules start from Czech, English, Hungarian, and Spanish.
Then the PPRLM experiment was carried out using all available language models and selecting the two](https://image.slidesharecdn.com/542893-210819040123/85/Spoken-language-identification-using-i-vectors-x-vectors-PLDA-and-logistic-regression-2-320.jpg)
![Bulletin of Electr Eng & Inf ISSN: 2302-9285
Spoken language identification using i-vectors, x-vectors, PLDA … (Ahmad Iqbal Abdurrahman)
2239
language modules that had the best value in the PRLM experiment. This study produced average accuracy of
73.92% from PPRLM techniques, and 67.04% from PRLM techniques.
Snyder, et al. [18] conducted research on the x-vector feature extraction technique, the study
compared the x-vector technique with the i-vector technique. This research also compared the performance of
acoustic features and two types of bottleneck features. For acoustic features, 23 MFCC will be used, while
for the bottleneck feature, fisher English BNFs and multilingual BNFs will be used. The classification is
performed by a discriminatively trained gaussian classifier, the dataset used in this study is the dataset
obtained from NIST LRE 2017 (NIST, 2017) which has five language groups. In this study, the EER score
was 0.163 for the x-vector system, and an EER score of 0.189 for i-vector.
Martinez, et al. [24] conducted research on the i-vector extraction method with the SVM
classification method and logistic regression. In this study, the logistic regression accuracy score was
obtained which was slightly higher than the SVM method at 3 sound durations (3, 10, 30) seconds on the
NIST LRE 2009 dataset which has 23 languages. Models that use SVM as classifier has 400 dimensions
i-vector, while models that use logistic regression have 600 dimensions i-vector. The logistic regression
technique has a better accuracy on every dataset duration (3, 10, 30 seconds).
Burget, et al. [25] conducted research using i-vector as its feature extraction, and used four classifier
methods namely PLDA, LR, SVM, and havy-tailed PLDA, on this research it is shown that the LR method
has better accuracy than the baseline PLDA method. I-vector is state of the art technique for spoken language
recognition, but from the previous study [18], x-vector has better score than i-vector for classifying spoken
language. The previous study [18] does not review how x-vector compared to i-vector technique using only
MFCC as its acoustic feature in segmented duration while using classifier other than PLDA. From the
research in [25], it is shown that LR has better accuracy than PLDA, so this experiment will compare logistic
regression performance against PLDA as classifier. The current study focuses on spoken language
identification using i-vector and x-vector techniques as their feature extraction method. And comparing
PLDA and logistic regression classifier performance to classify the language after the dataset feature has
been extracted by the help of i-vector and x-vector. The current study also expanded by testing the dataset on
segmented duration such as 3, 10, and 30 seconds of test data, finding best parameter for each extraction
techniques, and comparing EER score for each classification techniques.
2. RESEARCH METHOD
2.1. Dataset
This study will use three regional languages, Bahasa Sunda, Bahasa Jawa, and Bahasa Minang.
Data collection will be done by searching for sound samples of each language via the internet. For Javanese
and Sundanese languages, it will be found on the openslr.org site. Table 1 describes the Javanese, Sundanese
and Minangkabau language dataset used for training and testing the models.
Table 1. Dataset duration
Language Duration
Jawa 200 Minutes
Sunda 200 Minutes
Minang 200 Minutes
The Minang language dataset will be collected via video from the YouTube site and pre-processing
will be carried out such as changing the format of the speech data into WAV extension format and using
128 kbps bitrate.
2.2. Pre-processing
After getting the Minang language dataset. Each of them will be combined to 200 minutes of
recording. And then the dataset will be split by 10 seconds for each file. The dataset is separated by a ratio of
8:1:1, with 80% as the data used for the training models, 10% as data for validation set, and 10% as data to
be used for classification testing. After the dataset is divided by the ratio 80:10:10, which is 160 minutes for
learning, 20 minutes for validation set, and 20 minutes for testing. The testing and validation dataset will be
divided again into 3 parts, namely the 3, 10, and 30 second dataset.
2.3. Model development
This research will use i-vector and x-vector feature extraction technique to compare the accuracy
results of the two. Both techniques used the same dataset so that the accuracy can be compared through the](https://image.slidesharecdn.com/542893-210819040123/85/Spoken-language-identification-using-i-vectors-x-vectors-PLDA-and-logistic-regression-3-320.jpg)
![ ISSN: 2302-9285
Bulletin of Electr Eng & Inf, Vol. 10, No. 4, August 2021 : 2237 – 2244
2240
PLDA and logistic regression classifier. Before being fed to the i-vector or x-vector techniques, the features
are mean-normalized over a 3-seconds sliding window, and nonspeech frames are removed using energy-
based speech activity. The acoustic features used in this study are 23 MFCC with a frame-length of 25ms.
The i-vector are built from GMM-UBM recipe described in [18] as the baseline system. The i-vector
UBM size and i-vector dimension parameter will be tuned. The UBM parameter has a 2048, 1024, and 512
component full-covariance GMM. The i-vector has a dimension of 600, 400, 200 and iterated 2 times on the
train dataset. The x-vector training examples are built by picking speech chunks from the train data that are
2-5 seconds long for 5 epochs. The minibatch size used are 128. The parameters that will be tuned in the
x-vector technique are max-frame-chunk-size and num-repeats. Max-frame-chunk-size used in this research
are 400, 500, or 600. The num-repeats value for the x-vectors model are 300, 600 or 900.
Classifier models will be created using PLDA and logistic regression, before the dataset got
classified using PLDA, the embeddings are whitened, length normalized, and gets their dimensionality
reduced to 100, 200, or 300 using LDA. The training recordings are built from series of 10 seconds of
speech.
2.4. Evaluation
In this study, the equal error rate (EER) score for each parameter will be measured. The models are
built to predict each language. The experiment will be divided to two section, tuning the parameter for each
model using validation dataset, and testing the final model using test set. After obtaining the results of the
evaluation, an analysis of the results will be carried out, then the results of the analysis will answer the
problem formulation.
3. RESULTS AND DISCUSSION
The experiment is focused on comparing performance between i-vector and x-vector techniques on
three segmented durations. We performed the classification on three different languages. Once the models are
trained and the feature are extracted, we used PLDA or logistic regression classifier to classify the dataset.
The accuracy score of classification between three languages are reported in terms of EER. Tuning the
i-vector parameter using validation dataset are recorded on Table 2.
Table 2. I-vector parameter score using PLDA classifier
UBM Size I-Vector Dimension
EER Score using LDA+PLDA
3s 10s 30s
2048 600 19.5 14.17 8.333
1024 600 18.17 10.83 2.5
512 600 15.67 6.111 0.8333
512 200 16.75 8.661 1.667
512 400 15.25 6.667 0.8333
512 600 15.67 6.111 0.8333
In Table 2, we see that smaller UBM Size has better accuracy, while the best UBM size is 512, the i-
vector dimension has different accuracy. On 3 seconds, the 400 dimensions i-vector has better accuracy than
the 600 dimensions, while on the 10 seconds dataset, the 600 dimension has better accuracy. Not only smaller
UBM Size has better accuracy, but it also has faster training time. And next, the LDA dimension parameter
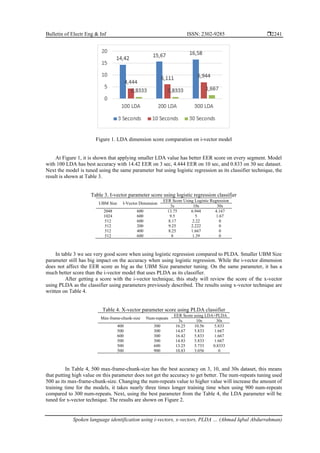
will be tuned, using 512 UBM size and 600 i-vector dimensions, the score is shown on Figure 1.
In Figure 1, it is shown that applying smaller LDA value has better EER score on every segment.
Model with 100 LDA has best accuracy with 14.42 EER on 3 sec, 4.444 EER on 10 sec, and 0.833 on 30 sec
dataset. Next the model is tuned using the same parameter but using logistic regression as its classifier
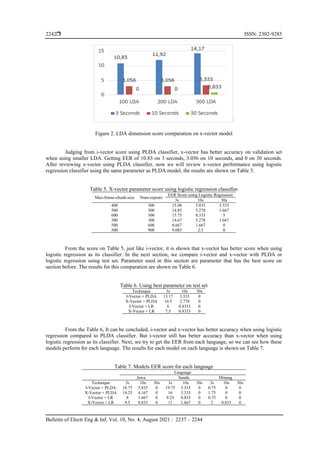
technique, the result is shown at Table 3.
In Table 3 we see very good score when using logistic regression compared to PLDA. Smaller UBM
Size parameter still has big impact on the accuracy when using logistic regression. While the i-vector
dimension does not affect the EER score as big as the UBM Size parameter tuning. On the same parameter, it
has a much better score than the i-vector model that uses PLDA as its classifier.
After getting a score with the i-vector technique, this study will review the score of the x-vector
using PLDA as the classifier using parameters previously described. The results using x-vector technique are
written on Table 4.](https://image.slidesharecdn.com/542893-210819040123/85/Spoken-language-identification-using-i-vectors-x-vectors-PLDA-and-logistic-regression-4-320.jpg)
![Bulletin of Electr Eng & Inf ISSN: 2302-9285
Spoken language identification using i-vectors, x-vectors, PLDA … (Ahmad Iqbal Abdurrahman)
2243
In Table 7 we see Jawa and Sunda language has similar score for each duration, and Minang has the
best accuracy from these three languages. While Minang language has so much better EER than the other two
languages, this can be caused by Minang recordings are made of several long videos that have been split into
3, 10 and 30 second segments, so that many files have similar recording quality. These models have no
problem when classifying language that has long duration like 30 seconds and has very good accuracy when
classifying 10 seconds segment. It is still having a bit difficulty when classifying the 3 seconds recording, but
x-vector still has the edge over i-vector when classifying the short recordings while using PLDA as its
classification technique.
4. CONCLUSION
In this paper, we compared i-vector and x-vector for automatic language identification system in
Kaldi to get which parameter has better accuracy for each technique and which feature extraction techniques
perform better using PLDA or LR method as its classifier. The features were extracted from audio recording
to form a training set using i-vector and x-vector technique and using PLDA or logistic regression technique
to identify the language spoken. X-vector has the best score in every segment using PLDA classifier. But
i-vector still has better accuracy compared to x-vector when using logistic regression as its classifier. When
using i-vector and x-vector, it is shown that logistic regression please change more detailshas performed
better than PLDA as classifier. This experiment shows that using LR as classifier was a good decision to help
x-vector performs better. Our suggestion for the future research is, to get more recording duration and
variation for Minang language, trying other acoustic feature such as bottleneck feature, using other classifier
methods or combining them, and getting other local language to be classified.
ACKNOWLEDGEMENTS
The authors would like to express sincere thanks to the Bina Nusantara University for supporting
this research, and thanks to Mrs. Amalia Zahra from University of Bina Nusantara for the guidance, very
useful discussion, and the assistance for this research. Without her support and guidance, this research would
not have been possible, the assistance provided was greatly appreciated.
REFERENCES
[1] H. Li, B. Ma, and K. A. Lee, "Spoken Language Recognition: From Fundamentals to Practice," in Proceedings of
the IEEE, vol. 101, no. 5, pp. 1136-1159, May 2013, doi: 10.1109/JPROC.2012.2237151.
[2] G. Montavon, "Deep learning for spoken language identification," In NIPS Workshop on deep learning for speech
recognition and related applications, pp. 1-4, 2009.
[3] S. Mukherjee, N. Shivam, A. Gangwal, L. Khaitan, and A. J. Das, "Spoken Language Recognition Using CNN,"
2019 International Conference on Information Technology (ICIT), 2019, pp. 37-41, doi:
10.1109/ICIT48102.2019.00013.
[4] L. Ferrer, Y. Lei, M. McLaren, and N. Scheffer, “Spoken language recognition based on senone posteriors,” in
Proceedings of the Annual Conference of the International Speech Communication Association, INTERSPEECH,
2014, pp. 2150-2154.
[5] C. Korkut, A. Haznedaroğlu, and L. M. Arslan, "Spoken Language Identification with Deep Convolutional Neural
Network and Data Augmentation," 2020 28th Signal Processing and Communications Applications Conference
(SIU), 2020, pp. 1-4, doi: 10.1109/SIU49456.2020.9302425.
[6] R. Ubale, Y. Qian, and K. Evanini, "Exploring End-To-End Attention-Based Neural Networks For Native
Language Identification," 2018 IEEE Spoken Language Technology Workshop (SLT), 2018, pp. 84-91, doi:
10.1109/SLT.2018.8639689.
[7] D. A. Van Leeuwen, and N. Brummer, "Channel-dependent GMM and Multi-class Logistic Regression models for
language recognition," 2006 IEEE Odyssey - The Speaker and Language Recognition Workshop, San Juan, PR,
USA, 2006, pp. 1-8, doi: 10.1109/ODYSSEY.2006.248094.
[8] M. K. Rai, Neetish, M. S. Fahad, J. Yadav, and K. S. Rao, "Language identification using PLDA based on i-vector
in noisy environment," 2016 International Conference on Advances in Computing, Communications and
Informatics (ICACCI), 2016, pp. 1014-1020, doi: 10.1109/ICACCI.2016.7732177.
[9] A. Dustor and P. Szwarc, "Spoken language identification based on GMM models," ICSES 2010 International
Conference on Signals and Electronic Circuits, 2010, pp. 105-108.
[10] Y. Xu, J. Yang, and J. Chen, "Methods to Improve Gaussian Mixture Model for Language Identification," 2010
International Conference on Measuring Technology and Mechatronics Automation, 2010, pp. 656-659, doi:
10.1109/ICMTMA.2010.545.
[11] S. Mohanty, “Phonotactic Model for Spoken Language Identification in Indian Language Perspective.”
International Journal of Computer Applications, 2011 .pp 18-24. 10.5120/2389-3164.
[12] R. W. M. Ng, T. Lee, C. Leung, B. Ma, and H. Li, "Spoken Language Recognition With Prosodic Features," in
IEEE Transactions on Audio, Speech, and Language Processing, vol. 21, no. 9, pp. 1841-1853, Sept. 2013, doi:](https://image.slidesharecdn.com/542893-210819040123/85/Spoken-language-identification-using-i-vectors-x-vectors-PLDA-and-logistic-regression-7-320.jpg)
![ ISSN: 2302-9285
Bulletin of Electr Eng & Inf, Vol. 10, No. 4, August 2021 : 2237 – 2244
2244
10.1109/TASL.2013.2260157.
[13] L. Ferrer, “Joint probabilistic linear discriminant analysis,” arXiv preprint arXiv:1704.02346, 2017.
[14] T. S. Gunawan, R. Husain, and M. Kartiwi, "Development of language identification system using MFCC and
vector quantization," 2017 IEEE 4th International Conference on Smart Instrumentation, Measurement and
Application (ICSIMA), 2017, pp. 1-4, doi: 10.1109/ICSIMA.2017.8312034.
[15] N. Dehak, P. Torres-Carrasquillo, D. Reynolds, and R. Dehak. “Language Recognition via i-vectors and
Dimensionality Reduction,” INTERSPEECH, 2011, pp. 857-860.
[16] P. Heracleous, Y. Mohammad, K. Takai, K. Yasuda, and A. Yoneyama, "Spoken Language Identification Based on
I-vectors and Conditional Random Fields," 2018 14th International Wireless Communications & Mobile
Computing Conference (IWCMC), 2018, pp. 1443-1447, doi: 10.1109/IWCMC.2018.8450327.
[17] M. Li and L. Wenbo. "Speaker verification and spoken language identification using a generalized i-vector
framework with phonetic tokenizations and tandem features," in Fifteenth Annual Conference of the International
Speech Communication Association, 2014.
[18] D. Snyder, D. Garcia-Romero, A. McCree, G. Sell, D. Povey, and S. Khudanpur, "Spoken Language Recognition
using X-vectors," Odyssey 2018 The Speaker and Language Recognition Workshop, pp. 105-111, 2018, doi:
10.21437/odyssey.2018-15.
[19] M. Jain, M. S. Saranya, and H. A. Murthy, "An SVD Based Approach for Spoken Language Identification," 2018
International Conference on Signal Processing and Communications (SPCOM), 2018, pp. 312-316, doi:
10.1109/SPCOM.2018.8724477.
[20] H. Venkatesan, T. V. Venkatasubramanian, and J. Sangeetha, "Automatic Language Identification using Machine
learning Techniques," 2018 3rd International Conference on Communication and Electronics Systems (ICCES),
2018, pp. 583-588, doi: 10.1109/CESYS.2018.8724070.
[21] Sarthak, S. Shukla, and G. Mittal, "Spoken Language Identification Using ConvNets," Lecture Notes in Computer
Science, pp. 252-265, 2019, doi: 10.1007/978-3-030-34255-5_17.
[22] P. Heracleous, K. Takai, K. Yasuda, Y. Mohammad, and A. Yoneyama, "Comparative Study on Spoken Language
Identification Based on Deep Learning," 2018 26th European Signal Processing Conference (EUSIPCO), 2018, pp.
2265-2269, doi: 10.23919/EUSIPCO.2018.8553347.
[23] N. E. Safitri, A. Zahra, and M. Adriani. "Spoken language identification with phonotactics methods on
minangkabau, sundanese, and javanese languages," Procedia Computer Science, vol. 81, pp. 182-187, 2016, doi:
10.1016/j.procs.2016.04.047.
[24] D. Martinez, O. Plchot, L. Burget, O. Glembek, P. Matejka, ”Language Recognition in iVectors Space,”
INTERSPEECH, 2011, pp. 861-864.
[25] L. Burget, O. Plchot, S. Cumani, O. Glembek, P. Matějka and N. Brümmer, "Discriminatively trained Probabilistic
Linear Discriminant Analysis for speaker verification," 2011 IEEE International Conference on Acoustics, Speech
and Signal Processing (ICASSP), 2011, pp. 4832-4835, doi: 10.1109/ICASSP.2011.5947437.
BIOGRAPHIES OF AUTHORS
Ahmad Iqbal Abdurrahman is currently a graduate student in Computer Science
Departement of Bina Nusantara University. He received his bachelor’s degree in Information
Technology from Bina Nusantara University in 2019. His research interest include speech
technology such as Spoken Language Identification.
Amalia Zahra is a lecturer at the Master of Information Technology, Bina Nusantara
University, Indonesia. She received her bachelor’s degree in computer science from the
Faculty of Computer Science, University of Indonesia (UI) in 2008. She does not have a
master’s degree. Her PhD was obtained from the School of Computer Science and Informatics,
University College Dublin (UCD), Ireland in 2014. Her research interests cover various fields
in speech technology, such as speech recognition, spoken language identification, speaker
verification, speech emotion recognition, and so on. Additionally, she also has interest in
Natural Language Processing (NLP), computational linguistics, machine learning, and artificial
intelligence.](https://image.slidesharecdn.com/542893-210819040123/85/Spoken-language-identification-using-i-vectors-x-vectors-PLDA-and-logistic-regression-8-320.jpg)