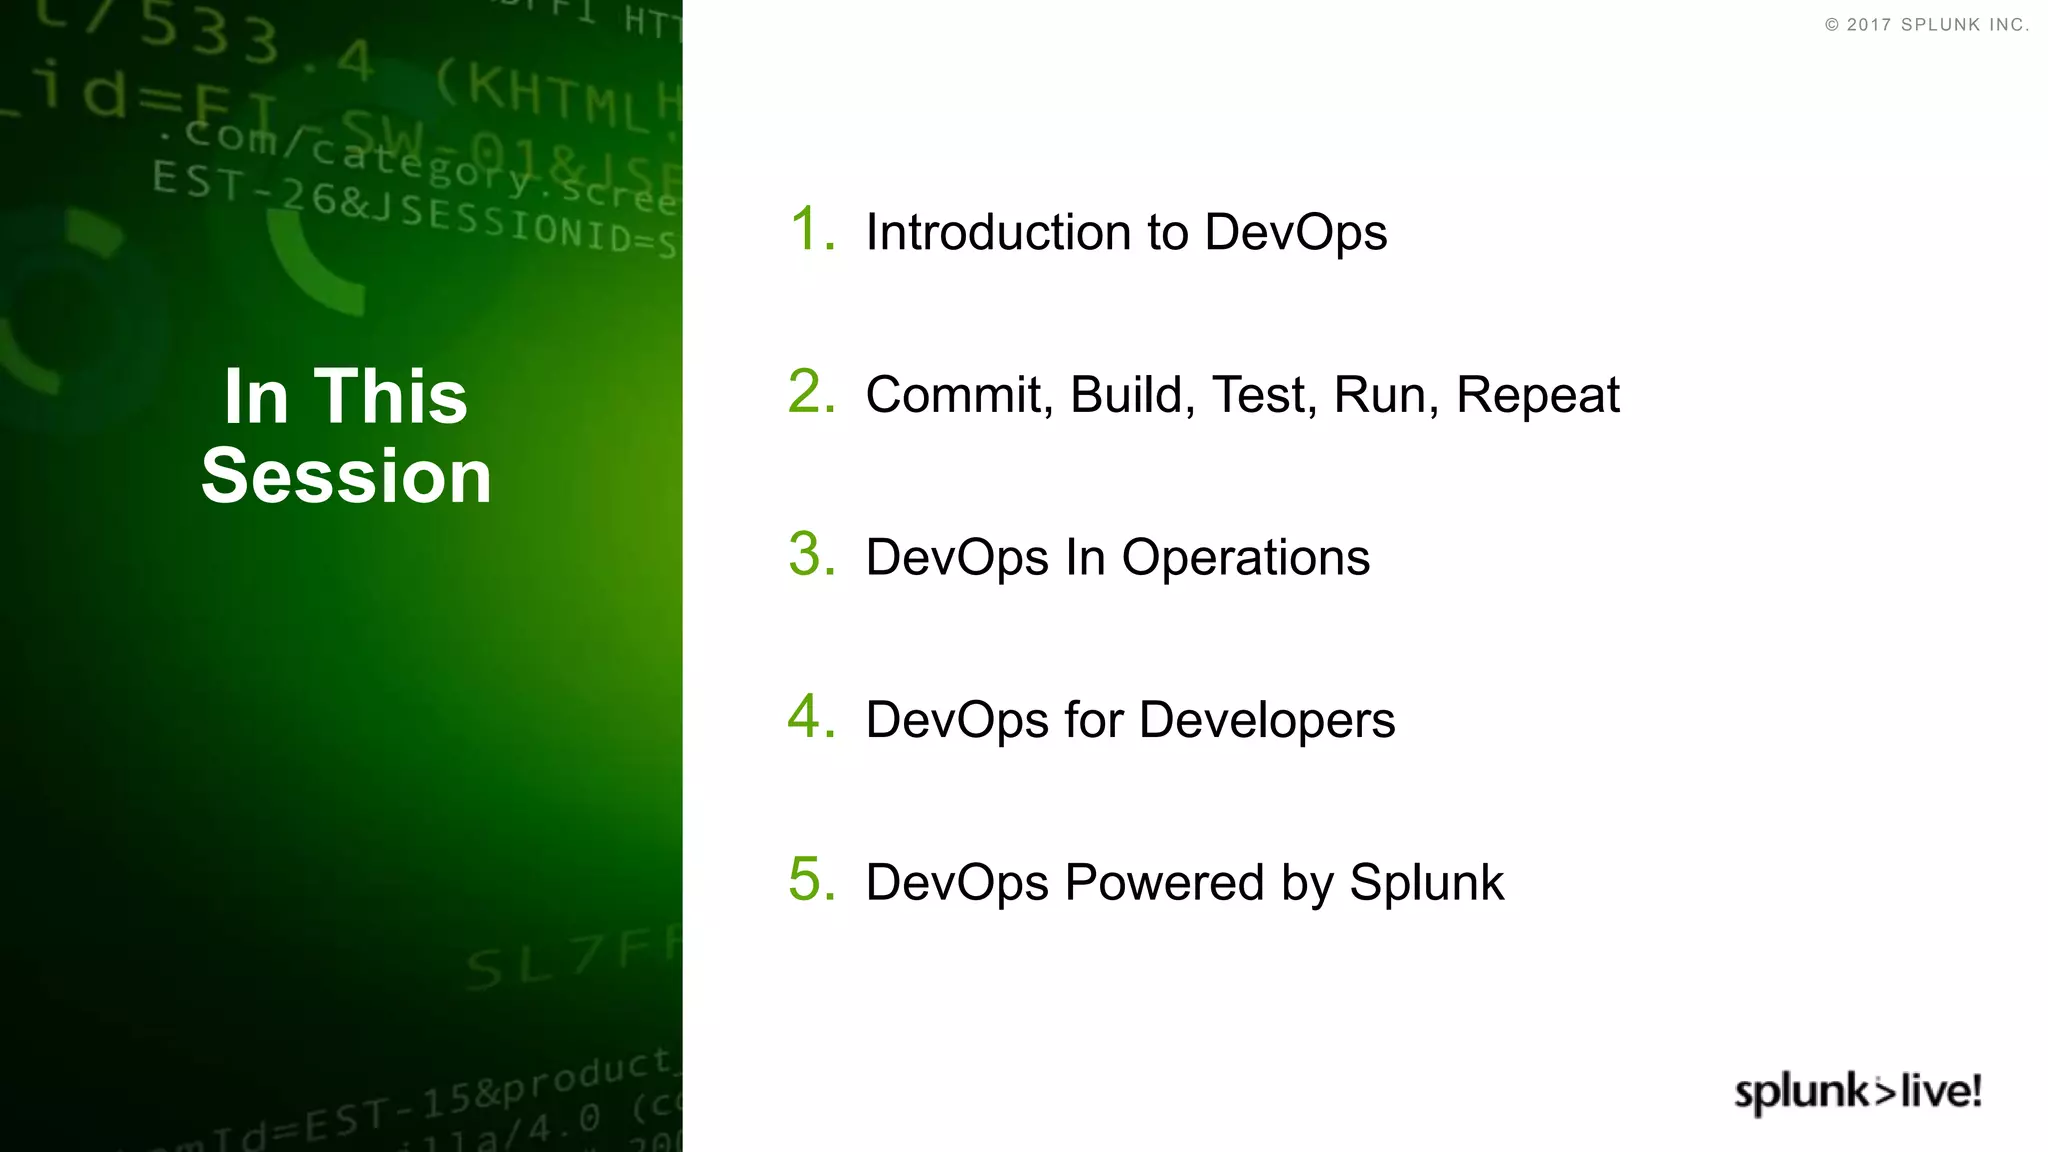
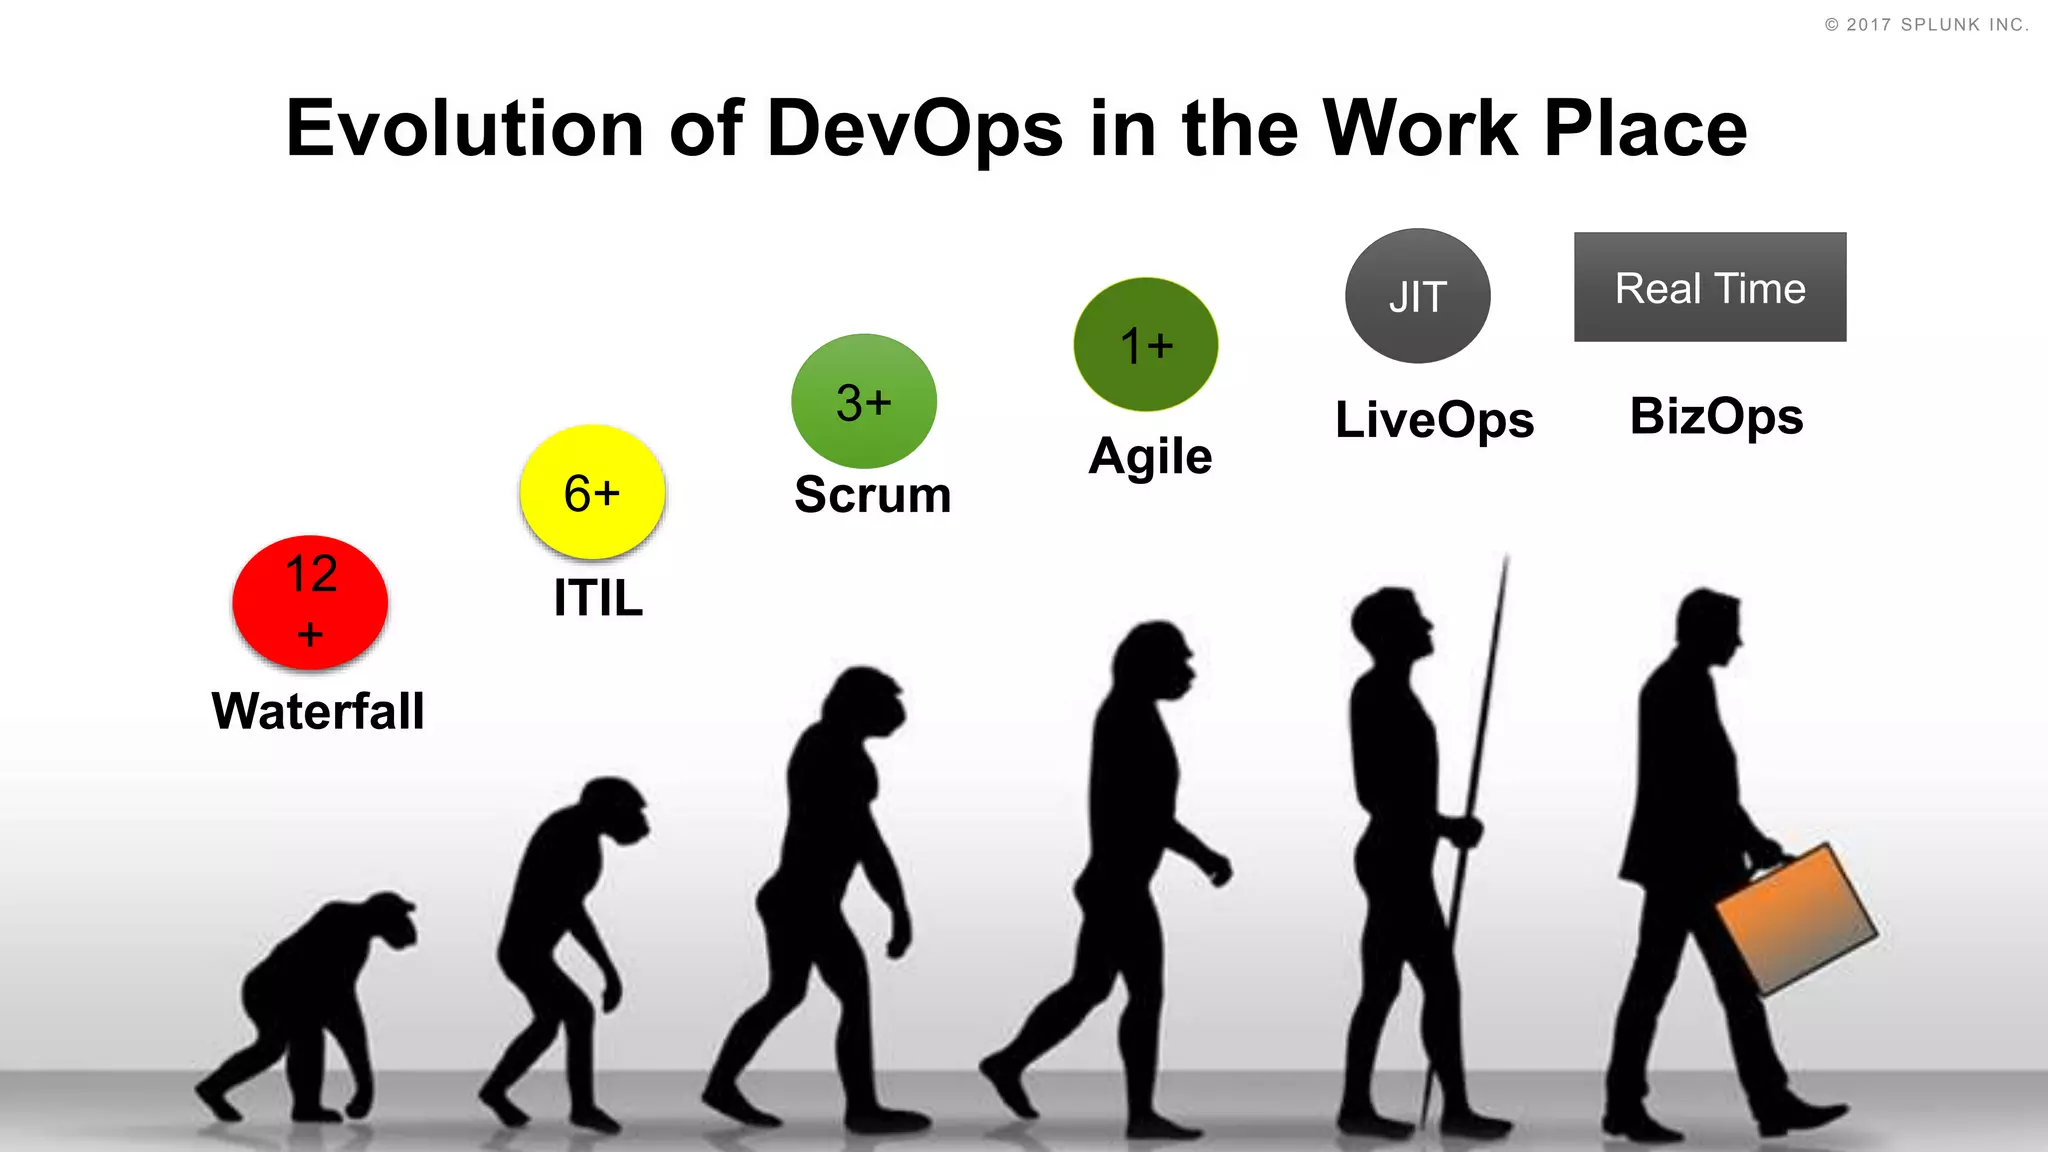
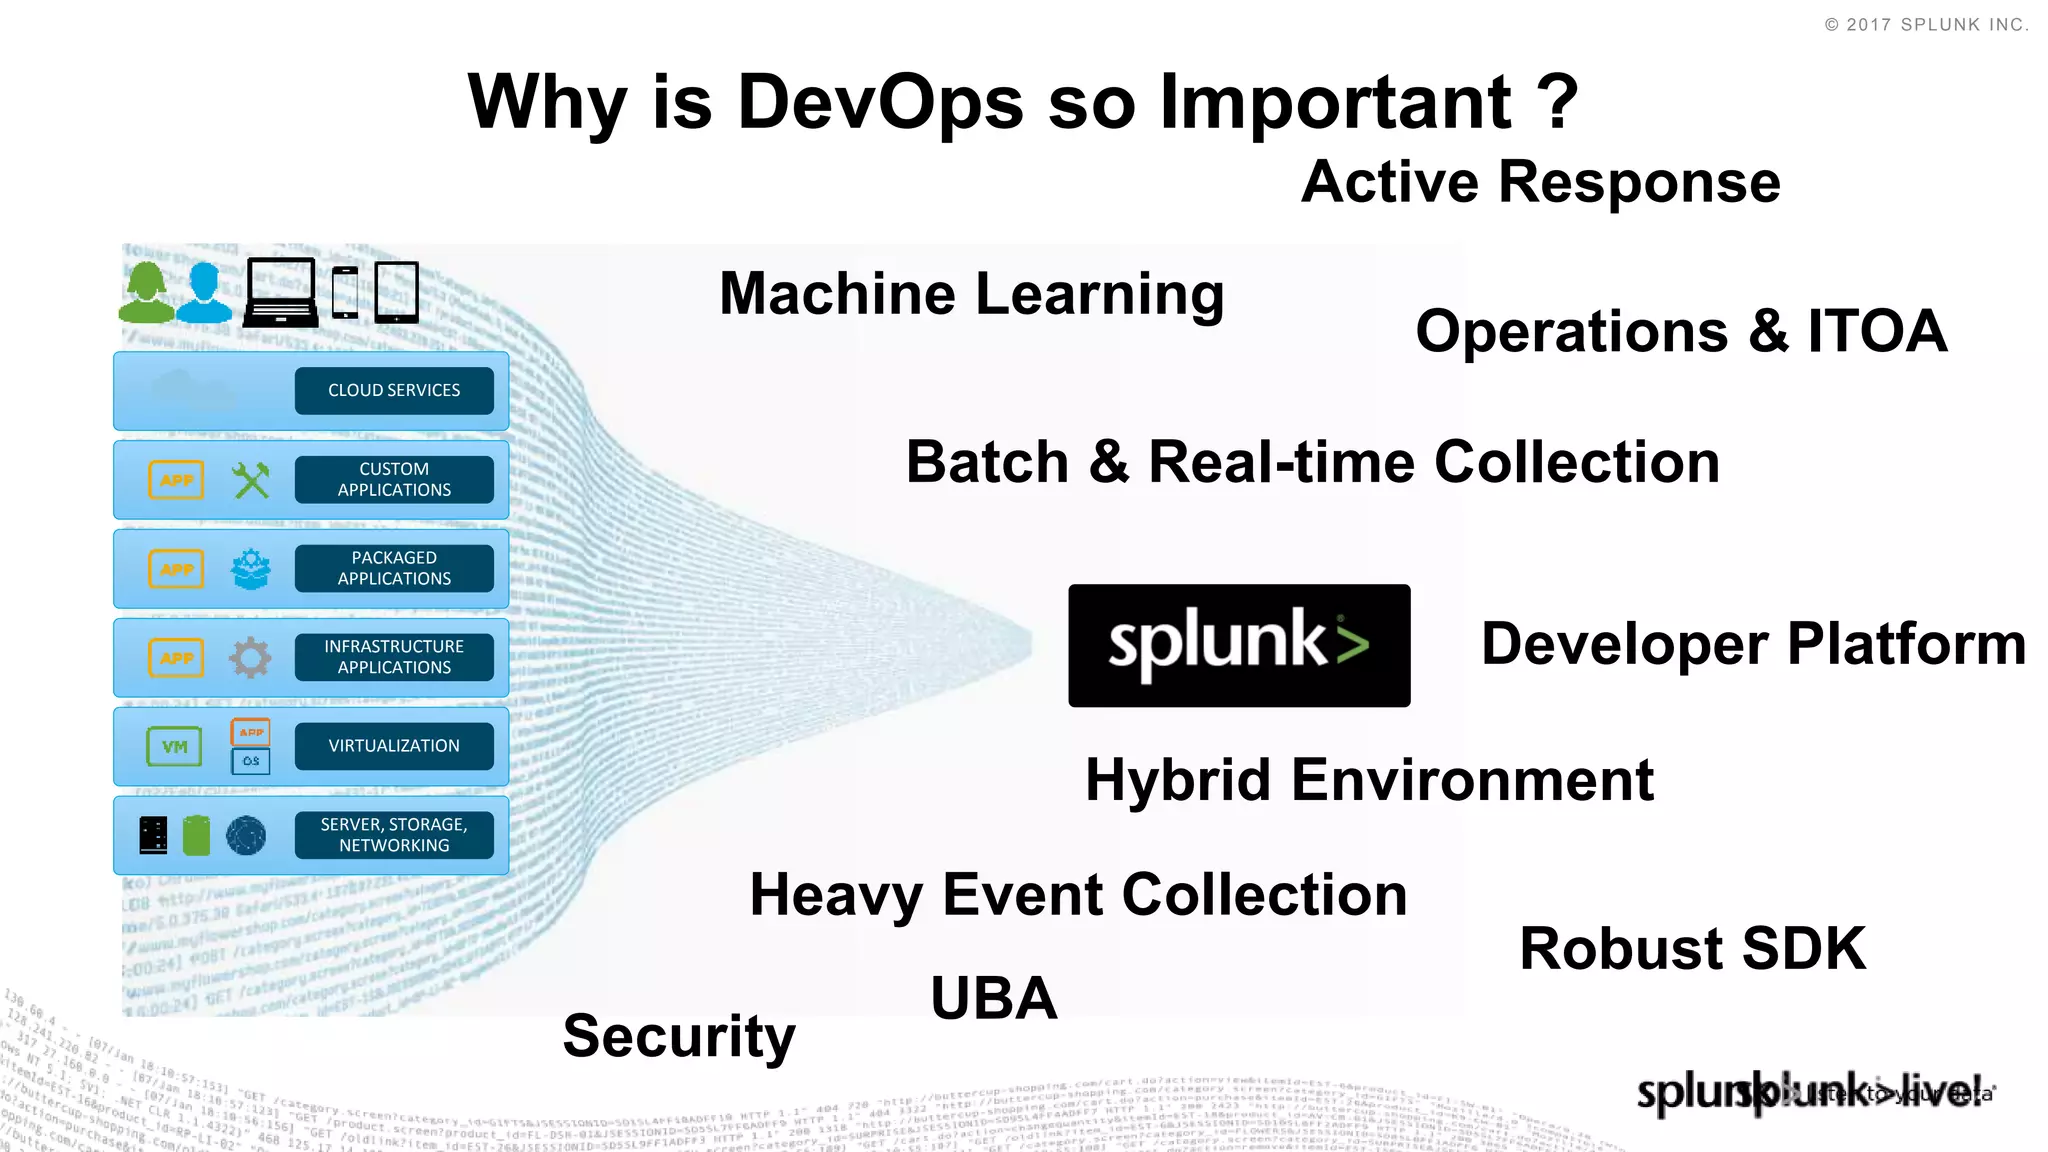
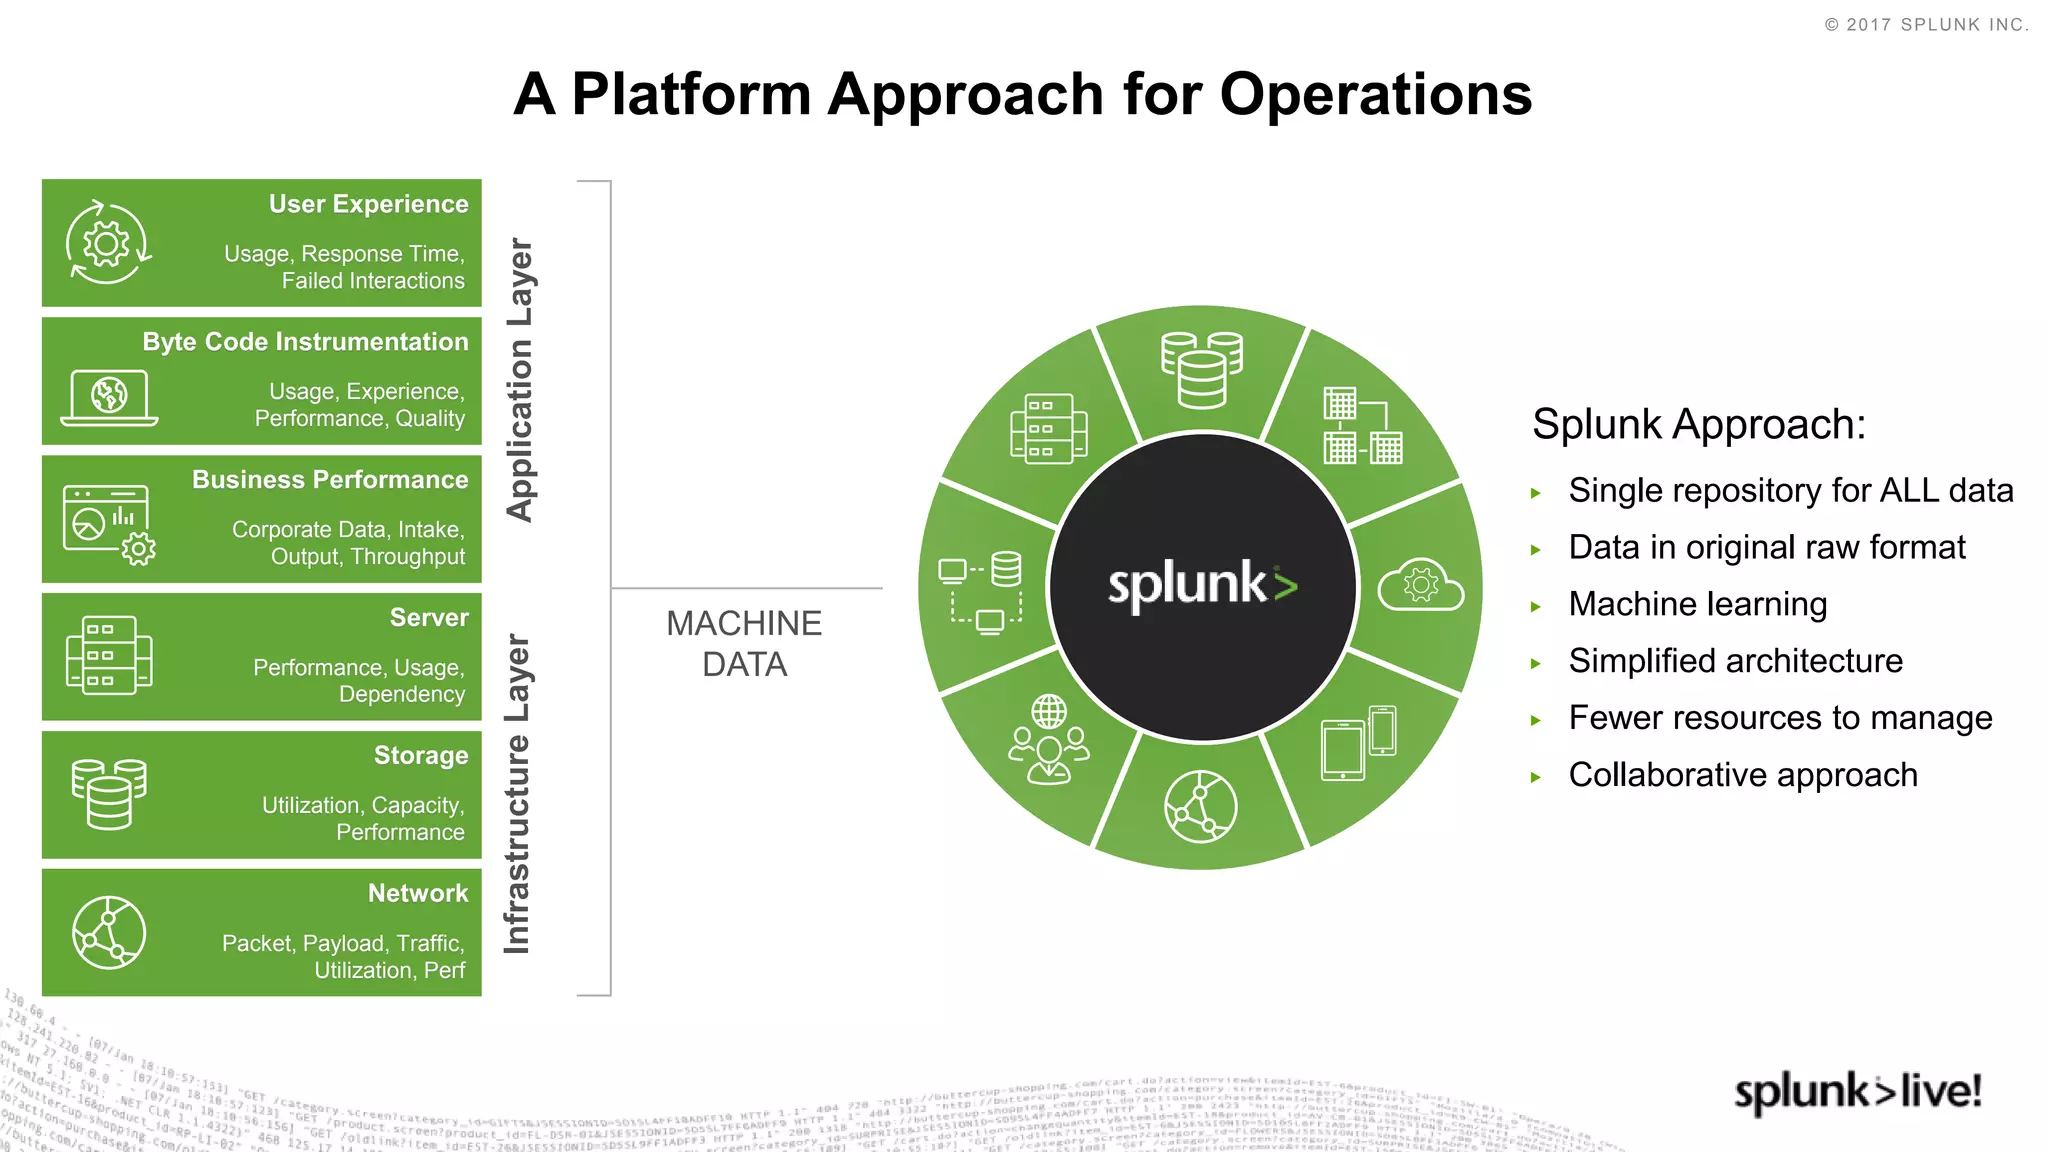
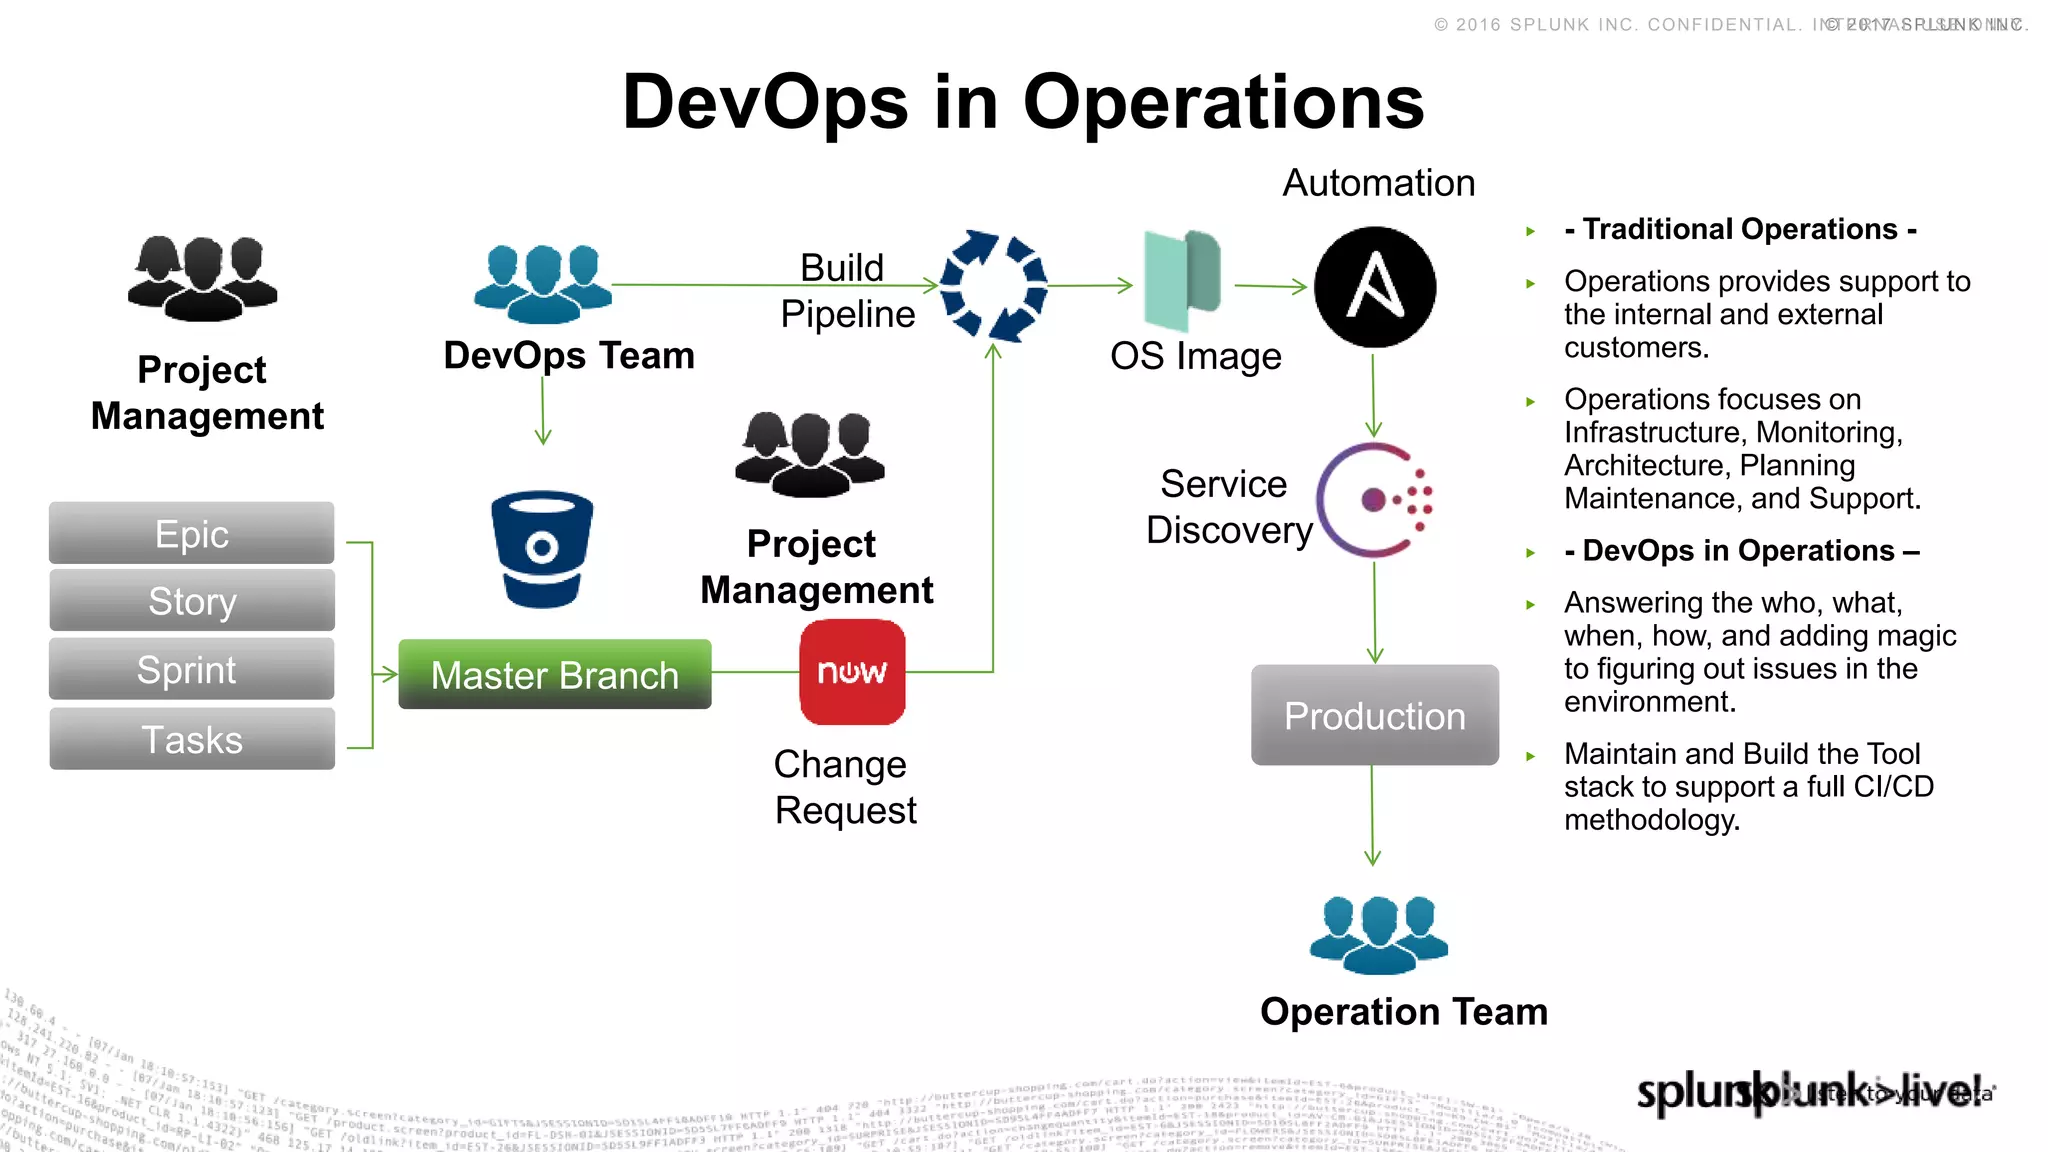
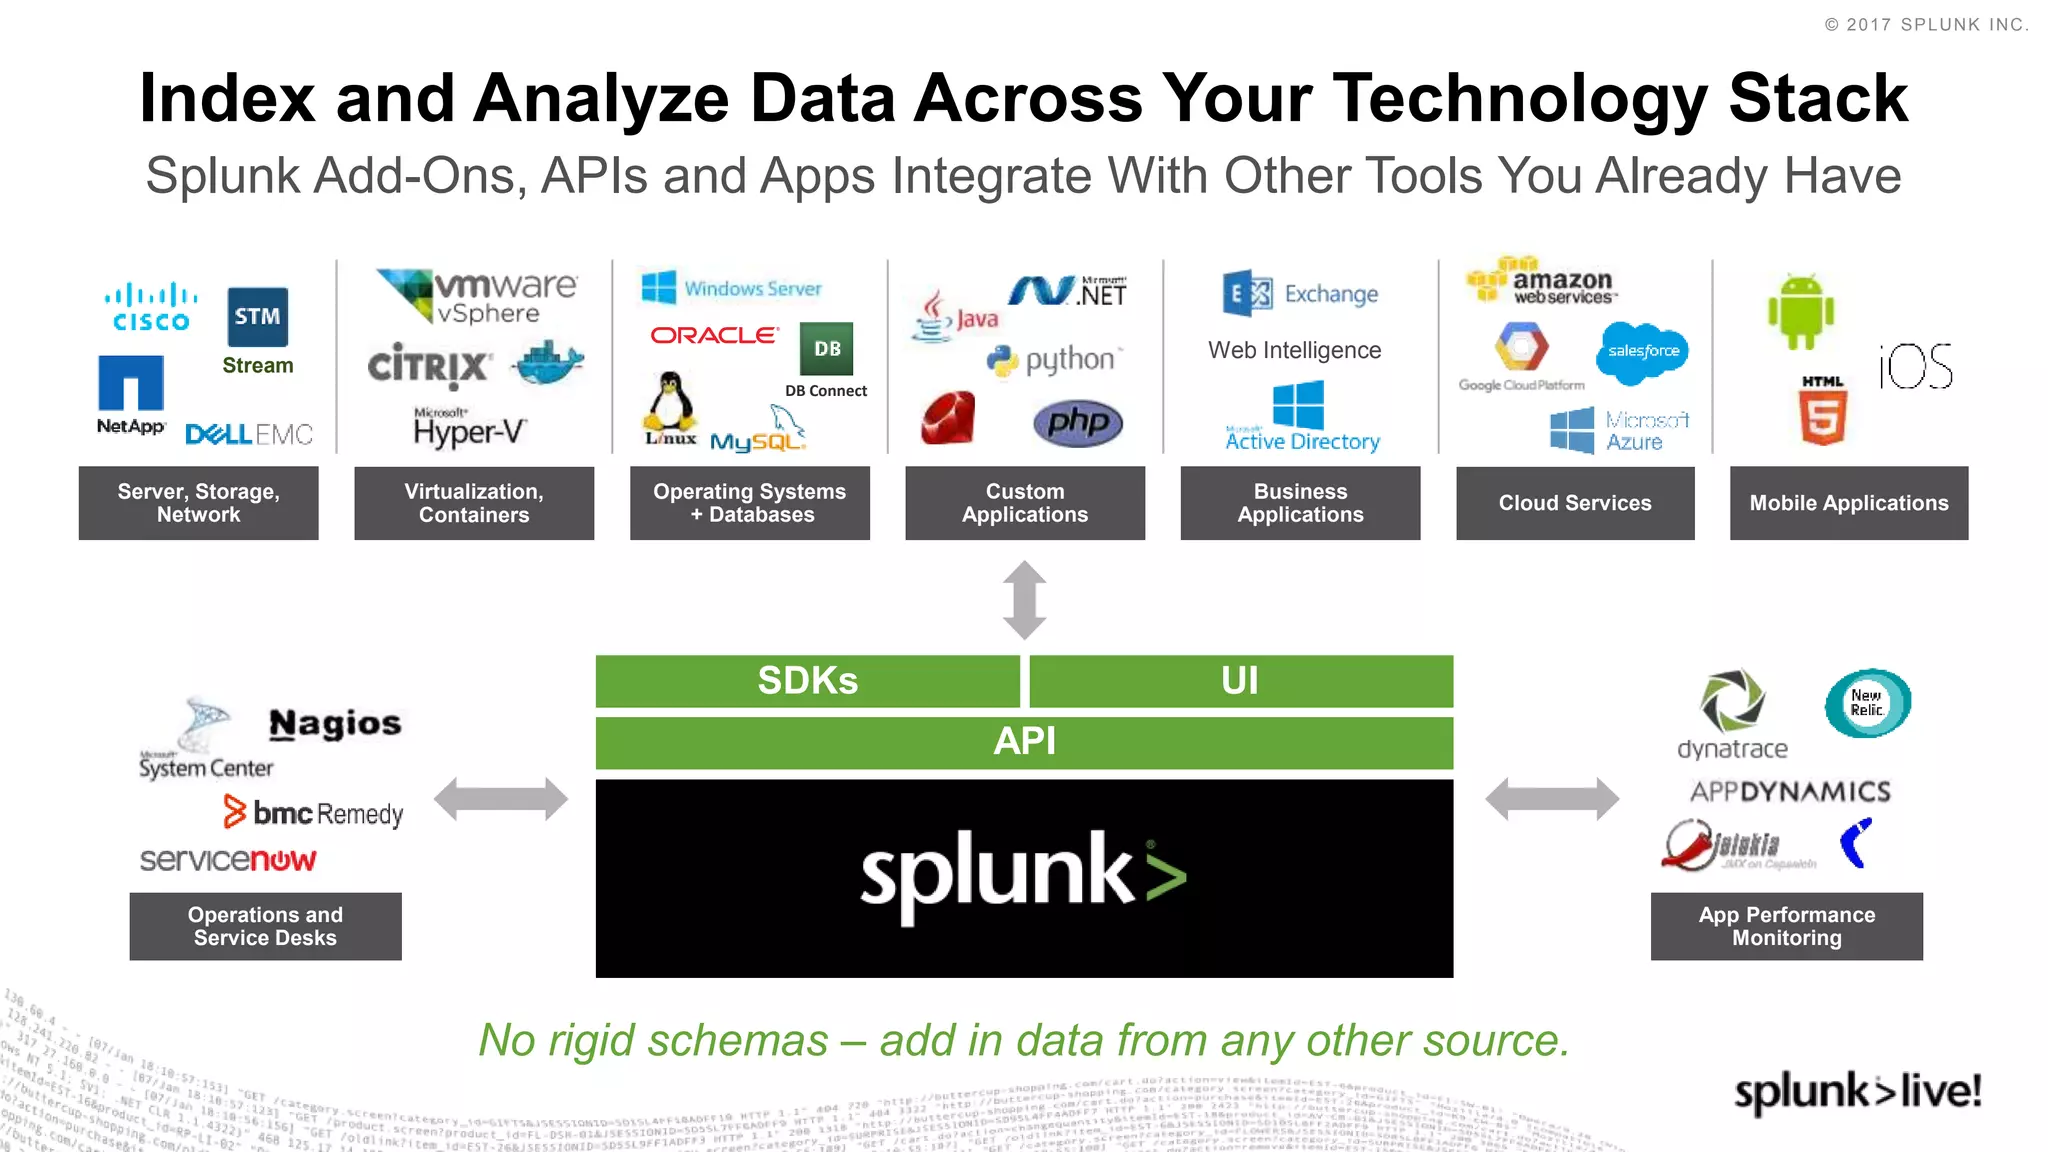
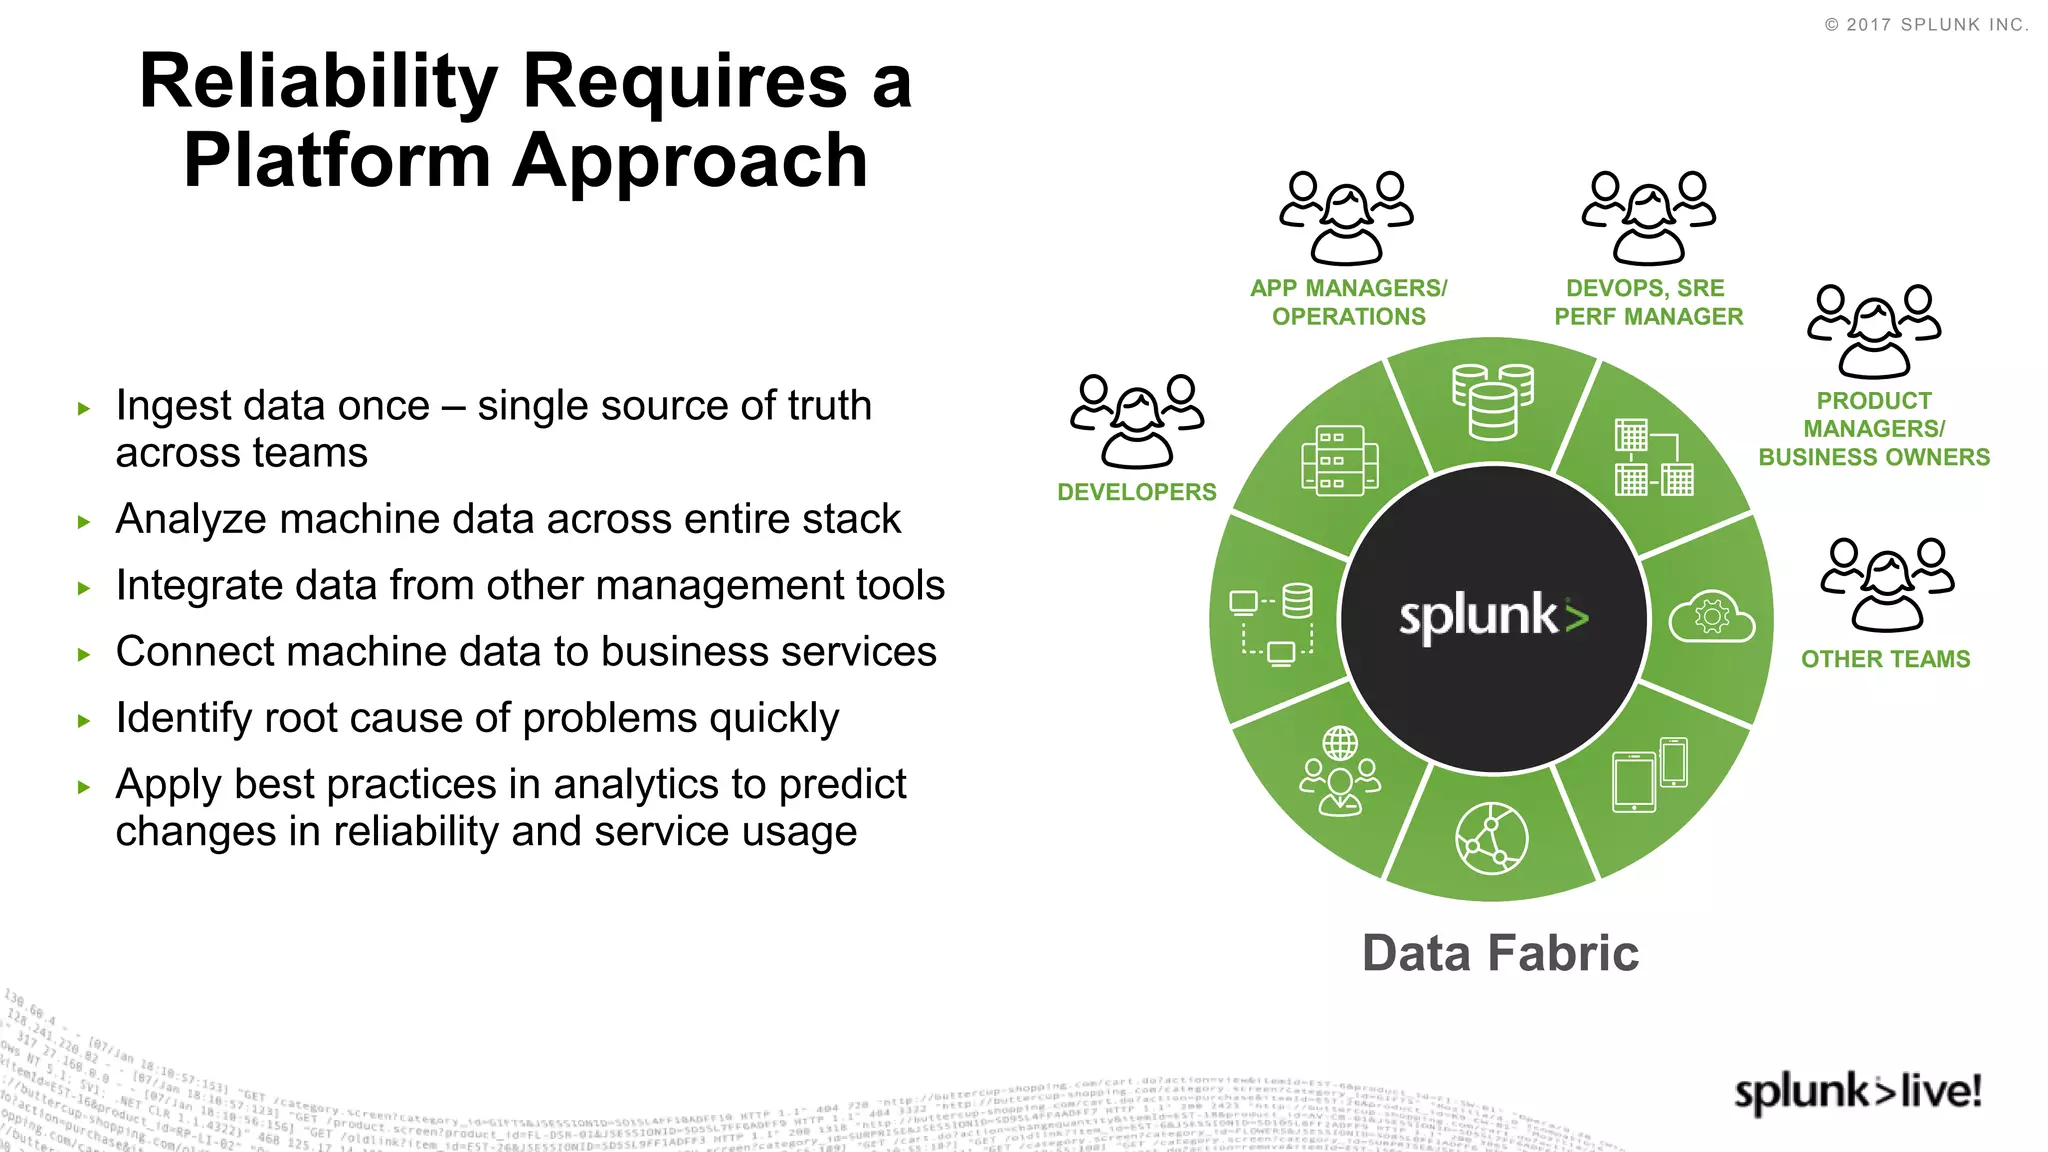
DevOps is powering the computing environments of tomorrow. When properly configured, the Splunk platform allows us to gain real-time visibility into the velocity, quality, and business impact of DevOps-driven application delivery across all roles, departments, process, and systems. Splunk can be used by DevOps practitioners to provide continuous integration/deployment and the real-time feedback to help the organisation with their operational intelligence. Join us for an exciting talk about Splunk’s current approach to DevOps, and for examples of how Splunk is being used by customers today to transform DevOps initiatives.
Insert names, and SL Date and location.
Summary: Welcome, we’d like to learn more about our audience
Key Points:
Welcome! And intros
Ask “How many are active Splunk users?”
How many of you also have APM tools? You’ll enjoy seeing what you can do with those tools when you integrate them w/ Splunk
Summary: You’ll learn more about 1) why you’ll want a platform approach, 2) Splunk’s approach and relevant technology.
Key Points:
- This is not a ”how to” session but it does provide an overview of relevant Splunk technologies
- We’ll cover the need for a platform approach and how Splunk is at the center of a complete APM approach
- We don’t just discuss, we will also show. We’ll have three demos throughout our hour together
Spacer Slide – move through this quickly…
Summary: Splunk platform approach – same data, many lenses
Key Points
- Like what you heard in the keynote this morning…
- Collect, index and analyze across data sources
- Those data sources aren’t just the parts of your stack, but also the tools you already have that’s collecting data
Summary- you can also bring data from your management tools in via an app and add-on too!
Key points
- Liberate your management data – pull it into Splunk
- Accelearate ttriage efforts
Three important things to remember:
If a logo you have doesn't show up here, Splunk still doesn't’t limit you – you can always index data from that technology – Splunk extensions simply help you accelerate the process.
We provide a full featured REST API and a variety of SDKs that help you build your own custom apps for technologies and insights custom to your business. This is to help you create a specific interface to your data in special format and development languages your team is used to.
3. To accelerate that effort even more, we introduced an Add-On Builder, which some of our team uses internally when they need to onboard new source types quickly and persistently
Spacer Slide – move through this quickly…
Lets looks at a monitoring and troubleshooting scenario with Splunk
Splunk can provide insight across the entire application delivery lifecycle. Developers can search and visualize data from entire build pipeline and production environments without needing to access production machines.
Summary: The alternative to random acts of tools – taking a platform approach, where the data coming directly from your environmnent and the tools that manage them can be indexed and analyzed by people who need that data
Key points
- Collect data once, use it in multiple use cases with multiple stakeholders
- Liberate your data – make it available to people so they can do their job
Summary – Complex technology stacks makes monitoring problems and triage more difficult than ever
Key Points
Technology Stack – more points of failure
Need to transition to “there’s a problem” to “there’s the problem” ASAP
HTTP Event Collector is easy way to send data to Splunk Enterprise. Notably, the EC enables you to send data over HTTP/ HTTPS directly to Splunk Enterprise from your application. The EC was developed with application developers in mind, so that all it takes is a few lines of code added to an app for the app to send data. Also, the EC is token-based, so you never need to hard-code your Splunk Enterprise credentials in your app or supporting files. HTTP Event Collector provides a new way for developers to send application logging and metrics directly to Splunk Enterprise via HTTP in a highly efficient, scalable and secure manner
What makes Splunk ITSI different is not only all the cool visualizations that you just saw in the premium solution, but more importantly, the platform that it was built on top of.
Just about every CIO or Ops Executive we talk to is frustrated with Manual Integration within and across tools and Correlation issues with their current Service Management and Monitoring Solutions. The number of tools they’ve had to buy, deploy, administer, and attempt to integrate just don’t live up to their original promises.
An impact of this lack of integration and correlation is the customer’s difficulty meeting or accurately measuring their SLAs.
One way that Splunk differs from existing approaches is that it is a Universal Machine Data Platform which allows you to reliably collect, index, prepare and store data from tens of thousands of sources, in real time -- any type, any format, any location with no pre-defined schema. We are data driven. We take in all the data. Splunk is also in network latent real time and can leverage historical data as well.
To avoid the problems associated with adding or changing Alerts, Splunk delivers Schema on the Fly to provide for rapid creation of alerts from either KPIs or raw data to adapt to business needs quickly. Splunk applies structure at search time, making it easy to search, visualize and analyze your data without any knowledge of the underlying structure. No DBA is required! We also use machine learning to baseline normal operations, detect anomalous behavior to drive meaningful actions, and enable highly correlated searches to create meaningful “alerts” off your KPIs, not ours. And, you get the information from the data that you need when you need it. With Splunk, you can ask any question of the data any time!
Splunk’s powerful platform helps you to realize faster time to value as it leverages all of the data, allows you to answer any questions of the data and empowers the greatest data fidelity
With existing Event Driven solutions, our customers tell us that getting true Service Intelligence is a challenge. Today, Service Owners tell us that they determine Service Health through summarized events that have limited retention time.
The business impact here surrounds the time and expense in identifying root cause and fixing the problem
To address this, Splunk ITSI delivers a 360 degree view of service health from one place. We call this Full Fidelity Service Health. We allow for adaptable and flexible definitions of service health. Customers can now move seamlessly from Business Service Reports to Remediation, all while providing complete historical context. Our solution remains adaptable and yet still maintains complete historical context. Want to visualize and measure what was happening 10 minutes ago?… an hour ago?… Not a problem. This unique differentiation enables Splunk ITSI to deliver a seamless, connected experience from reporting through to remediation.
The ability to leverage Deep Dive Incident Reviews, delivers event, metrics and KPIs – including ad hoc, on the fly searches – you can see and correlate complex interactions easily. And like we just discussed, with full access to historical data, you can compare any two time ranges for all data sets side by side to quickly understand what’s ‘normal’ for that Service by minute, hour, day or week regardless of size or scale.
Every day we hear from customers that change is a constant and the Legacy Service Management solutions struggle with keeping up. With Legacy Solutions, Service Definitions come from Legacy CMDBs that come with questionable data quality. We also hear that it is hard to create new KPIs to keep everything relevant to the Business.
The impact that we hear from Service Owners is that the business perceives IT as being inefficient.
So what else does Splunk ITSI do here that is different? Search Based KPIs deliver a flexible way to impose schema only at retrieval, without a pre-defined schema or hard coded collectors. Often the business may need to see new KPIs or change existing ones. You can easily write, manage and change both services and KPIs so that you can best align business and technology priorities. An example of this in action comes from one of our Beta customers, Fiserve. With Splunk ITSI, Fiserve was able to generate 1000s of KPIs in a manner of weeks. They were able to easily write, manage and change both services and KPIs.
Splunk runs on-prem, in the Cloud or in hybrid environments while collecting data from all the newest technologies.
Our visualizations and analytics are one-of-a-kind. They can be personalized, meaningful, and contextual. Better visualizations and analytics provide and enable IT with actionable insights. Every one can look at the data in the manner that is most relevant to them.
Summary: In addtion to a platform, we have solutions that use that platform for faster TTV and expanded value
Key Points
Platform – collect, index, analyze data
Solution – IT Service Intelligence – enables improved event analytics, service monitoring – you’ll see more later!
Summary: Some apps are built by Splunk – Splunk Stream allows you to use network packet contents as a data source for Splunk
Key Points
- Can’t always install a forwarder, sometime the network is the ONLY source we have
- It’s not just about packet routing, there is valuable application insight inside those packets
Summary: Mobile Apps have additional requirements – Splunk Mobile Intelligence give you insight on usage, performance and problems with the mobile app
Key Points:
- Splunk MINT – visibility to crash stack traces, usage (what OS/HW are people using for your mobile apps), transaction performance
- SDK based – developers initialize the SDK in their apps
Summary: If your apps are on AWS, you can get even more insight thanks to AWS data sources + Splunk
Key Points
- Get insight into resource usage and AWS config on Splunk
- Cloudwatch, CloudTrail and 15 other AWS-based data sources are included
- AWS app for Splunk is FREE – give it a try and plug in your AWS admin credentials
Summary: FamilySearch uses Splunk for insight that helps both operations and developer teams
Key Points
Founded over 100 years ago, FamilySearch International is the largest genealogy organization in the world, hosting, maintaining and sharing genealogical records at FamilySearch.org and through over 4,600 family history centers in 132 countries. FamilySearch needed a way to move to a continuous delivery model, manage its all-in migration to Amazon Web Services (AWS) and immediately troubleshoot website errors. Since beginning its effort, the organization has seen benefits including:
Challenges
Wanted to increase update release frequency
Needed to monitor and immediately detect changes to website to move to a DevOps model
Issues with troubleshooting and keeping website stable
Other Benegits
900 deploys per day
Gained back 12 developers due to efficiency
Challenges:
No single place to access and visualize machine data
Manual diagnosing and searching through data generated by servers and applications
To retrieve information, sysadmins have to ssh into production machines before sending off to developers to grep through the logs
With Splunk:
Quickly validate and troubleshoot code pushes to production
Ensure that new code does not negatively impact performance or user experience
Reduced one application’s error rate by 2 orders of magnitude in a matter of weeks
And of course, your biggest education opportunity this year is .conf2017 which will be held right back here in Washington, DC on September 25 – 28. I know you have heard a lot about .conf2017 today but don’t forget that by attending SplunkLive! today we are extending you a discount of over $450. You will be able to register with a unique link that will be sent in the post SplunkLive! emails to go out next week.