Downloaded 161 times

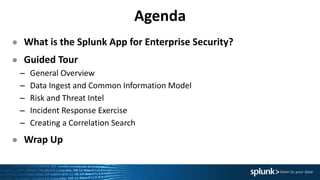


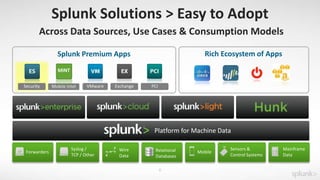
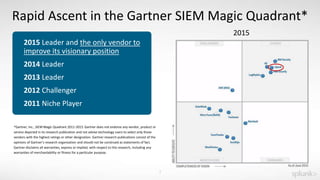
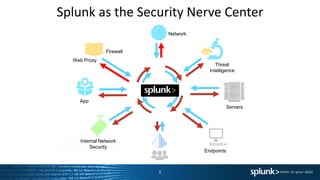


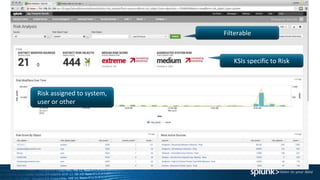
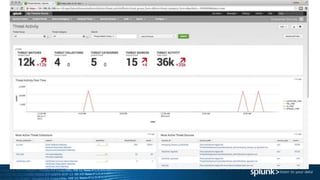
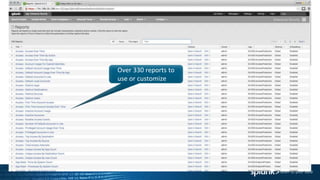
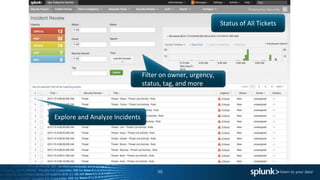


The document outlines a guided tour agenda for the Splunk Application for Enterprise Security, covering its features, data ingestion, and security analysis capabilities. It highlights Splunk's effectiveness in collecting and analyzing machine data for incident response, risk management, and compliance reporting, while also showcasing its position as a leader in the SIEM market. Key components include common information models, risk analysis dashboards, threat intelligence integration, and incident review workflows.