Download free for 30 days
Sign in
Upload
Language (EN)
Support
Business
Mobile
Social Media
Marketing
Technology
Art & Photos
Career
Design
Education
Presentations & Public Speaking
Government & Nonprofit
Healthcare
Internet
Law
Leadership & Management
Automotive
Engineering
Software
Recruiting & HR
Retail
Sales
Services
Science
Small Business & Entrepreneurship
Food
Environment
Economy & Finance
Data & Analytics
Investor Relations
Sports
Spiritual
News & Politics
Travel
Self Improvement
Real Estate
Entertainment & Humor
Health & Medicine
Devices & Hardware
Lifestyle
Change Language
Language
English
Español
Português
Français
Deutsche
Cancel
Save
EN
Uploaded by
Splunk
PDF, PPTX
900 views
Machine Data 101
AI-enhanced description
Let's create an app to organize all the work we do in this workshop
Technology
◦
Read more
0
Save
Share
Embed
Embed presentation
Download
Download as PDF, PPTX
1
/ 127
2
/ 127
3
/ 127
4
/ 127
5
/ 127
6
/ 127
7
/ 127
8
/ 127
9
/ 127
10
/ 127
11
/ 127
12
/ 127
13
/ 127
14
/ 127
15
/ 127
16
/ 127
17
/ 127
18
/ 127
19
/ 127
20
/ 127
21
/ 127
22
/ 127
23
/ 127
24
/ 127
25
/ 127
26
/ 127
27
/ 127
28
/ 127
29
/ 127
30
/ 127
31
/ 127
32
/ 127
33
/ 127
34
/ 127
35
/ 127
36
/ 127
37
/ 127
38
/ 127
39
/ 127
40
/ 127
41
/ 127
42
/ 127
43
/ 127
44
/ 127
45
/ 127
46
/ 127
47
/ 127
48
/ 127
49
/ 127
50
/ 127
51
/ 127
52
/ 127
53
/ 127
54
/ 127
55
/ 127
56
/ 127
57
/ 127
58
/ 127
59
/ 127
60
/ 127
61
/ 127
62
/ 127
63
/ 127
64
/ 127
65
/ 127
66
/ 127
67
/ 127
68
/ 127
69
/ 127
70
/ 127
71
/ 127
72
/ 127
73
/ 127
74
/ 127
75
/ 127
76
/ 127
77
/ 127
78
/ 127
79
/ 127
80
/ 127
81
/ 127
82
/ 127
83
/ 127
84
/ 127
85
/ 127
86
/ 127
87
/ 127
88
/ 127
89
/ 127
90
/ 127
91
/ 127
92
/ 127
93
/ 127
94
/ 127
95
/ 127
96
/ 127
97
/ 127
98
/ 127
99
/ 127
100
/ 127
101
/ 127
102
/ 127
103
/ 127
104
/ 127
105
/ 127
106
/ 127
107
/ 127
108
/ 127
109
/ 127
110
/ 127
111
/ 127
112
/ 127
113
/ 127
114
/ 127
115
/ 127
116
/ 127
117
/ 127
118
/ 127
119
/ 127
120
/ 127
121
/ 127
122
/ 127
123
/ 127
124
/ 127
125
/ 127
126
/ 127
127
/ 127
More Related Content
PPTX
Machine Data 101
by
Splunk
PDF
Splunk workshop-Service Intelligence
by
Splunk
PPTX
Power of SPL
by
Splunk
PPTX
Hitchhikers Guide to Service Intelligence
by
Splunk
PDF
Power of SPL
by
Splunk
PDF
Splunk workshop-2017-Power-of-SPL
by
Splunk
PDF
Reactive to Proactive: Intelligent Troubleshooting and Monitoring with Splunk
by
Splunk
PDF
Reactive to Proactive: Intelligent Troubleshooting and Monitoring with Splunk
by
Splunk
Machine Data 101
by
Splunk
Splunk workshop-Service Intelligence
by
Splunk
Power of SPL
by
Splunk
Hitchhikers Guide to Service Intelligence
by
Splunk
Power of SPL
by
Splunk
Splunk workshop-2017-Power-of-SPL
by
Splunk
Reactive to Proactive: Intelligent Troubleshooting and Monitoring with Splunk
by
Splunk
Reactive to Proactive: Intelligent Troubleshooting and Monitoring with Splunk
by
Splunk
What's hot
PDF
The Power of SPL
by
Splunk
PPTX
The Hitchhiker's Guide to Service Intelligence
by
Splunk
PPTX
Splunk Ninjas: New Features and Search Dojo
by
Splunk
PDF
Splunk Discovery Day Milwaukee 9-14-17
by
Splunk
PDF
Hitchhikers Guide to Service Intelligence
by
Splunk
PDF
Power of SPL Workshop
by
Splunk
PDF
Machine Data 101
by
Splunk
PPTX
Machine Data 101: Turning Data Into Insight
by
Splunk
PPTX
Splunk
by
Deep Mehta
PPTX
The Hitchhiker's Guide to Service Intelligence
by
Splunk
PDF
Splunk Discovery Indianapolis - October 10, 2017
by
Splunk
PDF
The Power of SPL
by
Splunk
PPTX
SplunkLive! Zurich 2017 - Data Obfuscation in Splunk Enterprise
by
Splunk
PPTX
SplunkLive! London 2017 - Splunk Enterprise for IT Troubleshooting
by
Splunk
PDF
Reactive to Proactive: Intelligent Troubleshooting and Monitoring with Splunk
by
Splunk
PPTX
SplunkLive! Zurich 2017 - Getting Started with Splunk Enterprise
by
Splunk
PDF
The Hitchhiker's Guide to Service Intelligence Workshop
by
Splunk
PDF
Using Splunk to Defend Against Advanced Threats - Webinar Slides: November 2017
by
Splunk
PPTX
SplunkLive! Zurich 2017 - Splunk Add-ons and Alerts
by
Splunk
PPTX
Splunk Discovery Brussels - September 2017
by
Splunk
The Power of SPL
by
Splunk
The Hitchhiker's Guide to Service Intelligence
by
Splunk
Splunk Ninjas: New Features and Search Dojo
by
Splunk
Splunk Discovery Day Milwaukee 9-14-17
by
Splunk
Hitchhikers Guide to Service Intelligence
by
Splunk
Power of SPL Workshop
by
Splunk
Machine Data 101
by
Splunk
Machine Data 101: Turning Data Into Insight
by
Splunk
Splunk
by
Deep Mehta
The Hitchhiker's Guide to Service Intelligence
by
Splunk
Splunk Discovery Indianapolis - October 10, 2017
by
Splunk
The Power of SPL
by
Splunk
SplunkLive! Zurich 2017 - Data Obfuscation in Splunk Enterprise
by
Splunk
SplunkLive! London 2017 - Splunk Enterprise for IT Troubleshooting
by
Splunk
Reactive to Proactive: Intelligent Troubleshooting and Monitoring with Splunk
by
Splunk
SplunkLive! Zurich 2017 - Getting Started with Splunk Enterprise
by
Splunk
The Hitchhiker's Guide to Service Intelligence Workshop
by
Splunk
Using Splunk to Defend Against Advanced Threats - Webinar Slides: November 2017
by
Splunk
SplunkLive! Zurich 2017 - Splunk Add-ons and Alerts
by
Splunk
Splunk Discovery Brussels - September 2017
by
Splunk
Similar to Machine Data 101
PPTX
Machine Data 101: Turning Data Into Insight
by
Splunk
PPTX
Getting started with Splunk Breakout Session
by
Splunk
PPTX
Getting Started with Splunk Enterprise Hands-On
by
Splunk
PPTX
SplunkLive! - Getting started with Splunk
by
Splunk
PPTX
Getting Started with Splunk Enterprise
by
Shannon Cuthbertson
PPTX
Getting Started with Splunk Enterprise
by
Splunk
PDF
Splunk4Rookies - Attendee - May 2023.pdf
by
djdhhdddhhd
PDF
Splunk workshop-Machine Data 101
by
Splunk
PPTX
Delivering New Visibility and Analytics for IT Operations
by
Splunk
PPTX
Getting Started with Splunk Enterprise
by
Splunk
PDF
Splunk Data Onboarding Overview - Splunk Data Collection Architecture
by
Splunk
PPTX
Reactive to Proactive: Intelligent Troubleshooting and Monitoring with Splunk
by
Splunk
PPTX
Machine Data 101 Hands-on
by
Splunk
PPTX
Getting Started with Splunk Enterprise
by
Splunk
PPTX
Getting started with Splunk - Break out Session
by
Georg Knon
PPTX
Getting started with Splunk
by
Splunk
PPTX
Data Onboarding Breakout Session
by
Splunk
PDF
Machine Data 101 Workshop
by
Splunk
PPTX
SplunkLive! Frankfurt 2018 - Data Onboarding Overview
by
Splunk
PDF
Splunk-7.x-Fundamentals-Part-1-eLearning (2).pdf
by
chaithramj1
Machine Data 101: Turning Data Into Insight
by
Splunk
Getting started with Splunk Breakout Session
by
Splunk
Getting Started with Splunk Enterprise Hands-On
by
Splunk
SplunkLive! - Getting started with Splunk
by
Splunk
Getting Started with Splunk Enterprise
by
Shannon Cuthbertson
Getting Started with Splunk Enterprise
by
Splunk
Splunk4Rookies - Attendee - May 2023.pdf
by
djdhhdddhhd
Splunk workshop-Machine Data 101
by
Splunk
Delivering New Visibility and Analytics for IT Operations
by
Splunk
Getting Started with Splunk Enterprise
by
Splunk
Splunk Data Onboarding Overview - Splunk Data Collection Architecture
by
Splunk
Reactive to Proactive: Intelligent Troubleshooting and Monitoring with Splunk
by
Splunk
Machine Data 101 Hands-on
by
Splunk
Getting Started with Splunk Enterprise
by
Splunk
Getting started with Splunk - Break out Session
by
Georg Knon
Getting started with Splunk
by
Splunk
Data Onboarding Breakout Session
by
Splunk
Machine Data 101 Workshop
by
Splunk
SplunkLive! Frankfurt 2018 - Data Onboarding Overview
by
Splunk
Splunk-7.x-Fundamentals-Part-1-eLearning (2).pdf
by
chaithramj1
More from Splunk
PDF
Splunk Leadership Forum Wien - 20.05.2025
by
Splunk
PDF
Splunk Security Update | Public Sector Summit Germany 2025
by
Splunk
PDF
Building Resilience with Energy Management for the Public Sector
by
Splunk
PDF
IT-Lagebild: Observability for Resilience (SVA)
by
Splunk
PDF
Nach dem SOC-Aufbau ist vor der Automatisierung (OFD Baden-Württemberg)
by
Splunk
PDF
Monitoring einer Sicheren Inter-Netzwerk Architektur (SINA)
by
Splunk
PDF
Praktische Erfahrungen mit dem Attack Analyser (gematik)
by
Splunk
PDF
Cisco XDR & Splunk SIEM - stronger together (DATAGROUP Cyber Security)
by
Splunk
PDF
Security - Mit Sicherheit zum Erfolg (Telekom)
by
Splunk
PDF
One Cisco - Splunk Public Sector Summit Germany April 2025
by
Splunk
PDF
.conf Go 2023 - Data analysis as a routine
by
Splunk
PDF
.conf Go 2023 - How KPN drives Customer Satisfaction on IPTV
by
Splunk
PDF
.conf Go 2023 - Navegando la normativa SOX (Telefónica)
by
Splunk
PDF
.conf Go 2023 - Raiffeisen Bank International
by
Splunk
PDF
.conf Go 2023 - På liv og død Om sikkerhetsarbeid i Norsk helsenett
by
Splunk
PDF
.conf Go 2023 - Many roads lead to Rome - this was our journey (Julius Bär)
by
Splunk
PDF
.conf Go 2023 - Das passende Rezept für die digitale (Security) Revolution zu...
by
Splunk
PDF
.conf go 2023 - Cyber Resilienz – Herausforderungen und Ansatz für Energiever...
by
Splunk
PDF
.conf go 2023 - De NOC a CSIRT (Cellnex)
by
Splunk
PDF
conf go 2023 - El camino hacia la ciberseguridad (ABANCA)
by
Splunk
Splunk Leadership Forum Wien - 20.05.2025
by
Splunk
Splunk Security Update | Public Sector Summit Germany 2025
by
Splunk
Building Resilience with Energy Management for the Public Sector
by
Splunk
IT-Lagebild: Observability for Resilience (SVA)
by
Splunk
Nach dem SOC-Aufbau ist vor der Automatisierung (OFD Baden-Württemberg)
by
Splunk
Monitoring einer Sicheren Inter-Netzwerk Architektur (SINA)
by
Splunk
Praktische Erfahrungen mit dem Attack Analyser (gematik)
by
Splunk
Cisco XDR & Splunk SIEM - stronger together (DATAGROUP Cyber Security)
by
Splunk
Security - Mit Sicherheit zum Erfolg (Telekom)
by
Splunk
One Cisco - Splunk Public Sector Summit Germany April 2025
by
Splunk
.conf Go 2023 - Data analysis as a routine
by
Splunk
.conf Go 2023 - How KPN drives Customer Satisfaction on IPTV
by
Splunk
.conf Go 2023 - Navegando la normativa SOX (Telefónica)
by
Splunk
.conf Go 2023 - Raiffeisen Bank International
by
Splunk
.conf Go 2023 - På liv og død Om sikkerhetsarbeid i Norsk helsenett
by
Splunk
.conf Go 2023 - Many roads lead to Rome - this was our journey (Julius Bär)
by
Splunk
.conf Go 2023 - Das passende Rezept für die digitale (Security) Revolution zu...
by
Splunk
.conf go 2023 - Cyber Resilienz – Herausforderungen und Ansatz für Energiever...
by
Splunk
.conf go 2023 - De NOC a CSIRT (Cellnex)
by
Splunk
conf go 2023 - El camino hacia la ciberseguridad (ABANCA)
by
Splunk
Recently uploaded
PDF
GenerationAI_Paris_2025_Architecting_Intelligence.pdf
by
apidays
PDF
Chapter 6 Authentication and Access Control.pdf
by
Getnet Tigabie Askale -(GM)
PDF
Transcript: Escape from the Forbidden Zone: Smuggling green and inclusive tec...
by
BookNet Canada
PDF
Reality Drift: Why Systems Keep Working After Meaning Drops Out
by
Reality Drift Archive | A. Jacobs
PDF
February 2026 Patch Tuesday hosted by Chris Goettl and Todd Schell
by
Ivanti
PDF
apidays Paris 2025 | Zero Trust By Design
by
apidays
PDF
GTM-and-Sales-Plan for a cyber security product
by
Ashish Jangir
PPTX
Exploring-AI-Basics in Artificial Intelligence
by
sharmilas219546
PPTX
Introducing VisualSim 2610 The Next Leap in System Level Modeling
by
Deepak Shankar
PDF
Founder & Tech Lead | Web Development & Digital Growth Consultant | Helping B...
by
Shyamal Das
PDF
HOW TO OVERCOME THE THREATS OF ARTIFICIAL INTELLIGENCE AGAINST HUMANITY.pdf
by
Faga1939
PDF
GDG Cloud Southlake #49: Pradeep R Kumar: Implications of Agentic AI for Iden...
by
James Anderson
PDF
Digital Twin in IBM for Accelerated Discovery of Climate & Sustainability, K...
by
Michiaki Tatsubori
PDF
How AI Can Help Platform Engineers Build Better Platforms
by
All Things Open
PDF
Empower your IT team with cloud-based PC management using Dell Management Por...
by
Principled Technologies
PDF
AI Vector Search Best Practices Multicloud Feb 2026
by
Sandesh Rao
PDF
Towards a Vibrant AI Hardware Accelerator Ecosystem, invited talk at the 4th ...
by
Michiaki Tatsubori
PDF
Logical Optimal Actions – Towards Knowledge-based Reinforcement Learning with...
by
Michiaki Tatsubori
PDF
UiPath Automation Developer Associate Training Series 2025 - Session 4
by
DianaGray10
PDF
Automated Governance for FME Flow: Smarter Admin at Scale
by
Safe Software
GenerationAI_Paris_2025_Architecting_Intelligence.pdf
by
apidays
Chapter 6 Authentication and Access Control.pdf
by
Getnet Tigabie Askale -(GM)
Transcript: Escape from the Forbidden Zone: Smuggling green and inclusive tec...
by
BookNet Canada
Reality Drift: Why Systems Keep Working After Meaning Drops Out
by
Reality Drift Archive | A. Jacobs
February 2026 Patch Tuesday hosted by Chris Goettl and Todd Schell
by
Ivanti
apidays Paris 2025 | Zero Trust By Design
by
apidays
GTM-and-Sales-Plan for a cyber security product
by
Ashish Jangir
Exploring-AI-Basics in Artificial Intelligence
by
sharmilas219546
Introducing VisualSim 2610 The Next Leap in System Level Modeling
by
Deepak Shankar
Founder & Tech Lead | Web Development & Digital Growth Consultant | Helping B...
by
Shyamal Das
HOW TO OVERCOME THE THREATS OF ARTIFICIAL INTELLIGENCE AGAINST HUMANITY.pdf
by
Faga1939
GDG Cloud Southlake #49: Pradeep R Kumar: Implications of Agentic AI for Iden...
by
James Anderson
Digital Twin in IBM for Accelerated Discovery of Climate & Sustainability, K...
by
Michiaki Tatsubori
How AI Can Help Platform Engineers Build Better Platforms
by
All Things Open
Empower your IT team with cloud-based PC management using Dell Management Por...
by
Principled Technologies
AI Vector Search Best Practices Multicloud Feb 2026
by
Sandesh Rao
Towards a Vibrant AI Hardware Accelerator Ecosystem, invited talk at the 4th ...
by
Michiaki Tatsubori
Logical Optimal Actions – Towards Knowledge-based Reinforcement Learning with...
by
Michiaki Tatsubori
UiPath Automation Developer Associate Training Series 2025 - Session 4
by
DianaGray10
Automated Governance for FME Flow: Smarter Admin at Scale
by
Safe Software
Machine Data 101
1.
© 2017 SPLUNK
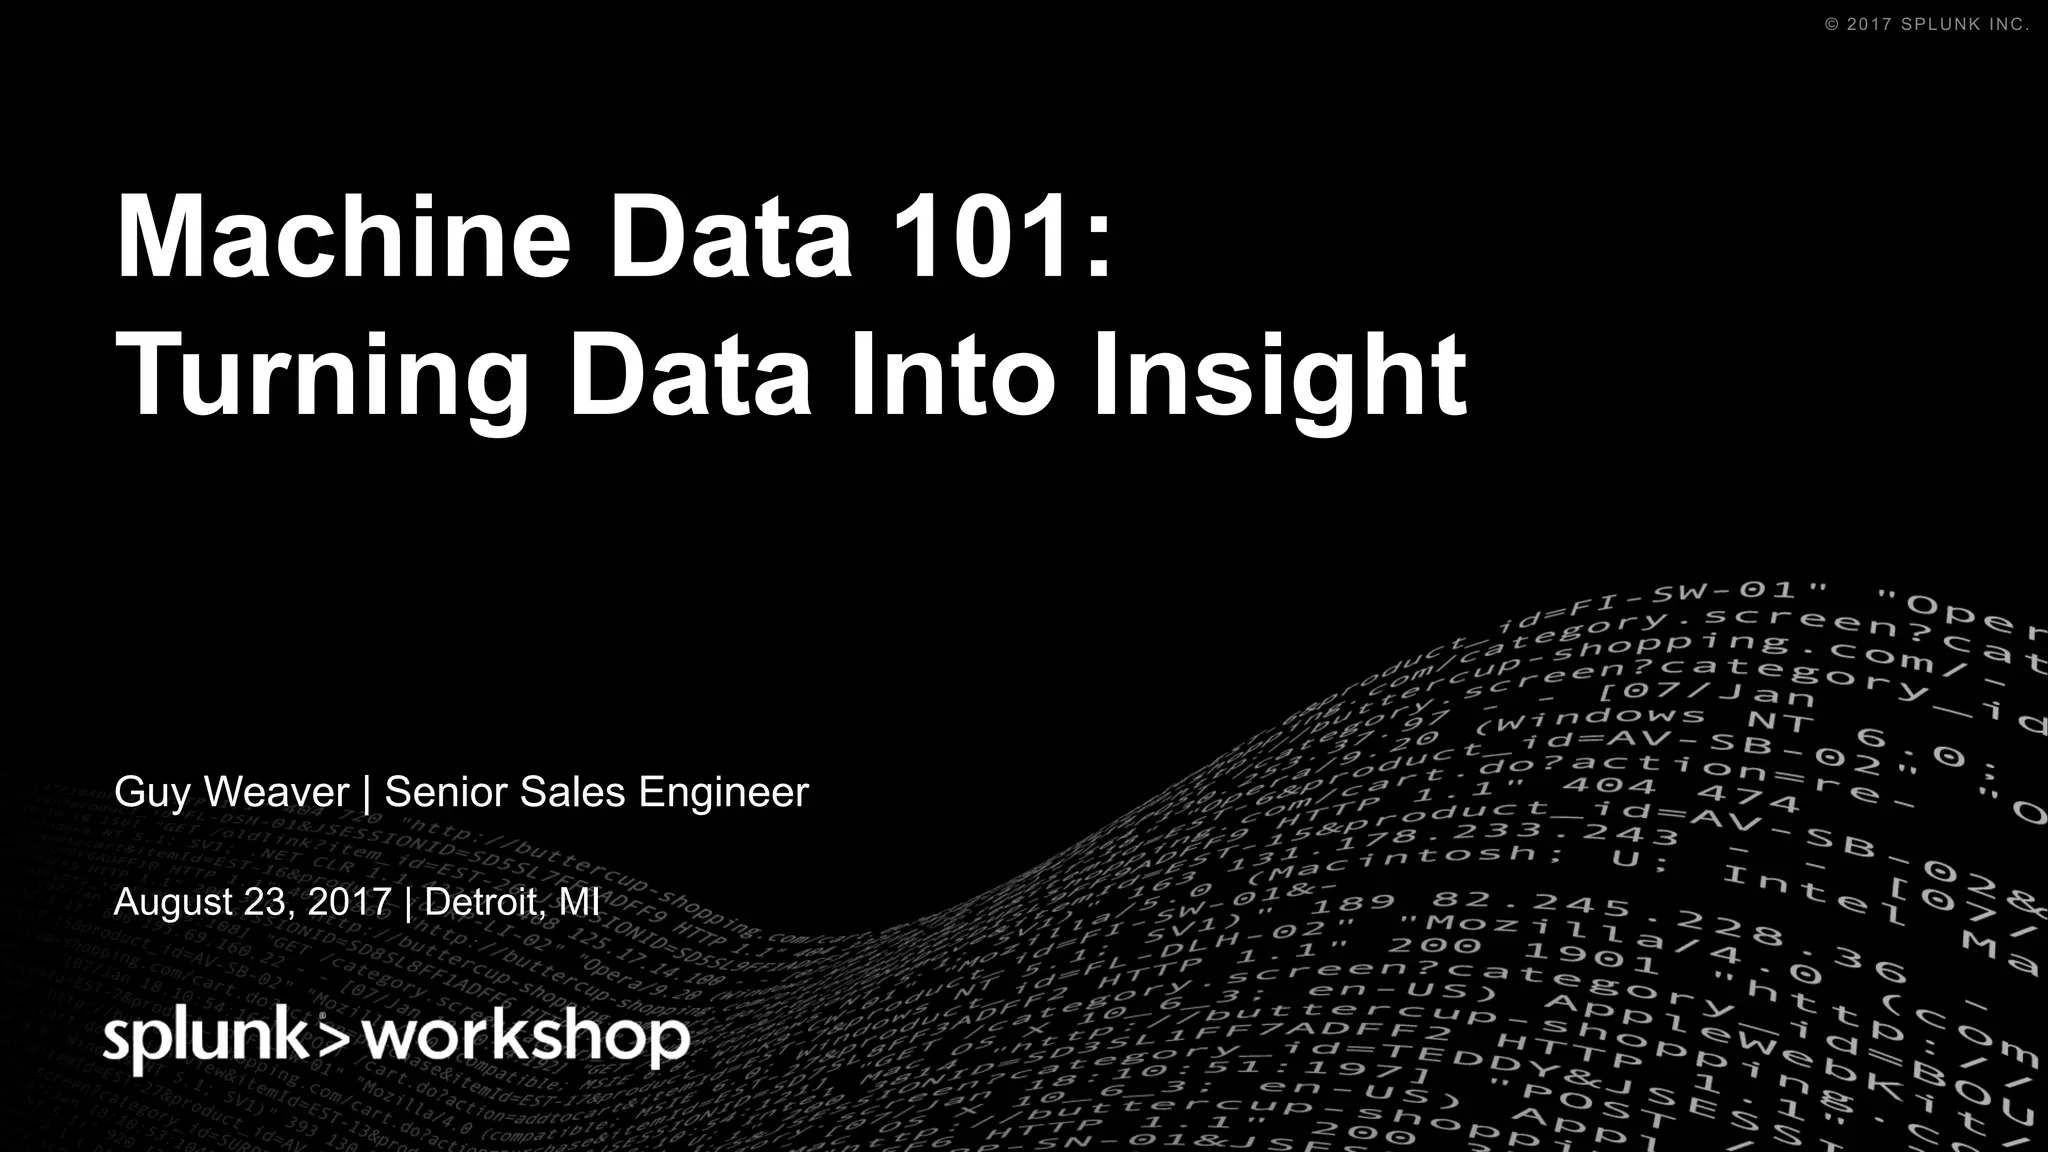
INC.© 2017 SPLUNK INC. Machine Data 101: Turning Data Into Insight Guy Weaver | Senior Sales Engineer August 23, 2017 | Detroit, MI
2.
© 2017 SPLUNK
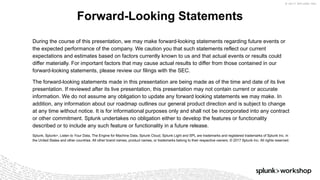
INC. During the course of this presentation, we may make forward-looking statements regarding future events or the expected performance of the company. We caution you that such statements reflect our current expectations and estimates based on factors currently known to us and that actual events or results could differ materially. For important factors that may cause actual results to differ from those contained in our forward-looking statements, please review our filings with the SEC. The forward-looking statements made in this presentation are being made as of the time and date of its live presentation. If reviewed after its live presentation, this presentation may not contain current or accurate information. We do not assume any obligation to update any forward looking statements we may make. In addition, any information about our roadmap outlines our general product direction and is subject to change at any time without notice. It is for informational purposes only and shall not be incorporated into any contract or other commitment. Splunk undertakes no obligation either to develop the features or functionality described or to include any such feature or functionality in a future release. Splunk, Splunk>, Listen to Your Data, The Engine for Machine Data, Splunk Cloud, Splunk Light and SPL are trademarks and registered trademarks of Splunk Inc. in the United States and other countries. All other brand names, product names, or trademarks belong to their respective owners. © 2017 Splunk Inc. All rights reserved. Forward-Looking Statements
3.
© 2017 SPLUNK
INC.© 2017 SPLUNK INC. © 2017 SPLUNK INC.
4.
© 2017 SPLUNK
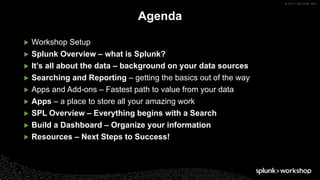
INC. ▶ Workshop Setup ▶ Splunk Overview – what is Splunk? ▶ It’s all about the data – background on your data sources ▶ Searching and Reporting – getting the basics out of the way ▶ Apps and Add-ons – Fastest path to value from your data ▶ Apps – a place to store all your amazing work ▶ SPL Overview – Everything begins with a Search ▶ Build a Dashboard – Organize your information ▶ Resources – Next Steps to Success! Agenda
5.
© 2017 SPLUNK
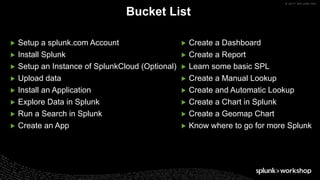
INC. ▶ Setup a splunk.com Account ▶ Install Splunk ▶ Setup an Instance of SplunkCloud (Optional) ▶ Upload data ▶ Install an Application ▶ Explore Data in Splunk ▶ Run a Search in Splunk ▶ Create an App Bucket List ▶ Create a Dashboard ▶ Create a Report ▶ Learn some basic SPL ▶ Create a Manual Lookup ▶ Create and Automatic Lookup ▶ Create a Chart in Splunk ▶ Create a Geomap Chart ▶ Know where to go for more Splunk
6.
© 2017 SPLUNK
INC. Workshop Setup
7.
© 2017 SPLUNK
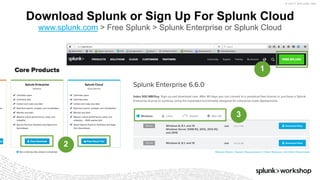
INC. Download Splunk or Sign Up For Splunk Cloud www.splunk.com > Free Splunk > Splunk Enterprise or Splunk Cloud 1 2 3
8.
© 2017 SPLUNK
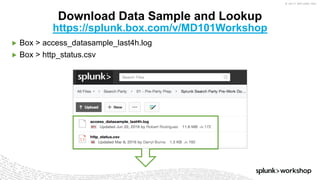
INC. ▶ Box > access_datasample_last4h.log ▶ Box > http_status.csv Download Data Sample and Lookup https://splunk.box.com/v/MD101Workshop
9.
© 2017 SPLUNK
INC. Getting to know Splunk And so we begin...
10.
© 2017 SPLUNK
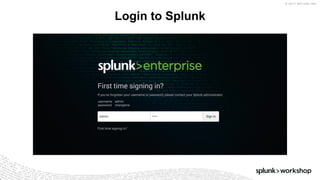
INC. Login to Splunk
11.
© 2017 SPLUNK
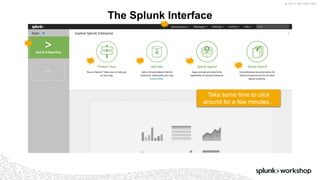
INC. The Splunk Interface Take some time to click around for a few minutes...
12.
© 2017 SPLUNK
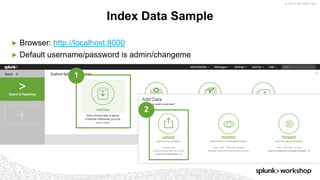
INC. ▶ Browser: http://localhost:8000 ▶ Default username/password is admin/changeme Index Data Sample 1 2
13.
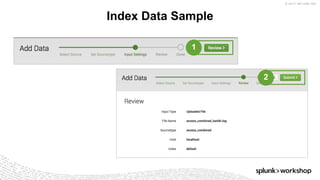
© 2017 SPLUNK
INC. Index Data Sample 3 2 1 4 5
14.
© 2017 SPLUNK
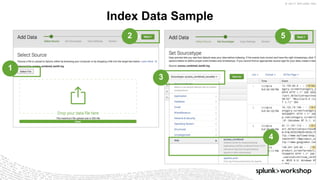
INC. Index Data Sample 1 2
15.
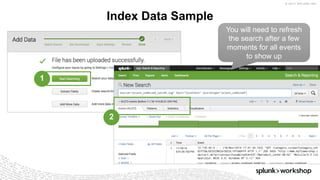
© 2017 SPLUNK
INC. Index Data Sample 1 2 You will need to refresh the search after a few moments for all events to show up
16.
© 2017 SPLUNK
INC. Splunk Cloud And so we begin...
17.
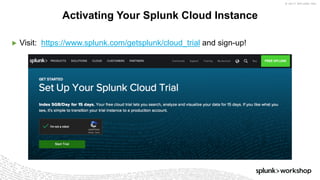
© 2017 SPLUNK
INC. ▶ Visit: https://www.splunk.com/getsplunk/cloud_trial and sign-up! Activating Your Splunk Cloud Instance
18.
© 2017 SPLUNK
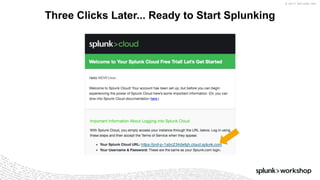
INC. https://prd-p-1abc234defgh.cloud.splunk.com MDWUser, Three Clicks Later... Ready to Start Splunking
19.
© 2017 SPLUNK
INC. Optimizing Your Experience Default User Settings
20.
© 2017 SPLUNK
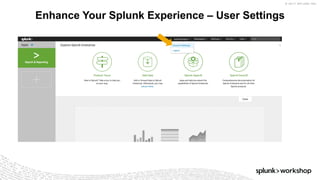
INC. Enhance Your Splunk Experience – User Settings
21.
© 2017 SPLUNK
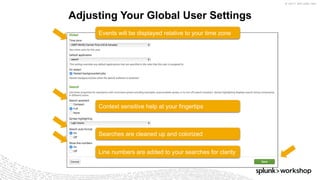
INC. Adjusting Your Global User Settings Events will be displayed relative to your time zone Context sensitive help at your fingertips Searches are cleaned up and colorized Line numbers are added to your searches for clarity
22.
© 2017 SPLUNK
INC. Splunk Overview
23.
© 2017 SPLUNK
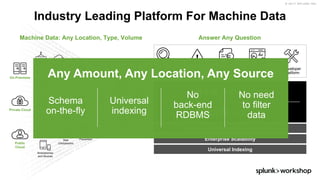
INC. Industry Leading Platform For Machine Data Custom dashboards Report and analyze Monitor and alert Developer Platform Ad hoc search On-Premises Private Cloud Public Cloud Storage Online Shopping Cart Telecoms Desktops Security Web Services Networks Containers Web Clickstreams RFID Smartphones and Devices Servers Messaging GPS Location Packaged Applications Custom Applications Online Services DatabasesCall Detail Records Energy MetersFirewall Intrusion Prevention Platform Support (Apps / API / SDKs) Enterprise Scalability Universal Indexing Machine Data: Any Location, Type, Volume Answer Any Question Any Amount, Any Location, Any Source Schema on-the-fly Universal indexing No back-end RDBMS No need to filter data
24.
© 2017 SPLUNK
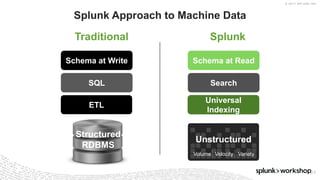
INC. Structured RDBMS SQL Search Schema at Write Schema at Read Traditional Splunk Copyright © 2014 Splunk Inc. Splunk Approach to Machine Data 24 ETL Universal Indexing Volume Velocity Variety Unstructured
25.
© 2017 SPLUNK
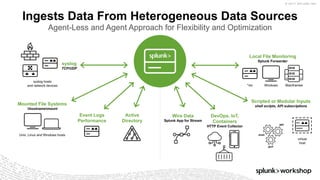
INC. Ingests Data From Heterogeneous Data Sources Agent-Less and Agent Approach for Flexibility and Optimization Mounted File Systems hostnamemount syslog TCP/UDP Event Logs Performance Active Directory syslog hosts and network devices Unix, Linux and Windows hosts Local File Monitoring Splunk Forwarder virtual host Windows Scripted or Modular Inputs shell scripts, API subscriptions Mainframes*nix Wire Data Splunk App for Stream DevOps, IoT, Containers HTTP Event Collector shell API perf
26.
© 2017 SPLUNK
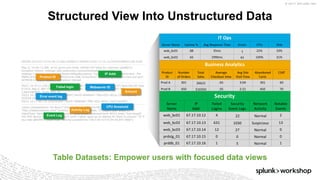
INC. Structured View Into Unstructured Data Product ID Activity Log Amount Webserver ID CPU threshold Error event log Event Log Failed login IP Addr Table Datasets: Empower users with focused data views
27.
© 2017 SPLUNK
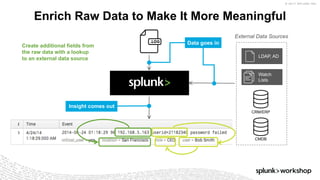
INC. Enrich Raw Data to Make It More Meaningful Create additional fields from the raw data with a lookup to an external data source LDAP, AD Watch Lists CRM/ERP CMDB External Data Sources Data goes in Insight comes out
28.
© 2017 SPLUNK
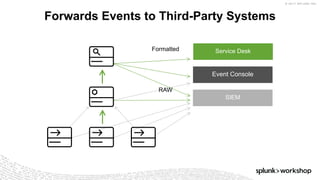
INC. Forwards Events to Third-Party Systems Service Desk Event Console SIEM Formatted RAW
29.
© 2017 SPLUNK
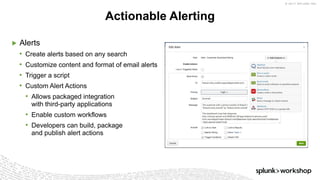
INC. ▶ Alerts • Create alerts based on any search • Customize content and format of email alerts • Trigger a script • Custom Alert Actions • Allows packaged integration with third-party applications • Enable custom workflows • Developers can build, package and publish alert actions Actionable Alerting
30.
© 2017 SPLUNK
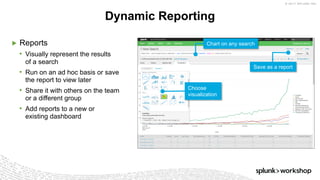
INC. ▶ Reports • Visually represent the results of a search • Run on an ad hoc basis or save the report to view later • Share it with others on the team or a different group • Add reports to a new or existing dashboard Dynamic Reporting Chart on any search Choose visualization Save as a report
31.
© 2017 SPLUNK
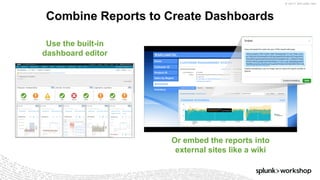
INC. Combine Reports to Create Dashboards Use the built-in dashboard editor Or embed the reports into external sites like a wiki
32.
© 2017 SPLUNK
INC. It’s all about the data Let’s participate in some data discovery.
33.
© 2017 SPLUNK
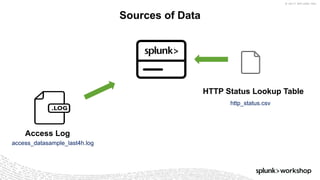
INC. Sources of Data HTTP Status Lookup Table Access Log access_datasample_last4h.log http_status.csv
34.
© 2017 SPLUNK
INC. ▶ 141.146.8.66 - - [17/Nov/2016 12:17:52:155] "GET /oldlink?item_id=EST-7&JSESSIONID=SD5SL5FF3ADFF8 HTTP 1.1" 400 1271 "http://www.myflowershop.com/cart.do?action=addtocart&itemId=EST-7&product_id=FI-FW-02" "Googlebot/2.1 ( http://www.googlebot.com/bot.html) " 899 Unstructured Data - Access Log access_datasample_last4h.log JSESSIONID SD5SL5FF3ADFF8 _raw 141.146.8.66 - - [17/Nov/2016 12:17:52:155] "GET /oldlink?item_id=EST- 7&JSESSIONID=SD5SL5FF3ADFF8 HTTP 1.1" 400 1271 "http://www.myflowershop.com/cart.do?action=addtocart&itemId=EST- 7&product_id=FI-FW-02" "Googlebot/2.1 ( http://www.googlebot.com/bot.html) " 899 _time 2016-11-17T12:17:52.155-0500 action addtocart bytes 1271 category_id clientip 141.146.8.66 cookie date_hour 12 date_mday 17 date_minute 17 date_month november date_second 52 date_wday thursday date_year 2016 date_zone local eventtype file oldlink host gweaver-mbp ident - index main itemId EST-7 item_id EST-7 linecount 1 method GET other 899 product_id FI-FW-02 punct ..._-_-_[//_:::]_"_/?=-&=__."___"://../.?=&=-&=--" referer http://www.myflowershop.com/cart.do?action=addtocart&itemId=EST- 7&product_id=FI-FW-02 referer_domain http://www.myflowershop.com req_time 17/Nov/2016 12:17:52:155 root source access_datasample_last4h.log sourcetype access_combined splunk_server gweaver-mbp splunk_server_group status 400 timeendpos 42 timestartpos 18 uri /oldlink?item_id=EST-7&JSESSIONID=SD5SL5FF3ADFF8 uri_domain uri_path /oldlink uri_query item_id=EST-7&JSESSIONID=SD5SL5FF3ADFF8 user - useragent Googlebot/2.1 ( http://www.googlebot.com/bot.html) version 1.1
35.
© 2017 SPLUNK
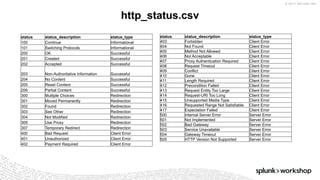
INC. http_status.csv status status_description status_type 403 Forbidden Client Error 404 Not Found Client Error 405 Method Not Allowed Client Error 406 Not Acceptable Client Error 407 Proxy Authentication Required Client Error 408 Request Timeout Client Error 409 Conflict Client Error 410 Gone Client Error 411 Length Required Client Error 412 Precondition Failed Client Error 413 Request Entity Too Large Client Error 414 Request-URI Too Long Client Error 415 Unsupported Media Type Client Error 416 Requested Range Not Satisfiable Client Error 417 Expectation Failed Client Error 500 Internal Server Error Server Error 501 Not Implemented Server Error 502 Bad Gateway Server Error 503 Service Unavailable Server Error 504 Gateway Timeout Server Error 505 HTTP Version Not Supported Server Error status status_description status_type 100 Continue Informational 101 Switching Protocols Informational 200 OK Successful 201 Created Successful 202 Accepted Successful 203 Non-Authoritative Information Successful 204 No Content Successful 205 Reset Content Successful 206 Partial Content Successful 300 Multiple Choices Redirection 301 Moved Permanently Redirection 302 Found Redirection 303 See Other Redirection 304 Not Modified Redirection 305 Use Proxy Redirection 307 Temporary Redirect Redirection 400 Bad Request Client Error 401 Unauthorized Client Error 402 Payment Required Client Error
36.
© 2017 SPLUNK
INC. Search & Reporting Let’s explore some data together
37.
© 2017 SPLUNK
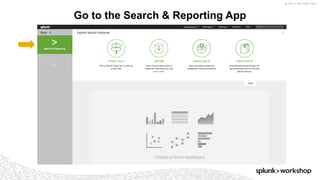
INC. Go to the Search & Reporting App
38.
© 2017 SPLUNK
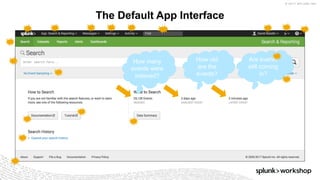
INC. The Default App Interface How many events were indexed? How old are the events? Are events still coming in?
39.
© 2017 SPLUNK
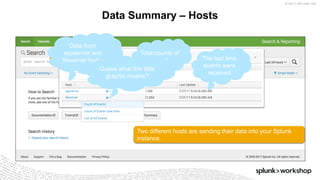
INC. Data Summary – Hosts Two different hosts are sending their data into your Splunk instance. Data from appserver and fileserver hosts Total counts of events The last time events were received Guess what this little graphic means?
40.
© 2017 SPLUNK
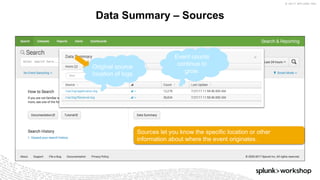
INC. Data Summary – Sources Sources let you know the specific location or other information about where the event originates. Original source location of logs Event counts continue to grow.
41.
© 2017 SPLUNK
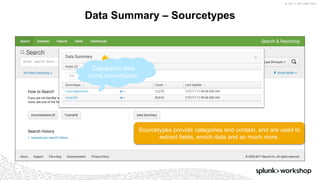
INC. Data Summary – Sourcetypes Sourcetypes provide categories and context, and are used to extract fields, enrich data and so much more. Categorize data using sourcetypes!
42.
© 2017 SPLUNK
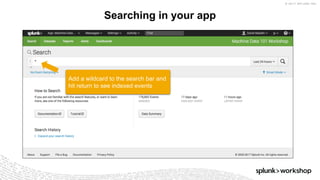
INC. Searching in your app Add a wildcard to the search bar and hit return to see indexed events
43.
© 2017 SPLUNK
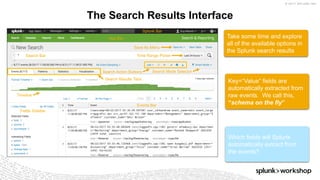
INC. The Search Results Interface Take some time and explore all of the available options in the Splunk search results Key=“Value” fields are automatically extracted from raw events. We call this, “schema on the fly” Which fields will Splunk automatically extract from the events? App Bar Splunk Bar Search Bar Events Bar Fields Sidebar Search Action Buttons Timeline Search Results Tabs Save As Menu Time Range Picker Search Mode Selector
44.
© 2017 SPLUNK
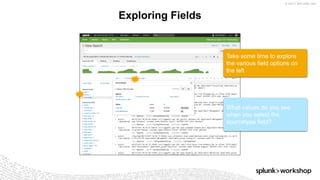
INC. Exploring Fields What values do you see when you select the sourcetype field? Take some time to explore the various field options on the left
45.
© 2017 SPLUNK
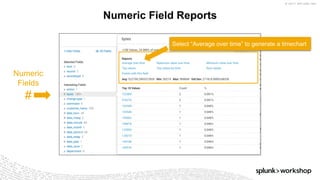
INC. Numeric Field Reports Numeric Fields # Select “Average over time” to generate a timechart
46.
© 2017 SPLUNK
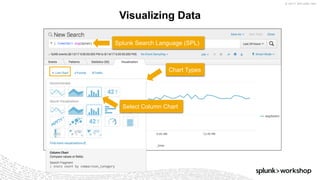
INC. Visualizing Data Chart Types Splunk Search Language (SPL) Select Column Chart
47.
© 2017 SPLUNK
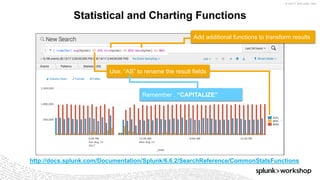
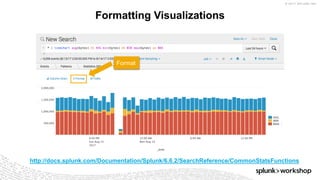
INC. Statistical and Charting Functions http://docs.splunk.com/Documentation/Splunk/6.6.2/SearchReference/CommonStatsFunctions Add additional functions to transform results Use, “AS” to rename the result fields Remember , “CAPITALIZE”
48.
© 2017 SPLUNK
INC. Formatting Visualizations Stacked http://docs.splunk.com/Documentation/Splunk/6.6.2/SearchReference/CommonStatsFunctions Format
49.
© 2017 SPLUNK
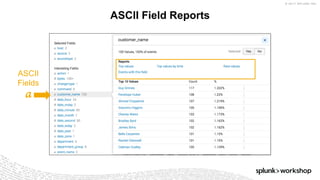
INC. ASCII Field Reports ASCII Fields a
50.
© 2017 SPLUNK
INC. Apps
51.
© 2017 SPLUNK
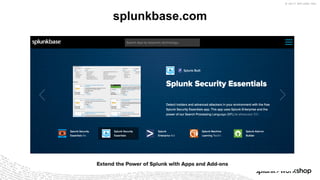
INC. splunkbase.com
52.
© 2017 SPLUNK
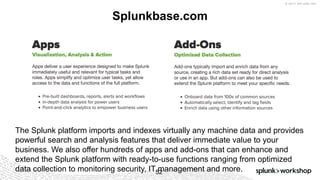
INC. Splunkbase.com 52 The Splunk platform imports and indexes virtually any machine data and provides powerful search and analysis features that deliver immediate value to your business. We also offer hundreds of apps and add-ons that can enhance and extend the Splunk platform with ready-to-use functions ranging from optimized data collection to monitoring security, IT management and more.
53.
© 2017 SPLUNK
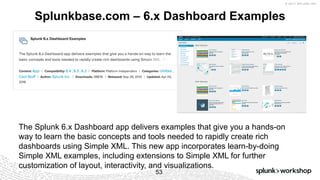
INC. Splunkbase.com – 6.x Dashboard Examples 53 The Splunk 6.x Dashboard app delivers examples that give you a hands-on way to learn the basic concepts and tools needed to rapidly create rich dashboards using Simple XML. This new app incorporates learn-by-doing Simple XML examples, including extensions to Simple XML for further customization of layout, interactivity, and visualizations.
54.
© 2017 SPLUNK
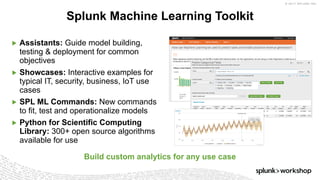
INC. ▶ Assistants: Guide model building, testing & deployment for common objectives ▶ Showcases: Interactive examples for typical IT, security, business, IoT use cases ▶ SPL ML Commands: New commands to fit, test and operationalize models ▶ Python for Scientific Computing Library: 300+ open source algorithms available for use Splunk Machine Learning Toolkit Build custom analytics for any use case
55.
© 2017 SPLUNK
INC. Installing Your First App
56.
© 2017 SPLUNK
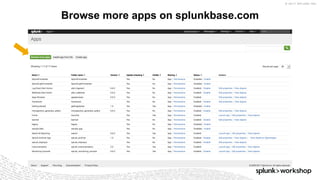
INC. Browse more apps on splunkbase.com
57.
© 2017 SPLUNK
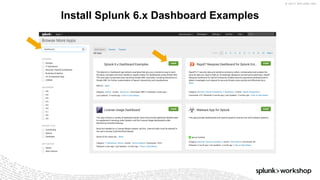
INC. Install Splunk 6.x Dashboard Examples
58.
© 2017 SPLUNK
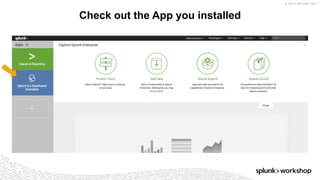
INC. Check out the App you installed
59.
© 2017 SPLUNK
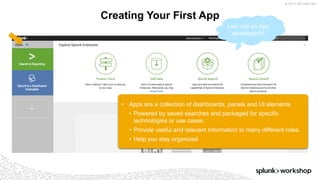
INC. Creating Your First App Creating your MDW101 App
60.
© 2017 SPLUNK
INC. Creating Your First App • Apps are a collection of dashboards, panels and UI elements • Powered by saved searches and packaged for specific technologies or use cases. • Provide useful and relevant information to many different roles. • Help you stay organized I am not an App developer!!!!
61.
© 2017 SPLUNK
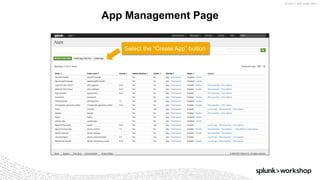
INC. App Management Page Select the “Create App” button
62.
© 2017 SPLUNK
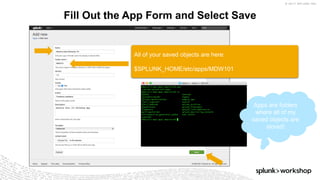
INC. Fill Out the App Form and Select Save All of your saved objects are here: $SPLUNK_HOME/etc/apps/MDW101 Apps are folders where all of my saved objects are stored!
63.
© 2017 SPLUNK
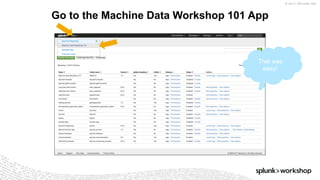
INC. Go to the Machine Data Workshop 101 App That was easy!
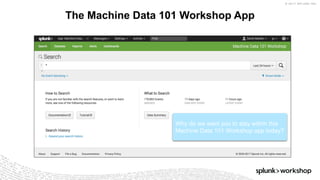
64.
© 2017 SPLUNK
INC. The Machine Data 101 Workshop App Why do we want you to stay within this Machine Data 101 Workshop app today?
65.
© 2017 SPLUNK
INC. Your First Dashboard Pointing and Clicking
66.
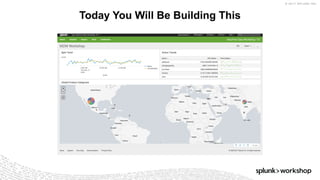
© 2017 SPLUNK
INC. Today You Will Be Building This
67.
© 2017 SPLUNK
INC. SPL Overview Search Processing Language
68.
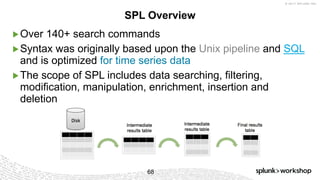
© 2017 SPLUNK
INC. SPL Overview ▶Over 140+ search commands ▶Syntax was originally based upon the Unix pipeline and SQL and is optimized for time series data ▶The scope of SPL includes data searching, filtering, modification, manipulation, enrichment, insertion and deletion 68
69.
© 2017 SPLUNK
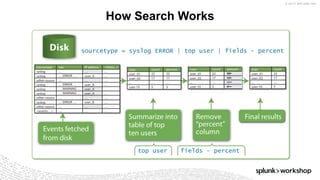
INC. How Search Works
70.
© 2017 SPLUNK
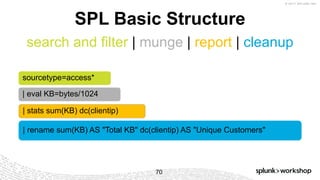
INC. search and filter | munge | report | cleanup | rename sum(KB) AS "Total KB" dc(clientip) AS "Unique Customers" | eval KB=bytes/1024 sourcetype=access* | stats sum(KB) dc(clientip) SPL Basic Structure 70
71.
© 2017 SPLUNK
INC. SPL Examples
72.
© 2017 SPLUNK
INC. search and filter
73.
© 2017 SPLUNK
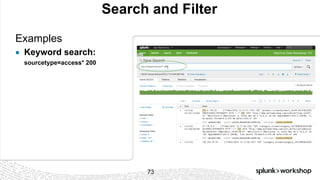
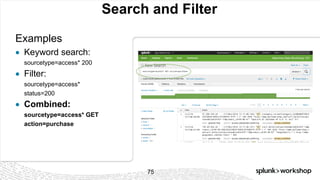
INC. Search and Filter Examples ● Keyword search: sourcetype=access* 200 73
74.
© 2017 SPLUNK
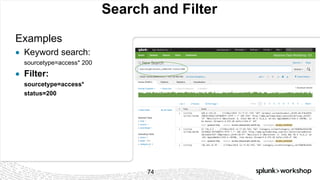
INC. Search and Filter Examples ● Keyword search: sourcetype=access* 200 ● Filter: sourcetype=access* status=200 74
75.
© 2017 SPLUNK
INC. Search and Filter Examples ● Keyword search: sourcetype=access* 200 ● Filter: sourcetype=access* status=200 ● Combined: sourcetype=access* GET action=purchase 75
76.
© 2017 SPLUNK
INC. munge
77.
© 2017 SPLUNK
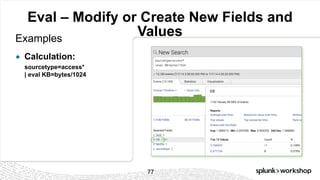
INC. Eval – Modify or Create New Fields and ValuesExamples ● Calculation: sourcetype=access* | eval KB=bytes/1024 77
78.
© 2017 SPLUNK
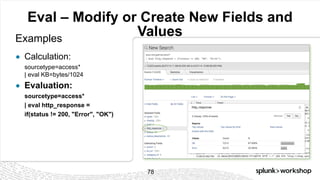
INC. Eval – Modify or Create New Fields and ValuesExamples ● Calculation: sourcetype=access* | eval KB=bytes/1024 ● Evaluation: sourcetype=access* | eval http_response = if(status != 200, "Error", "OK") 78
79.
© 2017 SPLUNK
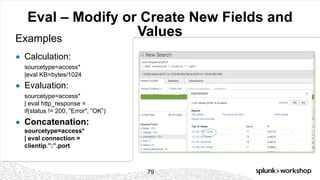
INC. Eval – Modify or Create New Fields and ValuesExamples ● Calculation: sourcetype=access* |eval KB=bytes/1024 ● Evaluation: sourcetype=access* | eval http_response = if(status != 200, ”Error", ”OK”) ● Concatenation: sourcetype=access* | eval connection = clientip.”:”.port 79
80.
© 2017 SPLUNK
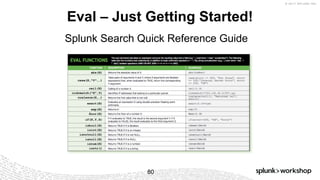
INC. Eval – Just Getting Started! Splunk Search Quick Reference Guide 80
81.
© 2017 SPLUNK
INC. report
82.
© 2017 SPLUNK
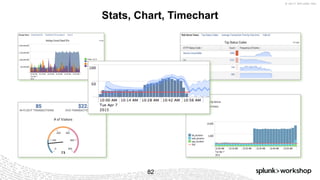
INC. Stats, Chart, Timechart 82
83.
© 2017 SPLUNK
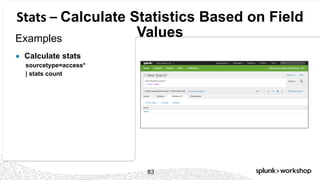
INC. Stats – Calculate Statistics Based on Field ValuesExamples ● Calculate stats sourcetype=access* | stats count 83
84.
© 2017 SPLUNK
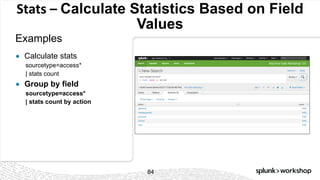
INC. Stats – Calculate Statistics Based on Field Values Examples 84 ● Calculate stats sourcetype=access* | stats count ● Group by field sourcetype=access* | stats count by action
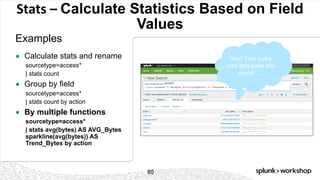
85.
© 2017 SPLUNK
INC. Stats – Calculate Statistics Based on Field Values Examples 85 ● Calculate stats and rename sourcetype=access* | stats count ● Group by field sourcetype=access* | stats count by action ● By multiple functions sourcetype=access* | stats avg(bytes) AS AVG_Bytes sparkline(avg(bytes)) AS Trend_Bytes by action Hey! That looks cool let’s save this report…..
86.
© 2017 SPLUNK
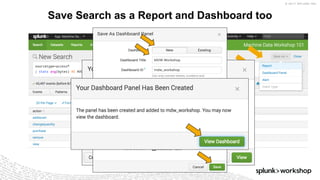
INC. Save Search as a Report and Dashboard too
87.
© 2017 SPLUNK
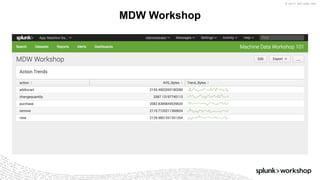
INC. MDW Workshop
88.
© 2017 SPLUNK
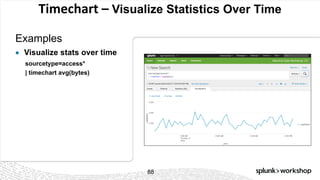
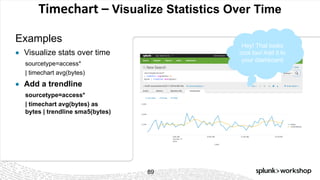
INC. Timechart – Visualize Statistics Over Time Examples ● Visualize stats over time sourcetype=access* | timechart avg(bytes) 88
89.
© 2017 SPLUNK
INC. Timechart – Visualize Statistics Over Time Examples 89 ● Visualize stats over time sourcetype=access* | timechart avg(bytes) ● Add a trendline sourcetype=access* | timechart avg(bytes) as bytes | trendline sma5(bytes) Hey! That looks cool too! Add it to your dashboard
90.
© 2017 SPLUNK
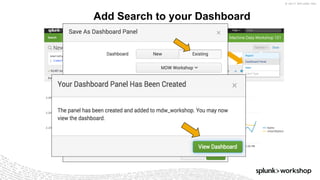
INC. Add Search to your Dashboard
91.
© 2017 SPLUNK
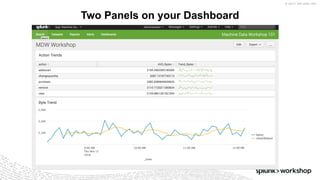
INC. Two Panels on your Dashboard
92.
© 2017 SPLUNK
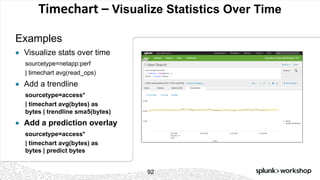
INC. Timechart – Visualize Statistics Over Time Examples 92 ● Visualize stats over time sourcetype=netapp:perf | timechart avg(read_ops) ● Add a trendline sourcetype=access* | timechart avg(bytes) as bytes | trendline sma5(bytes) ● Add a prediction overlay sourcetype=access* | timechart avg(bytes) as bytes | predict bytes
93.
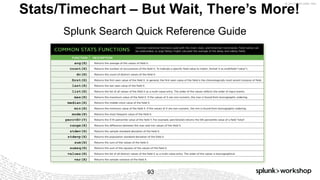
© 2017 SPLUNK
INC. Stats/Timechart – But Wait, There’s More! Splunk Search Quick Reference Guide 93
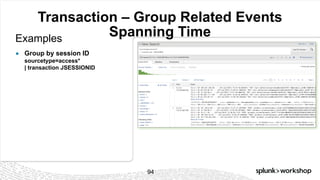
94.
© 2017 SPLUNK
INC. Transaction – Group Related Events Spanning TimeExamples ● Group by session ID sourcetype=access* | transaction JSESSIONID 94
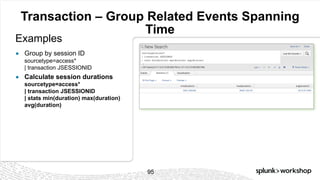
95.
© 2017 SPLUNK
INC. Transaction – Group Related Events Spanning Time Examples 95 ● Group by session ID sourcetype=access* | transaction JSESSIONID ● Calculate session durations sourcetype=access* | transaction JSESSIONID | stats min(duration) max(duration) avg(duration)
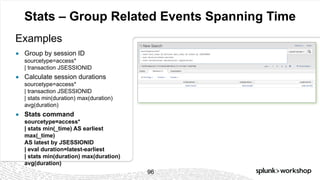
96.
© 2017 SPLUNK
INC. Stats – Group Related Events Spanning Time Examples 96 ● Group by session ID sourcetype=access* | transaction JSESSIONID ● Calculate session durations sourcetype=access* | transaction JSESSIONID | stats min(duration) max(duration) avg(duration) ● Stats command sourcetype=access* | stats min(_time) AS earliest max(_time) AS latest by JSESSIONID | eval duration=latest-earliest | stats min(duration) max(duration) avg(duration)
97.
© 2017 SPLUNK
INC. Data Enrichment
98.
© 2017 SPLUNK
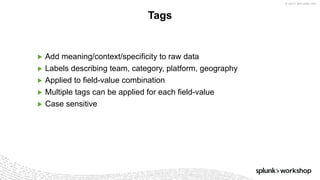
INC. ▶ Add meaning/context/specificity to raw data ▶ Labels describing team, category, platform, geography ▶ Applied to field-value combination ▶ Multiple tags can be applied for each field-value ▶ Case sensitive Tags
99.
© 2017 SPLUNK
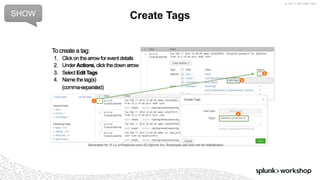
INC. Create TagsSHOW
100.
© 2017 SPLUNK
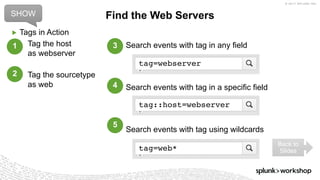
INC. Search events with tag in any field Search events with tag in a specific field Search events with tag using wildcards Find the Web Servers ▶ Tags in Action tag=webserver tag::host=webserver tag=web* Tag the host as webserver Tag the sourcetype as web 1 2 3 4 5 SHOW Back to Slides
101.
© 2017 SPLUNK
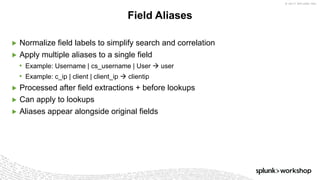
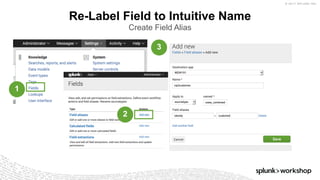
INC. ▶ Normalize field labels to simplify search and correlation ▶ Apply multiple aliases to a single field • Example: Username | cs_username | User à user • Example: c_ip | client | client_ip à clientip ▶ Processed after field extractions + before lookups ▶ Can apply to lookups ▶ Aliases appear alongside original fields Field Aliases
102.
© 2017 SPLUNK
INC. Re-Label Field to Intuitive Name Create Field Alias 1 2 3
103.
© 2017 SPLUNK
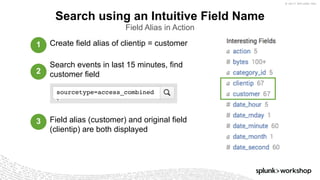
INC. Create field alias of clientip = customer Search events in last 15 minutes, find customer field Field alias (customer) and original field (clientip) are both displayed Search using an Intuitive Field Name Field Alias in Action sourcetype=access_combined 1 2 3
104.
© 2017 SPLUNK
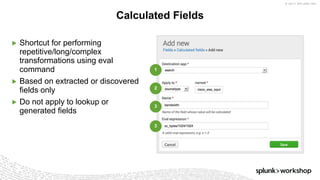
INC. ▶ Shortcut for performing repetitive/long/complex transformations using eval command ▶ Based on extracted or discovered fields only ▶ Do not apply to lookup or generated fields Calculated Fields 1 2 3 3
105.
© 2017 SPLUNK
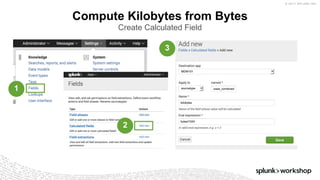
INC. Compute Kilobytes from Bytes Create Calculated Field 1 2 3
106.
© 2017 SPLUNK
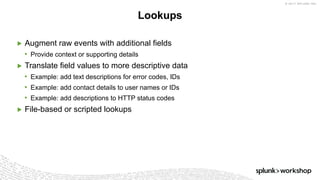
INC. ▶ Augment raw events with additional fields • Provide context or supporting details ▶ Translate field values to more descriptive data • Example: add text descriptions for error codes, IDs • Example: add contact details to user names or IDs • Example: add descriptions to HTTP status codes ▶ File-based or scripted lookups Lookups
107.
© 2017 SPLUNK
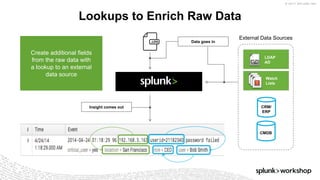
INC. Lookups to Enrich Raw Data CRM/ ERP External Data Sources Data goes in Create additional fields from the raw data with a lookup to an external data source Insight comes out Watch Lists LDAP AD CMDB
108.
© 2017 SPLUNK
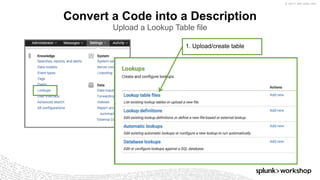
INC. Convert a Code into a Description Upload a Lookup Table file 1. Upload/create table
109.
© 2017 SPLUNK
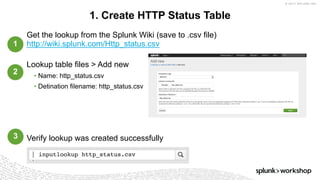
INC. Get the lookup from the Splunk Wiki (save to .csv file) http://wiki.splunk.com/Http_status.csv Lookup table files > Add new • Name: http_status.csv • Detination filename: http_status.csv Verify lookup was created successfully 1. Create HTTP Status Table 1 2 3 | inputlookup http_status.csv
110.
© 2017 SPLUNK
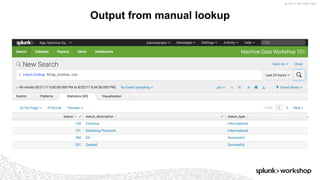
INC. Output from manual lookup
111.
© 2017 SPLUNK
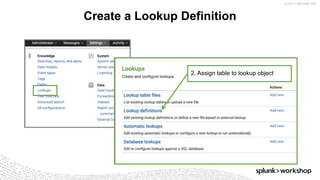
INC. Create a Lookup Definition 2. Assign table to lookup object
112.
© 2017 SPLUNK
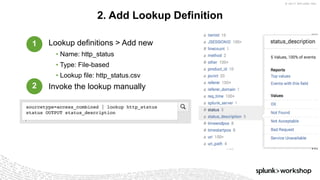
INC. Lookup definitions > Add new • Name: http_status • Type: File-based • Lookup file: http_status.csv Invoke the lookup manually 2. Add Lookup Definition sourcetype=access_combined | lookup http_status status OUTPUT status_description 1 2
113.
© 2017 SPLUNK
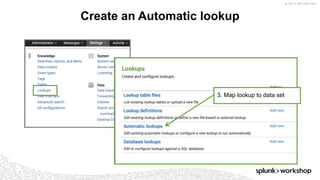
INC. Create an Automatic lookup 3. Map lookup to data set
114.
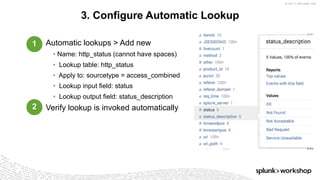
© 2017 SPLUNK
INC. Automatic lookups > Add new • Name: http_status (cannot have spaces) • Lookup table: http_status • Apply to: sourcetype = access_combined • Lookup input field: status • Lookup output field: status_description Verify lookup is invoked automatically 3. Configure Automatic Lookup 1 2
115.
© 2017 SPLUNK
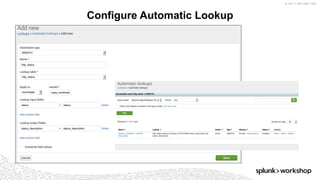
INC. Configure Automatic Lookup
116.
© 2017 SPLUNK
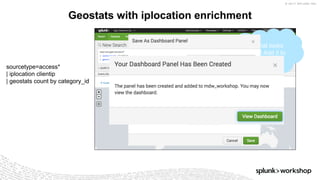
INC. Geostats with iplocation enrichment sourcetype=access* | iplocation clientip | geostats count by category_id Hey! That looks cool too! Add it to your dashboard
117.
© 2017 SPLUNK
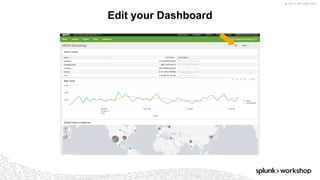
INC. Edit your Dashboard
118.
© 2017 SPLUNK
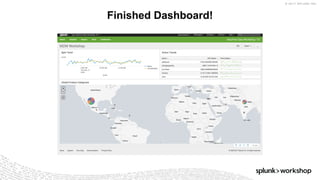
INC. Finished Dashboard!
119.
© 2017 SPLUNK
INC. Resources
120.
© 2017 SPLUNK
INC. The Splunk Community Creating your MDW101 App
121.
© 2017 SPLUNK
INC. Support
122.
© 2017 SPLUNK
INC. Answers • Answers • User Groups • Splunkbase • Blogs • Developers • Documentation • Education • SplunkLive! • .conf2017 • Schwag Store • SplunkTrust
123.
© 2017 SPLUNK
INC. Training
124.
© 2017 SPLUNK
INC. Free Splunk Fundamentals 1 Course
125.
© 2017 SPLUNK
INC. Q&A
126.
© 2017 SPLUNK
INC.© 2017 SPLUNK INC. Thank You
127.
© 2017 SPLUNK
INC. BREAK 15 MINUTES
Download


![© 2017 SPLUNK INC.
▶ 141.146.8.66 - - [17/Nov/2016 12:17:52:155] "GET /oldlink?item_id=EST-7&JSESSIONID=SD5SL5FF3ADFF8 HTTP 1.1"
400 1271 "http://www.myflowershop.com/cart.do?action=addtocart&itemId=EST-7&product_id=FI-FW-02" "Googlebot/2.1
( http://www.googlebot.com/bot.html) " 899
Unstructured Data - Access Log
access_datasample_last4h.log
JSESSIONID SD5SL5FF3ADFF8
_raw
141.146.8.66 - - [17/Nov/2016 12:17:52:155] "GET /oldlink?item_id=EST-
7&JSESSIONID=SD5SL5FF3ADFF8 HTTP 1.1" 400 1271
"http://www.myflowershop.com/cart.do?action=addtocart&itemId=EST-
7&product_id=FI-FW-02" "Googlebot/2.1 ( http://www.googlebot.com/bot.html)
" 899
_time 2016-11-17T12:17:52.155-0500
action addtocart
bytes 1271
category_id
clientip 141.146.8.66
cookie
date_hour 12
date_mday 17
date_minute 17
date_month november
date_second 52
date_wday thursday
date_year 2016
date_zone local
eventtype
file oldlink
host gweaver-mbp
ident -
index main
itemId EST-7
item_id EST-7
linecount 1
method GET
other 899
product_id FI-FW-02
punct ..._-_-_[//_:::]_"_/?=-&=__."___"://../.?=&=-&=--"
referer
http://www.myflowershop.com/cart.do?action=addtocart&itemId=EST-
7&product_id=FI-FW-02
referer_domain http://www.myflowershop.com
req_time 17/Nov/2016 12:17:52:155
root
source access_datasample_last4h.log
sourcetype access_combined
splunk_server gweaver-mbp
splunk_server_group
status 400
timeendpos 42
timestartpos 18
uri /oldlink?item_id=EST-7&JSESSIONID=SD5SL5FF3ADFF8
uri_domain
uri_path /oldlink
uri_query item_id=EST-7&JSESSIONID=SD5SL5FF3ADFF8
user -
useragent Googlebot/2.1 ( http://www.googlebot.com/bot.html)
version 1.1](https://image.slidesharecdn.com/machinedata101-170823184444/85/Machine-Data-101-34-320.jpg)