Download as PDF, PPTX


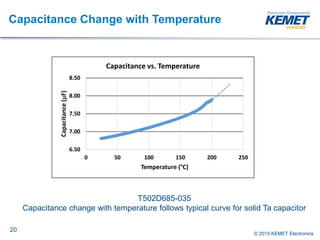


The document discusses the development and technical challenges of high-temperature solid tantalum capacitors, highlighting key construction elements and known failure mechanisms. It outlines advancements in operating temperatures from 125°C to a targeted 230°C, along with performance testing methods and material enhancements used to improve reliability. Various factors affecting the capacitors' performance under high temperatures, such as leakage current and dielectrics, are also examined.


