

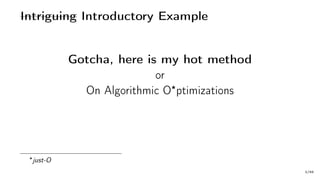
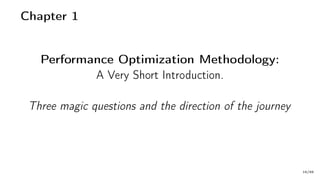
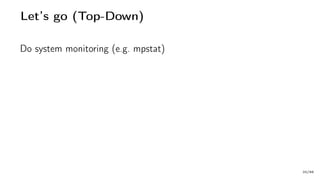
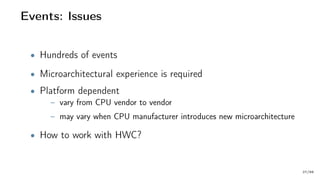
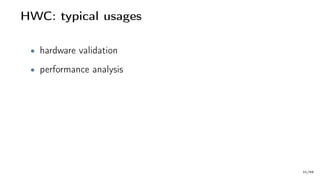
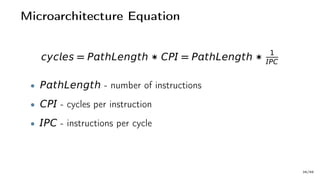
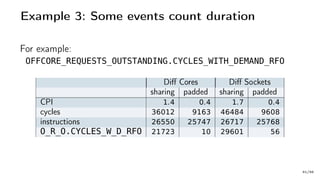
![Example 1: Very Hot Code
public int[][] multiply(int[][] A, int[][] B) {
int size = A.length;
int[][] R = new int[size][size];
for (int i = 0; i < size; i++) {
for (int j = 0; j < size; j++) {
int s = 0;
for (int k = 0; k < size; k++) {
s += A[i][k] * B[k][j];
}
R[i][j] = s;
}
}
return R;
}
4/66](https://image.slidesharecdn.com/untitled-170306090542/85/Speedup-Your-Java-Apps-with-Hardware-Counters-6-320.jpg)
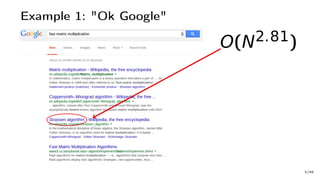
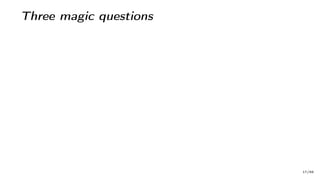
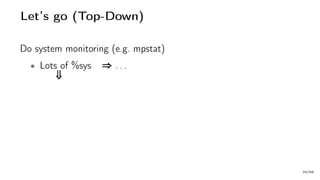
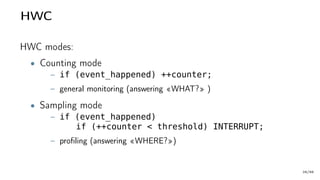
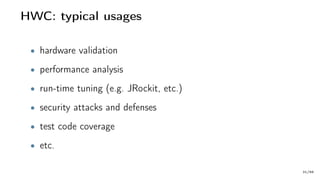
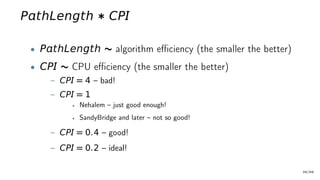
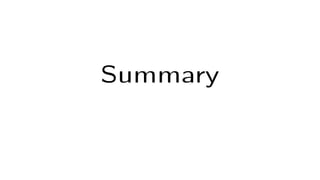
![Example 1: Very Hot Code
public int[][] multiply(int[][] A, int[][] B) {
int size = A.length;
int[][] R = new int[size][size];
for (int i = 0; i < size; i++) {
for (int j = 0; j < size; j++) {
int s = 0;
for (int k = 0; k < size; k++) {
s += A[i][k] * B[k][j];
}
R[i][j] = s;
}
}
return R;
}
O (N3)
big-O
4/66](https://image.slidesharecdn.com/untitled-170306090542/85/Speedup-Your-Java-Apps-with-Hardware-Counters-7-320.jpg)
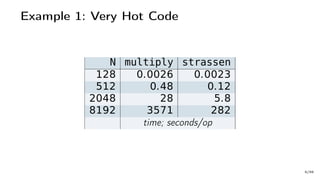
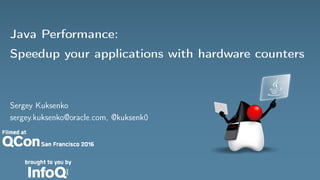
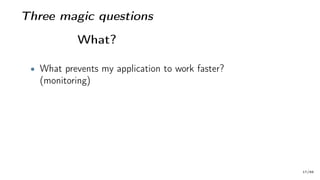
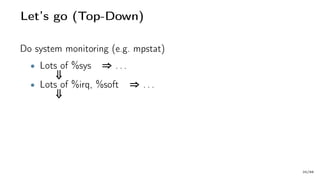
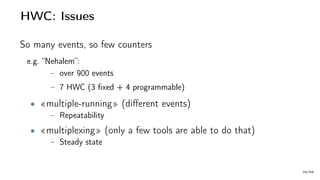
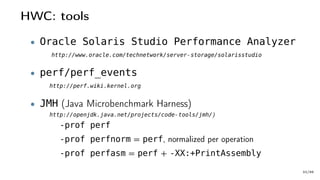
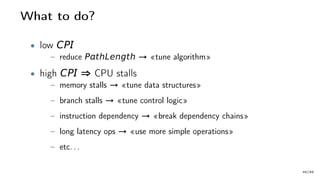
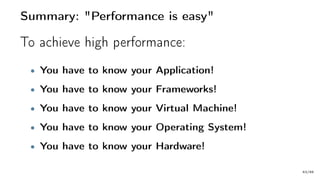
![Example 1: Very Hot Code
public int[][] multiply(int[][] A, int[][] B) {
int size = A.length;
int[][] R = new int[size][size];
for (int i = 0; i < size; i++) {
for (int j = 0; j < size; j++) {
int s = 0;
for (int k = 0; k < size; k++) {
s += A[i][k] * B[k][j];
}
R[i][j] = s;
}
}
return R;
}
L1-load-misses
10/66](https://image.slidesharecdn.com/untitled-170306090542/85/Speedup-Your-Java-Apps-with-Hardware-Counters-13-320.jpg)
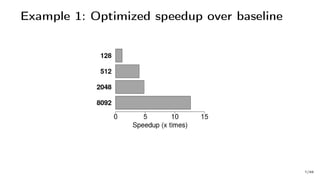
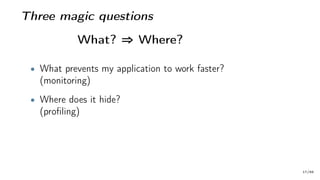
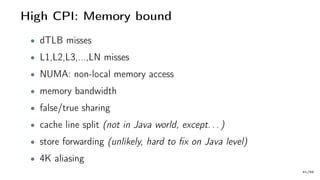
![Example 1: Very Hot Code
public int[][] multiply(int[][] A, int[][] B) {
int size = A.length;
int[][] R = new int[size][size];
for (int i = 0; i < size; i++) {
for (int j = 0; j < size; j++) {
int s = 0;
for (int k = 0; k < size; k++) {
s += A[i][k] * B[k][j];
}
R[i][j] = s;
}
}
return R;
}
10/66](https://image.slidesharecdn.com/untitled-170306090542/85/Speedup-Your-Java-Apps-with-Hardware-Counters-14-320.jpg)
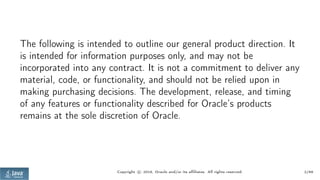
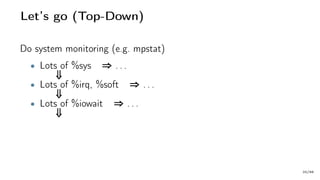
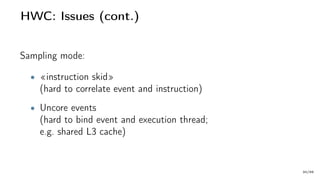
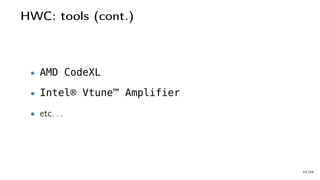
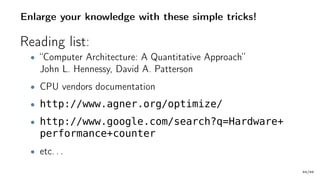
![Example 1: Very Hot Code
public int[][] multiplyIKJ(int[][] A, int[][] B) {
int size = A.length;
int[][] R = new int[size][size];
for (int i = 0; i < size; i++) {
for (int k = 0; k < size; k++) {
int aik = A[i][k];
for (int j = 0; j < size; j++) {
R[i][j] += aik * B[k][j];
}
}
}
return R;
}
11/66](https://image.slidesharecdn.com/untitled-170306090542/85/Speedup-Your-Java-Apps-with-Hardware-Counters-15-320.jpg)

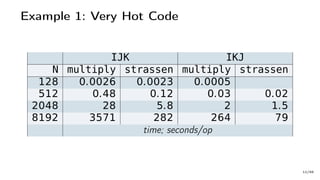
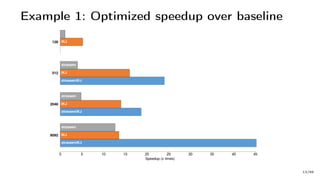
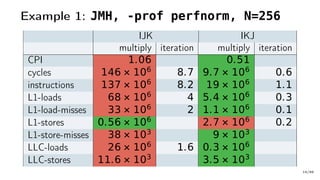
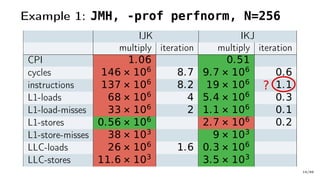
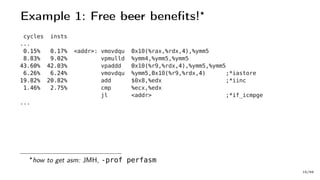
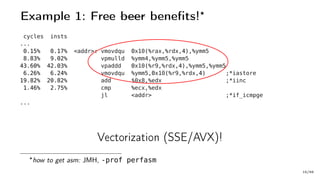


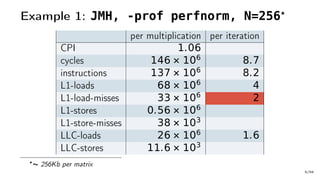
The document discusses Java performance optimization using hardware counters, focusing on techniques for monitoring and profiling to identify performance bottlenecks. It highlights the importance of methodologies such as a top-down approach to system monitoring and understanding CPU utilization. Additionally, it outlines the role of Performance Monitoring Units (PMUs) and hardware counters in analyzing application performance for better optimization strategies.