Download as PDF, PPTX


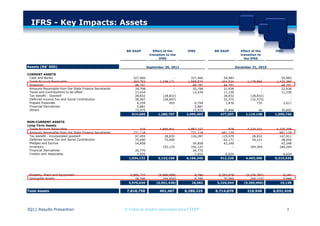
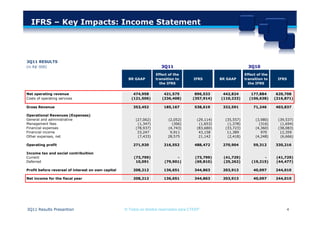
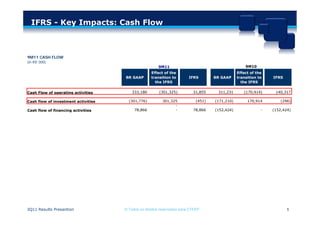
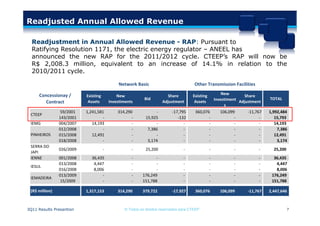
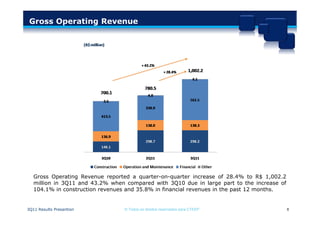
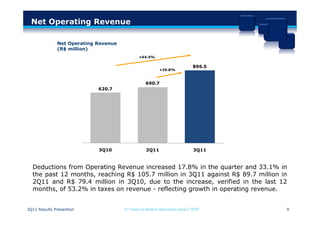
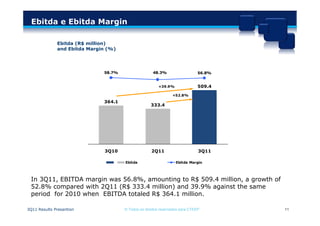


This document provides the key impacts of adopting IFRS accounting standards and CTEEP's 3Q11 financial results. It discusses how the transition to IFRS affected CTEEP's balance sheet, income statement, and cash flow statement. Specifically, it shows the effects of IFRS adoption on assets, liabilities, revenues, expenses, and cash flows. It also announces that CTEEP's allowed annual revenue for the 2011/2012 cycle will increase 14.1% to R$2,008.3 million according to a resolution by ANEEL, Brazil's electric energy regulator.


![Getting Started with Apache Spark: Big Data Made Simple [Free Meetup]](https://cdn.slidesharecdn.com/ss_thumbnails/apachesparkgettingstarted-260203175547-8361bcc3-thumbnail.jpg?width=640&height=640&fit=bounds)


