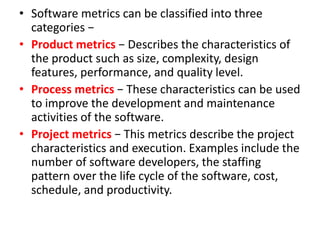
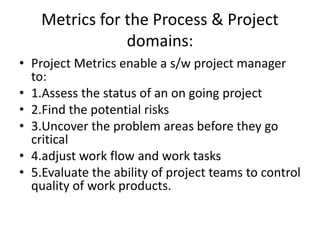
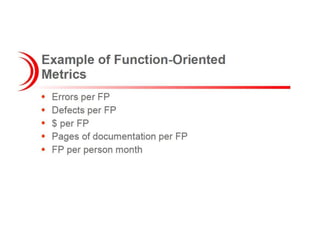
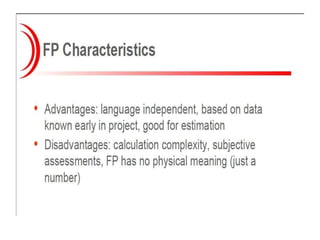
Software Metrics
• Software metrics can be classified into three
categories −
• Product metrics − Describes the characteristics of
the product such as size, complexity, design
features, performance, and quality level.
• Process metrics − These characteristics can be used
to improve the development and maintenance
activities of the software.
• Project metrics − This metrics describe the project
characteristics and execution. Examples include the
number of software developers, the staffing
pattern over the life cycle of the software, cost,
schedule, and productivity.
Metrics for the Process & Project
domains:
• Project Metrics enable a s/w project manager
to:
• 1.Assess the status of an on going project
• 2.Find the potential risks
• 3.Uncover the problem areas before they go
critical
• 4.adjust work flow and work tasks
• 5.Evaluate the ability of project teams to control
quality of work products.
Software Measurement
Software is measured for many reasons:
• 1. To indicate the quality of the product.
• 2.To assess the benefits derived from new s/w
engineering methods and tools.
• 3.To assess the productivity of the people who
produce the product.
• 4.To form a baseline for estimation.
Measurements in the physical world can be
estimated in two ways:
• 1.Direct Measurement(Ex: Length of Bolt)
• 2.Indirect Measurement(Ex: Quality of the
Bolt produced)
• Direct Measures of the s/w engineering
process include cost of effort, DM of the
product includes lines of code, Execution
Speed, Memory Size and defects reported
etc..
• Indirect Measures of the product include
functionality, quality, complexity, efficiency,
reliability, maintainability etc…
• Software Metrics can be categorized into :
• 1.Size Oriented Metrics
• 2.Functioned Oriented Metrics
• 3.Human Oriented Metrics
Size Oriented Metrics
• Productivity=KLOC/Person-months
• Quality=Defects/KLOC
• Cost=$(000)?KLOC
• Documentation=Pages Per documentation/KLOC
Function Oriented Metrics
• Productivity=FP/Person-month
• Quality=Defects/FP
• Cost=$(000)/FP
• Document=Ppdoc/FP
Example for Cause Effect
• Now let’s try to implement this technique
with some example.
• 1. Draw a cause and effect graph based on a
requirement/situation
2. Cause and Effect graph is given, draw a
decision table based on it to draw the test
case.
• Let’s see both of them one by one.
• The “Print message” is software that read two
characters and, depending on their values,
messages must be printed.
• The first character must be an “A” or a “B”.
• The second character must be a digit.
• If the first character is an “A” or “B” and the
second character is a digit, the file must be
updated.
• If the first character is incorrect (not an “A” or
“B”), the message X must be printed.
• If the second character is incorrect (not a digit),
the message Y must be printed.
• Solution:
• The causes for this situation are:
C1 – First character is A
C2 – First character is B
C3 – the Second character is a digit
• The effects (results) for this situation are
E1 – Update the file
E2 – Print message “X”
E3 – Print message “Y”
First, draw the causes and effects as shown below:
• In this example, let’s start with Effect E1.
• Effect E1 is to update the file. The file is
updated when
– The first character is “A” and the second
character is a digit
– The first character is “B” and the second
character is a digit
– The first character can either be “A” or “B”
and cannot be both.
• Now let’s put these 3 points in symbolic form:
• For E1 to be true – following are the causes:
– C1 and C3 should be true
– C2 and C3 should be true
– C1 and C2 cannot be true together. This
means C1 and C2 are mutually exclusive.
So as per the above diagram, for E1 to be true the condition is
(C1 C2) C3
•The circle in the middle is just an interpretation of the
middle point to make the graph less messy.
There is a third condition where C1 and C2 are mutually
exclusive. So the final graph for effect E1 to be true is
shown below:
• Let’s move to Effect E2:
E2 states to print message “X”. Message X will
be printed when the First character is neither
A nor B.
Which means Effect E2 will hold true when
either C1 OR C2 is invalid. So the graph for
Effect E2 is shown as (In blue line)
• For Effect E3.
E3 states to print message “Y”. Message Y will
be printed when Second character is incorrect.
Which means Effect E3 will hold true when C3
is invalid. So the graph for Effect E3 is shown
as (In Green line).

Software Metrics (Testing)

  • 1.
  • 2.
    • Software metricscan be classified into three categories − • Product metrics − Describes the characteristics of the product such as size, complexity, design features, performance, and quality level. • Process metrics − These characteristics can be used to improve the development and maintenance activities of the software. • Project metrics − This metrics describe the project characteristics and execution. Examples include the number of software developers, the staffing pattern over the life cycle of the software, cost, schedule, and productivity.
  • 3.
    Metrics for theProcess & Project domains: • Project Metrics enable a s/w project manager to: • 1.Assess the status of an on going project • 2.Find the potential risks • 3.Uncover the problem areas before they go critical • 4.adjust work flow and work tasks • 5.Evaluate the ability of project teams to control quality of work products.
  • 4.
    Software Measurement Software ismeasured for many reasons: • 1. To indicate the quality of the product. • 2.To assess the benefits derived from new s/w engineering methods and tools. • 3.To assess the productivity of the people who produce the product. • 4.To form a baseline for estimation.
  • 5.
    Measurements in thephysical world can be estimated in two ways: • 1.Direct Measurement(Ex: Length of Bolt) • 2.Indirect Measurement(Ex: Quality of the Bolt produced) • Direct Measures of the s/w engineering process include cost of effort, DM of the product includes lines of code, Execution Speed, Memory Size and defects reported etc..
  • 6.
    • Indirect Measuresof the product include functionality, quality, complexity, efficiency, reliability, maintainability etc… • Software Metrics can be categorized into : • 1.Size Oriented Metrics • 2.Functioned Oriented Metrics • 3.Human Oriented Metrics
  • 10.
    Size Oriented Metrics •Productivity=KLOC/Person-months • Quality=Defects/KLOC • Cost=$(000)?KLOC • Documentation=Pages Per documentation/KLOC
  • 14.
    Function Oriented Metrics •Productivity=FP/Person-month • Quality=Defects/FP • Cost=$(000)/FP • Document=Ppdoc/FP
  • 19.
  • 20.
    • Now let’stry to implement this technique with some example. • 1. Draw a cause and effect graph based on a requirement/situation 2. Cause and Effect graph is given, draw a decision table based on it to draw the test case. • Let’s see both of them one by one.
  • 21.
    • The “Printmessage” is software that read two characters and, depending on their values, messages must be printed. • The first character must be an “A” or a “B”. • The second character must be a digit. • If the first character is an “A” or “B” and the second character is a digit, the file must be updated. • If the first character is incorrect (not an “A” or “B”), the message X must be printed. • If the second character is incorrect (not a digit), the message Y must be printed.
  • 22.
    • Solution: • Thecauses for this situation are: C1 – First character is A C2 – First character is B C3 – the Second character is a digit • The effects (results) for this situation are E1 – Update the file E2 – Print message “X” E3 – Print message “Y”
  • 23.
    First, draw thecauses and effects as shown below:
  • 24.
    • In thisexample, let’s start with Effect E1. • Effect E1 is to update the file. The file is updated when – The first character is “A” and the second character is a digit – The first character is “B” and the second character is a digit – The first character can either be “A” or “B” and cannot be both.
  • 25.
    • Now let’sput these 3 points in symbolic form: • For E1 to be true – following are the causes: – C1 and C3 should be true – C2 and C3 should be true – C1 and C2 cannot be true together. This means C1 and C2 are mutually exclusive.
  • 26.
    So as perthe above diagram, for E1 to be true the condition is (C1 C2) C3
  • 27.
    •The circle inthe middle is just an interpretation of the middle point to make the graph less messy. There is a third condition where C1 and C2 are mutually exclusive. So the final graph for effect E1 to be true is shown below:
  • 28.
    • Let’s moveto Effect E2: E2 states to print message “X”. Message X will be printed when the First character is neither A nor B. Which means Effect E2 will hold true when either C1 OR C2 is invalid. So the graph for Effect E2 is shown as (In blue line)
  • 29.
    • For EffectE3. E3 states to print message “Y”. Message Y will be printed when Second character is incorrect. Which means Effect E3 will hold true when C3 is invalid. So the graph for Effect E3 is shown as (In Green line).