1. Softchoice Corporation (TSX:SO)
Technology Distributors Employees: 1,170 Incorporated: 1989 in CD
173 Dufferin Street Softchoice Corporation provides technology solutions and services to small, medium, and large businesses, and public sector institutions
Suite 200 in the United States and Canada. It offers solution design, implementation, and asset management services, as well as access to
technology distribution networks. The company also markets hardware products, including notebooks, desktops, monitors, networking,
Toronto, Ontario M6K 3H7
servers, printing and imaging, and mobility products; and software products, such as licensing, networking, security, business, creativity,
Canada education, and operating system products. In addition, it provides various solutions comprising client computing, data center, networking,
Phone: 416-588-9000 security, storage and data management, and unified communications solutions; and...
www.softchoice.com
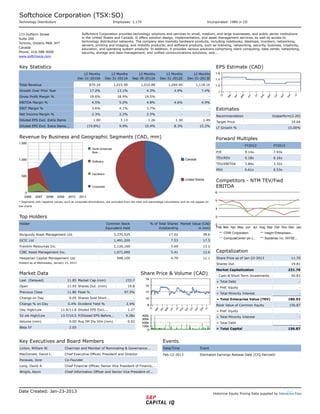
Key Statistics EPS Estimate (CAD)
12 Months 12 Months 12 Months 12 Months 12 Months
Dec-31-2010A Dec-31-2011A Sep-30-2012A Dec-31-2012E Dec-31-2013E
Total Revenue 879.24 1,015.99 1,010.88 1,044.94 1,118.16
Growth Over Prior Year 17.2% 13.1% 4.3% 4.9% 7.4%
Gross Profit Margin % 18.6% 18.9% 19.5% - -
EBITDA Margin % 4.5% 5.0% 4.8% 4.6% 4.9%
EBIT Margin % 3.6% 4.1% 3.7% - - Estimates
Net Income Margin % 2.3% 2.2% 2.5% - -
Recommendation Outperform(2.20)
Diluted EPS Excl. Extra Items 1.00 1.13 1.26 1.30 1.49
Target Price 14.04
Diluted EPS Excl. Extra Items... (19.8%) 9.9% 10.4% 8.3% 15.2%
LT Growth % 15.00%
Revenue by Business and Geographic Segments (CAD, mm) Forward Multiples
FY2012 FY2013
P/E 9.14x 7.93x
TEV/REV 0.18x 0.16x
TEV/EBITDA 3.84x 3.32x
PEG 0.61x 0.53x
Competitors - NTM TEV/Fwd
EBITDA
* Segments with negative values, such as corporate eliminations, are excluded from the total and percentage calculations and do not appear on
the charts
Top Holders
Holder Common Stock % of Total Shares Market Value (CAD
Equivalent Held Outstanding in mm)
Burgundy Asset Management Ltd. 3,370,525 17.02 39.6
GCIC Ltd 1,491,200 7.53 17.5
Franklin Resources Inc. 1,126,160 5.69 13.2
CIBC Asset Management Inc. 1,071,690 5.41 12.6 Capitalization
Hesperian Capital Management Ltd. 948,100 4.79 11.1 Share Price as of Jan-22-2013 11.70
Holders as of Wednesday, January 23, 2013 Shares Out. 19.81
Market Capitalization 231.76
Market Data Share Price & Volume (CAD) - Cash & Short Term Investments 50.83
Last (Delayed) 11.85 Market Cap (mm) 233.7 + Total Debt -
Open 11.93 Shares Out. (mm) 19.8 + Pref. Equity -
Previous Close 11.80 Float % 97.5% + Total Minority Interest -
Change on Day 0.05 Shares Sold Short... - = Total Enterprise Value (TEV) 180.93
Change % on Day 0.4% Dividend Yield % 2.4% Book Value of Common Equity 156.87
Day High/Low 11.9/11.8 Diluted EPS Excl.... 1.27 + Pref. Equity -
52 wk High/Low 13.7/10.5 P/Diluted EPS Before... 9.28x + Total Minority Interest -
Volume (mm) 0.00 Avg 3M Dly Vlm (mm) 0.02 + Total Debt -
Beta 5Y 2.05 = Total Capital 156.87
Key Executives and Board Members Events
Linton, William W. Chairman and Member of Nominating & Governance... Date/Time Event
MacDonald, David L. Chief Executive Officer, President and Director Feb-12-2013 Estimated Earnings Release Date (CIQ Derived)
Panavas, Jone Co-Founder
Long, David A. Chief Financial Officer, Senior Vice President of Finance,...
Wright, Kevin Chief Information Officer and Senior Vice President of...
Date Created: Jan-23-2013 Historical Equity Pricing Data supplied by