1. ALLTEL CORPORATION
CONSOLIDATED HIGHLIGHTS AND SUPPLEMENTAL OPERATING INFORMATION (UNAUDITED)
(Dollars in millions, except per customer amounts)
THREE MONTHS ENDED
Increase
March 31, March 31, (Decrease)
2008 2007 Amount %
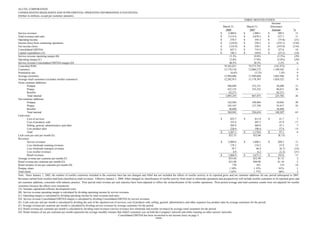
Service revenues $ 2,089.6 $ 1,880.1 $ 209.5 11
Total revenues and sales $ 2,315.6 $ 2,078.5 $ 237.1 11
Operating income $ 278.5 $ 354.3 $ (75.8) (21)
Income (loss) from continuing operations $ (124.8) $ 230.3 $ (355.1) (154)
Net income (loss) $ (124.9) $ 230.1 $ (355.0) (154)
Consolidated EBITDA $ 847.3 $ 719.5 $ 127.8 18
Capital expenditures (A) $ 146.3 $ 169.6 $ (23.3) (14)
Service revenue operating margin (B) 13.3% 18.8% (5.5%) (29)
Operating margin (C) 12.0% 17.0% (5.0%) (29)
Service revenue Consolidated EBITDA margin (D) 40.5% 38.3% 2.2% 6
Controlled POPs 79,383,821 79,575,793 (191,972) -
Customers 13,170,134 12,060,572 1,109,562 9
Penetration rate 16.6% 15.2% 1.4% 9
Average customers 12,984,606 11,940,660 1,043,946 9
Average retail customers (excludes reseller customers) 12,202,915 11,178,393 1,024,522 9
Gross customer additions:
Postpay 588,849 532,151 56,698 11
Prepay 422,135 335,322 86,813 26
Reseller 82,271 - 82,271 -
Total internal 1,093,255 867,473 225,782 26
Net customer additions:
Postpay 162,926 108,884 54,042 50
Prepay 183,167 127,750 55,417 43
Reseller 38,848 - 38,848 -
Total internal 384,941 236,634 148,307 63
Cash costs:
Cost of services $ 652.7 $ 611.0 $ 41.7 7
Cost of products sold 335.4 287.5 47.9 17
Selling, general, administrative and other 505.0 469.9 35.1 7
Less product sales 226.0 198.4 27.6 14
Total $ 1,267.1 $ 1,170.0 $ 97.1 8
Cash costs per unit per month (E) $32.53 $32.66 $(.13) -
Revenues:
Service revenues $ 2,089.6 $ 1,880.1 $ 209.5 11
Less wholesale roaming revenues 178.1 154.2 23.9 15
Less wholesale transport revenues 39.7 46.4 (6.7) (14)
Less reseller revenues 4.9 6.2 (1.3) (21)
Retail revenues $ 1,866.9 $ 1,673.3 $ 193.6 12
Average revenue per customer per month (F) $53.64 $52.49 $1.15 2
Retail revenue per customer per month (G) $51.00 $49.90 $1.10 2
Retail minutes of use per customer per month (H) 770 651 119 18
Postpay churn 1.34% 1.33% .01% 1
Total churn 1.83% 1.77% .06% 3
Note: Since January 1, 2002, the number of reseller customers included in the customer base has not changed and Alltel has not included the effects of reseller activity in its reported gross and net customer additions for any period subsequent to 2001.
Revenues earned from resellers had been classified as retail revenues. Effective January 1, 2008, Alltel changed its classification of reseller activity from retail to wholesale operations and prospectively will include reseller customers in its reported gross and
net customer additions, consistent with industry practice. Prior period retail revenue per unit statistics have been adjusted to reflect the reclassification of the reseller operations. Prior period average and total customer counts were not adjusted for reseller
customers because the effects were immaterial.
(A) Includes capitalized software development costs.
(B) Service revenue operating margin is calculated by dividing operating income by service revenues.
(C) Operating margin is calculated by dividing operating income by total revenues and sales.
(D) Service revenue Consolidated EBITDA margin is calculated by dividing Consolidated EBITDA by service revenues.
(E) Cash costs per unit per month is calculated by dividing the sum of the reported cost of services, cost of products sold, selling, general, administrative and other expenses less product sales by average customers for the period.
(F) Average revenue per customer per month is calculated by dividing service revenues by average customers for the period.
(G) Retail revenue per customer per month is calculated by dividing retail revenues (service revenues less wholesale and reseller revenues) by average retail customers for the period.
(H) Retail minutes of use per customer per month represents the average monthly minutes that Alltel's customers use on both the Company's network and while roaming on other carriers' networks.
Consolidated EBITDA has been reconciled to net income (loss) on page 5.
-more-
2. ALLTEL CORPORATION
CONSOLIDATED STATEMENTS OF OPERATIONS-Page 2
(Millions)
THREE MONTHS ENDED
March 31, March 31,
2008 2007
(Successor) (Predecessor)
Revenues and sales:
Service revenues $ 2,089.6 $ 1,880.1
Product sales 226.0 198.4
Total revenues and sales 2,315.6 2,078.5
Costs and expenses:
Cost of services 652.7 611.0
Cost of products sold 335.4 287.5
Selling, general, administrative and other 505.0 469.9
Depreciation and amortization 526.5 349.5
Integration expenses, restructuring and other charges 17.5 6.3
Total costs and expenses 2,037.1 1,724.2
Operating income 278.5 354.3
Equity earnings in unconsolidated partnerships 13.0 15.0
Minority interest in consolidated partnerships (8.2) (9.7)
Other income, net 14.1 7.7
Interest expense (496.5) (46.7)
Gain on disposal of assets - 56.5
Income (loss) from continuing operations before income taxes (199.1) 377.1
Income tax expense (benefit) (74.3) 146.8
Income (loss) from continuing operations (124.8) 230.3
Loss from discontinued operations (0.1) (0.2)
Net income (loss) $ (124.9) $ 230.1
-more-
3. ALLTEL CORPORATION
CONSOLIDATED BALANCE SHEETS-Page 3
(Millions)
ASSETS LIABILITIES AND SHAREHOLDERS' EQUITY
March 31, December 31, March 31, December 31,
2008 2007 2008 2007
CURRENT ASSETS: CURRENT LIABILITIES:
Cash and short-term investments $ 1,031.6 $ 833.3 Current maturities of long-term debt $ 289.7 $ 140.1
Accounts receivable (less allowance for Accounts payable 519.2 603.6
doubtful accounts of $49.2 and Advance payments and customer deposits 208.0 195.9
$32.6, respectively) 799.9 831.1 Accrued taxes 121.9 120.4
Inventories 167.4 196.0 Accrued interest 162.4 187.1
Prepaid expenses and other 128.9 142.8 Other current liabilities 162.4 271.9
Assets related to discontinued operations 0.4 0.3 Liabilities related to discontinued operations 0.3 0.2
Total current assets 2,128.2 2,003.5 Total current liabilities 1,463.9 1,519.2
Investments 535.2 536.1
Goodwill 16,945.3 16,917.4 Long-term debt 23,347.0 23,374.7
Other intangibles 6,599.4 6,784.6 Deferred income taxes 2,342.0 2,542.7
Other liabilities 542.4 266.4
PROPERTY, PLANT AND EQUIPMENT:
Land and improvements 255.6 251.1 Total liabilities 27,695.3 27,703.0
Buildings and improvements 860.6 836.4
Operating plant and equipment 3,801.9 3,650.3
Information processing 403.1 368.8
Furniture and fixtures 106.0 99.8 SHAREHOLDERS' EQUITY:
Under construction 259.2 360.1 Common stock 4.5 4.5
Additional paid-in capital 4,539.1 4,536.7
Total property, plant and equipment 5,686.4 5,566.5 Accumulated other comprehensive loss (163.4) (5.3)
Less accumulated depreciation 499.1 164.9 Retained deficit (228.3) (103.4)
Net property, plant and equipment 5,187.3 5,401.6 Total shareholders' equity 4,151.9 4,432.5
Other assets 444.9 485.3
Assets related to discontinued operations 6.9 7.0
TOTAL LIABILITIES AND
TOTAL ASSETS $ 31,847.2 $ 32,135.5 SHAREHOLDERS' EQUITY $ 31,847.2 $ 32,135.5
-more-
4. ALLTEL CORPORATION
CONSOLIDATED STATEMENTS OF CASH FLOWS-Page 4
(Millions)
March 31, March 31,
2008 2007
(Successor) (Predecessor)
Cash Flows from Operating Activities:
Net income (loss) $ (124.9) $ 230.1
Adjustments to reconcile net income (loss) to net cash provided from operating activities:
Loss from discontinued operations 0.1 0.2
Depreciation and amortization 526.5 349.5
Provision for doubtful accounts 24.7 37.3
Amortization of deferred financing costs 45.7 0.7
Non-cash portion of gain on disposal of assets - (56.5)
Change in deferred income taxes (79.9) 12.1
Other, net (0.5) (7.4)
Changes in operating assets and liabilities, net of effects of acquisitions and dispositions:
Accounts receivable 6.4 3.5
Inventories 28.6 4.3
Accounts payable (84.4) (89.8)
Other current liabilities (125.6) 99.0
Other, net (10.9) (21.8)
Net cash provided from operating activities 205.8 561.2
Cash Flows from Investing Activities:
Additions to property, plant and equipment (138.1) (161.8)
Additions to capitalized software development costs (8.2) (7.8)
Purchases of property, net of cash acquired - (2.5)
Proceeds from the sale of assets 18.0 -
Proceeds from the sale of investments - 188.7
Proceeds from the return on investments 13.2 10.9
Other, net 3.8 (0.4)
Net cash provided from (used in) investing activities (111.3) 27.1
Cash Flows from Financing Activities:
Dividends paid on common and preferred stock - (45.9)
Repayments of long-term debt (35.4) (0.7)
Repurchases of common stock - (938.8)
Distributions to minority investors (10.8) (7.7)
Excess tax benefits from stock option exercises - 3.8
Long-term debt issued 150.0 -
Common stock issued - 42.4
Net cash provided from (used in) financing activities 103.8 (946.9)
Cash Flows from Discontinued Operations:
Cash provided from (used in) operating activities (0.1) 1.9
Cash provided from (used in) investing activities 0.1 (0.7)
Cash provided from (used in) financing activities - -
Net cash provided from discontinued operations - 1.2
Increase (decrease) in cash and short-term investments 198.3 (357.4)
Cash and Short-term Investments:
Beginning of the period 833.3 934.2
End of the period $ 1,031.6 $ 576.8
-more-
5. ALLTEL CORPORATION
RECONCILIATION OF NET INCOME (LOSS) TO CONSOLIDATED EBITDA (UNAUDITED)-Page 5
(Millions)
THREE MONTHS ENDED
March 31, March 31,
2008 2007
(Successor) (Predecessor)
Net income (loss) $ (124.9) $ 230.1
Loss from discontinued operations (A) 0.1 0.2
Income tax expense (benefit) (74.3) 146.8
Interest expense, net of interest income 484.1 39.5
Depreciation and amortization 526.5 349.5
EBITDA 811.5 766.1
Minority interest in consolidated partnerships 8.2 9.7
Equity earnings in unconsolidated partnerships, net of cash distributions received (0.3) (4.4)
Gain on disposal of assets (B) - (56.5)
Stock-based compensation expense, net of restricted shares surrendered for tax (C) 2.4 5.7
Integration expenses, restructuring and other charges (D) 17.5 6.3
Non-cash rental income, net of amortization of related deferred leasing costs (E) - (8.5)
Other non-cash items (0.6) 1.1
Management fee payable to Sponsors (F) 8.6 -
Consolidated EBITDA $ 847.3 $ 719.5
-more-
6. ALLTEL CORPORATION
NOTES TO RECONCILIATION OF NET INCOME (LOSS) TO CONSOLIDATED EBITDA
(UNAUDITED) -Page 6
On November 16, 2007, Alltel Corporation (quot;Alltelquot; or the quot;Companyquot;) was acquired by Atlantis Holdings LLC, a Delaware limited liability company (quot;Atlantis Holdingsquot; or quot;Parentquot;) and an affiliate of private investment funds TPG
Partners V, L.P. and GS Capital Partners VI Fund, L.P. (together the quot;Sponsorsquot;). The acquisition was completed through the merger of Atlantis Merger Sub, Inc., a Delaware corporation and wholly-owned subsidiary of Parent, with and
into Alltel (the quot;Mergerquot;), with Alltel surviving the Merger as a privately-held, majority-owned subsidiary of Parent. Although Alltel continues as the same legal entity after the Merger, Atlantis Holdings' cost of acquiring Alltel has been
pushed-down to establish a new accounting basis for Alltel. Accordingly, the accompanying consolidated financial statements are presented for two periods, Predecessor and Successor, which relate to the accounting periods preceding and
succeeding the consummation of the Merger.
Alltel also has presented calculations of earnings before interest, taxes and depreciation and amortization expense (quot;EBITDAquot;) and Consolidated EBITDA. Alltel has included this presentation of Consolidated EBITDA because covenants
in Alltel Communications, LLC’s senior secured credit facilities contain ratios based on this measure. Measurements of Consolidated EBITDA are based on the Company’s calculation of EBITDA (net income (loss), excluding the effects of
discontinued operations, and before net interest expense, provision for income taxes and depreciation and amortization) adjusted to exclude unusual items, certain non-cash charges and other items permitted in calculating covenant
compliance under the indenture and the credit facilities. Alltel believes that the application of these supplementary adjustments to EBITDA in determining Consolidated EBITDA are appropriate to provide additional information to
investors to demonstrate compliance with its financing covenants. If the Company’s Consolidated EBITDA were to decline below certain levels, covenants in the senior secured credit facilities that are based on Consolidated EBITDA,
including the maximum senior secured leverage ratio covenant, may be violated and could cause, among
other things, an inability to incur further indebtedness and in certain circumstances a default or mandatory prepayment of amounts outstanding under the senior secured term loan facility.
EBITDA and Consolidated EBITDA are not measures calculated in accordance with GAAP and should not be considered a substitute for operating income, net income (loss) or any other measure of financial performance reported in
accordance with GAAP or as measures of operating cash flows or liquidity. The presentation of EBITDA has limitations as an analytical tool, and should not be considered in isolation, or as a substitute for analysis of the Company’s results
of operations or cash flows as reported under GAAP. In particular, EBITDA and Consolidated EBITDA should not be viewed as a reliable indicator of Alltel’s ability to generate cash to service its debt obligations because certain of the
items added to net income (loss) to determine EBITDA and Consolidated EBITDA involve outlays of cash. As a result, actual cash available to service the Company’s debt obligations will be different from Consolidated EBITDA. In
addition to demonstrating compliance with its financing covenants, Alltel believes that the presentation of EBITDA and Consolidated EBITDA is helpful in highlighting operational trends because these measures exclude certain non-cash
charges and other non-operating items that are not representative of the Company’s core business
operations.
(A) The following are included in discontinued operations:
On November 7, 2007, Alltel signed a definitive agreement to sell one of its wireless markets for cash. Accordingly, this market has been classified from that date as discontinued operations. The sale is expected to be completed by mid-
2008.
As a condition of receiving approval from the Department of Justice (quot;DOJquot;) and the Federal Communications Commission (quot;FCCquot;) for its acquisition of Midwest Wireless Holdings (quot;Midwest Wirelessquot;), on September 7, 2006, Alltel
agreed to divest certain wireless operations in four rural markets in Minnesota. Accordingly, the four markets to be divested in Minnesota have been classified as discontinued operations in the accompanying unaudited consolidated
financial statements and an impairment charge of $1.7 million was recorded to reflect the fair value less cost to sell of the four rural markets required to be divested. On April 3, 2007, Alltel completed the sale of these properties.
(B) Through its merger with Western Wireless Corporation completed on August 1, 2005, Alltel acquired marketable equity securities. On January 24, 2007, Alltel completed the sale of these securities for $188.7 million in cash and recorded a
pretax gain from the sale of $56.5 million which is included in gain on disposal of assets.
(C) Compensation expense recognized by Alltel related to restricted stock and stock option awards.
(D) The following are included in integration expenses, restructuring and other charges:
In the first quarter of 2008, Alltel incurred $12.7 million of incremental expenses related to its participation in the 700 MHz spectrum auction conducted by the FCC that was completed on March 18, 2008. Alltel did not obtain any licenses
in the 700 MHz spectrum auction. The auction-related expenses primarily consisted of consulting fees and estimated bid withdrawal payments to be remitted to the FCC as a result of the Company withdrawing certain bids made during the
course of its participation in the auction. In connection with the Merger, Alltel incurred $3.4 million of incremental costs, primarily consisting of $2.4 million in employee retention bonuses and additional legal and accounting fees of $0.7
million. Alltel also recorded severance and employee benefit costs of $1.4 million related to a planned workforce reduction in connection with the reorganization of its corporate marketing operations.
In the first quarter of 2007, the Company incurred $2.6 million of integration expenses related to its acquisitions of Midwest Wireless and wireless properties in Illinois, Texas and Virginia completed during 2006. These expenses primarily
consisted of branding, signage and computer system conversion costs. Alltel also recorded a pretax charge of $3.7 million associated with the closing of two call centers consisting of severance and employee benefit costs related to a
planned workforce reduction.
(E) Represents non-cash rental income and amortization of deferred leasing costs related to Alltel's agreement to lease cell site towers to American Tower Corporation. The deferred rental income was received in advance by Alltel under the
terms of the leasing agreement. The remaining deferred rental income and deferred leasing costs were written-off in connection with the Merger.
(F) Represents the annual management fee and out-of-pocket expenses payable in each case to affiliates of the Sponsors in exchange for consulting and management advisory services. The annual management fee is equal to one percent of
Alltel’s Consolidated EBITDA.
-end-