Company Analysis - Zhejiang Expressway Co
•
0 likes•162 views

Zhejiang Expressway Co. Ltd. operates and manages toll roads in China. It designs, constructs, and provides services like advertising and fuel facilities for highways. Over half of its revenue and sales come from toll road operations in China. It has a market capitalization of $28.1 billion and its largest shareholders are investment firms like BlackRock and JPMorgan. Analyst recommendations are mixed with most target prices above the current stock price of $6.47.

Recommended
Recommended
More Related Content
What's hot
What's hot (16)
Viewers also liked
Viewers also liked (14)
Similar to Company Analysis - Zhejiang Expressway Co
Similar to Company Analysis - Zhejiang Expressway Co (20)
More from BCV
More from BCV (20)
Company Analysis - Zhejiang Expressway Co
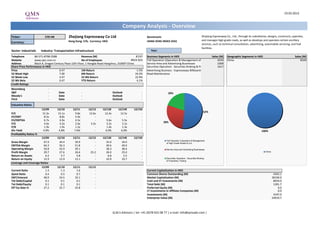
- 1. 19.03.2013 Company Analysis - Overview Ticker: 576 HK Zhejiang Expressway Co Ltd Benchmark: Zhejiang Expressway Co., Ltd., through its subsidiaries, designs, constructs, operates, Hong Kong: 576, Currency: HKD HANG SENG INDEX (HSI) and manages high grade roads, as well as develops and operates certain ancillary Currency: services, such as technical consultation, advertising, automobile servicing, and fuel facilities. Sector: Industrials Industry: Transportation Infrastructure Year: Telephone 86-571-8798-5588 Revenue (M) 8'237 Business Segments in HKD Sales (M) Geographic Segments in HKD Sales (M) Website www.zjec.com.cn No of Employees #N/A N/A Toll Operation (Operation & Management of High Grade Roads & Col 4243 China 8169 Address Block A, Dragon Century Plaza 12th Floor, 1 Hangda Road Hangzhou, 310007 China Service Area and Advertising Businesses 2309 Share Price Performance in HKD Securities Operation - Securities Broking & Proprietary Trading 1617 Price 6.47 1M Return -1.5% Advertising Business - Expressways Billboards Advertising 52 Week High 7.00 6M Return 24.2% Road Maintenance 52 Week Low 4.47 52 Wk Return 22.9% 52 Wk Beta 0.47 YTD Return 6.1% Credit Ratings Bloomberg - S&P - Date - Outlook - 20% Moody's - Date - Outlook - Fitch - Date - Outlook - Valuation Ratios 12/09 12/10 12/11 12/12 12/13E 12/14E 12/15E 52% P/E 15.3x 15.1x 9.8x 12.6x 12.4x 12.5x - EV/EBIT 8.5x 8.8x 5.9x - - - - EV/EBITDA 6.7x 6.9x 4.5x - 5.6x 5.5x - P/S 4.6x 4.2x 2.6x 3.2x 3.2x 3.1x - 28% P/B 1.9x 1.9x 1.2x - 1.4x 1.3x - Div Yield 4.9% 4.8% 7.6% - 6.0% 6.0% - 100% Profitability Ratios % 12/09 12/10 12/11 12/12 12/13E 12/14E 12/15E Toll Operation (Operation & Management Gross Margin 47.9 44.4 39.9 - 35.0 34.0 - of High Grade Roads & Col EBITDA Margin 64.3 56.3 51.8 - 49.6 49.0 - Operating Margin 50.8 43.9 39.1 - 38.3 38.4 - Service Area and Advertising Businesses Profit Margin 29.7 27.6 26.6 25.2 26.0 25.0 - China Return on Assets 6.2 5.7 5.8 - 6.8 5.5 - Return on Equity 12.9 12.9 12.1 - 10.9 10.7 - Securities Operation - Securities Broking & Proprietary Trading Leverage and Coverage Ratios 12/09 12/10 12/11 12/12 Current Ratio 1.3 1.3 1.6 - Current Capitalization in HKD Quick Ratio 0.4 0.5 0.7 - Common Shares Outstanding (M) 4343.1 EBIT/Interest 48.9 24.5 33.1 - Market Capitalization (M) 28100.0 Tot Debt/Capital 0.1 0.1 0.1 - Cash and ST Investments (M) 8659.0 Tot Debt/Equity 0.1 0.1 0.1 - Total Debt (M) 1281.7 Eff Tax Rate % 27.2 25.7 25.8 - Preferred Equity (M) 0.0 LT Investments in Affiliate Companies (M) 0.0 Investments (M) 4197.0 Enterprise Value (M) 24919.7 Q.M.S Advisors | tel: +41 (0)78 922 08 77 | e-mail: info@qmsadv.com |
- 2. Company Analysis - Analysts Ratings Zhejiang Expressway Co Ltd Target price in HKD Broker Recommendation Buy and Sell Recommendations vs Price and Target Price Price Brokers' Target Price 8 10 100% 0% 0% 0% 0% 0% 0% 0% 0% 6% 6% 6% 6% 9 7 8 80% 42% 42% 42% 42% 7 47% 44% 6 50% 50% 44% 44% 44% 6 50% 5 5 60% 4 3 4 2 40% 3 1 0 58% 58% 58% 58% Morgan Stanley Daiwa Securities Co. Ltd. Barclays Citic Securities Co., Ltd China International Capital OSK (Asia) Securities Cinda Securities Ltd JPMorgan HSBC DBS Vickers Nomura AMTD Financial Planning EVA Dimensions Guotai Junan Goldman Sachs Deutsche Bank Jefferies 56% SWS Research Co Ltd 53% 50% 50% 50% 50% 50% 2 20% 44% 1 Limited Corp 0% 0 mars.12 avr.12 mai.12 juin.12 juil.12 août.12 sept.12 oct.12 nov.12 déc.12 janv.13 févr.13 Buy Hold Sell Price Target Price Date Buy Hold Sell Date Price Target Price Broker Analyst Recommendation Target Date 28-Feb-13 44% 50% 6% 19-Mar-13 6.47 7.11 Goldman Sachs FRANK HE neutral/neutral 6.90 14-Mar-13 31-Jan-13 50% 44% 6% 18-Mar-13 6.23 7.11 Barclays PATRICK XU overweight 7.79 7-Mar-13 31-Dec-12 50% 44% 6% 15-Mar-13 6.44 7.11 HSBC WEI SIM underweight 6.80 26-Feb-13 30-Nov-12 50% 44% 6% 14-Mar-13 6.33 7.11 Deutsche Bank PHYLLIS WANG hold 7.12 6-Feb-13 31-Oct-12 58% 42% 0% 13-Mar-13 6.46 6.92 Morgan Stanley VICTORIA WONG Equalwt/In-Line 6.58 5-Feb-13 28-Sep-12 58% 42% 0% 12-Mar-13 6.36 6.92 JPMorgan CHAPMAN DENG overweight 7.40 5-Feb-13 31-Aug-12 58% 42% 0% 11-Mar-13 6.42 6.92 DBS Vickers PAUL YONG buy 7.22 21-Jan-13 31-Jul-12 58% 42% 0% 8-Mar-13 6.40 6.92 EVA Dimensions CRAIG STERLING buy 17-Jan-13 29-Jun-12 56% 44% 0% 7-Mar-13 6.50 6.92 Jefferies RONG LI buy 6.70 19-Nov-12 31-May-12 50% 50% 0% 6-Mar-13 6.51 6.78 Nomura SHIRLEY LAM buy 7.30 7-Oct-12 30-Apr-12 50% 50% 0% 5-Mar-13 6.65 6.78 Guotai Junan GARY WONG accumulate 6.22 29-Aug-12 30-Mar-12 53% 47% 0% 4-Mar-13 6.61 6.78 Daiwa Securities Co. Ltd. KELVIN LAU hold 5.30 27-Aug-12 1-Mar-13 6.48 6.78 SWS Research Co Ltd LEO FAN neutral 5.36 27-Aug-12 28-Feb-13 6.51 6.70 Citic Securities Co., Ltd SIMON YEUNG overweight 6.14 11-Jul-12 27-Feb-13 6.48 6.70 China International Capital Corp XIN YANG hold 5.59 15-May-12 26-Feb-13 6.50 6.70 AMTD Financial Planning Limited KENNY TANG SING HING buy 5.50 11-Nov-11 25-Feb-13 6.51 6.68 OSK (Asia) Securities EDWARD ZHONG buy 8.66 22-Nov-10 22-Feb-13 6.52 6.46 Cinda Securities Ltd ALVIN FUNG neutral 6.96 11-Nov-09 21-Feb-13 6.62 6.46 20-Feb-13 6.69 6.46 19-Feb-13 6.57 6.50 18-Feb-13 6.67 6.29 15-Feb-13 6.70 6.34 14-Feb-13 6.64 6.34 13-Feb-13 6.73 6.34 12-Feb-13 6.73 6.34 11-Feb-13 6.73 6.34 8-Feb-13 6.73 6.34 7-Feb-13 6.72 6.34 6-Feb-13 6.68 6.34 Q.M.S Advisors | tel: +41 (0)78 922 08 77 | e-mail: info@qmsadv.com |
- 3. 19.03.2013 Zhejiang Expressway Co Ltd Company Analysis - Ownership Ownership Type Ownership Statistics Geographic Ownership Distribution Geographic Ownership 0% Shares Outstanding (M) 4343.1 15% United States 52.20% Float 100.0% Japan 7.86% 6% 8% Short Interest (M) Hong Kong 7.03% 6% Short Interest as % of Float Britain 6.83% Days to Cover Shorts Luxembourg 6.25% Institutional Ownership 84.56% Germany 5.96% 6% 52% Retail Ownership 15.44% Australia 5.75% Insider Ownership 0.00% Others 8.11% 7% 85% Institutional Ownership Distribution 7% 8% Investment Advisor 92.03% Mutual Fund Manager 7.50% Hedge Fund Manager 0.47% Institutional Ownership Retail Ownership Insider Ownership Insurance Company 0.00% United States Japan Hong Kong Britain Pricing data is in HKD Others 0.00% Luxembourg Germany Australia Others Top 20 Owners: TOP 20 ALL Institutional Ownership Holder Name Position Position Change Market Value % of Ownership Report Date Source Country BLACKROCK 209'602'302 -1'703'113 1'356'126'894 14.62% 15.03.2013 ULT-AGG UNITED STATES 0% 0% 0% JP MORGAN 167'847'000 56'000 1'085'970'090 11.71% 29.01.2013 ULT-AGG 8% NOMURA 80'081'400 0 518'126'658 5.59% 22.06.2012 ULT-AGG VANGUARD GROUP INC 77'431'652 -1'950'000 500'982'788 5.40% 31.12.2012 MF-AGG UNITED STATES BANK OF NEW YORK MEL 71'802'253 0 464'560'577 5.01% 10.07.2012 EXCH UNITED STATES DEUTSCHE BANK AG 71'647'912 0 463'561'991 5.00% 06.09.2012 EXCH GERMANY T ROWE PRICE ASSOCIA 71'330'000 0 461'505'100 4.97% 09.10.2012 EXCH UNITED STATES VERITAS ASSET MANAGE 70'624'000 0 456'937'280 4.93% 25.01.2013 EXCH BRITAIN INVESCO HK LTD 70'370'149 0 455'294'864 4.91% 21.08.2012 EXCH HONG KONG MACQUARIE GROUP 70'051'583 374'000 453'233'742 4.89% 31.12.2012 ULT-AGG AUSTRALIA 92% BANK OF NEW YORK MEL -43'336'253 0 -280'385'557 -3.02% 10.07.2012 Short UNITED STATES DJE INVESTMENT SA 26'640'000 0 172'360'800 1.86% 28.12.2012 MF-AGG LUXEMBOURG FIDEURAM GESTIONS SA 20'118'637 -2'490'000 130'167'581 1.40% 28.02.2013 MF-AGG LUXEMBOURG PICTET & CIE 19'822'000 348'000 128'248'340 1.38% 30.11.2012 MF-AGG SWITZERLAND Investment Advisor Mutual Fund Manager Hedge Fund Manager Insurance Company Others INVESCO LTD 14'096'000 -13'042'000 91'201'120 0.98% 12.11.2012 MF-AGG UNITED STATES STATE STREET 9'210'000 40'000 59'588'700 0.64% 15.03.2013 ULT-AGG UNITED STATES DIMENSIONAL FUND ADV 8'010'000 0 51'824'700 0.56% 31.07.2012 MF-AGG UNITED STATES ING INVESTMENT MANAG 7'257'000 4'644'000 46'952'790 0.51% 31.12.2012 MF-AGG UNITED STATES SCHRODERS ASIA LIMIT 7'250'000 0 46'907'500 0.51% 31.07.2012 MF-AGG HONG KONG SCHRODER INVESTMENT 7'164'000 -302'000 46'351'080 0.50% 28.09.2012 MF-AGG BRITAIN Top 5 Insiders: Holder Name Position Position Change Market Value % of Ownership Report Date Source Q.M.S Advisors | tel: +41 (0)78 922 08 77 | e-mail: info@qmsadv.com |
- 4. Company Analysis - Financials I/IV Zhejiang Expressway Co Ltd Financial information is in HKD (M) Equivalent Estimates Periodicity: Fiscal Year 12/02 12/03 12/04 12/05 12/06 12/07 12/08 12/09 12/10 12/11 12/12 12/13E 12/14E 12/15E Income Statement Revenue 2'043 2'325 2'947 3'282 4'642 7'213 7'087 6'849 7'771 8'169 8'237 8'872 9'155 - Cost of Goods Sold 530 688 829 1'135 2'024 3'169 3'512 3'569 4'317 4'912 Gross Income 1'513 1'637 2'118 2'147 2'619 4'044 3'575 3'280 3'454 3'257 3'105 3'113 - Selling, General & Admin Expenses 111 139 118 79 97 175 115 183 116 140 (Research & Dev Costs) 0 0 Operating Income 1'431 1'553 2'039 2'113 2'678 3'911 3'530 3'479 3'408 3'193 3'401 3'517 - Interest Expense 154 125 97 96 70 62 86 71 139 96 - Foreign Exchange Losses (Gains) -1 -2 -0 -18 -22 -41 -45 -1 -18 -10 - Net Non-Operating Losses (Gains) -36 -69 155 -116 -44 -555 200 -91 -285 -247 Pretax Income 1'314 1'499 1'787 2'150 2'673 4'445 3'288 3'499 3'572 3'353 3'521 3'533 - Income Tax Expense 378 468 511 657 861 1'223 750 953 917 865 Income Before XO Items 936 1'031 1'276 1'493 1'812 3'222 2'539 2'546 2'655 2'489 - Extraordinary Loss Net of Tax 0 0 0 0 0 0 0 0 0 0 0 - Minority Interests 97 82 123 134 201 744 417 509 506 314 Diluted EPS Before XO Items 0.57 0.49 0.47 0.49 0.50 Net Income Adjusted* 839 949 1'153 1'359 1'611 2'479 2'121 2'037 2'148 2'175 2'073 2'304 2'293 EPS Adjusted 0.19 0.22 0.27 0.31 0.37 0.57 0.49 0.47 0.49 0.50 0.48 0.52 0.52 Dividends Per Share 0.12 0.14 0.14 0.21 0.26 0.32 0.35 0.35 0.36 0.37 0.39 0.39 Payout Ratio % 63.4 64.6 67.3 66.8 70.9 55.7 71.1 75.0 71.9 74.6 0.75 0.75 Total Shares Outstanding 4'343 4'343 4'343 4'343 4'343 4'343 4'343 4'343 4'343 4'343 Diluted Shares Outstanding 4'343 4'343 4'343 4'343 4'343 4'343 4'343 4'343 4'343 4'343 4'343 EBITDA 1'665 1'815 2'347 2'629 3'297 4'620 4'406 4'402 4'373 4'230 4'401 4'486 *Net income excludes extraordinary gains and losses and one-time charges. Q.M.S Advisors | tel: +41 (0)78 922 08 77 | e-mail: info@qmsadv.com |
- 5. Company Analysis - Financials II/IV Periodicity: 12/02 12/03 12/04 12/05 12/06 12/07 12/08 12/09 12/10 12/11 12/12 12/13E 12/14E 12/15E Balance Sheet Total Current Assets 1839.38415 1875.4103 1795.9899 1844.51626 4658.72996 13016.7104 11865.8079 20332.9616 23205.1644 18500.9629 + Cash & Near Cash Items 628 532 851 843 1'727 2'965 4'243 5'734 6'702 3'847 + Short Term Investments 1'075 1'272 539 542 132 1'543 868 910 1'417 4'670 + Accounts & Notes Receivable 14 20 25 21 54 88 86 57 60 59 + Inventories 2 3 6 6 12 16 19 20 21 33 + Other Current Assets 121 48 375 433 2'733 8'405 6'650 13'612 15'005 9'892 Total Long-Term Assets 11'828 12'259 12'729 13'827 14'846 16'390 16'847 16'466 16'489 17'416 + Long Term Investments 3 1 1 1 1 1 1 1 1 472 Gross Fixed Assets 12'110 12'785 13'375 15'001 16'501 1'583 1'931 2'012 2'364 2'835 Accumulated Depreciation 789 1'025 1'194 1'733 2'382 550 706 801 958 1'154 + Net Fixed Assets 11'320 11'760 12'181 13'268 14'119 1'033 1'225 1'211 1'406 1'681 + Other Long Term Assets 505 498 546 558 726 15'357 15'621 15'254 15'082 15'263 Total Current Liabilities 2'288 1'726 1'511 1'936 4'298 10'713 8'504 15'822 17'332 11'468 + Accounts Payable 195 345 279 386 2'861 8'495 6'838 13'799 14'366 9'197 + Short Term Borrowings 1'773 915 740 852 396 308 432 543 970 570 + Other Short Term Liabilities 320 466 492 698 1'041 1'909 1'233 1'480 1'996 1'700 Total Long Term Liabilities 1'317 1'942 1'920 1'857 1'899 1'845 1'704 1'597 1'489 1'519 + Long Term Borrowings 1'090 1'636 1'555 1'487 1'443 1'426 1'395 1'300 1'180 1'233 + Other Long Term Borrowings 227 306 365 369 455 419 309 298 310 286 Total Liabilities 3'605 3'668 3'431 3'793 6'197 12'557 10'208 17'419 18'822 12'987 + Long Preferred Equity 0 0 0 0 0 0 0 0 + Minority Interest 921 950 1'026 1'122 1'454 2'713 2'968 3'272 3'505 4'217 + Share Capital & APIC 7'527 7'494 7'503 7'676 7'962 8'539 9'071 4'932 9'423 9'849 + Retained Earnings & Other Equity 1'614 2'023 2'565 3'081 3'891 5'598 6'466 11'176 7'943 8'864 Total Shareholders Equity 10'062 10'467 11'094 11'879 13'308 16'850 18'505 19'380 20'872 22'930 Total Liabilities & Equity 13'667 14'135 14'525 15'672 19'505 29'407 28'713 36'799 39'694 35'917 Book Value Per Share 2.10 2.19 2.32 2.48 2.73 3.26 3.58 3.71 4.00 4.31 4.62 4.82 Tangible Book Value Per Share 2.03 2.13 2.26 2.42 2.63 3.19 3.51 3.65 3.93 4.24 Q.M.S Advisors | tel: +41 (0)78 922 08 77 | e-mail: info@qmsadv.com |
- 6. Company Analysis - Financials III/IV Periodicity: 12/02 12/03 12/04 12/05 12/06 12/07 12/08 12/09 12/10 12/11 12/12 12/13E 12/14E 12/15E Cash Flows Net Income 1'314 1'499 1'153 1'359 1'611 2'479 2'121 2'037 2'148 2'175 2'275 2'179 + Depreciation & Amortization 234 262 308 516 619 709 877 923 965 1'038 + Other Non-Cash Adjustments -240 -288 331 291 275 279 104 271 286 378 + Changes in Non-Cash Capital 161 118 -354 -218 -107 295 -8 202 -413 -609 Cash From Operating Activities 1'469 1'591 1'439 1'948 2'398 3'762 3'094 3'434 2'986 2'982 + Disposal of Fixed Assets 2 1 2 1 2 8 2 4 31 9 + Capital Expenditures -298 -621 -913 -897 -669 -108 -243 -186 -288 -377 -504 -348 + Increase in Investments 0 -233 0 0 -8 0 0 0 0 0 + Decrease in Investments 78 3 391 80 609 0 0 0 0 0 + Other Investing Activities -842 -25 149 -184 10 -1'237 -139 -113 -837 -3'441 Cash From Investing Activities -1'060 -876 -372 -1'000 -55 -1'337 -380 -294 -1'093 -3'809 + Dividends Paid -450 -513 -613 -894 -931 -1'201 -1'505 -1'516 -1'407 -1'622 + Change in Short Term Borrowings + Increase in Long Term Borrowings 3'836 3'283 913 1'082 780 841 786 227 944 557 + Decrease in Long Term Borrowings -3'827 -3'580 -1'173 -1'073 -1'332 -1'029 -756 -213 -714 -990 + Increase in Capital Stocks 0 0 0 0 0 0 0 0 0 0 + Decrease in Capital Stocks 0 0 0 0 0 0 0 0 0 0 + Other Financing Activities -37 2 -48 -62 -98 267 -159 -149 12 -203 Cash From Financing Activities -479 -808 -921 -946 -1'582 -1'122 -1'634 -1'651 -1'166 -2'258 Net Changes in Cash -69 -93 146 1 761 1'303 1'079 1'489 727 -3'086 Free Cash Flow (CFO-CAPEX) 1'171 970 525 1'051 1'729 3'654 2'851 3'248 2'699 2'605 2'923 3'296 Free Cash Flow To Firm 1'281 1'056 595 1'118 1'777 3'699 2'917 3'299 2'802 2'676 Free Cash Flow To Equity 1'182 673 3'473 2'883 3'266 2'959 2'181 Free Cash Flow per Share 0.27 0.22 0.12 0.24 0.40 0.84 0.66 0.75 0.62 0.60 Q.M.S Advisors | tel: +41 (0)78 922 08 77 | e-mail: info@qmsadv.com |
- 7. Company Analysis - Financials IV/IV Periodicity: 12/02 12/03 12/04 12/05 12/06 12/07 12/08 12/09 12/10 12/11 12/12 12/13E 12/14E 12/15E Ratio Analysis Valuation Ratios Price Earnings 15.5x 25.0x 20.2x 15.2x 15.7x 21.0x 9.2x 15.3x 15.1x 9.8x 12.6x 12.4x 12.5x EV to EBIT 10.6x 16.4x 12.4x 10.7x 10.0x 13.3x 5.4x 8.5x 8.8x 5.9x EV to EBITDA 9.1x 14.0x 10.7x 8.6x 8.1x 11.2x 4.4x 6.7x 6.9x 4.5x 5.6x 5.5x Price to Sales 6.4x 10.2x 7.9x 6.3x 5.5x 7.2x 2.8x 4.6x 4.2x 2.6x 3.2x 3.2x 3.1x Price to Book 1.4x 2.5x 2.3x 1.9x 2.2x 3.8x 1.3x 1.9x 1.9x 1.2x 1.4x 1.3x Dividend Yield 4.1% 2.6% 2.6% 4.4% 4.5% 2.7% 7.7% 4.9% 4.8% 7.6% 6.0% 6.0% Profitability Ratios Gross Margin 74.1% 70.4% 71.9% 65.4% 56.4% 56.1% 50.5% 47.9% 44.4% 39.9% 35.0% 34.0% EBITDA Margin 81.5% 78.1% 79.6% 80.1% 71.0% 64.0% 62.2% 64.3% 56.3% 51.8% 49.6% 49.0% - Operating Margin 70.0% 66.8% 69.2% 64.4% 57.7% 54.2% 49.8% 50.8% 43.9% 39.1% 38.3% 38.4% Profit Margin 41.1% 40.8% 39.1% 41.4% 34.7% 34.4% 29.9% 29.7% 27.6% 26.6% 25.2% 26.0% 25.0% Return on Assets 6.1% 6.8% 8.0% 9.0% 9.2% 10.3% 7.2% 6.2% 5.7% 5.8% 6.8% 5.5% Return on Equity 9.4% 10.2% 11.7% 13.1% 14.3% 19.2% 14.1% 12.9% 12.9% 12.1% 10.9% 10.7% Leverage & Coverage Ratios Current Ratio 0.80 1.09 1.19 0.95 1.08 1.22 1.40 1.29 1.34 1.61 Quick Ratio 0.75 1.06 0.94 0.73 0.45 0.43 0.61 0.42 0.47 0.75 Interest Coverage Ratio (EBIT/I) 9.28 11.60 20.95 20.76 31.12 38.47 41.01 48.88 24.54 33.11 Tot Debt/Capital 0.22 0.20 0.17 0.16 0.12 0.09 0.09 0.09 0.09 0.07 Tot Debt/Equity 0.28 0.24 0.21 0.20 0.14 0.10 0.10 0.10 0.10 0.08 Others Asset Turnover 0.15 0.17 0.21 0.22 0.27 0.30 0.24 0.21 0.20 0.22 Accounts Receivable Turnover 63.22 136.80 129.58 143.08 125.04 102.54 79.70 95.38 133.59 137.30 Accounts Payable Turnover 2.51 2.55 2.66 3.42 1.27 0.57 0.45 0.35 0.31 0.42 Inventory Turnover 340.97 288.09 186.10 185.89 222.09 230.42 203.06 186.97 214.54 184.85 Effective Tax Rate 28.8% 31.2% 28.6% 30.6% 32.2% 27.5% 22.8% 27.2% 25.7% 25.8% Q.M.S Advisors | tel: +41 (0)78 922 08 77 | e-mail: info@qmsadv.com |
- 8. Company Analysis - Peers Comparision HUTCHISON SHENZHEN EXPRE- ZHEJIANG EXPRESS JIANGSU EXPRES-H HOPEWELL INFR CHINA STATE -A ANHUI EXPRESS-H CHIYODA CORP KAJIMA CORP OBAYASHI CORP SHIMIZU CORP BOUYGUES SA HOCHTIEF AG BILFINGER SE SKANSKA AB-B WHAMPO A Latest Fiscal Year: 12/2012 12/2011 12/2011 06/2012 12/2011 12/2011 12/2011 03/2012 03/2012 03/2012 03/2012 12/2012 12/2012 12/2012 12/2012 52-Week High 7.00 8.30 88.00 4.75 4.18 4.27 5.08 1'309.00 299.00 533.00 341.00 24.33 55.65 82.43 120.00 52-Week High Date 11.01.2013 05.02.2013 04.02.2013 16.10.2012 18.02.2013 18.05.2012 31.01.2013 26.10.2012 11.01.2013 11.01.2013 15.01.2013 19.03.2012 27.02.2013 20.02.2013 19.03.2012 52-Week Low 4.80 6.20 61.80 3.58 2.90 3.03 3.16 901.00 191.00 295.00 223.00 17.54 34.64 58.82 93.30 52-Week Low Date 18.05.2012 06.09.2012 05.06.2012 05.06.2012 24.09.2012 28.11.2012 15.06.2012 04.06.2012 04.06.2012 04.06.2012 14.11.2012 16.11.2012 06.09.2012 05.06.2012 01.06.2012 Daily Volume 2'266'259 3'302'000 4'765'086 2'383'200 96'668'255 709'350 82'000 2'755'000 13'646'000 5'052'000 2'076'000 454'881 29'320 19'967 707'857 Current Price (3/dd/yy) 6.47 7.93 80.10 4.00 3.41 3.28 4.15 1'079.00 258.00 457.00 309.00 22.34 54.49 82.12 116.00 52-Week High % Change -7.6% -4.5% -9.0% -15.8% -18.4% -23.2% -18.3% -17.6% -13.7% -14.3% -9.4% -8.2% -2.1% -0.4% -3.3% 52-Week Low % Change 34.8% 27.9% 29.6% 11.7% 17.6% 8.3% 31.3% 19.8% 35.1% 54.9% 38.6% 27.3% 57.3% 39.6% 24.3% Total Common Shares (M) 4'343.1 5'037.7 4'263.4 2'961.7 30'000.0 2'180.8 1'658.6 259.1 1'038.8 718.3 784.7 324.0 73.6 46.0 411.8 Market Capitalization 28'100 35'416 341'496 12'327 102'300 6'521 7'838 280'890 272'787 329'730 243'651 7'128 4'196 3'780 51'312 Total Debt 1'462.6 5'531.5 225'056.0 9'002.7 133'022.5 11'204.5 2'345.0 10'209.0 585'370.0 405'658.0 375'812.0 8'642.0 4'456.5 1'180.9 11'103.0 Preferred Stock - - - - - - - - - - - - - - - Minority Interest 3'420.6 463.1 39'171.0 55.3 29'331.8 1'293.0 294.3 617.0 (9.0) 25'028.0 2'738.0 1'500.0 1'603.4 8.0 166.0 Cash and Equivalents 6'908.5 825.2 66'539.0 3'753.6 94'380.3 2'175.7 597.8 174'076.0 179'098.0 124'497.0 209'793.0 4'487.0 3'143.6 1'087.2 5'770.0 Enterprise Value 19'901 34'020 541'074 15'580 210'983 16'895 8'700 112'218 617'372 721'474 452'356 12'783 7'112 3'881 56'811 Valuation Total Revenue LFY 6'700.3 7'214.7 233'700.0 3'185.6 463'876.8 2'846.3 2'959.7 254'675.0 1'457'754.0 1'245'772.0 1'336'194.0 33'547.0 25'527.7 8'508.8 129'350.0 LTM 6'700.3 7'300.0 237'094.0 2'874.2 463'876.8 2'846.3 2'837.1 305'846.0 1'483'907.0 1'354'265.0 1'374'435.0 33'547.0 25'527.7 8'508.8 129'350.0 CY+1 7'104.4 7'642.4 238'838.1 2'100.5 576'124.5 3'024.5 2'962.8 413'753.3 1'443'660.7 1'403'382.8 1'407'840.0 33'516.2 26'295.3 8'788.6 129'702.9 CY+2 7'330.8 7'888.7 259'565.9 1'971.8 671'681.0 3'115.0 3'412.2 455'573.3 1'475'598.0 1'432'734.1 1'387'306.8 33'717.1 27'382.4 9'209.0 132'874.7 EV/Total Revenue LFY 2.3x 5.0x 2.1x 5.1x 0.3x 6.3x 2.8x 0.6x 0.4x 0.5x 0.3x 0.4x 0.2x 0.4x 0.4x LTM 2.3x 4.9x 2.0x 5.7x 0.3x 6.3x 2.9x 0.5x 0.4x 0.4x 0.3x 0.4x 0.2x 0.4x 0.4x CY+1 3.0x 4.5x 2.2x 7.1x - - 3.1x 0.4x 0.4x 0.5x 0.3x 0.4x 0.3x 0.4x 0.4x CY+2 2.8x 4.2x 2.0x 7.3x - - 3.2x 0.3x 0.4x 0.4x 0.3x 0.4x 0.2x 0.4x 0.4x EBITDA LFY 3'511.9 4'384.5 34'601.0 1'659.2 28'914.4 2'288.0 1'848.4 26'834.0 47'238.0 43'099.0 27'006.0 2'890.0 1'477.3 577.5 4'462.0 LTM 3'454.4 4'360.7 36'165.0 1'752.5 28'914.4 2'288.0 1'813.9 30'397.0 49'975.0 48'077.0 21'238.0 2'890.0 1'477.3 577.5 4'462.0 CY+1 3'523.8 4'357.1 44'708.8 1'525.2 - 2'218.0 1'793.3 29'791.0 43'949.7 46'749.4 24'397.0 2'884.9 1'639.9 582.0 6'151.7 CY+2 3'591.9 4'485.0 49'529.0 1'619.2 - 2'187.7 1'831.8 33'845.2 48'798.3 48'699.4 27'690.7 2'939.0 1'788.4 624.0 6'526.5 EV/EBITDA LFY 4.4x 8.2x 14.0x 9.9x 5.4x 7.8x 4.5x 5.5x 12.5x 13.6x 14.9x 4.5x 4.2x 6.0x 11.0x LTM 4.5x 8.2x 13.4x 9.4x 5.4x 7.8x 4.6x 4.8x 11.8x 12.2x 19.0x 4.5x 4.2x 6.0x 11.0x CY+1 6.0x 7.8x 11.7x 9.7x - - 5.1x 5.0x 13.6x 13.6x 18.4x 4.6x 4.2x 6.4x 8.7x CY+2 5.7x 7.4x 10.5x 8.9x - - 6.0x 4.1x 12.1x 13.0x 16.0x 4.5x 3.8x 5.8x 8.2x EPS LFY 0.42 - 4.74 - 0.43 0.39 0.51 55.44 4.87 9.67 1.54 2.00 1.41 6.23 - LTM 0.39 0.47 4.67 0.23 0.45 0.40 0.48 66.89 6.60 -0.94 -1.87 2.01 2.15 6.23 6.93 CY+1 0.42 0.47 5.42 0.20 0.52 0.35 0.47 68.84 20.45 17.09 7.54 2.46 3.31 5.72 8.35 CY+2 0.41 0.50 6.30 0.21 0.61 0.36 0.46 77.87 16.91 28.54 11.59 2.71 4.04 6.41 8.94 P/E LFY 13.3x 13.4x 17.2x 14.1x 7.6x 8.2x 6.9x 16.1x 39.1x - - 11.1x 25.3x 13.2x 16.7x LTM 12.5x - 14.5x - 7.9x 8.4x 6.9x - - - - 11.1x 25.3x 13.2x - CY+1 12.4x 13.6x 14.8x 15.9x 6.6x 9.5x 7.1x 15.7x 12.6x 26.7x 41.0x 9.1x 16.5x 14.4x 13.9x CY+2 12.5x 12.8x 12.7x 15.4x 5.6x 9.1x 7.2x 13.9x 15.3x 16.0x 26.7x 8.2x 13.5x 12.8x 13.0x Revenue Growth 1 Year (1.2%) 9.7% 11.7% 2.3% 30.5% (6.4%) 15.9% 3.1% 10.0% 10.1% 2.5% 2.6% 9.6% 3.7% 8.9% 5 Year (0.8%) 8.5% 4.1% 9.8% 29.4% 77.0% 14.9% (8.4%) (2.6%) 1.8% 1.4% 1.6% 12.5% 0.7% (1.1%) EBITDA Growth 1 Year - 1.7% (2.9%) 5.5% 38.9% 40.7% 4.3% 33.4% 30.5% 24.7% (11.7%) (10.5%) (11.8%) 13.6% (8.3%) 5 Year 0.8% 8.6% (0.0%) 1.3% 40.4% 28.8% 6.1% (2.3%) (7.9%) (5.7%) (14.6%) (3.3%) 32.7% 12.2% (6.6%) EBITDA Margin LTM 51.0% 59.7% 15.3% 61.0% 6.2% 80.4% 63.9% 9.9% 3.4% 3.6% 1.5% 8.6% 5.8% 6.8% 3.4% CY+1 49.6% 57.0% 18.7% 72.6% - 73.3% 60.5% 7.2% 3.0% 3.3% 1.7% 8.6% 6.2% 6.6% 4.7% CY+2 49.0% 56.9% 19.1% 82.1% - 70.2% 53.7% 7.4% 3.3% 3.4% 2.0% 8.7% 6.5% 6.8% 4.9% Leverage/Coverage Ratios Total Debt / Equity % 9.6% 30.5% 62.6% 123.7% 149.3% 121.7% 36.8% 6.1% 228.0% 119.1% 123.5% 100.7% 168.8% 58.2% 57.9% Total Debt / Capital % 7.3% 22.9% 36.1% 55.1% 52.9% 51.6% 26.0% 5.7% 69.5% 52.6% 55.0% 46.2% 51.2% 36.7% 36.5% Total Debt / EBITDA 0.304x 1.487x 6.947x 4.496x 4.601x 4.897x 1.392x 0.336x 10.435x 8.309x 16.394x 2.990x 3.017x 2.045x 2.488x Net Debt / EBITDA -1.749x 1.302x 4.315x 3.226x 1.336x 3.946x 0.903x -5.536x 7.380x 6.358x 9.154x 1.438x 0.889x 0.162x 1.195x EBITDA / Int. Expense 43.875x 13.753x 4.084x 5.629x 5.620x 4.157x 16.819x 129.633x 6.389x 11.091x 6.084x 8.210x 4.546x 14.259x 9.637x Credit Ratings S&P LT Credit Rating - - A- - - - - - NR NR NR BBB+ - BBB+ - S&P LT Credit Rating Date - - 09.11.2010 - - - - - 10.04.2009 10.04.2009 09.01.2007 30.11.2011 - 23.10.2012 - Moody's LT Credit Rating - - A3 - - - - - WR WR - (P)A3 - - - Moody's LT Credit Rating Date - - 29.10.2010 - - - - - 03.04.2009 18.08.2006 - 26.01.2012 - - - Q.M.S Advisors | tel: +41 (0)78 922 08 77 | e-mail: info@qmsadv.com |