More Related Content
Similar to Indian economy indicators across 9th, 10th & 11th plans
Similar to Indian economy indicators across 9th, 10th & 11th plans (20)
Indian economy indicators across 9th, 10th & 11th plans
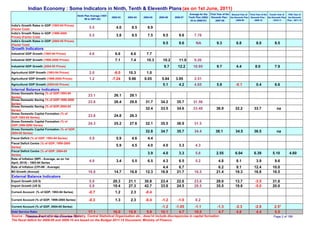
- 1. Indian Economy : Some Indicators in Ninth, Tenth & Eleventh Plans (as on 1st June, 2011)
Average for the First Year of the Second Year of Third Year of the Fourth Year of Fifth Year of
Ninth Plan Average (1997-
2002-03 2003-04 2004-05 2005-06 2006-07 Tenth Plan (2002- Eleventh Plan : the Eleventh Plan Eleventh Plan : the Eleventh Plan the Eleventh
98 to 2001-02) : 2008-09 2009-10 : 2010-11 Plan : 2011-12
03 to 2006-07) 2007-08
India's Growth Rates in GDP (1993-94 Prices)
(Factor Cost)
5.5 4.0 8.5 6.9
India's Growth Rates in GDP (1999-2000
Prices) (Factor Cost)
5.5 3.8 8.5 7.5 9.5 9.6 7.78
India's Growth Rates in GDP (2004-05 Prices)
(Factor Cost)
9.5 9.6 NA 9.3 6.8 8.0 8.5
Growth Indicators
Industrial GDP Growth (1993-94 Prices) 4.6 6.6 6.6 7.7
Industrial GDP Growth (1999-2000 Prices) 7.1 7.4 10.3 10.2 11.0 9.20
Industrial GDP Growth (2004-05 Prices) 9.7 12.2 10.95 9.7 4.4 8.0 7.9
Agricultural GDP Growth (1993-94 Prices) 2.0 -8.0 10.3 1.0
Agricultural GDP Growth (1999-2000 Prices) 1.2 -7.24 9.96 0.05 5.84 3.95 2.51
Agricultural GDP Growth (2004-05 Prices) 5.1 4.2 4.65 5.8 -0.1 0.4 6.6
Internal Balance Indicators
Gross Domestic Saving (% of GDP,1993-94
Series)
23.1 26.1 28.1
Gross Domestic Saving (% of GDP,1999-2000
Series)
23.6 26.4 29.8 31.7 34.2 35.7 31.56
Gross Domestic Saving (% of GDP,2004-05
Series)
32.4 33.5 34.6 33.49 36.9 32.2 33.7 na
Gross Domestic Capital Formation (% of
GDP,1993-94 Series)
23.8 24.8 26.3
Gross Domestic Capital Formation (% of
GDP,1999-2000 Series)
24.3 25.2 27.6 32.1 35.5 36.9 31.5
Gross Domestic Capital Formation (% of GDP,
2004-05 Series)
32.8 34.7 35.7 34.4 38.1 34.5 36.5 na
Fiscal Deficit (% of GDP, 1993-94 Series) 5.9 5.9 4.6 4.4
Fiscal Deficit Centre (% of GDP, 1999-2000
Series)
5.9 4.5 4.0 4.0 3.3 4.3
Fiscal Deficit Centre (% of GDP, 2004-05
Series)
3.9 4.0 3.3 5.6 2.55 6.04 6.39 5.10 4.60
Rate of Inflation (WPI - Average, as on 1st
April, 2010) - 1993-94 Series
4.9 3.4 5.5 6.5 4.3 6.5 5.2 4.8 8.1 3.9 9.6
Rate of Inflation (CPI-IW : Average) 4.4 6.7 6.2 9.1 12.4 10.0
M3 Growth (Annual) 16.6 14.7 16.8 12.3 16.9 21.7 16.5 21.4 19.3 16.8 16.5
External Balance Indicators
Export Growth (US $) 5.9 20.3 21.1 30.8 23.4 22.6 23.6 29.0 13.7 -3.5 31.6
Import Growth (US $) 5.8 19.4 27.3 42.7 33.8 24.5 29.5 35.5 19.8 -5.0 20.0
Current Account (% of GDP, 1993-94 Series) -0.7 1.2 2.3 -0.4
Current Account (% of GDP, 1999-2000 Series) -0.3 1.3 2.3 -0.4 -1.2 -1.0 0.2
Current Account (% of GDP, 2004-05 Series) -1.2 -1.05 -1.1 -1.3 -2.3 -2.8 2.5*
Debt Service Ratio 17.1 16.0 15.9 5.9 10.1 4.7 10.5 4.7 4.8 4.4 5.5
Source : Reserve BankDCH; 1st November Ministry, Central Statistical Organisation etc.; does'nt include discrepancies in capital formation
Databook for of India, Finance 2011 Page 2 of 189
The fiscal deficit for 2008-09 and 2009-10 are based on the Budget 2011-12 Document; Ministry of Finance