
![Top 5 Results The program received overwhelming – although not unanimous – approval. Students said: “ Last year the food was like fast food.” – 4th Grader “ I love the food [this year] because it is homemade.” – 2nd Grader “ This year is the best. It’s all gourmet and grown up food. They think children aren’t capable of anything. No way”. – 4th Grader “ My parents say it’s more healthy.” – 3rd Grader “ I am definitely eating more salad this year” – 4th Grader “ Bring corn dogs and chicken strips back!” – 4th Grader](https://image.slidesharecdn.com/an-evaluation-of-the-abernethy-elementary-kitchen-model-1193689228831858-4/85/An-Evaluation-of-the-Abernethy-Elementary-Kitchen-Model-7-320.jpg)


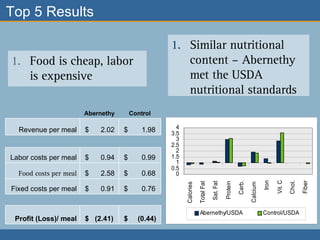
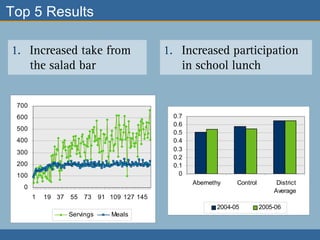
This document summarizes research on the Abernethy Elementary Kitchen Model in Portland, Oregon. The research found that: 1) The Abernethy model had similar nutritional content to the traditional model but was more cost effective, with lower food and labor costs per meal. 2) The Abernethy model resulted in increased student participation, especially in taking foods from the salad bar. 3) Surveys found overwhelming but not unanimous approval of the Abernethy model among students, parents, and teachers, though a few students wanted some traditional foods returned.