Social media analysis is something that important when you want to know who are the center points of networks. then this slide help you analyzing social media connection using NetworkX
Note: You have to download the slides and use either powerpoint or google slides to make the links clickable.
Machine Learning + Graph Databases for Better Recommendations
Presented by Chris Woodward
ATO 2022 - Machine Learning + Graph Databases for Better Recommendations (3)....ArangoDB Database
Note: You have to download the slides and use either powerpoint or google slides to make the links clickable.
ATO 2022 - Machine Learning + Graph Databases for Better Recommendations (3).pptx
Note: You have to download the slides and use either powerpoint or google slides to make the links clickable.
Machine Learning + Graph Databases for Better Recommendations
Presented by Chris Woodward
Multi-Label Graph Analysis and Computations Using GraphX with Qiang Zhu and Q...Databricks
In real-life applications, we often deal with situations where analysis needs to be conducted on graphs where the nodes and edges are associated with multiple labels. For example, in a graph that represents user activities in social networks, the labels associated with nodes may indicate their membership in communities (e.g. group, school, company, etc.), and the labels associated with edges may denote types of activities (e.g. comment, like, share, etc.). The current GraphX library in Spark does not directly support efficient calculation on the label-defined subgraph analysis and computations.
In this session, the speakers will propose a general API library that is able to support analysis on multi-label graphs, and can be reused and extended to design more complicated algorithms. It includes a method to create multi-label graphs and calculate basic statistics and metrics at both the global and subgraph level. Common graph algorithms, such as PageRank, can also be efficiently implemented in a parallel scheme by reusing the module/algorithm in GraphX, such as Pregel API.
See how LinkedIn is able to leverage this tool to efficiently find top LinkedIn feed influencers in different communities and by different actions. can be reused and extended to design more complicated algorithms. It includes a method to create multi-label graphs and calculate basic statistics and metrics at both the global and subgraph level. Common graph algorithms, such as PageRank, can also be efficiently implemented in a parallel scheme by reusing the module/algorithm in GraphX, such as Pregel API.
See how LinkedIn is able to leverage this tool to efficiently find top LinkedIn feed influencers in different communities and by different actions.
Network Visualization guest lecture at #DataVizQMSS at @Columbia / #SNA at PU...Denis Parra Santander
- First version was a guest lecture about Network Visualization in the class "Data Visualization" taught by Dr. Sharon Hsiao in the QMSS program at Columbia University http://www.columbia.edu/~ih2240/dataviz/index.htm
- This updated version was delivered in our class on SNA at PUC Chile in the MPGI master program.
Predicting Influence and Communities Using Graph AlgorithmsDatabricks
Relationships are one of the most predictive indicators of behavior and preferences. Communities detection based on relationships is a powerful tool for inferring similar preferences in peer groups, anticipating future behavior, estimating group resiliency, finding hierarchies, and preparing data for other analysis. Centrality measures based on relationships identify the most important items in a network and help us understand group dynamics such as influence, accessibility, the speed at which things spread, and bridges between groups. Data scientists use graph algorithms to identify groups and estimate important entities based on their interactions. In this session, we'll cover the common uses of community detection and centrality measures and how some of the iconic graph algorithms compute values. We'll show examples of how to run community detection and centrality algorithms in Apache Spark including using the AggregateMessages function to add your own algorithms. You'll learn best practices and tips for tricky situations. For those that want to run graph algorithms in a graph platform, we'll also illustrate a few examples in Neo4j. Some of the Community Detection Algorithms included: * Triangle Count and Clustering Coefficient to estimate network cohesiveness * Strongly Connected Components and Connected Components to find clusters * Label Propagation to quickly infer groups and data cleans with semi-supervised learning * Louvain Modularity to uncover at group hierarchies Balanced Triad to identify unstable groups * PageRank to reveal influencers * Betweenness Centrality to predict bottlenecks and bridges.
Authors: Amy Hodler, Sören Reichardt
Introduction to Machine Learning, Supervised Learning, Unsupervised Learning, Algorithms, K-Means, K-Nearest Neighbor, Support Vector Machine, DBSCAN, and Use Cases for each sectors in industries such as finance, e-commerce.
More Related Content
Similar to Social Network Analysis dengan NetworkX
Note: You have to download the slides and use either powerpoint or google slides to make the links clickable.
Machine Learning + Graph Databases for Better Recommendations
Presented by Chris Woodward
Multi-Label Graph Analysis and Computations Using GraphX with Qiang Zhu and Q...Databricks
In real-life applications, we often deal with situations where analysis needs to be conducted on graphs where the nodes and edges are associated with multiple labels. For example, in a graph that represents user activities in social networks, the labels associated with nodes may indicate their membership in communities (e.g. group, school, company, etc.), and the labels associated with edges may denote types of activities (e.g. comment, like, share, etc.). The current GraphX library in Spark does not directly support efficient calculation on the label-defined subgraph analysis and computations.
In this session, the speakers will propose a general API library that is able to support analysis on multi-label graphs, and can be reused and extended to design more complicated algorithms. It includes a method to create multi-label graphs and calculate basic statistics and metrics at both the global and subgraph level. Common graph algorithms, such as PageRank, can also be efficiently implemented in a parallel scheme by reusing the module/algorithm in GraphX, such as Pregel API.
See how LinkedIn is able to leverage this tool to efficiently find top LinkedIn feed influencers in different communities and by different actions. can be reused and extended to design more complicated algorithms. It includes a method to create multi-label graphs and calculate basic statistics and metrics at both the global and subgraph level. Common graph algorithms, such as PageRank, can also be efficiently implemented in a parallel scheme by reusing the module/algorithm in GraphX, such as Pregel API.
See how LinkedIn is able to leverage this tool to efficiently find top LinkedIn feed influencers in different communities and by different actions.
Network Visualization guest lecture at #DataVizQMSS at @Columbia / #SNA at PU...Denis Parra Santander
- First version was a guest lecture about Network Visualization in the class "Data Visualization" taught by Dr. Sharon Hsiao in the QMSS program at Columbia University http://www.columbia.edu/~ih2240/dataviz/index.htm
- This updated version was delivered in our class on SNA at PUC Chile in the MPGI master program.
Predicting Influence and Communities Using Graph AlgorithmsDatabricks
Relationships are one of the most predictive indicators of behavior and preferences. Communities detection based on relationships is a powerful tool for inferring similar preferences in peer groups, anticipating future behavior, estimating group resiliency, finding hierarchies, and preparing data for other analysis. Centrality measures based on relationships identify the most important items in a network and help us understand group dynamics such as influence, accessibility, the speed at which things spread, and bridges between groups. Data scientists use graph algorithms to identify groups and estimate important entities based on their interactions. In this session, we'll cover the common uses of community detection and centrality measures and how some of the iconic graph algorithms compute values. We'll show examples of how to run community detection and centrality algorithms in Apache Spark including using the AggregateMessages function to add your own algorithms. You'll learn best practices and tips for tricky situations. For those that want to run graph algorithms in a graph platform, we'll also illustrate a few examples in Neo4j. Some of the Community Detection Algorithms included: * Triangle Count and Clustering Coefficient to estimate network cohesiveness * Strongly Connected Components and Connected Components to find clusters * Label Propagation to quickly infer groups and data cleans with semi-supervised learning * Louvain Modularity to uncover at group hierarchies Balanced Triad to identify unstable groups * PageRank to reveal influencers * Betweenness Centrality to predict bottlenecks and bridges.
Authors: Amy Hodler, Sören Reichardt
Similar to Social Network Analysis dengan NetworkX (20)
Introduction to Machine Learning, Supervised Learning, Unsupervised Learning, Algorithms, K-Means, K-Nearest Neighbor, Support Vector Machine, DBSCAN, and Use Cases for each sectors in industries such as finance, e-commerce.
R is a language and environment for statistical computing and graphics. R is free, this slide is for beginner. start from the basic first. variables, data structure, reading data, chart, function, conditional statement, iteration, grouping, reshape, string operations.
Learn SQL from basic queries to Advance queriesmanishkhaire30
Dive into the world of data analysis with our comprehensive guide on mastering SQL! This presentation offers a practical approach to learning SQL, focusing on real-world applications and hands-on practice. Whether you're a beginner or looking to sharpen your skills, this guide provides the tools you need to extract, analyze, and interpret data effectively.
Key Highlights:
Foundations of SQL: Understand the basics of SQL, including data retrieval, filtering, and aggregation.
Advanced Queries: Learn to craft complex queries to uncover deep insights from your data.
Data Trends and Patterns: Discover how to identify and interpret trends and patterns in your datasets.
Practical Examples: Follow step-by-step examples to apply SQL techniques in real-world scenarios.
Actionable Insights: Gain the skills to derive actionable insights that drive informed decision-making.
Join us on this journey to enhance your data analysis capabilities and unlock the full potential of SQL. Perfect for data enthusiasts, analysts, and anyone eager to harness the power of data!
#DataAnalysis #SQL #LearningSQL #DataInsights #DataScience #Analytics
06-04-2024 - NYC Tech Week - Discussion on Vector Databases, Unstructured Data and AI
Discussion on Vector Databases, Unstructured Data and AI
https://www.meetup.com/unstructured-data-meetup-new-york/
This meetup is for people working in unstructured data. Speakers will come present about related topics such as vector databases, LLMs, and managing data at scale. The intended audience of this group includes roles like machine learning engineers, data scientists, data engineers, software engineers, and PMs.This meetup was formerly Milvus Meetup, and is sponsored by Zilliz maintainers of Milvus.
The Building Blocks of QuestDB, a Time Series Databasejavier ramirez
Talk Delivered at Valencia Codes Meetup 2024-06.
Traditionally, databases have treated timestamps just as another data type. However, when performing real-time analytics, timestamps should be first class citizens and we need rich time semantics to get the most out of our data. We also need to deal with ever growing datasets while keeping performant, which is as fun as it sounds.
It is no wonder time-series databases are now more popular than ever before. Join me in this session to learn about the internal architecture and building blocks of QuestDB, an open source time-series database designed for speed. We will also review a history of some of the changes we have gone over the past two years to deal with late and unordered data, non-blocking writes, read-replicas, or faster batch ingestion.
Analysis insight about a Flyball dog competition team's performanceroli9797
Insight of my analysis about a Flyball dog competition team's last year performance. Find more: https://github.com/rolandnagy-ds/flyball_race_analysis/tree/main
State of Artificial intelligence Report 2023kuntobimo2016
Artificial intelligence (AI) is a multidisciplinary field of science and engineering whose goal is to create intelligent machines.
We believe that AI will be a force multiplier on technological progress in our increasingly digital, data-driven world. This is because everything around us today, ranging from culture to consumer products, is a product of intelligence.
The State of AI Report is now in its sixth year. Consider this report as a compilation of the most interesting things we’ve seen with a goal of triggering an informed conversation about the state of AI and its implication for the future.
We consider the following key dimensions in our report:
Research: Technology breakthroughs and their capabilities.
Industry: Areas of commercial application for AI and its business impact.
Politics: Regulation of AI, its economic implications and the evolving geopolitics of AI.
Safety: Identifying and mitigating catastrophic risks that highly-capable future AI systems could pose to us.
Predictions: What we believe will happen in the next 12 months and a 2022 performance review to keep us honest.
5. What is?
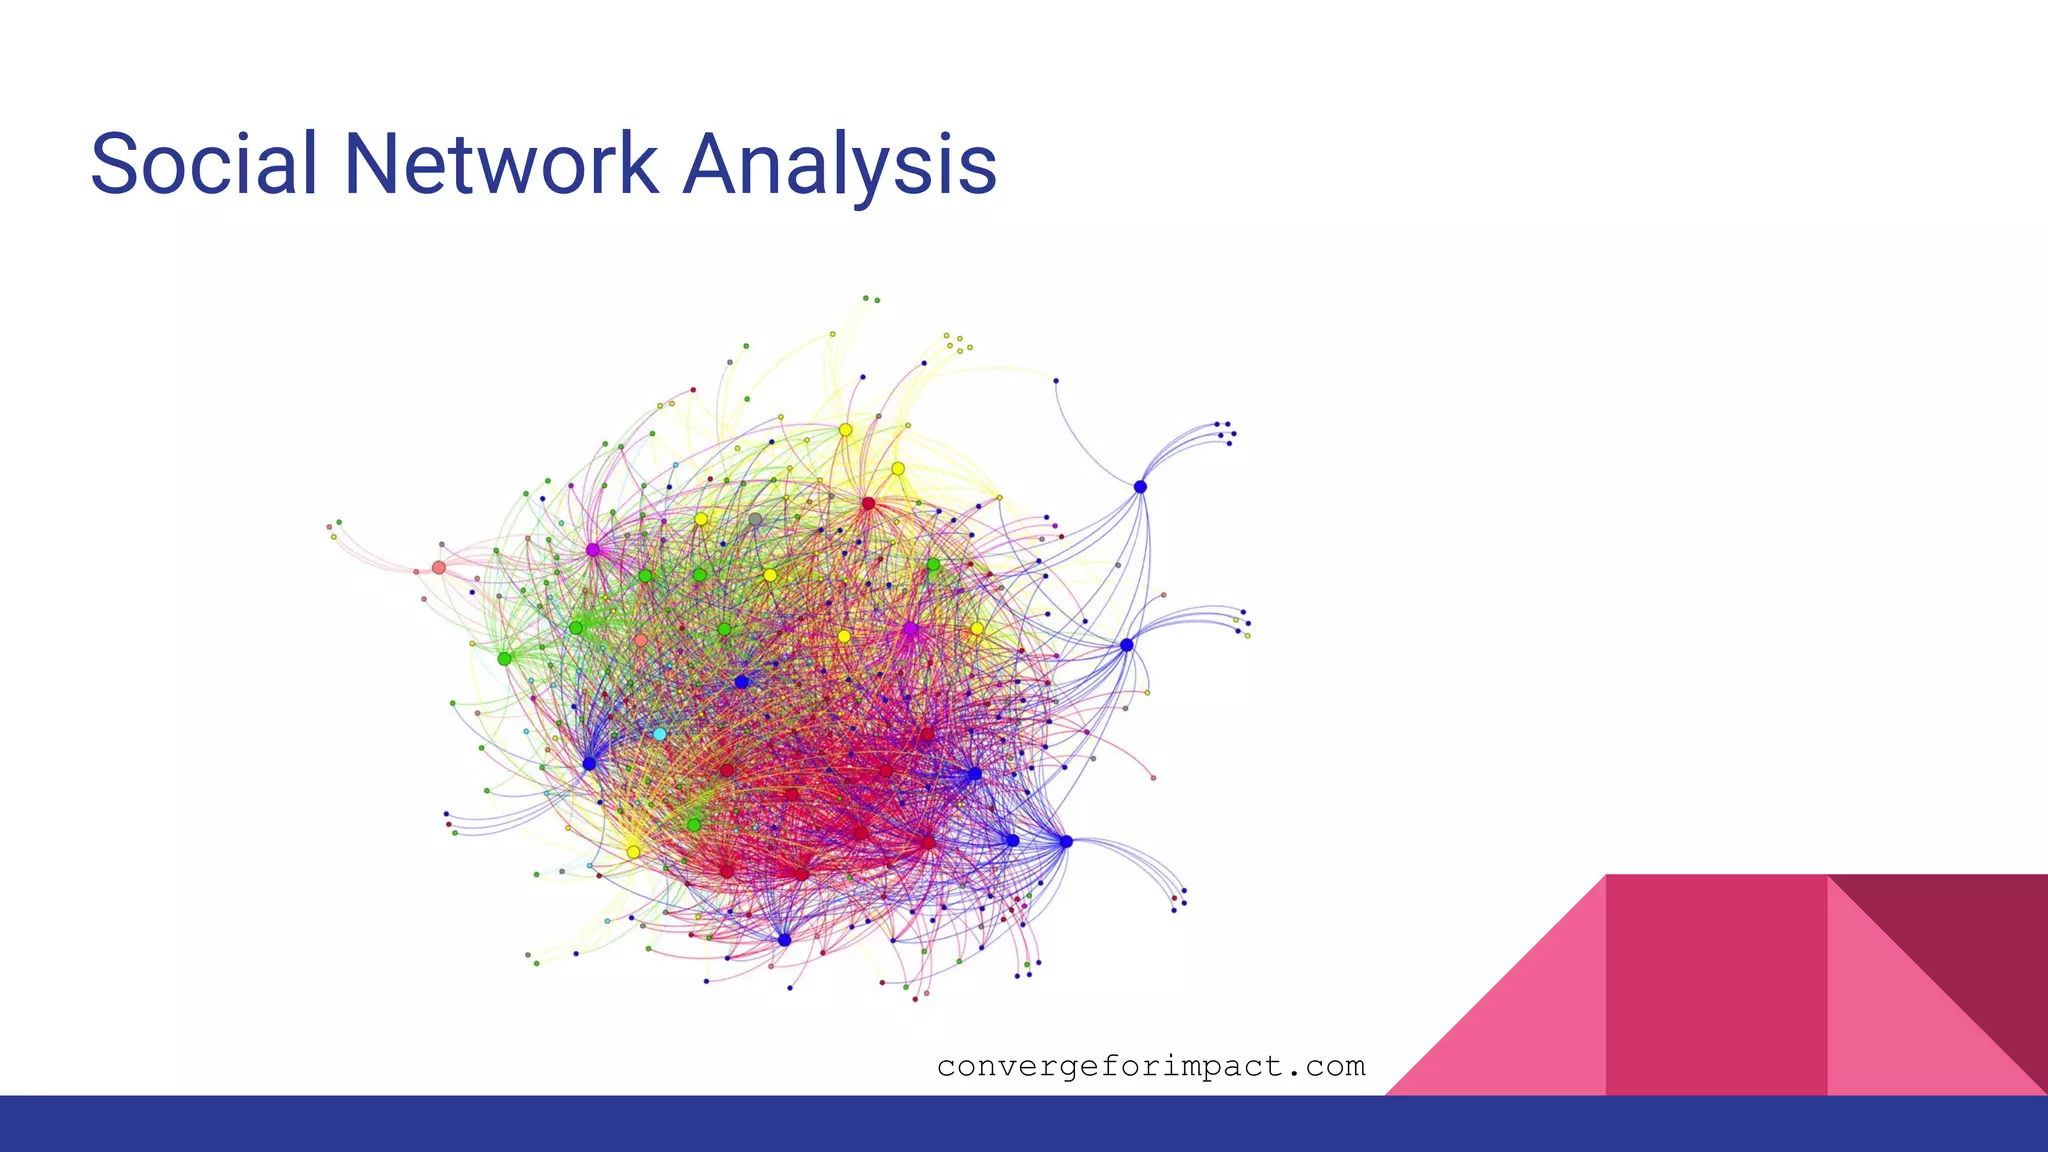
Social network analysis [SNA] is the mapping and measuring of relationships and
flows between people, groups, organizations, computers, URLs, and other
connected information/knowledge entities.