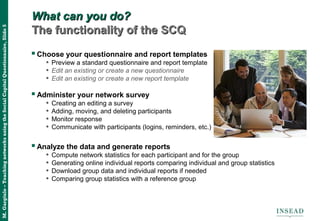
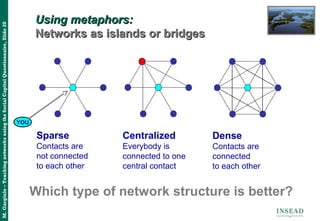
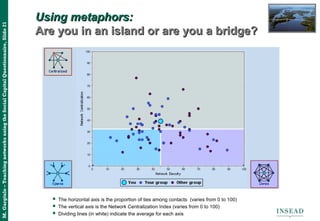
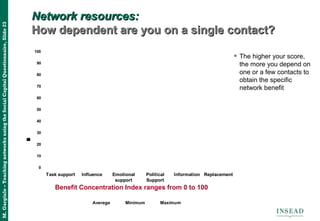
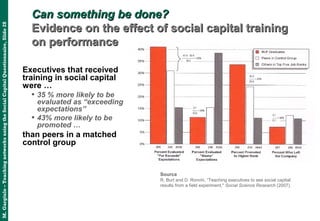
THE SOCIAL CAPITAL QUESTIONNAIRETHE SOCIAL CAPITAL QUESTIONNAIRE
An on-line tool to collect, analyze, and generate reportsAn on-line tool to collect, analyze, and generate reports
on individual and organizational networks to supporton individual and organizational networks to support
teaching and research on social networksteaching and research on social networks
Prof. Martin Gargiulo
INSEAD Asia Campus
M.Gargiulo–TeachingnetworksusingtheSocialCapitalQuestionnaire,Slide2
Part IPart I
Introducing the Social Capital Questionnaire:Introducing the Social Capital Questionnaire:
An easy way to gather and analyze data on individualAn easy way to gather and analyze data on individual
networks to teach MBAs and executivesnetworks to teach MBAs and executives
M.Gargiulo–TeachingnetworksusingtheSocialCapitalQuestionnaire,Slide3
Full networks and ego-centered networksFull networks and ego-centered networks
Full Network Ego-Centered Network
Respondent’s Action
Full
Network
Ego
Network
Identifies contacts using various “name generating questions” Yes Yes
Provides background information on each contact (sex, age, etc). No Yes
Describes the relationship with each contact (frequency, closeness etc.) Yes Yes
Describes the relationship between each pair of contacts (closeness) No Yes
M.Gargiulo–TeachingnetworksusingtheSocialCapitalQuestionnaire,Slide4
The SCQ home pageThe SCQ home page
https://executive-tools.insead.edu/socialcapital/https://executive-tools.insead.edu/socialcapital/
M.Gargiulo–TeachingnetworksusingtheSocialCapitalQuestionnaire,Slide5
What can you do?What can you do?
The functionality of the SCQThe functionality of the SCQ
Choose your questionnaire and report templates
• Preview a standard questionnaire and report template
• Edit an existing or create a new questionnaire
• Edit an existing or create a new report template
Administer your network survey
• Creating an editing a survey
• Adding, moving, and deleting participants
• Monitor response
• Communicate with participants (logins, reminders, etc.)
Analyze the data and generate reports
• Compute network statistics for each participant and for the group
• Generating online individual reports comparing individual and group statistics
• Download group data and individual reports if needed
• Comparing group statistics with a reference group
M.Gargiulo–TeachingnetworksusingtheSocialCapitalQuestionnaire,Slide6
Choosing your templates:Choosing your templates:
The standard ego-centric questionnaireThe standard ego-centric questionnaire
M.Gargiulo–TeachingnetworksusingtheSocialCapitalQuestionnaire,Slide7
Choosing your templates:Choosing your templates:
Standard or customized report templatesStandard or customized report templates
Social Capital Personal Report COUPERIN, François
same firm (but in a different function), and in other
firms. The first three categories measure the extent to
which your network reach across units and functions in
your firm, whereas the last two indicate the extent to
which your network is limited to your own firm. The
next chart, Functional Diversity, complements this picture
by looking specifically at the type of functional area
your contact works for.
Organizational and functional diversity are important
for at least two reasons. The first reason is similar to
cultural diversity. A network with contacts from
different functional backgrounds exposes you to a richer
picture of the business and allows you to learn about
more opportunities to add value to your firm and to
your career. Second, in the global structures adopted by
large companies, functions (or divisions) may become
"silos" isolated from one another. Business, however,
often requires active coordination across these silos.
Networks that cut across functions can help you add
value in a critical area for your firm, because they
provide alternative and faster ways to achieve the
necessary cross-functional coordination to get projects
going.
The next chart looks at the hierarchical diversity of your
network. How diverse is your network in terms of rank
is partly dependent on your own rank. The lower you
are in the organization, the more likely your network is
upwards oriented. These are the people you most often
need to mobilize to get things done.
Your network, however, can help you understand
how different hierarchical levels view the organization,
besides to give you access to the information and
resources they control. A rank-homogeneous network
may cut you off from such diverse views, leading you to
have a rather biased view of what is going on in your
firm. This is particularly dangerous if you are a senior
manager: it is all too easy to have a distorted picture of
what's going on at the bottom! If your network is too
upward, peer, or (less likely) downward oriented, and
your diversity index is significantly below that of your
reference group, it may be time for some reflection.
The final chart looks at the origin of your relationships.
We typically make contacts in organized settings or
through common third parties. If most of our contacts
come from one single source, however, it is more likely
that they will be similar in other aspects too. The chart
prompts you to reflect on the extent to which you rely
on too few settings to make contacts. If this is your case,
it may be a call to expand your circles.
 Organizational Diversity  Hierarchical Diversity
 Functional Diversity  Relationship Origin
© Martin Gargiulo Page 3
 The Personal Report
compares individual network
statistics with those of a
reference group
 This reference group can be
the participant’s group (i.e., the
people in the class) or a larger
group (i.e., all people who
have taken this class)
 Participants can generate
personalized reports in which
they define their own reference
group among 15,000+
individual networks worldwide
 Participants can also modify
their networks and see the
results of the changes on a
number of indexes.
M.Gargiulo–TeachingnetworksusingtheSocialCapitalQuestionnaire,Slide8
Administering a network survey:Administering a network survey:
Creating and editing a groupCreating and editing a group
Welcome Message can be
edited to suit your needs
Deadline and Reminder
dates can be changed to
accommodate extensions
Make reports available
online
You need to be a
registered administrator
or have an administrator
access code to create
and administer groups
M.Gargiulo–TeachingnetworksusingtheSocialCapitalQuestionnaire,Slide9
Administering a network survey:Administering a network survey:
Adding, moving and deleting participantsAdding, moving and deleting participants
M.Gargiulo–TeachingnetworksusingtheSocialCapitalQuestionnaire,Slide10
Analysis and reporting:Analysis and reporting:
Compute network indexes and generate reportsCompute network indexes and generate reports
M.Gargiulo–TeachingnetworksusingtheSocialCapitalQuestionnaire,Slide11
Downloading data:Downloading data:
Report files and group dataReport files and group data
You can also download Group Statistics to compare your class with a reference group
 Group statistics can be compared with similar figures for a comparison group (e.g., prior
participants from the same MBA class or executive program) to illustrate differences in social
networks
M.Gargiulo–TeachingnetworksusingtheSocialCapitalQuestionnaire,Slide12
Take your own tour of the SCQTake your own tour of the SCQ
Site: https://executive-tools.insead.edu/socialcapital/
Login: demosc@insead.edu:
Pass: train2000
M.Gargiulo–TeachingnetworksusingtheSocialCapitalQuestionnaire,Slide13
Part IIPart II
Teaching Social Networks using the SCQ:Teaching Social Networks using the SCQ:
Leveraging the Social Capital Reports and GroupLeveraging the Social Capital Reports and Group
Statistics to structure your classStatistics to structure your class
Motivating the session on social networks (5-10 min)
Using metaphors to illustrate how networks create social capital (15-20 min)
Understanding how much you depend on your contacts for help (5-10 min)
Providing research evidence on the effects of networks on outcomes (5-10 min)
Given students a chance to reflect on their individual reports and devise
strategies to enhance their networks (30-45 min, individual and in trios)
Wrapping up the session (5-10 min)
M.Gargiulo–TeachingnetworksusingtheSocialCapitalQuestionnaire,Slide14
Motivating the session:Motivating the session:
The PARC experienceThe PARC experience
Xerox was unable to capitalize on the innovations developed
by PARC, which were initially commercialized by other firms..
The most visible example was the GUI, adopted by Apple in
his path-breaking Macintosh computer in 1984
M.Gargiulo–TeachingnetworksusingtheSocialCapitalQuestionnaire,Slide15
Motivating the sessionMotivating the session::
Formal and informal organization structuresFormal and informal organization structures
• Firms are made of clusters of people with similar human capital (knowledge, expertise, skills).
• The return on this human capital depends on the connections within and between those clusters
M.Gargiulo–TeachingnetworksusingtheSocialCapitalQuestionnaire,Slide16
Americas
Asia-Pacific
EMEA
Switzerland
UK
 Links represent collaboration between MDs of
a global investment bank
Connections more likely
within than across
geographies
A few people
bridge across
dense clusters
Motivating the sessionMotivating the session::
Connections do not happen at randomConnections do not happen at random
M.Gargiulo–TeachingnetworksusingtheSocialCapitalQuestionnaire,Slide17
Using metaphors to illustrateUsing metaphors to illustrate
how networks create social capitalhow networks create social capital
Metaphor # 2
Networks as electrical wires
NETWORK
DEPTH
Metaphor # 1
Networks as windows or blinders
NETWORK
BREADTH
Metaphor # 3
Networks as bridges or islands
NETWORK
STRUCTURE
M.Gargiulo–TeachingnetworksusingtheSocialCapitalQuestionnaire,Slide18
55.00
63.29
86.17
90.60
92.94
19.23
59.51
89.49
0
10
20
30
40
50
60
70
80
90
100
Nationality Gender Workplace Rank Function Team
member
Direct
report
Origin
DiversityIndex
Average Minimum Maximum
Using metaphors:Using metaphors:
Networks as windows or blindersNetworks as windows or blinders
Constraint or Choice?
Lack of diversity can result from lack of
opportunities to meet diverse people or from
choice: people do not venture out of their
comfort zone
Diverse networks can be windows to
the world; homogeneous networks
can be blinders that prevent us from
seeing and understanding the world
Does network diversity matter?
Lines represent maximum, average,
and minimum diversity by contacts’
category (nationality, rank, etc.)
People vary in the extent that they
have diverse networks (gaps
between lines)
M.Gargiulo–TeachingnetworksusingtheSocialCapitalQuestionnaire,Slide19
0.27
0.25
0.08
0.03
-0.15
Frequency of
contact
Duration Common
friends
Similarity Authority
relation
EffectonRelationshipDepth
Characteristicsof the Relationship
Using metaphors:Using metaphors:
Networks as electrical wiresNetworks as electrical wires
 Sample of 31,114 relationships reported by 2,573 managers worldwide
 Bars represent the relative impact of each aspect on the depth of the relationship
between the manager and his/her contact
• Strong ties (“thick wires”) take time and
frequent interaction to emerge
• Strong ties are more likely between
similar people (same sex, same
nationality) and less likely in the
presence of authority
• But strong ties are also more expensive
and difficult to handle because they
increase demands for reciprocity
• Strong ties are not always the most
appropriate to handle a relationship
 Where do strong relationships come from?
Is it better to have a network
with only strong ties?
Positive impact
Negative impact
M.Gargiulo–TeachingnetworksusingtheSocialCapitalQuestionnaire,Slide20
Using metaphors:Using metaphors:
Networks as islands or bridgesNetworks as islands or bridges
Sparse
Contacts are
not connected
to each other
Centralized
Everybody is
connected to one
central contact
Dense
Contacts are
connected
to each other
Which type of network structure is better?
YOU
M.Gargiulo–TeachingnetworksusingtheSocialCapitalQuestionnaire,Slide21
Using metaphors:Using metaphors:
Are you in an island or are you a bridge?Are you in an island or are you a bridge?
 The horizontal axis is the proportion of ties among contacts (varies from 0 to 100)
 The vertical axis is the Network Centralization Index (varies from 0 to 100)
 Dividing lines (in white) indicate the average for each axis
M.Gargiulo–TeachingnetworksusingtheSocialCapitalQuestionnaire,Slide22
Network resources:Network resources:
What benefits do you get from your contacts?What benefits do you get from your contacts?
Contact Daily Job Support Influential Access Emotional Support Political Support Information And Ideas Difficult to Replace Dependence
Joe B 85
Peter C 32
Joy I 2
.............. .............. .............. .............. .............. .............. .............. ..............
Alex K 13
Your BCI 13 8 11 13 9 9
RG's BCI 11.93 13.32 12.34 15.75 12.07 10.31
BENEFITS YOUR CONTACTS MAY PROVIDE
Daily job support: the contact is someone you turn
to for help with your daily job, to meet a tight schedule
or to get a handle on a technical problem
Influential access: your contact helps you get
access to influential people whom you would not reach
without this contact's mediation
Emotional support: the contact provides you with
valuable feedback and emotional support to help you
cope with stressful situations at work
Political support: the contact supports your
initiatives by granting you the resources, permission, or
legitimacy necessary to move forward
Information and ideas: the contact is a source of
information and ideas that help you solve problems or
identify new opportunities
 This chart in your Personal Report displays..
• The benefits you get from each of your contacts (the blue circles)
• The difficult to replace this person (the red circles)
 The more benefits a contact provide, and the more difficult to replace, the more you
depend on this contact, and the more critical is this relationship for you (100: Maximum)
 The Benefit Concentration Index (BCI) is high when you obtain the benefit (e.g.,
emotional support) for few people – your “supply” is highly dependent on these people
 The RG index (Reference Group) compares your BCI with all previous AEIP participants
M.Gargiulo–TeachingnetworksusingtheSocialCapitalQuestionnaire,Slide23
Network resources:Network resources:
How dependent are you on a single contact?How dependent are you on a single contact?
12.17
17.57
13.20
16.71
12.29
10.23
0
10
20
30
40
50
60
70
80
90
100
Task support Influence Emotional
support
Political
Support
Information Replacement
BenefitConcentrationIndex
Average Minimum Maximum
Benefit Concentration Index ranges from 0 to 100
• The higher your score,
the more you depend on
one or a few contacts to
obtain the specific
network benefit
M.Gargiulo–TeachingnetworksusingtheSocialCapitalQuestionnaire,Slide24
Evidence on network effects:Evidence on network effects:
Do networks affect individual performance?Do networks affect individual performance?
-1.6 -1.4 -1.2 -1.0 -0.8 -0.6 -0.4 -0.2 0.0 0.2 0.4 0.6 0.8 1.0
Level of Social Capital
Performance
Source
M. Gargiulo, G. Ertug & C. Galunic, “The two faces of control.
Network closure and individual performance among knowledge
workers”. Administrative Science Quarterly (2009)
Social capital matters
Holding human capital constant, a 10 %
increase in social capital of MDs results in a
4.8 % increase in performance
Managing Directors
Executive Directors
Directors
Associates
Social capital matters
• Lines represent how investment bankers’
performance varies as social capital
increases, net of the effects of human
capital
• The effect of social capital on
performance becomes more apparent as
bankers have more client and
managerial responsibilities—that is, as
their job becomes more complex
Who is in the network also matter
A 10% increase in the quality of the people in
the network results on average on a 2.8%
increase in performance
M.Gargiulo–TeachingnetworksusingtheSocialCapitalQuestionnaire,Slide25
Evidence on network effects:Evidence on network effects:
Who are the innovators?Who are the innovators?
 673 supply chain managers were asked for ideas to
improve the supply-chain in Raytheon, a large
electronics and defense company
 Ideas were blind-judged by two independent senior
managers
 Managers with contacts in different groups
significantly more likely to …
• Have ideas on how to improve the supply chain
management
• Have their ideas recognized as valuable
• Discuss their ideas with colleagues
 This finding has been replicated in a number of
fields, from music to philosophy, from science to
industry: innovations come disproportionally from
people bridging separate groups
Source
R.S. Burt, Structural Holes and Good Ideas.
American Journal of Sociology, 110 (September
2004): 349–99
M.Gargiulo–TeachingnetworksusingtheSocialCapitalQuestionnaire,Slide26
Evidence on network effects:Evidence on network effects:
Which network structure fosters innovation?Which network structure fosters innovation?
 A study of the network of the creative artists who made Broadway
musicals from 1945 to 1989
 Creative artists (excluding actors) are directly linked to each other
when they collaborate on the same show and indirectly through
having collaborated with common third parties in different shows
 Measures of financial success (tickets sold) and artistic success
(average critics’ reviews)
 The financial and artistic success of Broadway productions
increases as the artist networks resemble the “island and bridges”
structure. The same holds true for Broadway seasons
 Extreme network structures do not work: both disconnected
islands with very few bridges or too many bridges with few islands
damages both artistic and financial success
Source
B. Uzzi & J. Spiro, Collaboration and Creativity:
The Small World Problem. American Journal of
Sociology, 111 (September 2005): 447–504
M.Gargiulo–TeachingnetworksusingtheSocialCapitalQuestionnaire,Slide27
Can something be done?Can something be done?
Debunking myths about networkingDebunking myths about networking
 “Skilled networkers are born; they cannot be trained”
“The social capital people build is a reflection of their personality”
“Networks occur naturally. There is little that management can do
to affect how networks emerge and evolve”
FALSE
FALSE
FALSE
M.Gargiulo–TeachingnetworksusingtheSocialCapitalQuestionnaire,Slide28
Can something be done?Can something be done?
Evidence on the effect of social capital trainingEvidence on the effect of social capital training
on performanceon performance
Executives that received
training in social capital
were …
• 35 % more likely to be
evaluated as “exceeding
expectations”
• 43% more likely to be
promoted …
than peers in a matched
control group
Source
R. Burt and D. Ronchi, “Teaching executives to see social capital:
results from a field experiment," Social Science Research (2007).
M.Gargiulo–TeachingnetworksusingtheSocialCapitalQuestionnaire,Slide29
Taking stock:Taking stock:
A self-guided assessment of your social capitalA self-guided assessment of your social capital
Personal reflection
• Take some time to go over your report and try to fill out the worksheet
Assessing the Social Capital of Your Network
With other participants
• Get together with two other participants to discuss strategies on how to
enhance the social capital of your professional network
M.Gargiulo–TeachingnetworksusingtheSocialCapitalQuestionnaire,Slide30
Closing message:Closing message:
You always “manage” your network –You always “manage” your network –
even if you don’t notice iteven if you don’t notice it
Even if we are not aware of it, we are
constantly shaping our network. When we
answer a request from a colleague, reject an
invitation to a professional meeting, or stay in
touch with an old friend, we are implicitly
making networking decisions. But actively
managing our professional network is not
easy. We may even find it awkward. Left
alone, however, most networks would
become too homogeneous, too dense, or
render people too dependent on a few
contacts. Instead of benefiting from its social
capital, we may become trapped in our own
net. Leaders need to manage the social
capital of their networks, because this capital
is one of the foundations of successful
leadership.
M.Gargiulo–TeachingnetworksusingtheSocialCapitalQuestionnaire,Slide31
APPENDIXAPPENDIX
Network Diversity IndexesNetwork Diversity Indexes
in the Social Capital Questionnairein the Social Capital Questionnaire
M.Gargiulo–TeachingnetworksusingtheSocialCapitalQuestionnaire,Slide32
Understanding network diversity indexesUnderstanding network diversity indexes
1
2
3
4
1
2
3
4
High Diversity NetworkLow Diversity Network
How your
individual diversity
indexes look like
Range of scores for
Reference Group
Your score
Average score for
Reference Group
Network diversity
increases with …
The different types of
people in your network
The distribution of your
relationships across those
people
M.Gargiulo–TeachingnetworksusingtheSocialCapitalQuestionnaire,Slide33
0
10
20
30
40
50
60
70
80
90
100
25% 30% 35% 40% 45% 50% 55% 60% 65% 70% 75% 80% 85% 90% 95% 100%
Percentage in first category of contacts (out of four)
DiversityIndex How does the Network Diversity Index works?How does the Network Diversity Index works?
 The Network Diversity Index (NDI)
decreases with the proportion of
contacts in each category and with the
strength of your relationship with these
contacts.
 The index is 0 if you are strongly tied to
one type of contact and approaches
100 as you are equally tied to people
from many different backgrounds
 The graph shows the NDI for a network
with four possible categories of contacts
as a function of the proportion of
contacts in the first category
 A little diversity goes a long way. Even if
you have 50% of contacts in one
category, your NDI will be above 90 if
you do have people in the other three
categories.
 The NDI drops rapidly once you have
more than 70% of your contacts in one
category.
For the mathematically curious:
NDIi = 1 - ∑k (pkpij,k)2
pk: the proportion of alters in the kth category
(∑k pk = 1)
Pij,k: the mean proportional relationship strength
between you and alters in that category

Social capital questionnaire 2013 tsn

  • 1.
    THE SOCIAL CAPITALQUESTIONNAIRETHE SOCIAL CAPITAL QUESTIONNAIRE An on-line tool to collect, analyze, and generate reportsAn on-line tool to collect, analyze, and generate reports on individual and organizational networks to supporton individual and organizational networks to support teaching and research on social networksteaching and research on social networks Prof. Martin Gargiulo INSEAD Asia Campus
  • 2.
    M.Gargiulo–TeachingnetworksusingtheSocialCapitalQuestionnaire,Slide2 Part IPart I Introducingthe Social Capital Questionnaire:Introducing the Social Capital Questionnaire: An easy way to gather and analyze data on individualAn easy way to gather and analyze data on individual networks to teach MBAs and executivesnetworks to teach MBAs and executives
  • 3.
    M.Gargiulo–TeachingnetworksusingtheSocialCapitalQuestionnaire,Slide3 Full networks andego-centered networksFull networks and ego-centered networks Full Network Ego-Centered Network Respondent’s Action Full Network Ego Network Identifies contacts using various “name generating questions” Yes Yes Provides background information on each contact (sex, age, etc). No Yes Describes the relationship with each contact (frequency, closeness etc.) Yes Yes Describes the relationship between each pair of contacts (closeness) No Yes
  • 4.
    M.Gargiulo–TeachingnetworksusingtheSocialCapitalQuestionnaire,Slide4 The SCQ homepageThe SCQ home page https://executive-tools.insead.edu/socialcapital/https://executive-tools.insead.edu/socialcapital/
  • 5.
    M.Gargiulo–TeachingnetworksusingtheSocialCapitalQuestionnaire,Slide5 What can youdo?What can you do? The functionality of the SCQThe functionality of the SCQ Choose your questionnaire and report templates • Preview a standard questionnaire and report template • Edit an existing or create a new questionnaire • Edit an existing or create a new report template Administer your network survey • Creating an editing a survey • Adding, moving, and deleting participants • Monitor response • Communicate with participants (logins, reminders, etc.) Analyze the data and generate reports • Compute network statistics for each participant and for the group • Generating online individual reports comparing individual and group statistics • Download group data and individual reports if needed • Comparing group statistics with a reference group
  • 6.
    M.Gargiulo–TeachingnetworksusingtheSocialCapitalQuestionnaire,Slide6 Choosing your templates:Choosingyour templates: The standard ego-centric questionnaireThe standard ego-centric questionnaire
  • 7.
    M.Gargiulo–TeachingnetworksusingtheSocialCapitalQuestionnaire,Slide7 Choosing your templates:Choosingyour templates: Standard or customized report templatesStandard or customized report templates Social Capital Personal Report COUPERIN, François same firm (but in a different function), and in other firms. The first three categories measure the extent to which your network reach across units and functions in your firm, whereas the last two indicate the extent to which your network is limited to your own firm. The next chart, Functional Diversity, complements this picture by looking specifically at the type of functional area your contact works for. Organizational and functional diversity are important for at least two reasons. The first reason is similar to cultural diversity. A network with contacts from different functional backgrounds exposes you to a richer picture of the business and allows you to learn about more opportunities to add value to your firm and to your career. Second, in the global structures adopted by large companies, functions (or divisions) may become "silos" isolated from one another. Business, however, often requires active coordination across these silos. Networks that cut across functions can help you add value in a critical area for your firm, because they provide alternative and faster ways to achieve the necessary cross-functional coordination to get projects going. The next chart looks at the hierarchical diversity of your network. How diverse is your network in terms of rank is partly dependent on your own rank. The lower you are in the organization, the more likely your network is upwards oriented. These are the people you most often need to mobilize to get things done. Your network, however, can help you understand how different hierarchical levels view the organization, besides to give you access to the information and resources they control. A rank-homogeneous network may cut you off from such diverse views, leading you to have a rather biased view of what is going on in your firm. This is particularly dangerous if you are a senior manager: it is all too easy to have a distorted picture of what's going on at the bottom! If your network is too upward, peer, or (less likely) downward oriented, and your diversity index is significantly below that of your reference group, it may be time for some reflection. The final chart looks at the origin of your relationships. We typically make contacts in organized settings or through common third parties. If most of our contacts come from one single source, however, it is more likely that they will be similar in other aspects too. The chart prompts you to reflect on the extent to which you rely on too few settings to make contacts. If this is your case, it may be a call to expand your circles.  Organizational Diversity  Hierarchical Diversity  Functional Diversity  Relationship Origin © Martin Gargiulo Page 3  The Personal Report compares individual network statistics with those of a reference group  This reference group can be the participant’s group (i.e., the people in the class) or a larger group (i.e., all people who have taken this class)  Participants can generate personalized reports in which they define their own reference group among 15,000+ individual networks worldwide  Participants can also modify their networks and see the results of the changes on a number of indexes.
  • 8.
    M.Gargiulo–TeachingnetworksusingtheSocialCapitalQuestionnaire,Slide8 Administering a networksurvey:Administering a network survey: Creating and editing a groupCreating and editing a group Welcome Message can be edited to suit your needs Deadline and Reminder dates can be changed to accommodate extensions Make reports available online You need to be a registered administrator or have an administrator access code to create and administer groups
  • 9.
    M.Gargiulo–TeachingnetworksusingtheSocialCapitalQuestionnaire,Slide9 Administering a networksurvey:Administering a network survey: Adding, moving and deleting participantsAdding, moving and deleting participants
  • 10.
    M.Gargiulo–TeachingnetworksusingtheSocialCapitalQuestionnaire,Slide10 Analysis and reporting:Analysisand reporting: Compute network indexes and generate reportsCompute network indexes and generate reports
  • 11.
    M.Gargiulo–TeachingnetworksusingtheSocialCapitalQuestionnaire,Slide11 Downloading data:Downloading data: Reportfiles and group dataReport files and group data You can also download Group Statistics to compare your class with a reference group  Group statistics can be compared with similar figures for a comparison group (e.g., prior participants from the same MBA class or executive program) to illustrate differences in social networks
  • 12.
    M.Gargiulo–TeachingnetworksusingtheSocialCapitalQuestionnaire,Slide12 Take your owntour of the SCQTake your own tour of the SCQ Site: https://executive-tools.insead.edu/socialcapital/ Login: demosc@insead.edu: Pass: train2000
  • 13.
    M.Gargiulo–TeachingnetworksusingtheSocialCapitalQuestionnaire,Slide13 Part IIPart II TeachingSocial Networks using the SCQ:Teaching Social Networks using the SCQ: Leveraging the Social Capital Reports and GroupLeveraging the Social Capital Reports and Group Statistics to structure your classStatistics to structure your class Motivating the session on social networks (5-10 min) Using metaphors to illustrate how networks create social capital (15-20 min) Understanding how much you depend on your contacts for help (5-10 min) Providing research evidence on the effects of networks on outcomes (5-10 min) Given students a chance to reflect on their individual reports and devise strategies to enhance their networks (30-45 min, individual and in trios) Wrapping up the session (5-10 min)
  • 14.
    M.Gargiulo–TeachingnetworksusingtheSocialCapitalQuestionnaire,Slide14 Motivating the session:Motivatingthe session: The PARC experienceThe PARC experience Xerox was unable to capitalize on the innovations developed by PARC, which were initially commercialized by other firms.. The most visible example was the GUI, adopted by Apple in his path-breaking Macintosh computer in 1984
  • 15.
    M.Gargiulo–TeachingnetworksusingtheSocialCapitalQuestionnaire,Slide15 Motivating the sessionMotivatingthe session:: Formal and informal organization structuresFormal and informal organization structures • Firms are made of clusters of people with similar human capital (knowledge, expertise, skills). • The return on this human capital depends on the connections within and between those clusters
  • 16.
    M.Gargiulo–TeachingnetworksusingtheSocialCapitalQuestionnaire,Slide16 Americas Asia-Pacific EMEA Switzerland UK  Links representcollaboration between MDs of a global investment bank Connections more likely within than across geographies A few people bridge across dense clusters Motivating the sessionMotivating the session:: Connections do not happen at randomConnections do not happen at random
  • 17.
    M.Gargiulo–TeachingnetworksusingtheSocialCapitalQuestionnaire,Slide17 Using metaphors toillustrateUsing metaphors to illustrate how networks create social capitalhow networks create social capital Metaphor # 2 Networks as electrical wires NETWORK DEPTH Metaphor # 1 Networks as windows or blinders NETWORK BREADTH Metaphor # 3 Networks as bridges or islands NETWORK STRUCTURE
  • 18.
    M.Gargiulo–TeachingnetworksusingtheSocialCapitalQuestionnaire,Slide18 55.00 63.29 86.17 90.60 92.94 19.23 59.51 89.49 0 10 20 30 40 50 60 70 80 90 100 Nationality Gender WorkplaceRank Function Team member Direct report Origin DiversityIndex Average Minimum Maximum Using metaphors:Using metaphors: Networks as windows or blindersNetworks as windows or blinders Constraint or Choice? Lack of diversity can result from lack of opportunities to meet diverse people or from choice: people do not venture out of their comfort zone Diverse networks can be windows to the world; homogeneous networks can be blinders that prevent us from seeing and understanding the world Does network diversity matter? Lines represent maximum, average, and minimum diversity by contacts’ category (nationality, rank, etc.) People vary in the extent that they have diverse networks (gaps between lines)
  • 19.
    M.Gargiulo–TeachingnetworksusingtheSocialCapitalQuestionnaire,Slide19 0.27 0.25 0.08 0.03 -0.15 Frequency of contact Duration Common friends SimilarityAuthority relation EffectonRelationshipDepth Characteristicsof the Relationship Using metaphors:Using metaphors: Networks as electrical wiresNetworks as electrical wires  Sample of 31,114 relationships reported by 2,573 managers worldwide  Bars represent the relative impact of each aspect on the depth of the relationship between the manager and his/her contact • Strong ties (“thick wires”) take time and frequent interaction to emerge • Strong ties are more likely between similar people (same sex, same nationality) and less likely in the presence of authority • But strong ties are also more expensive and difficult to handle because they increase demands for reciprocity • Strong ties are not always the most appropriate to handle a relationship  Where do strong relationships come from? Is it better to have a network with only strong ties? Positive impact Negative impact
  • 20.
    M.Gargiulo–TeachingnetworksusingtheSocialCapitalQuestionnaire,Slide20 Using metaphors:Using metaphors: Networksas islands or bridgesNetworks as islands or bridges Sparse Contacts are not connected to each other Centralized Everybody is connected to one central contact Dense Contacts are connected to each other Which type of network structure is better? YOU
  • 21.
    M.Gargiulo–TeachingnetworksusingtheSocialCapitalQuestionnaire,Slide21 Using metaphors:Using metaphors: Areyou in an island or are you a bridge?Are you in an island or are you a bridge?  The horizontal axis is the proportion of ties among contacts (varies from 0 to 100)  The vertical axis is the Network Centralization Index (varies from 0 to 100)  Dividing lines (in white) indicate the average for each axis
  • 22.
    M.Gargiulo–TeachingnetworksusingtheSocialCapitalQuestionnaire,Slide22 Network resources:Network resources: Whatbenefits do you get from your contacts?What benefits do you get from your contacts? Contact Daily Job Support Influential Access Emotional Support Political Support Information And Ideas Difficult to Replace Dependence Joe B 85 Peter C 32 Joy I 2 .............. .............. .............. .............. .............. .............. .............. .............. Alex K 13 Your BCI 13 8 11 13 9 9 RG's BCI 11.93 13.32 12.34 15.75 12.07 10.31 BENEFITS YOUR CONTACTS MAY PROVIDE Daily job support: the contact is someone you turn to for help with your daily job, to meet a tight schedule or to get a handle on a technical problem Influential access: your contact helps you get access to influential people whom you would not reach without this contact's mediation Emotional support: the contact provides you with valuable feedback and emotional support to help you cope with stressful situations at work Political support: the contact supports your initiatives by granting you the resources, permission, or legitimacy necessary to move forward Information and ideas: the contact is a source of information and ideas that help you solve problems or identify new opportunities  This chart in your Personal Report displays.. • The benefits you get from each of your contacts (the blue circles) • The difficult to replace this person (the red circles)  The more benefits a contact provide, and the more difficult to replace, the more you depend on this contact, and the more critical is this relationship for you (100: Maximum)  The Benefit Concentration Index (BCI) is high when you obtain the benefit (e.g., emotional support) for few people – your “supply” is highly dependent on these people  The RG index (Reference Group) compares your BCI with all previous AEIP participants
  • 23.
    M.Gargiulo–TeachingnetworksusingtheSocialCapitalQuestionnaire,Slide23 Network resources:Network resources: Howdependent are you on a single contact?How dependent are you on a single contact? 12.17 17.57 13.20 16.71 12.29 10.23 0 10 20 30 40 50 60 70 80 90 100 Task support Influence Emotional support Political Support Information Replacement BenefitConcentrationIndex Average Minimum Maximum Benefit Concentration Index ranges from 0 to 100 • The higher your score, the more you depend on one or a few contacts to obtain the specific network benefit
  • 24.
    M.Gargiulo–TeachingnetworksusingtheSocialCapitalQuestionnaire,Slide24 Evidence on networkeffects:Evidence on network effects: Do networks affect individual performance?Do networks affect individual performance? -1.6 -1.4 -1.2 -1.0 -0.8 -0.6 -0.4 -0.2 0.0 0.2 0.4 0.6 0.8 1.0 Level of Social Capital Performance Source M. Gargiulo, G. Ertug & C. Galunic, “The two faces of control. Network closure and individual performance among knowledge workers”. Administrative Science Quarterly (2009) Social capital matters Holding human capital constant, a 10 % increase in social capital of MDs results in a 4.8 % increase in performance Managing Directors Executive Directors Directors Associates Social capital matters • Lines represent how investment bankers’ performance varies as social capital increases, net of the effects of human capital • The effect of social capital on performance becomes more apparent as bankers have more client and managerial responsibilities—that is, as their job becomes more complex Who is in the network also matter A 10% increase in the quality of the people in the network results on average on a 2.8% increase in performance
  • 25.
    M.Gargiulo–TeachingnetworksusingtheSocialCapitalQuestionnaire,Slide25 Evidence on networkeffects:Evidence on network effects: Who are the innovators?Who are the innovators?  673 supply chain managers were asked for ideas to improve the supply-chain in Raytheon, a large electronics and defense company  Ideas were blind-judged by two independent senior managers  Managers with contacts in different groups significantly more likely to … • Have ideas on how to improve the supply chain management • Have their ideas recognized as valuable • Discuss their ideas with colleagues  This finding has been replicated in a number of fields, from music to philosophy, from science to industry: innovations come disproportionally from people bridging separate groups Source R.S. Burt, Structural Holes and Good Ideas. American Journal of Sociology, 110 (September 2004): 349–99
  • 26.
    M.Gargiulo–TeachingnetworksusingtheSocialCapitalQuestionnaire,Slide26 Evidence on networkeffects:Evidence on network effects: Which network structure fosters innovation?Which network structure fosters innovation?  A study of the network of the creative artists who made Broadway musicals from 1945 to 1989  Creative artists (excluding actors) are directly linked to each other when they collaborate on the same show and indirectly through having collaborated with common third parties in different shows  Measures of financial success (tickets sold) and artistic success (average critics’ reviews)  The financial and artistic success of Broadway productions increases as the artist networks resemble the “island and bridges” structure. The same holds true for Broadway seasons  Extreme network structures do not work: both disconnected islands with very few bridges or too many bridges with few islands damages both artistic and financial success Source B. Uzzi & J. Spiro, Collaboration and Creativity: The Small World Problem. American Journal of Sociology, 111 (September 2005): 447–504
  • 27.
    M.Gargiulo–TeachingnetworksusingtheSocialCapitalQuestionnaire,Slide27 Can something bedone?Can something be done? Debunking myths about networkingDebunking myths about networking  “Skilled networkers are born; they cannot be trained” “The social capital people build is a reflection of their personality” “Networks occur naturally. There is little that management can do to affect how networks emerge and evolve” FALSE FALSE FALSE
  • 28.
    M.Gargiulo–TeachingnetworksusingtheSocialCapitalQuestionnaire,Slide28 Can something bedone?Can something be done? Evidence on the effect of social capital trainingEvidence on the effect of social capital training on performanceon performance Executives that received training in social capital were … • 35 % more likely to be evaluated as “exceeding expectations” • 43% more likely to be promoted … than peers in a matched control group Source R. Burt and D. Ronchi, “Teaching executives to see social capital: results from a field experiment," Social Science Research (2007).
  • 29.
    M.Gargiulo–TeachingnetworksusingtheSocialCapitalQuestionnaire,Slide29 Taking stock:Taking stock: Aself-guided assessment of your social capitalA self-guided assessment of your social capital Personal reflection • Take some time to go over your report and try to fill out the worksheet Assessing the Social Capital of Your Network With other participants • Get together with two other participants to discuss strategies on how to enhance the social capital of your professional network
  • 30.
    M.Gargiulo–TeachingnetworksusingtheSocialCapitalQuestionnaire,Slide30 Closing message:Closing message: Youalways “manage” your network –You always “manage” your network – even if you don’t notice iteven if you don’t notice it Even if we are not aware of it, we are constantly shaping our network. When we answer a request from a colleague, reject an invitation to a professional meeting, or stay in touch with an old friend, we are implicitly making networking decisions. But actively managing our professional network is not easy. We may even find it awkward. Left alone, however, most networks would become too homogeneous, too dense, or render people too dependent on a few contacts. Instead of benefiting from its social capital, we may become trapped in our own net. Leaders need to manage the social capital of their networks, because this capital is one of the foundations of successful leadership.
  • 31.
    M.Gargiulo–TeachingnetworksusingtheSocialCapitalQuestionnaire,Slide31 APPENDIXAPPENDIX Network Diversity IndexesNetworkDiversity Indexes in the Social Capital Questionnairein the Social Capital Questionnaire
  • 32.
    M.Gargiulo–TeachingnetworksusingtheSocialCapitalQuestionnaire,Slide32 Understanding network diversityindexesUnderstanding network diversity indexes 1 2 3 4 1 2 3 4 High Diversity NetworkLow Diversity Network How your individual diversity indexes look like Range of scores for Reference Group Your score Average score for Reference Group Network diversity increases with … The different types of people in your network The distribution of your relationships across those people
  • 33.
    M.Gargiulo–TeachingnetworksusingtheSocialCapitalQuestionnaire,Slide33 0 10 20 30 40 50 60 70 80 90 100 25% 30% 35%40% 45% 50% 55% 60% 65% 70% 75% 80% 85% 90% 95% 100% Percentage in first category of contacts (out of four) DiversityIndex How does the Network Diversity Index works?How does the Network Diversity Index works?  The Network Diversity Index (NDI) decreases with the proportion of contacts in each category and with the strength of your relationship with these contacts.  The index is 0 if you are strongly tied to one type of contact and approaches 100 as you are equally tied to people from many different backgrounds  The graph shows the NDI for a network with four possible categories of contacts as a function of the proportion of contacts in the first category  A little diversity goes a long way. Even if you have 50% of contacts in one category, your NDI will be above 90 if you do have people in the other three categories.  The NDI drops rapidly once you have more than 70% of your contacts in one category. For the mathematically curious: NDIi = 1 - ∑k (pkpij,k)2 pk: the proportion of alters in the kth category (∑k pk = 1) Pij,k: the mean proportional relationship strength between you and alters in that category