Download to read offline

![AMI ANALYTICS: A CASE STUDY
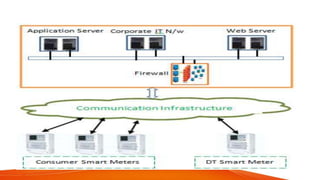
Different manufactures have provided meters which works on different communication technology. Data
from all meters are integrated, synthesized and stored for data analysis and real time monitoring Smart
Meters have been installed at consumer premises including various distribution transformers
and feeders. These meters work on various technologies namely PLC, GPRS, RF 2.4 GHz and
RF 865 MHz. Smart meters working on RF/PLC communicate to Data Concentrator Unit which
transmits the data to meter data acquisition system.However, Smart Meters working on GPRS
communicate to MDAS directly. MDAS exchange meter data to meter data management system [4]. All
of these components of AMI are integrated at one common platform at Smart Grid Control Center at
Puducherry. Virtualized environment at blade server along with storage is setup at control center for
monitoring real time energy consumption pattern, other parameters and various alarms associated with
it. The utility can use alarm information for reliability evaluation and failure analysis. Further,
information also enables utility to monitor the health/availability of devices in AMI infrastructure.](https://image.slidesharecdn.com/smartmeter-200616130532/85/Smart-meter_Advanced-metering-Infrastructures-7-320.jpg)
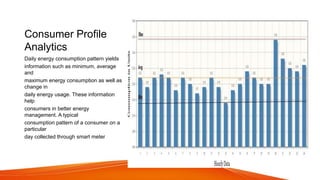
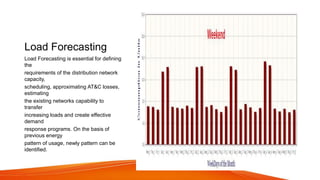
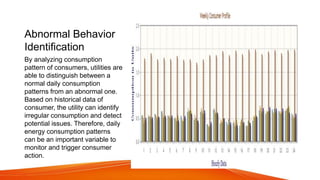


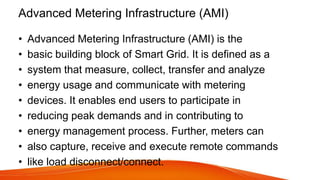
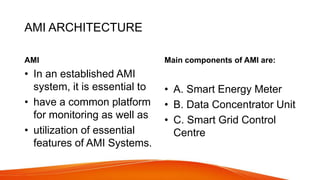
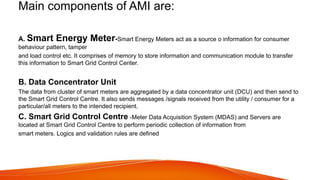
Advanced Metering Infrastructure (AMI) allows for two-way communication between smart meters and a utility control center. It enables utilities to remotely monitor energy usage, detect outages, and provide time-of-day pricing to encourage lower energy use. The key components of an AMI system are smart meters at customer sites, data communication networks, and a meter data management system at the utility to aggregate usage data. AMI systems provide utilities with tools for energy analytics like load forecasting, demand response, and identifying abnormal energy usage patterns.


![EPC Solutions LLP- Presentation [ENERGY MANAGEMENT]](https://cdn.slidesharecdn.com/ss_thumbnails/epcsolutionsllpemin-151021083716-lva1-app6892-thumbnail.jpg?width=640&height=640&fit=bounds)


![[Oil & Gas White Paper] Best Practices Support Success in the Open Natural Ga...](https://cdn.slidesharecdn.com/ss_thumbnails/bestpracticessupportsuccess2012-130830025223-phpapp01-thumbnail.jpg?width=640&height=640&fit=bounds)