SlideShare a Scribd company logo
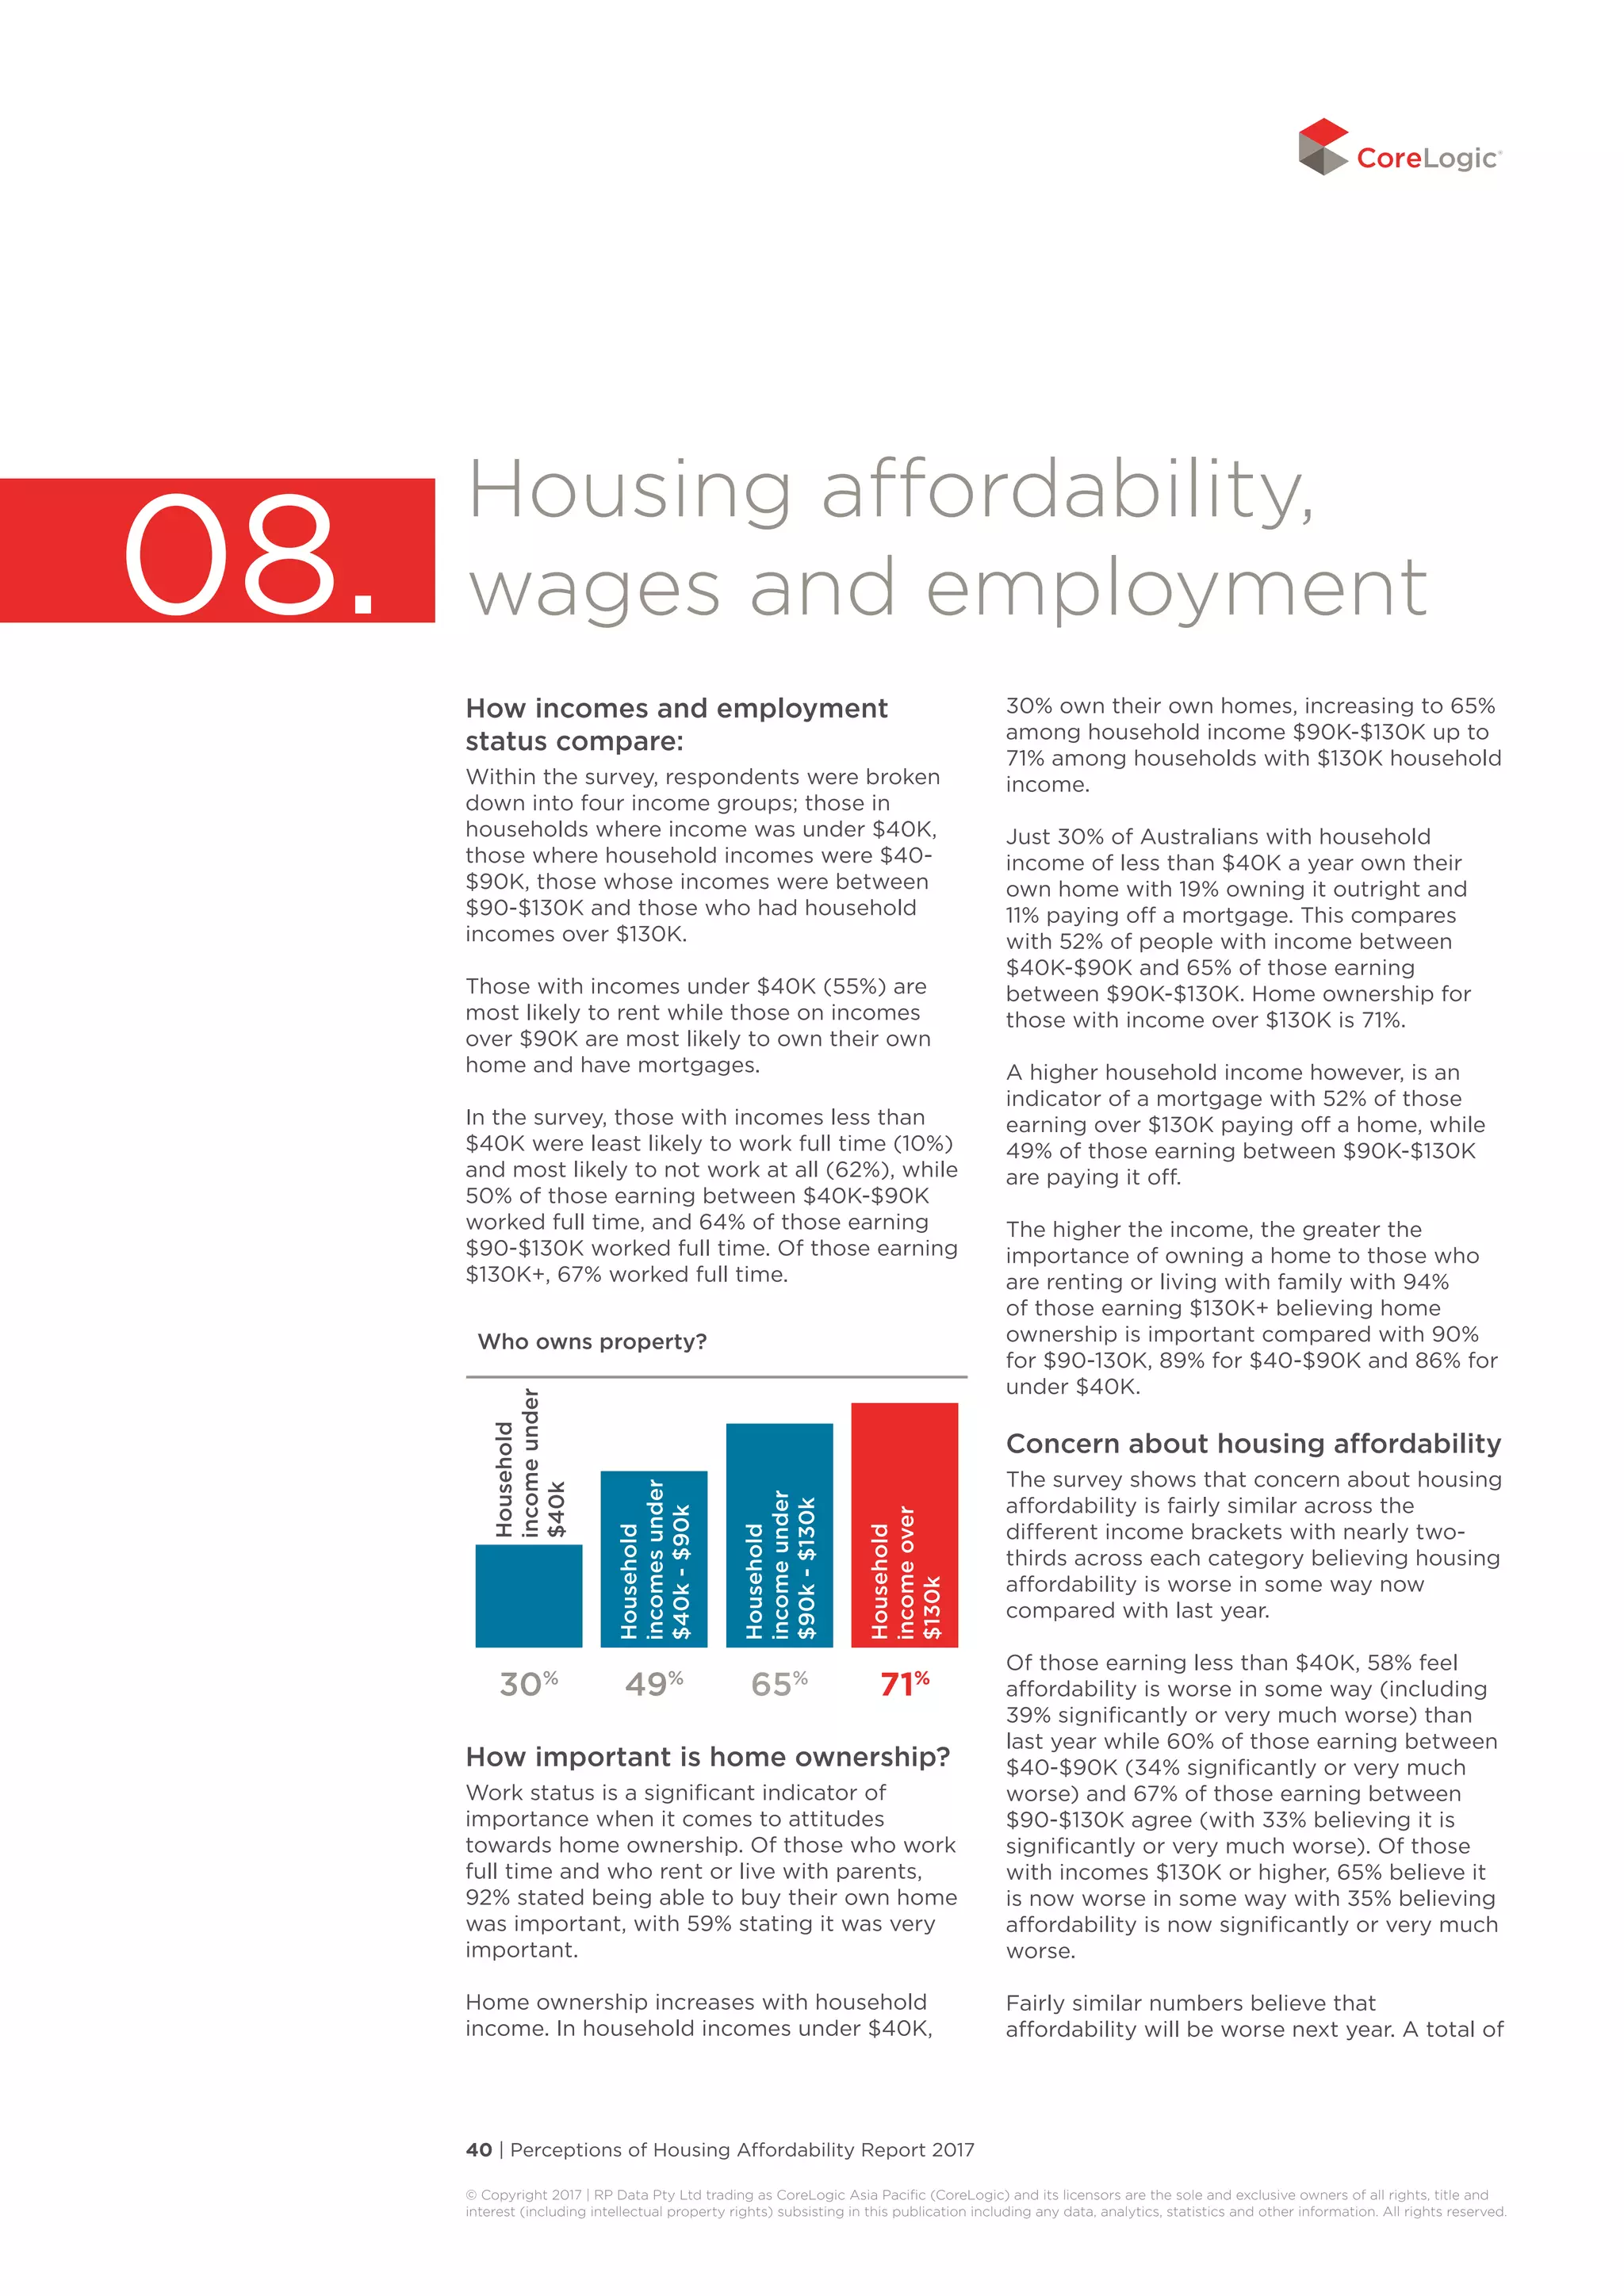
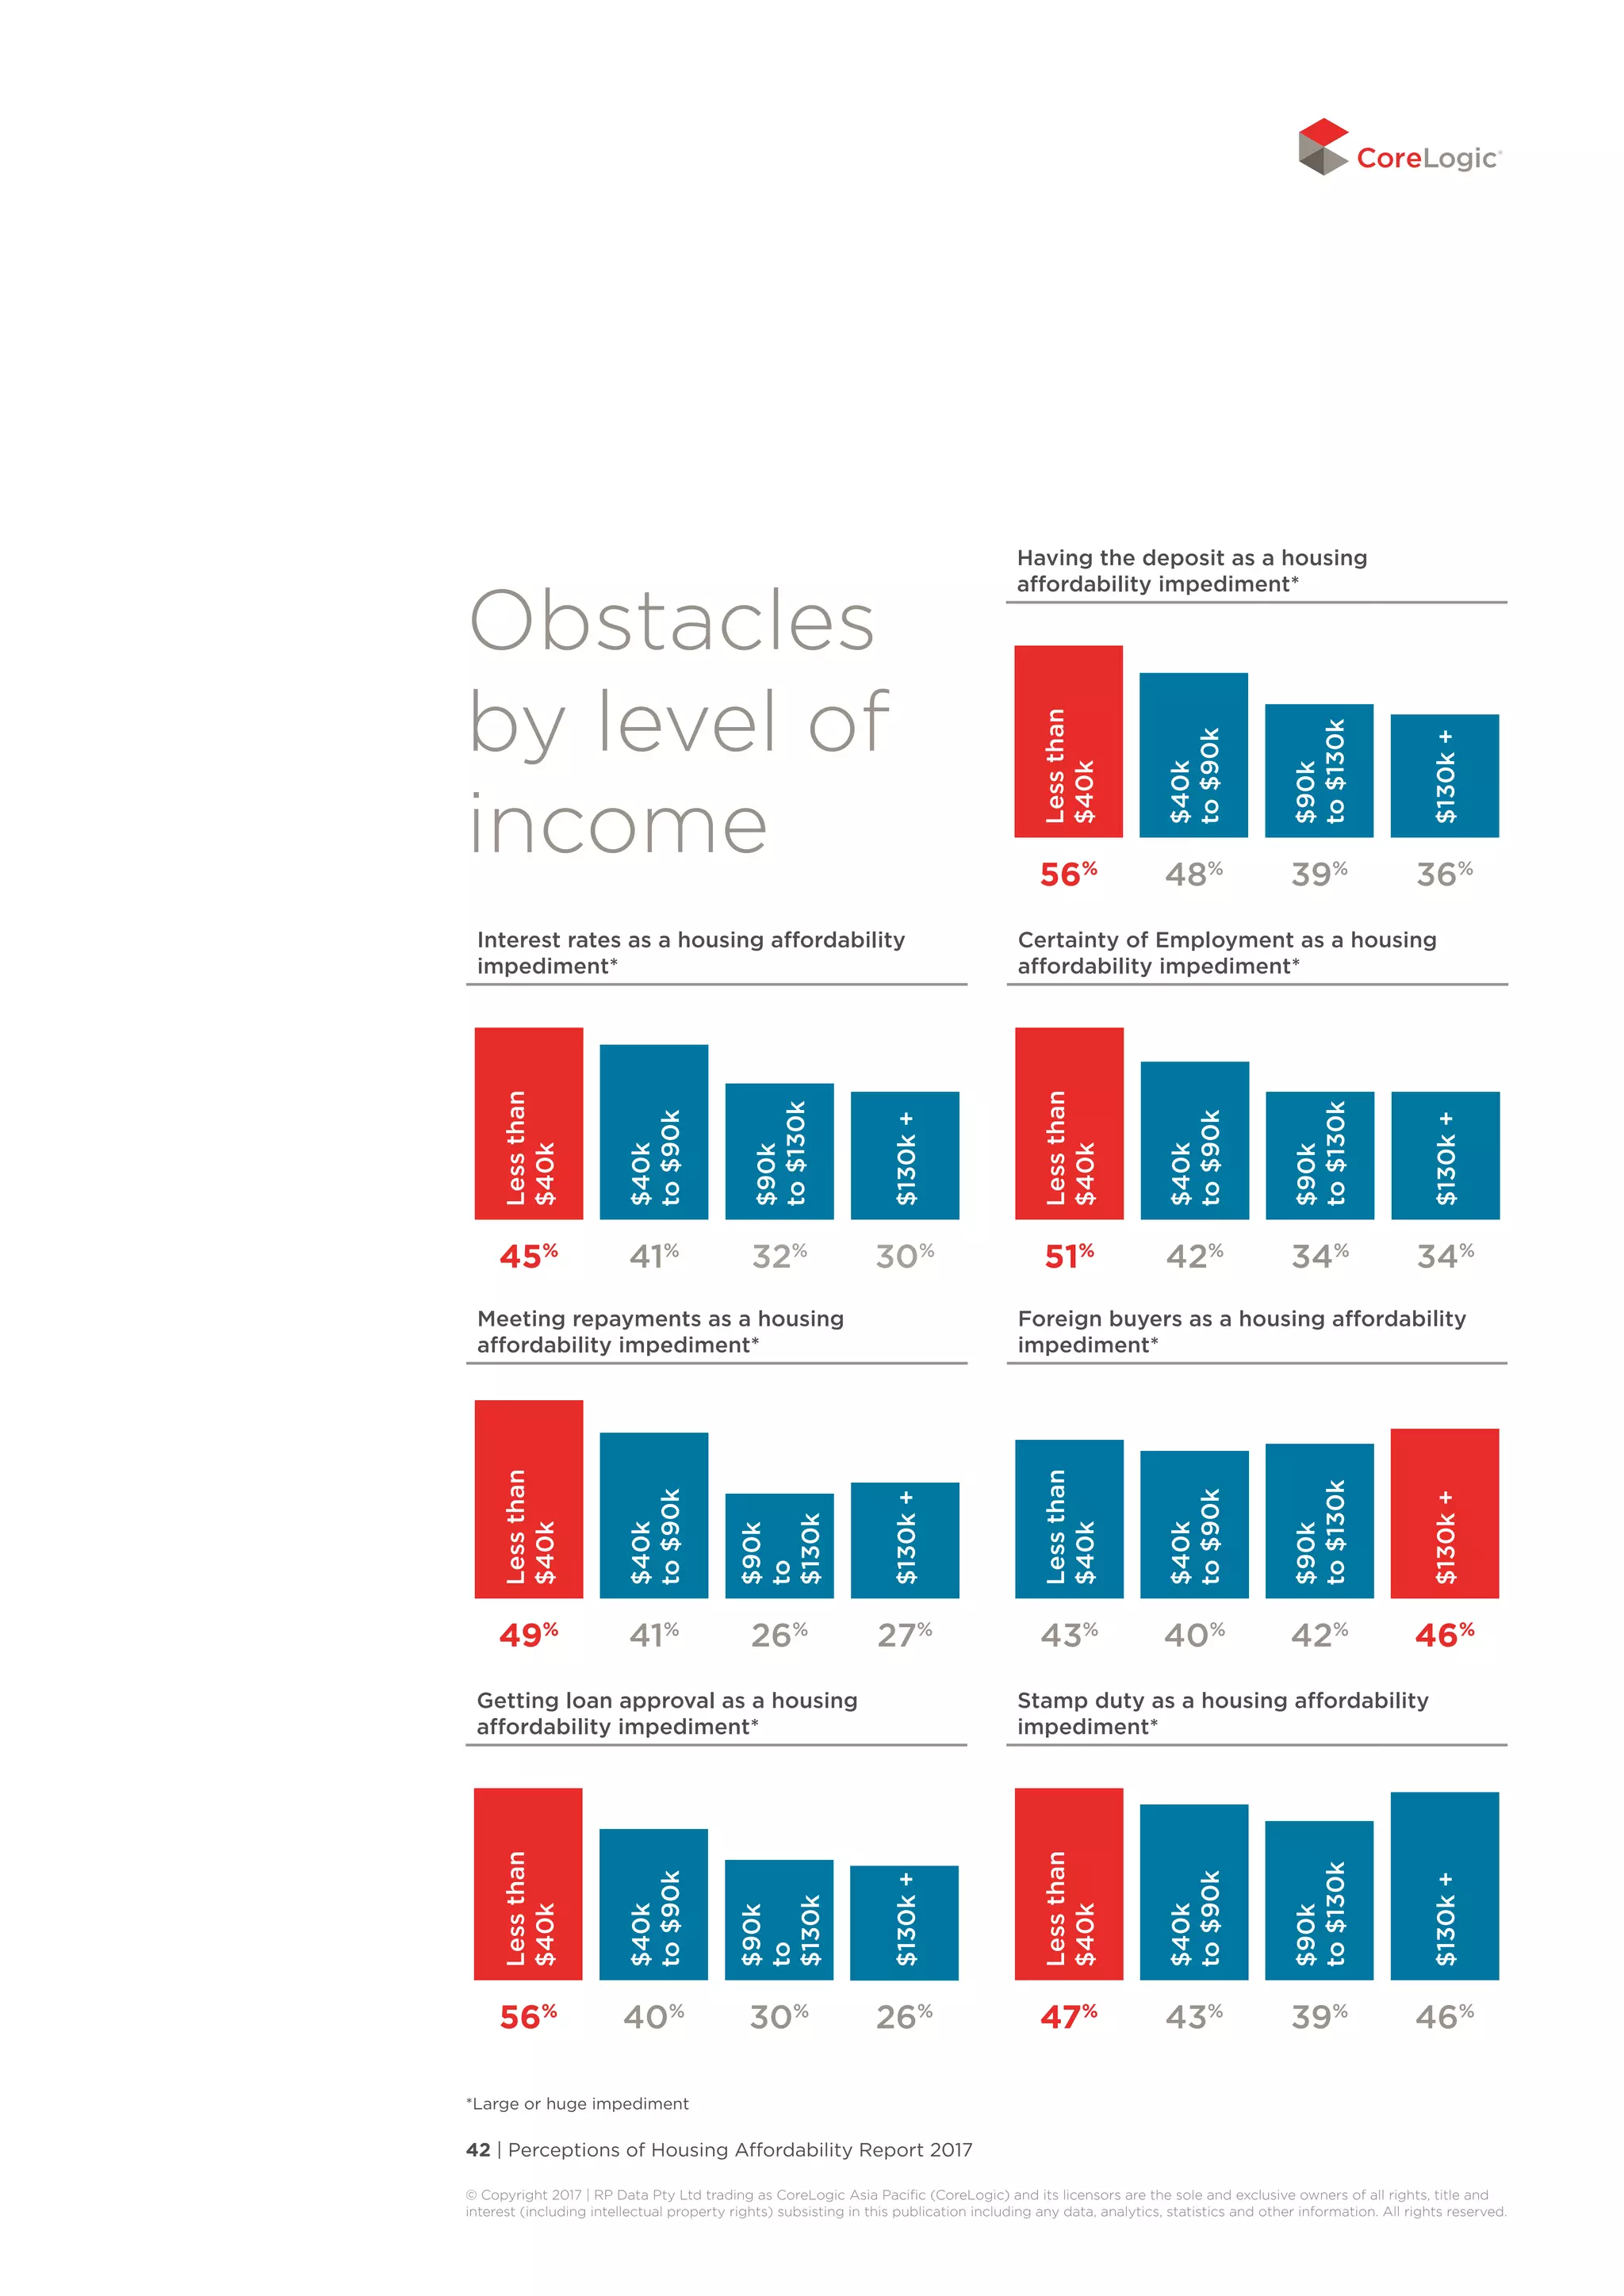
1 of 60
MAY 2017
Perceptions of
Housing Affordability
Report 2017
2 | Perceptions of Housing Affordability Report 2017
Welcome to the
2017 Perceptions of
Housing Affordability
report by CoreLogic.01.
Perceptions of Housing Affordability Report 2017 | 3
© Copyright 2017 | RP Data Pty Ltd trading as CoreLogic Asia Pacific (CoreLogic) and its licensors are the sole and exclusive owners of all rights, title and
interest (including intellectual property rights) subsisting in this publication including any data, analytics, statistics and other information. All rights reserved.
Perceptions of Housing Affordability is a
landmark report by CoreLogic that compares
current property data to the cost concerns
and housing aspirations across Australia’s
generations, families, states and income
brackets.
The report identifies how Australians of all
demographics feel about affordability and its
impact on their dreams of property ownership
or property upgrading and provides insights
into what governments and authorities can do
to affect change.
Residential real estate is the country’s largest
asset class at $7.0 trillion – far outstripping
superannuation at $2.2 trillion and listed
stocks at $1.8 trillion1
. Australian households
have more than half their wealth tied up in the
residential housing sector and about 70% of
their debt is housing related.
This new survey reveals the degrees to
which the great Australian dream of home
ownership is becoming an insurmountable
challenge. It reveals that a growing proportion
of younger generations, while overwhelmingly
maintaining a sustained appetite to live
the dream, are staying home with parents
– increasingly into their 30s – to save for
deposits.
It captures the degree to which parents are
being expected to assist their adult children in
either saving for - or paying for - a home, and
reveals how families with low incomes and or
young children are becoming more vulnerable
to mortgage stress.
The survey identifies how buying a home
is becoming the privilege of high income
earners who are being expected to assign
ever increasing proportions of income
towards servicing a mortgage. And it reveals
how older Australians are deeply fearful of
the costs of moving or downgrading, which
in turn is affecting supply and contributing to
raising housing costs even further especially
in inner cities.
By every measure, housing affordability has
worsened over the past 15 years. The cost of
buying a house currently takes 7.2 times2
the
annual income of a typical household – up
from 4.2 times income 15 years ago. It now
takes 1.53
years of household income to save
for a 20% deposit on a home and servicing
a typical loan of 80% of the value of a house
now requires 39%4
of household income,
compared with 25% in 2001. Australia is
even one of the least affordable countries
for housing in the world with all five of our
capitals labelled as severely unaffordable
and amongst the top 20 unaffordable cities
internationally.5
Addressing housing affordability cannot
be fixed with a single silver bullet. It is an
issue that affects every layer of government
and requires unprecedented cooperation to
properly address. Most importantly, it requires
leadership at the highest level of government.
This is the first time CoreLogic - or any other
property data and analytics provider - has
attempted to capture the depth and extent of
the attitudes of the different strata of society
and applied them to the topic of housing
affordability.
We have sought to quantify just how much
the different strata of Australian society care
about varying factors relating to affordability
including their concerns, what they perceive
to be the obstacles, the concessions they
are prepared to make to buy property and
the strategies they believe will make housing
more affordable.
We take this action in the firm belief that
what is measured can be managed and that
these measurements may help policy makers
identify better policies to improve housing
affordability where it is most needed.
I trust you find the report valuable and I’d love
to hear your feedback.
Lisa Claes
Chief Executive Officer,
CoreLogic International
1
CoreLogic 2017
2,3,4
ibid
5
Demographica 2017
Contents
01 02 03
Welcome Executive summary The methodology
Page 2 Page 6 Page 8
04 05 06
National overview
and key insights
State-based
attitudes to housing
affordability
Generational
attitudes towards
housing affordability
a. How is housing
affordability measured?
a. The investor landscape a. How listing anxiety
is affecting housing
affordability
b. Housing affordability
across the states
Page 9 Page 16 Page 26
07 08 09
Families, children
and housing
affordability
Housing
affordability, wages
and employment
Options to fix
housing affordability
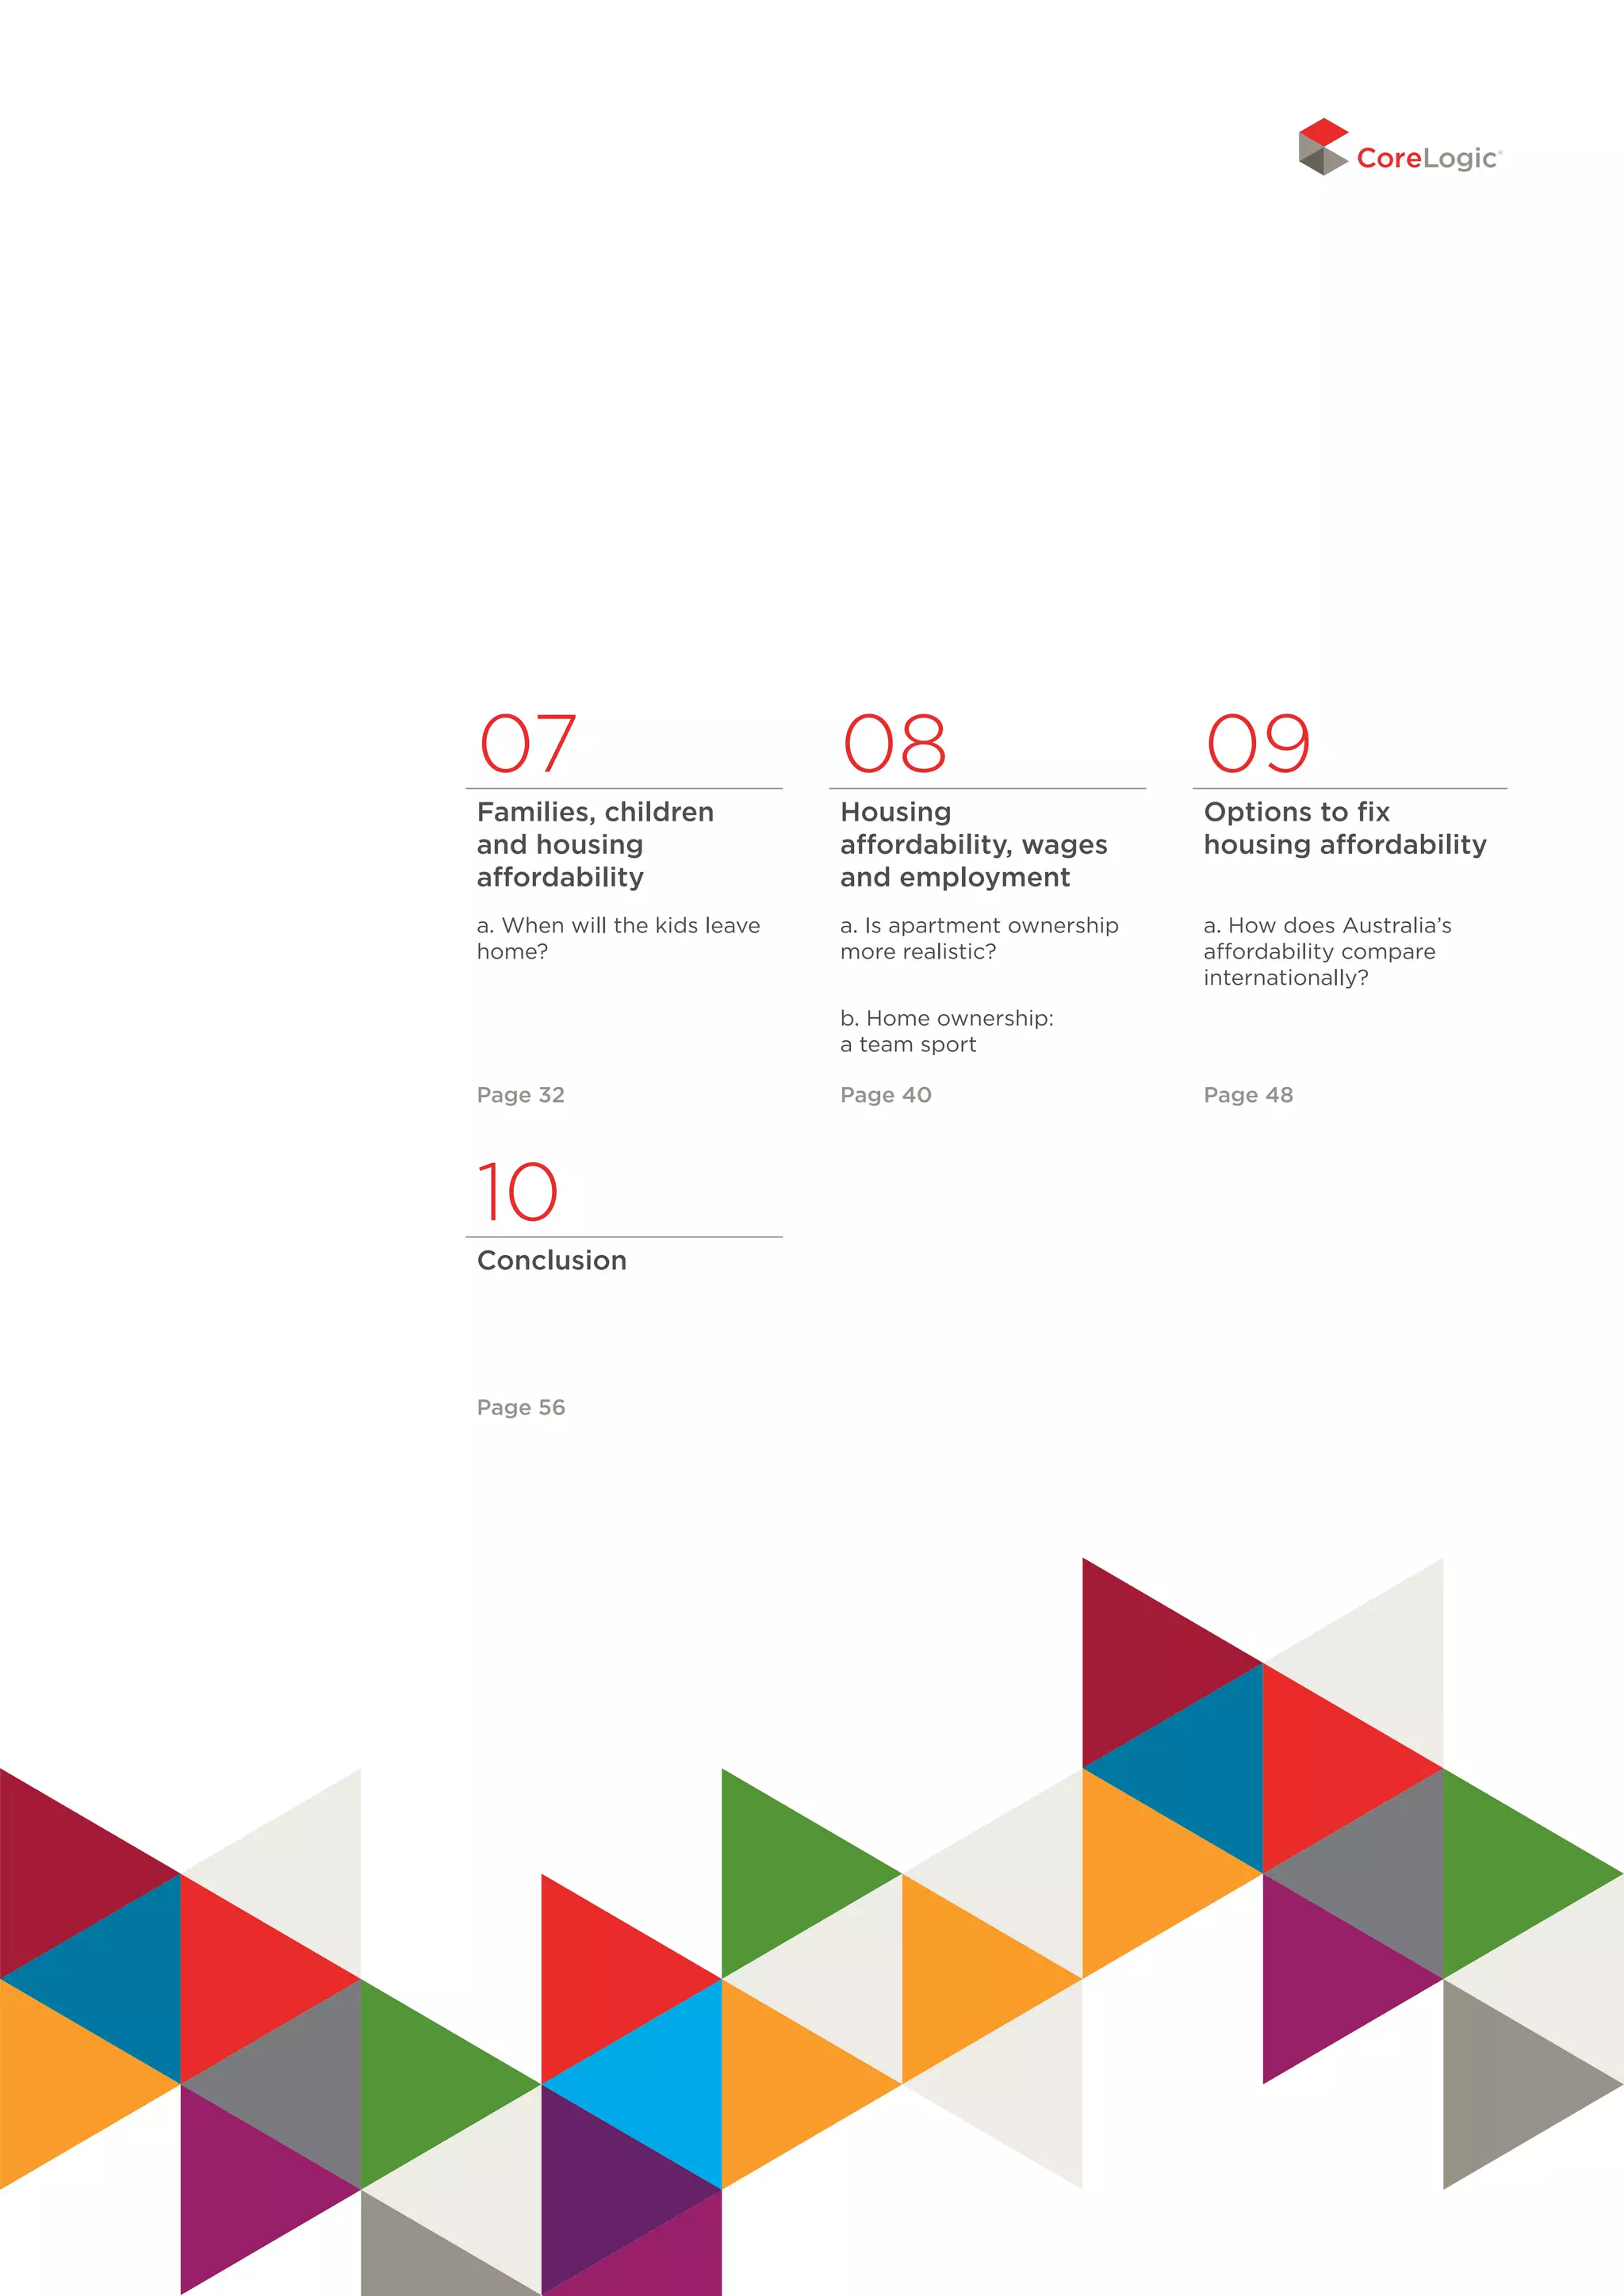
a. When will the kids leave
home?
a. Is apartment ownership
more realistic?
a. How does Australia’s
affordability compare
internationally?
b. Home ownership:
a team sport
Page 32 Page 40 Page 48
10
Conclusion
Page 56
6 | Perceptions of Housing Affordability Report 2017
© Copyright 2017 | RP Data Pty Ltd trading as CoreLogic Asia Pacific (CoreLogic) and its licensors are the sole and exclusive owners of all rights, title and
interest (including intellectual property rights) subsisting in this publication including any data, analytics, statistics and other information. All rights reserved. 
Executive
summary
By every measure, housing affordability has
worsened over the past 15 years. The cost of
buying a dwelling currently takes 7.2 times6
the annual income of a typical household – up
from 4.2 times income 15 years ago.
It now takes 1.5[2]
years of household income
to save for a 20% deposit on a dwelling
compared with 0.8 years 15 years ago and
servicing a typical loan of 80% of the value of
a dwelling now requires 38.8%[3]
of household
income, compared with 25.2% in 2001.
How has this happened? As a result of low
interest rates, we have seen a reduction in the
costs associated with servicing a mortgage
which has led to financial institutions lending
ever higher amounts in markets where
demand is outstripping supply. Meanwhile
the ‘deposit hurdle’ has risen, creating a
financial barrier for new entrants to the
market and high migration has increased
dwelling demand, particularly in Sydney and
Melbourne.
Transaction costs are also playing a significant
role. Stamp duty costs on the median priced
dwelling are now around $35,000 across both
Sydney and Melbourne which is adding to the
savings challenge of prospective buyers.
To keep the dream of home ownership alive,
the Perceptions of Housing Affordability
Report identifies that Australians are making
more and more concessions in terms of
income sacrifice, property suitability factors
and staying at home with parents longer
to save for their own place, but they are
struggling.
That struggle is being fought hardest across
the generations, across different family
types, across different wage brackets – and
even across states - with older and richer
sections of society becoming the property
‘haves’ while others risk being branded ‘least
likely’ unless governments at all levels come
together to radically rethink ways to address
supply and demand.
6
CoreLogic 2017
2,3
ibid
02.
Perceptions of Housing Affordability Report 2017 | 7
© Copyright 2017 | RP Data Pty Ltd trading as CoreLogic Asia Pacific (CoreLogic) and its licensors are the sole and exclusive owners of all rights, title and
interest (including intellectual property rights) subsisting in this publication including any data, analytics, statistics and other information. All rights reserved.
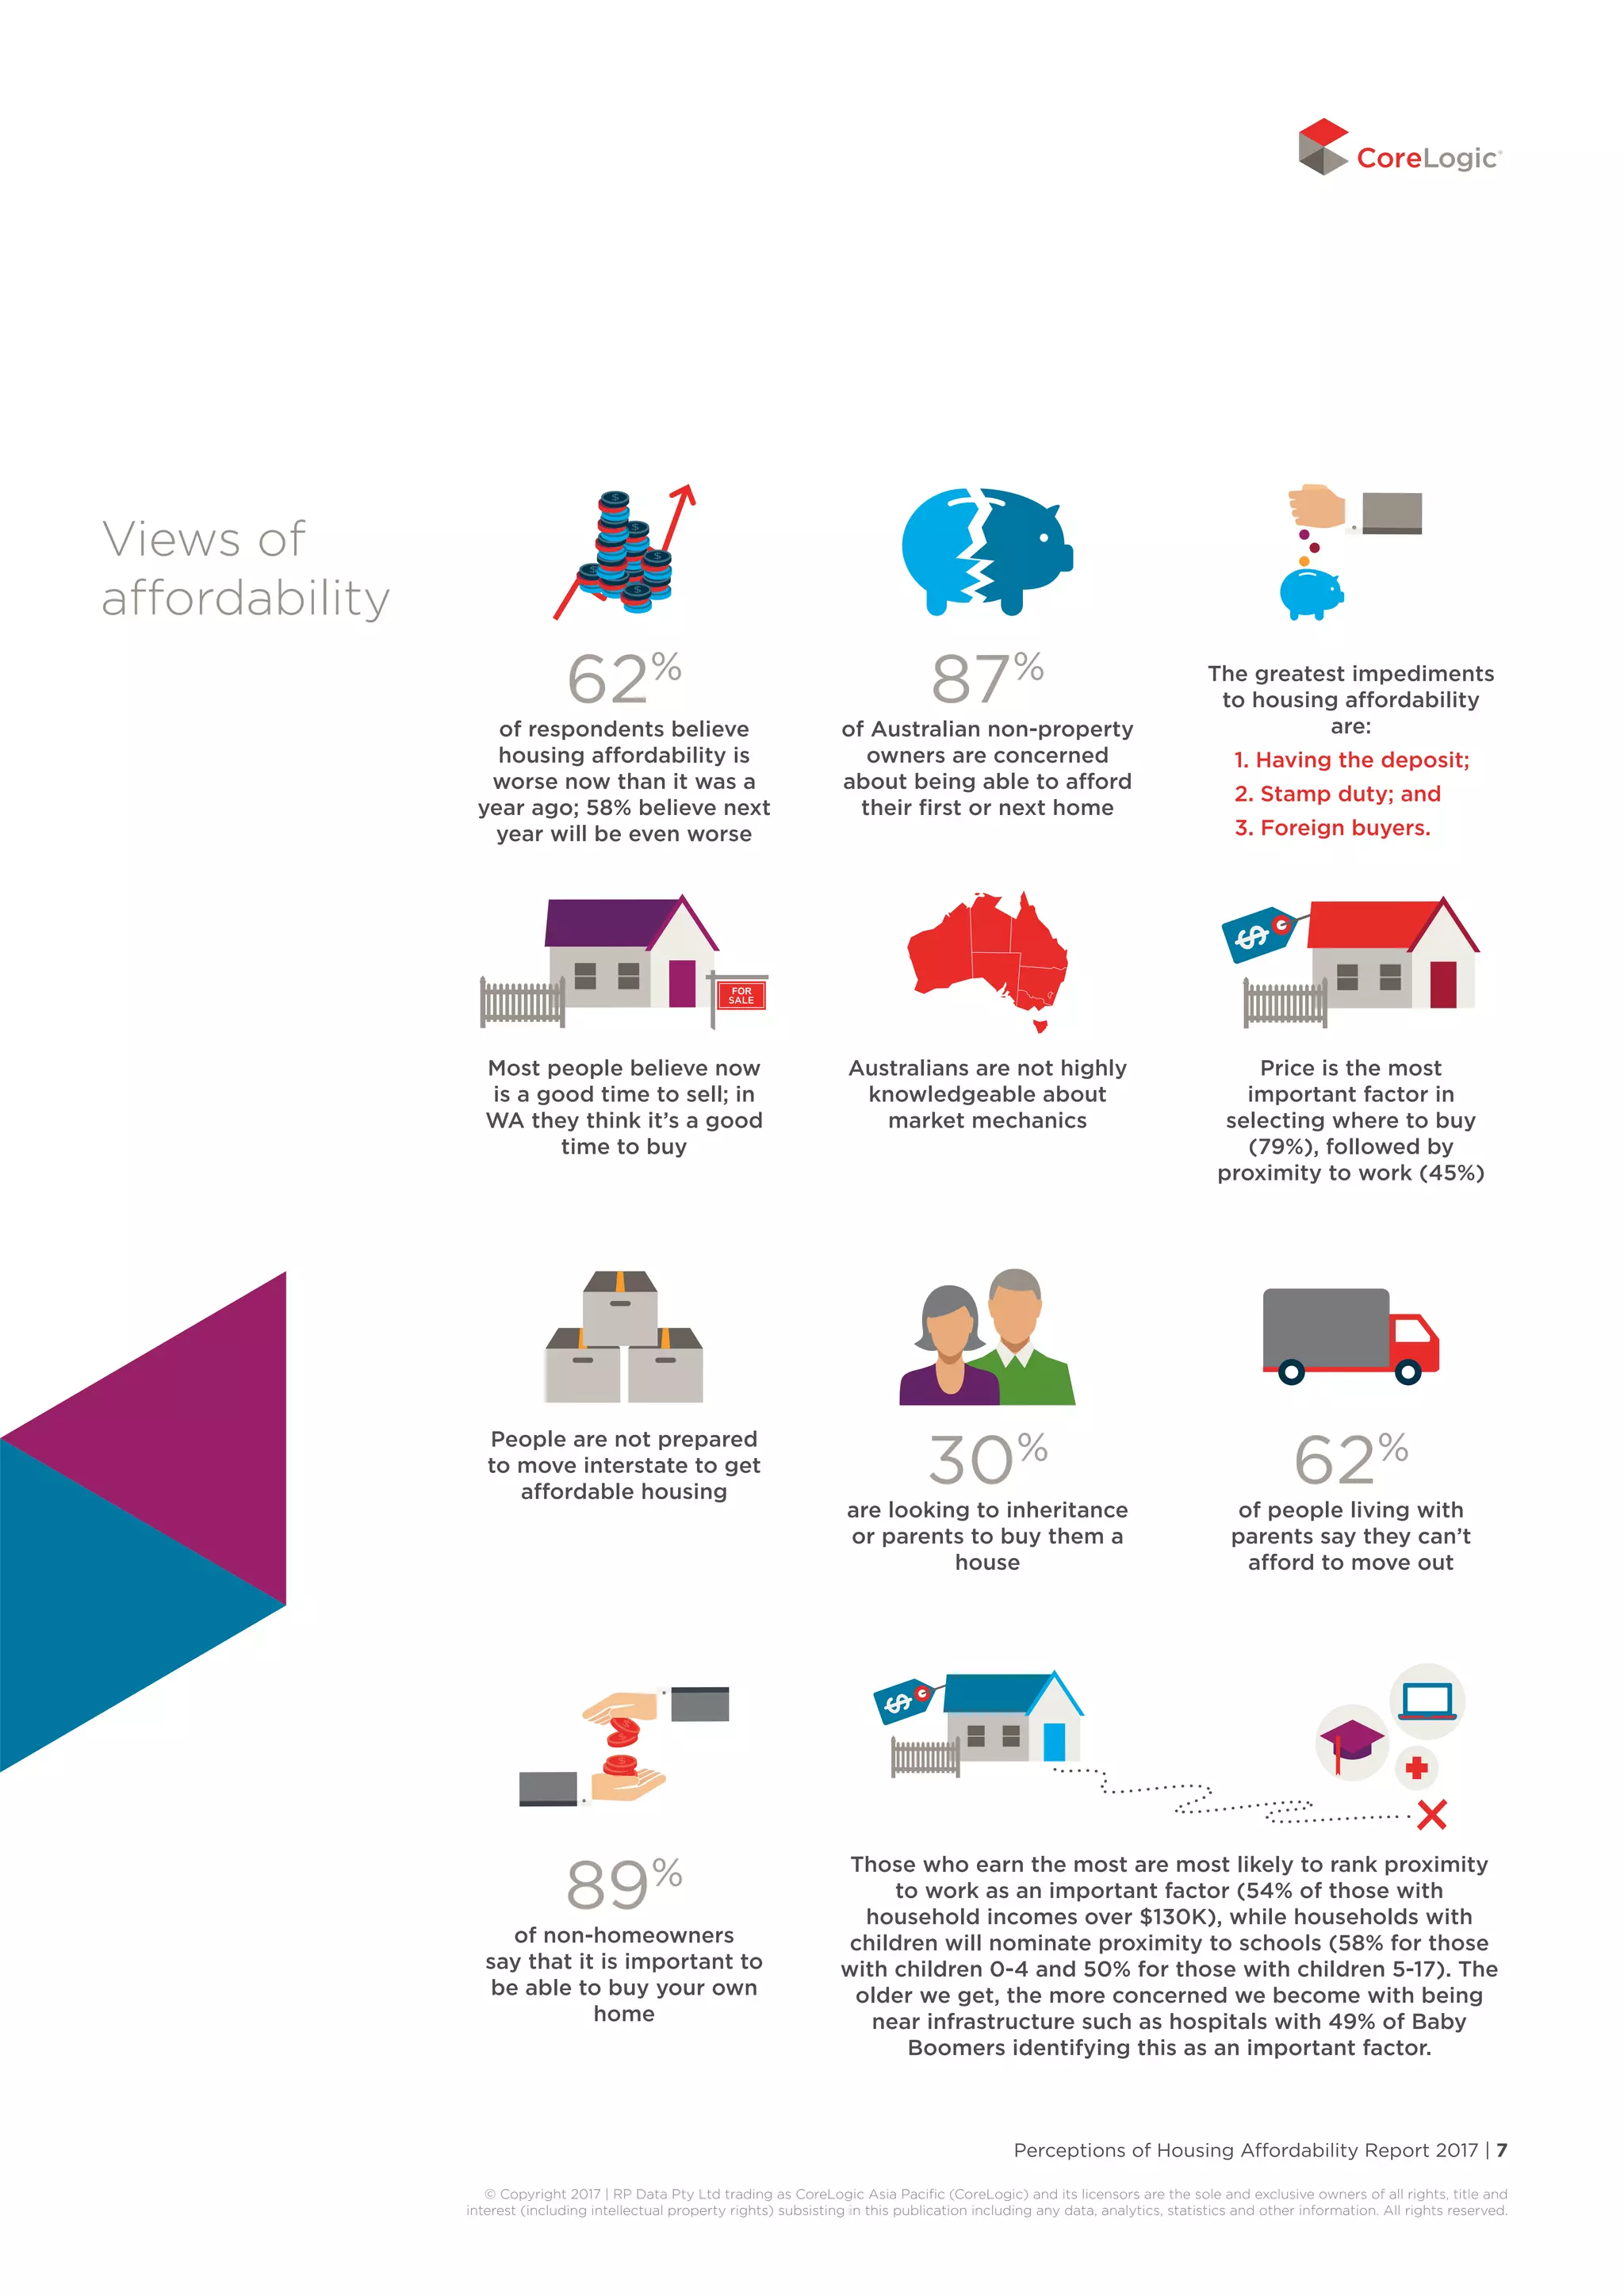
62%
of respondents believe
housing affordability is
worse now than it was a
year ago; 58% believe next
year will be even worse
87%
of Australian non-property
owners are concerned
about being able to afford
their first or next home
The greatest impediments
to housing affordability
are:
1. Having the deposit;
2. Stamp duty; and
3. Foreign buyers.
Most people believe now
is a good time to sell; in
WA they think it’s a good
time to buy
Australians are not highly
knowledgeable about
market mechanics
Price is the most
important factor in
selecting where to buy
(79%), followed by
proximity to work (45%)
People are not prepared
to move interstate to get
affordable housing
30%
are looking to inheritance
or parents to buy them a
house
62%
of people living with
parents say they can’t
afford to move out
89%
of non-homeowners
say that it is important to
be able to buy your own
home
Those who earn the most are most likely to rank proximity
to work as an important factor (54% of those with
household incomes over $130K), while households with
children will nominate proximity to schools (58% for those
with children 0-4 and 50% for those with children 5-17). The
older we get, the more concerned we become with being
near infrastructure such as hospitals with 49% of Baby
Boomers identifying this as an important factor.
Views of
affordability
8 | Perceptions of Housing Affordability Report 2017
© Copyright 2017 | RP Data Pty Ltd trading as CoreLogic Asia Pacific (CoreLogic) and its licensors are the sole and exclusive owners of all rights, title and
interest (including intellectual property rights) subsisting in this publication including any data, analytics, statistics and other information. All rights reserved. 
The
methodology
The 2017 Perceptions of Housing Affordability
Report is based on a study conducted by
Galaxy Research using an online permission-
based panel. The study was carried out
between Tuesday March 7 and Thursday
March 13, 2017.
Age, gender and area quotas were applied
to the sample. Following the completion of
interviewing, the data was weighted by age,
gender and area to reflect the latest ABS
population estimates.
The results were analysed by CoreLogic to
discover the deltas that identified different
attitudes and behaviours around housing
affordability that were perceived to be
significant or which could shed further light
on the complex tapestry of affordability
across states, demographics, family makeup,
income and home ownership type.
The final report was written to highlight these
stories within the data. To make the report
easier to consume, the data has not been
presented where there were no significant
behavioural differences indicated. In these
incidences, national results are indicative of
how the smaller groups also behave or feel.
All percentages in this research have been
rounded up to whole numbers.
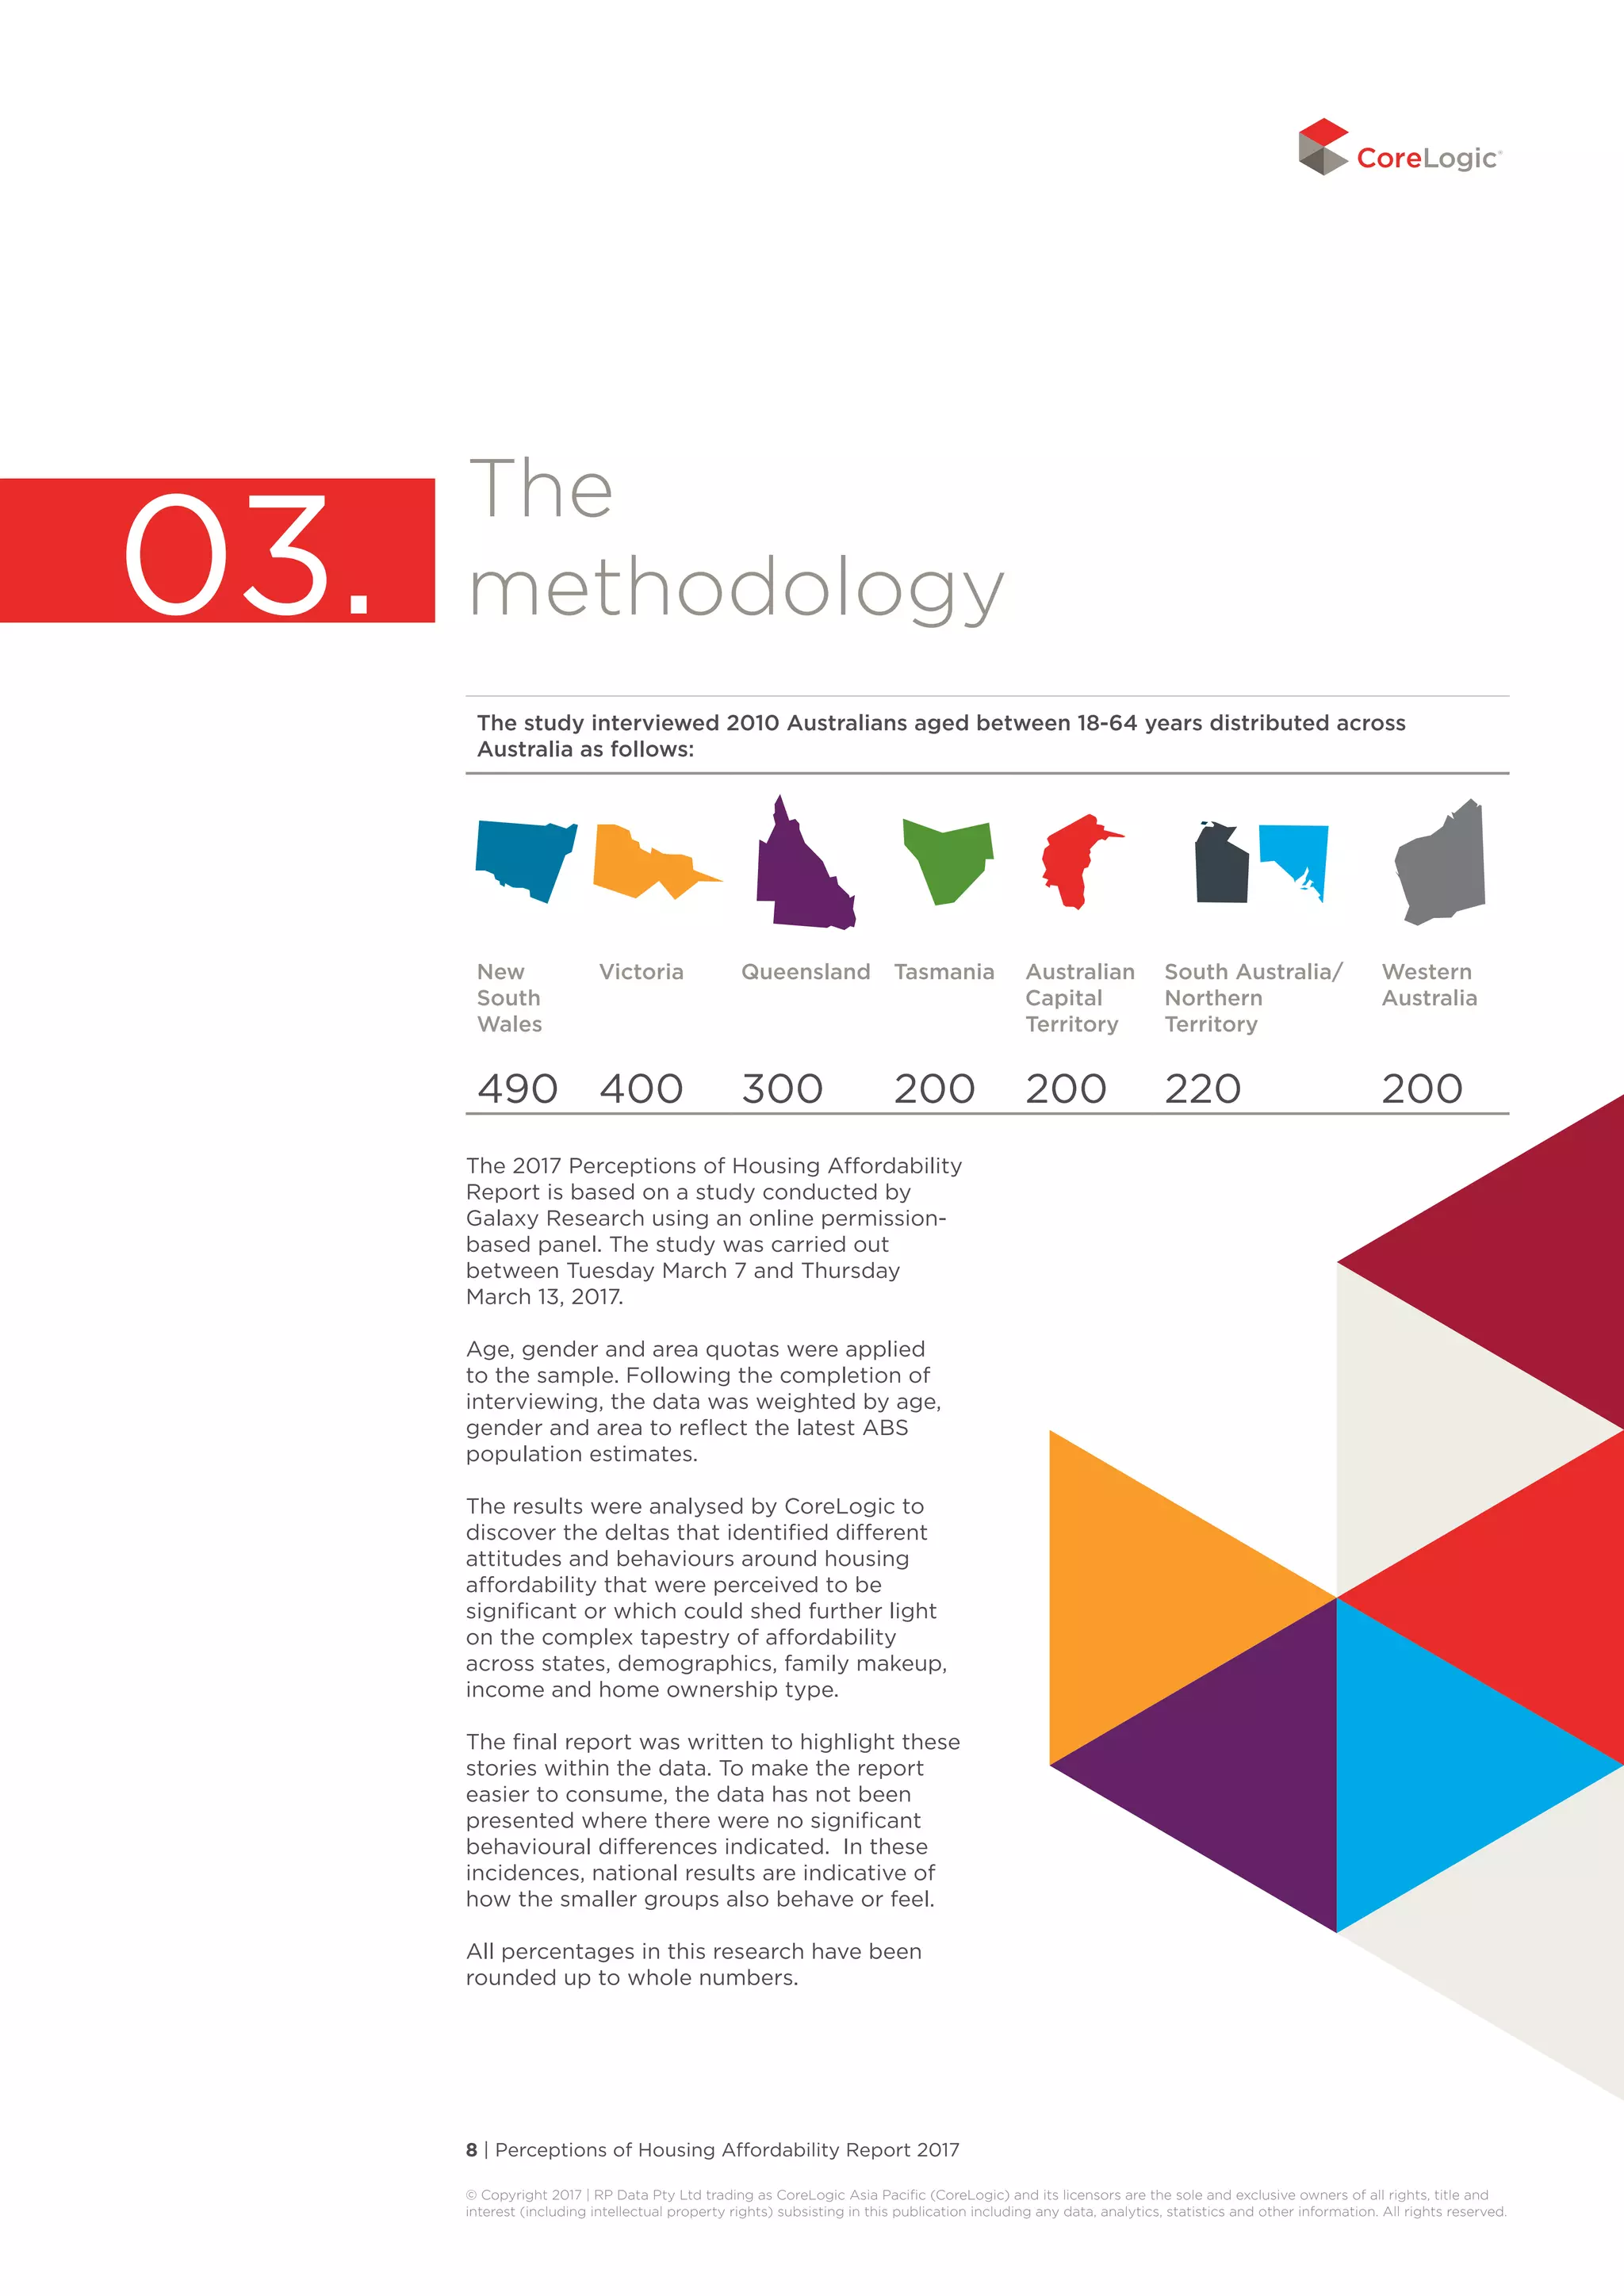
The study interviewed 2010 Australians aged between 18-64 years distributed across
Australia as follows:
New
South
Wales
Victoria Queensland Tasmania Australian
Capital
Territory
South Australia/
Northern
Territory
Western
Australia
490 400 300 200 200 220 200
03.
Perceptions of Housing Affordability Report 2017 | 9
© Copyright 2017 | RP Data Pty Ltd trading as CoreLogic Asia Pacific (CoreLogic) and its licensors are the sole and exclusive owners of all rights, title and
interest (including intellectual property rights) subsisting in this publication including any data, analytics, statistics and other information. All rights reserved.
National overview
and key insights
Owning your own home is the great
Australian dream, but just over half of
Australians are able to achieve it. The survey
shows 53% of Australians aged 18-64 own
their own home with 35% of that number
having a mortgage on a property and 19%
fully owning their home mortgage free. A
total of 37% of Australians have never owned
property, but this number is significantly
higher for Millennials (those aged 18-34) at
60%.
Of the 47% who do not currently own
property, 33% rent or lease, while 12% live
with their parents and 2% identified as having
‘other’ living arrangements.
Yet despite their dream of property
ownership, the research shows Australians
generally do not have a huge amount of
knowledge about the machinery of the real
estate market. No more than half are aware
of any one of the factors such as stamp duty
concessions, deposit levels, investor lending
limits and foreign ownership restrictions and
more than a quarter - 27% - were not aware of
any of the four factors.
Property ownership is concentrated amongst
couples, those who work full time and those
who earn higher salaries. The survey shows
64% of those who are married or in a defacto
relationship currently own property, while
33% of those who are single (whether never
married, divorced, widowed or separated)
currently own property.
It further shows 64% of those who work full
time own property compared with just 44% of
those who work part time and 37% of people
who do not work own property.
Property ownership is also concentrated
amongst Baby Boomers and families with
small children. These demographics are
covered in depth within their own chapters in
the report
How important is home ownership?
The ideal of property ownership is extremely
important for non-homeowners - 89% say it
is important, which includes 55% who say it is
very important.
Millennials – of whom 60% have never owned
a property – are the most likely to aspire to
the dream with 96% rating it as important.
The survey also shows the new phenomenon
of ‘rent-vesting’ is also starting to take
hold with 14% of non-homeowners stating
they would definitely buy an investment
property first, and a further 27% stating they
would consider it. However, just 4% of non-
homeowners already owned an investment
property.
Concern about housing affordability
Concern about housing affordability is
extremely high with 88% of Australian non-
property owners concerned to some extent
about being able to afford to buy a property.
This is made up of 58% of those who rent/
lease who are very concerned about being
able to afford to buy their first home, while
53% of those who live in an apartment are
very concerned about being able to afford to
buy.
Even owning a property is not enough to
assuage this anxiety with 77% of property
owners concerned to some extent about
being able to afford what they want and need
for their next home move.
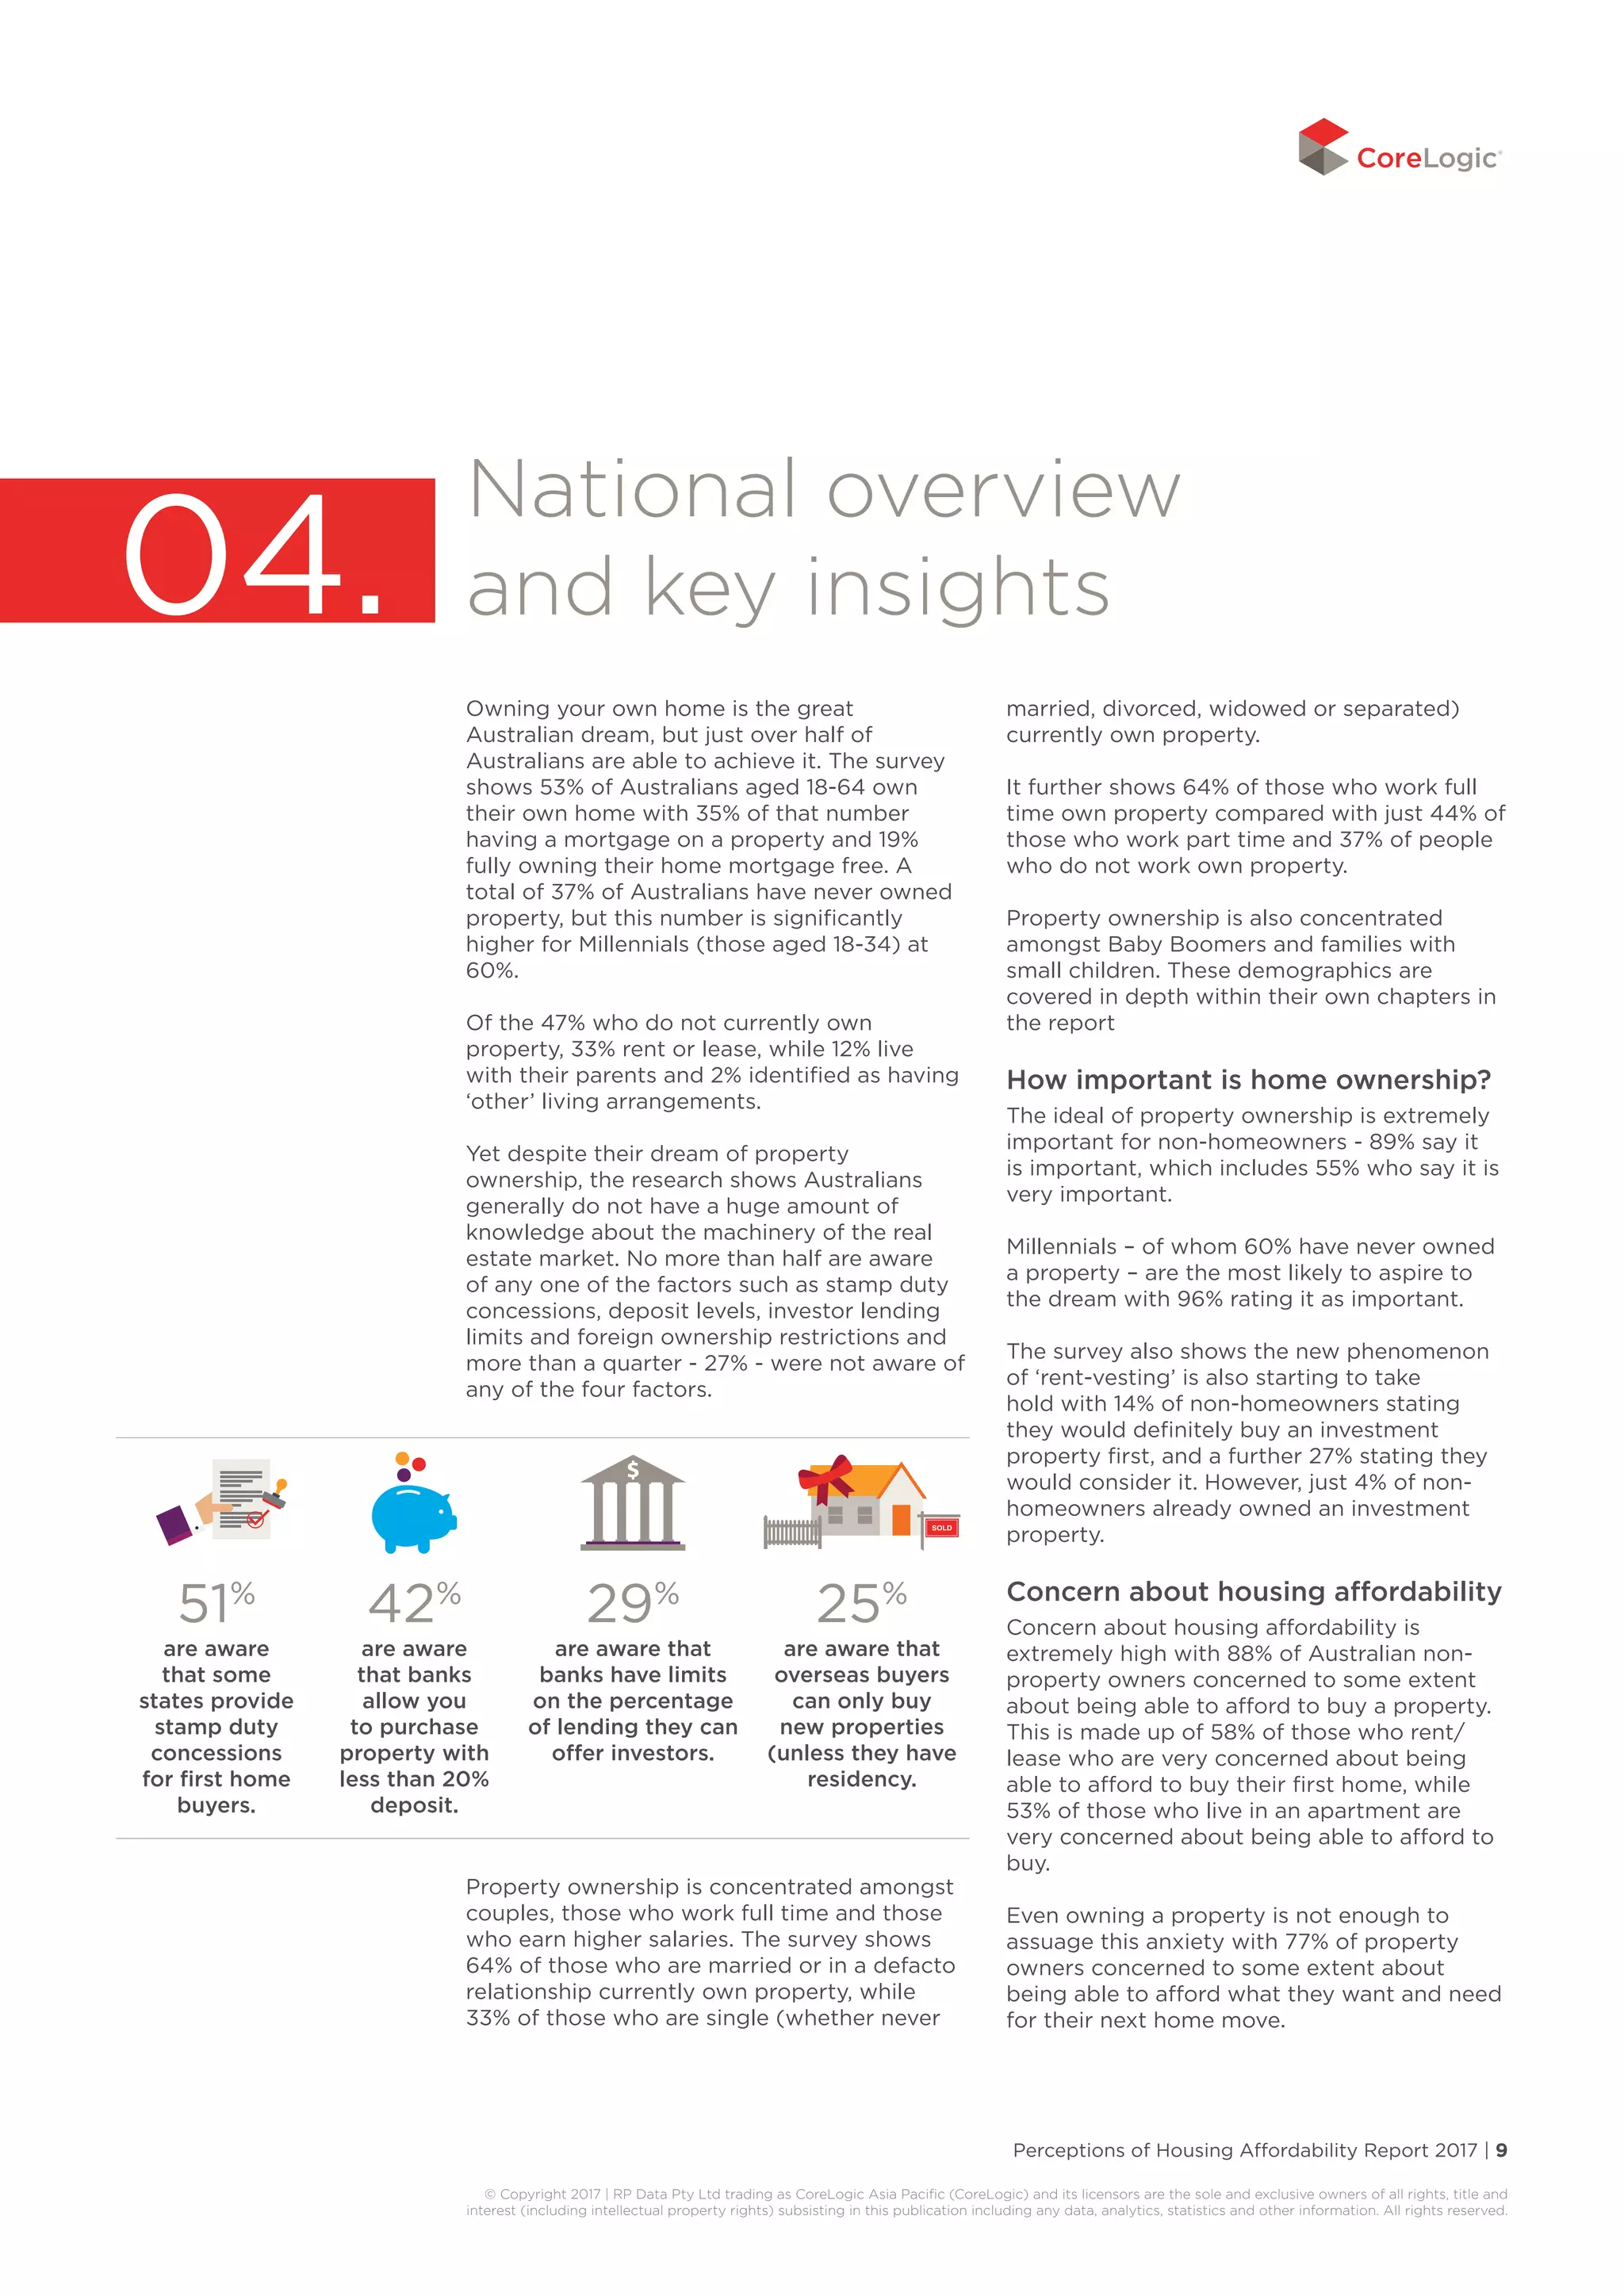
51%
are aware
that some
states provide
stamp duty
concessions
for first home
buyers.
42%
are aware
that banks
allow you
to purchase
property with
less than 20%
deposit.
29%
are aware that
banks have limits
on the percentage
of lending they can
offer investors.
25%
are aware that
overseas buyers
can only buy
new properties
(unless they have
residency.
04.
10 | Perceptions of Housing Affordability Report 2017
© Copyright 2017 | RP Data Pty Ltd trading as CoreLogic Asia Pacific (CoreLogic) and its licensors are the sole and exclusive owners of all rights, title and
interest (including intellectual property rights) subsisting in this publication including any data, analytics, statistics and other information. All rights reserved. 
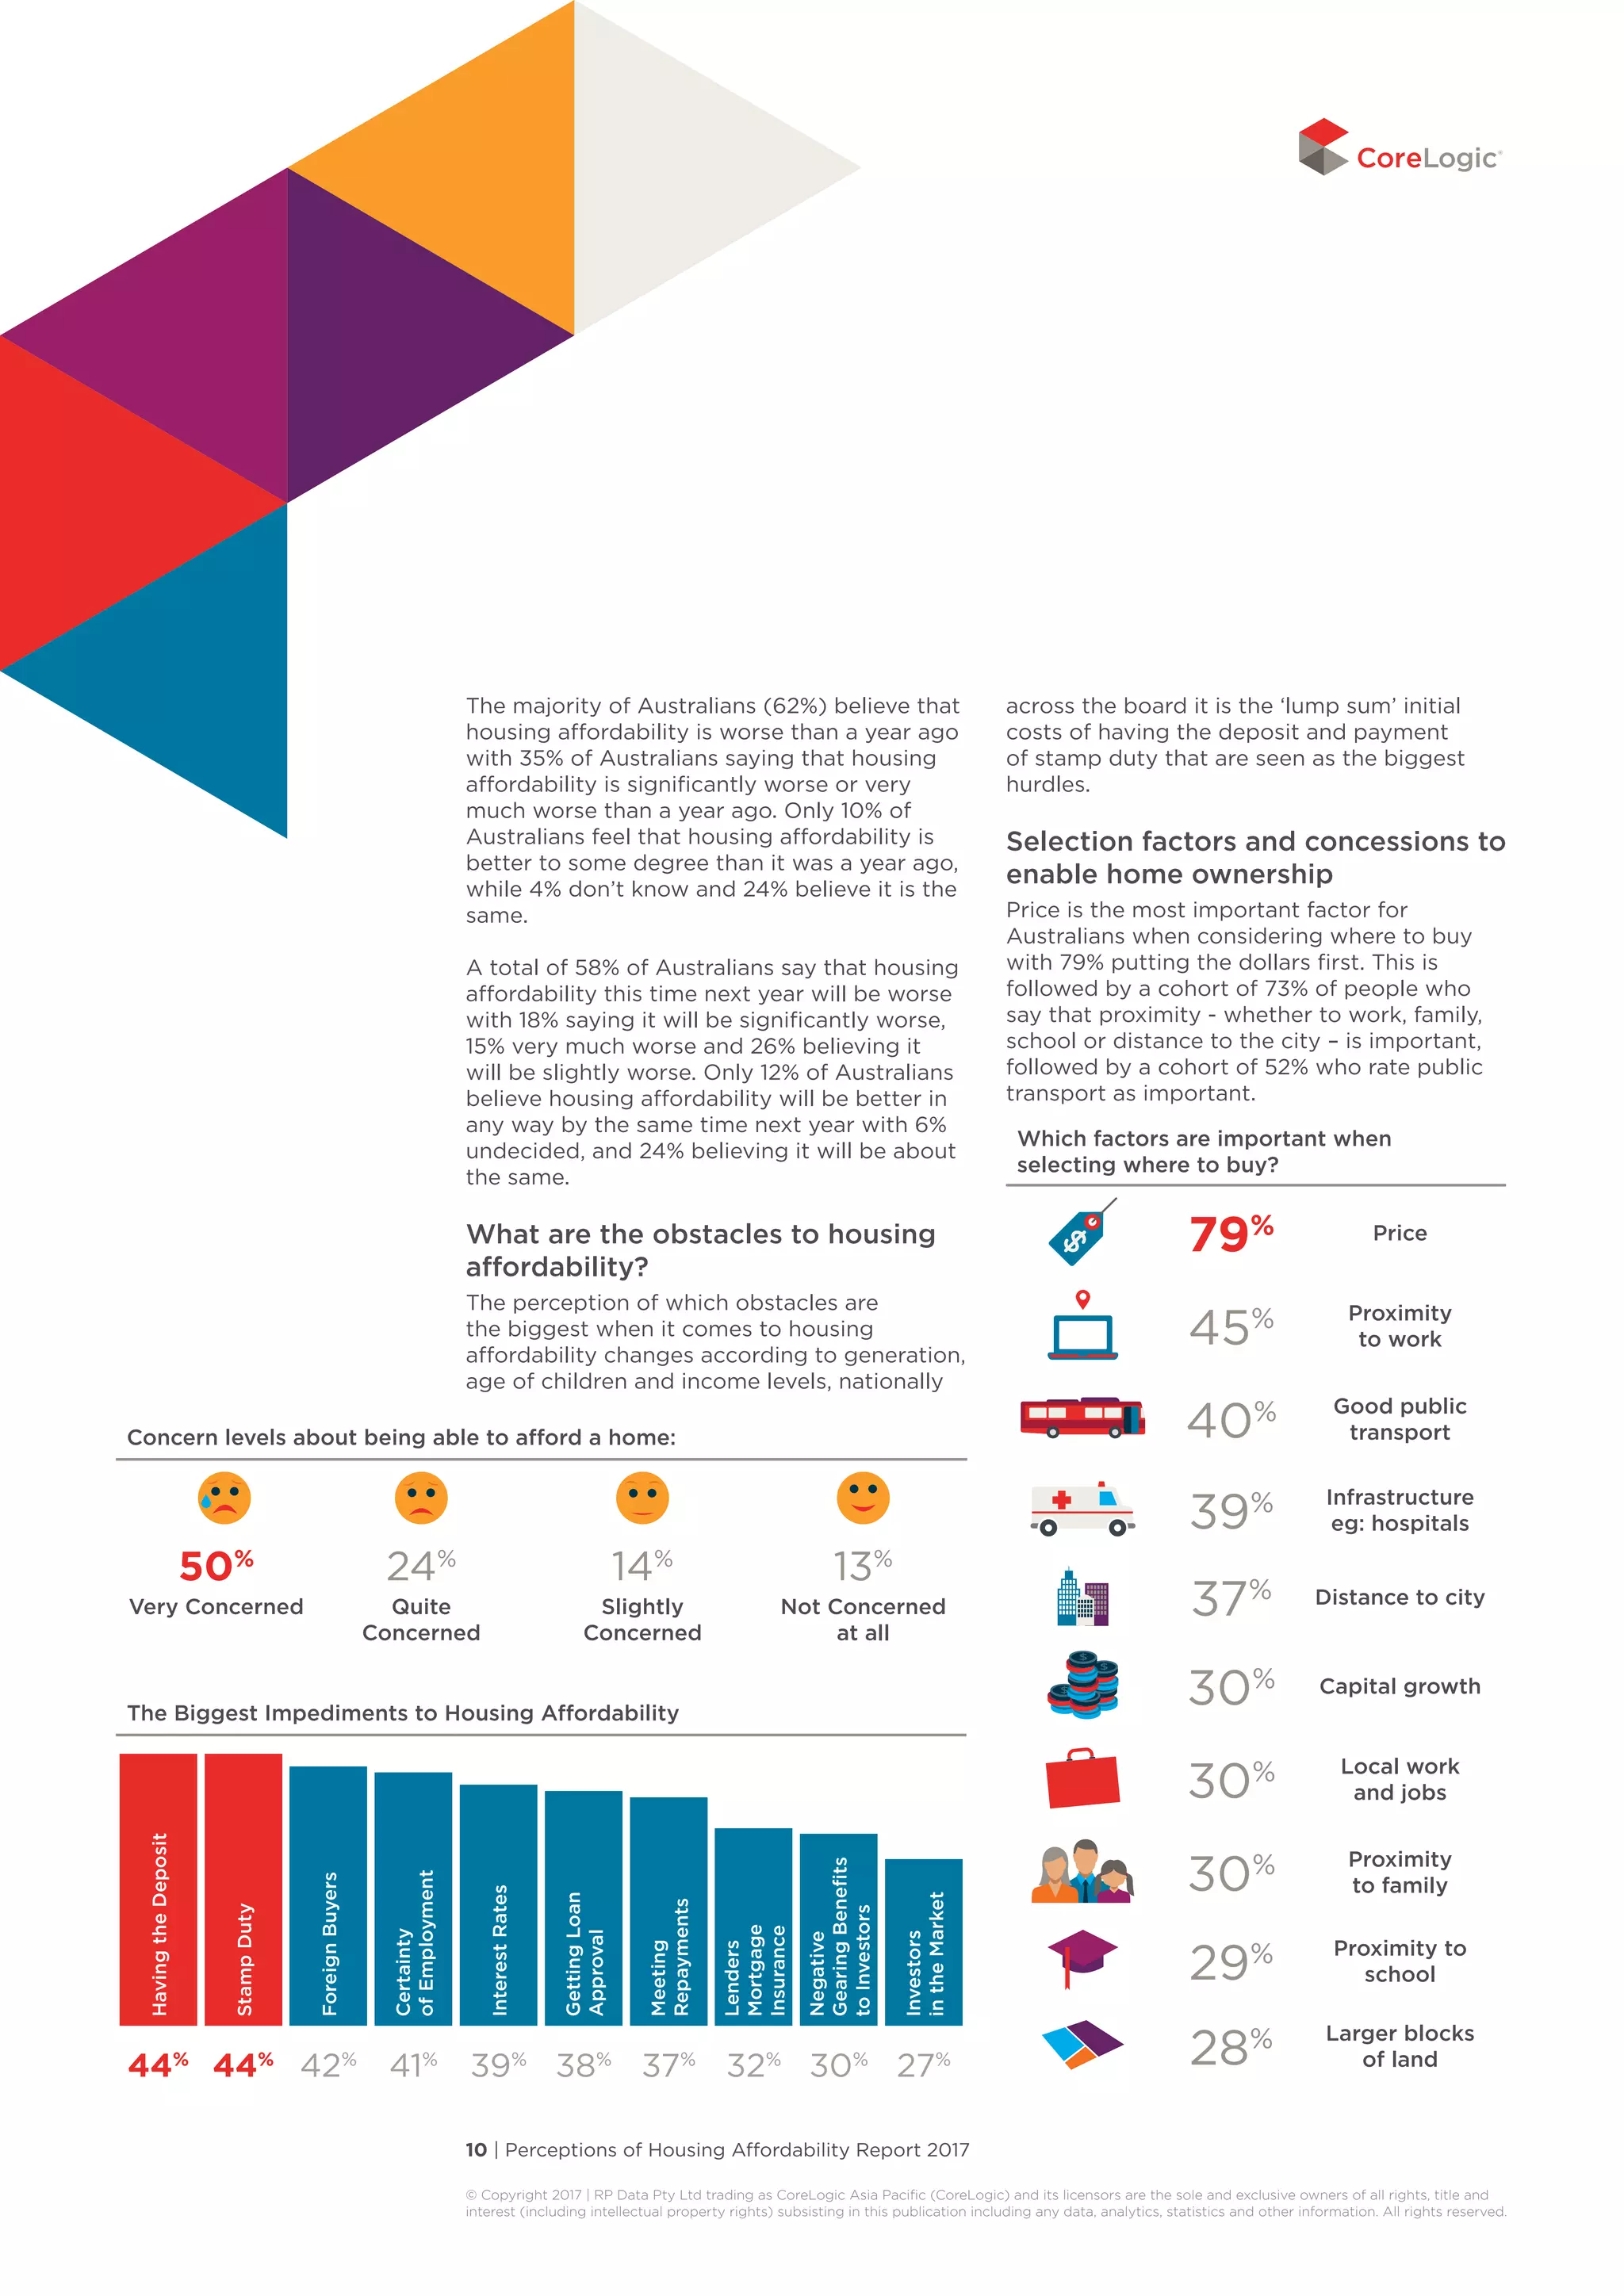
The majority of Australians (62%) believe that
housing affordability is worse than a year ago
with 35% of Australians saying that housing
affordability is significantly worse or very
much worse than a year ago. Only 10% of
Australians feel that housing affordability is
better to some degree than it was a year ago,
while 4% don’t know and 24% believe it is the
same.
A total of 58% of Australians say that housing
affordability this time next year will be worse
with 18% saying it will be significantly worse,
15% very much worse and 26% believing it
will be slightly worse. Only 12% of Australians
believe housing affordability will be better in
any way by the same time next year with 6%
undecided, and 24% believing it will be about
the same.
What are the obstacles to housing
affordability?
The perception of which obstacles are
the biggest when it comes to housing
affordability changes according to generation,
age of children and income levels, nationally
across the board it is the ‘lump sum’ initial
costs of having the deposit and payment
of stamp duty that are seen as the biggest
hurdles.
Selection factors and concessions to
enable home ownership
Price is the most important factor for
Australians when considering where to buy
with 79% putting the dollars first. This is
followed by a cohort of 73% of people who
say that proximity - whether to work, family,
school or distance to the city – is important,
followed by a cohort of 52% who rate public
transport as important.
Concern levels about being able to afford a home:
50%
Very Concerned
24%
Quite
Concerned
14%
Slightly
Concerned
13%
Not Concerned
at all
Which factors are important when
selecting where to buy?
79% Price
45% Proximity
to work
40% Good public
transport
39% Infrastructure
eg: hospitals
37% Distance to city
30% Capital growth
30% Local work
and jobs
30% Proximity
to family
29% Proximity to
school
28% Larger blocks
of land
The Biggest Impediments to Housing Affordability
44%
44%
42%
41%
39%
38%
37%
32%
30%
27%
HavingtheDeposit
StampDuty
ForeignBuyers
Certainty
ofEmployment
InterestRates
GettingLoan
Approval
Meeting
Repayments
Lenders
Mortgage
Insurance
Negative
GearingBenefits
toInvestors
Investors
intheMarket
Perceptions of Housing Affordability Report 2017 | 11
© Copyright 2017 | RP Data Pty Ltd trading as CoreLogic Asia Pacific (CoreLogic) and its licensors are the sole and exclusive owners of all rights, title and
interest (including intellectual property rights) subsisting in this publication including any data, analytics, statistics and other information. All rights reserved.
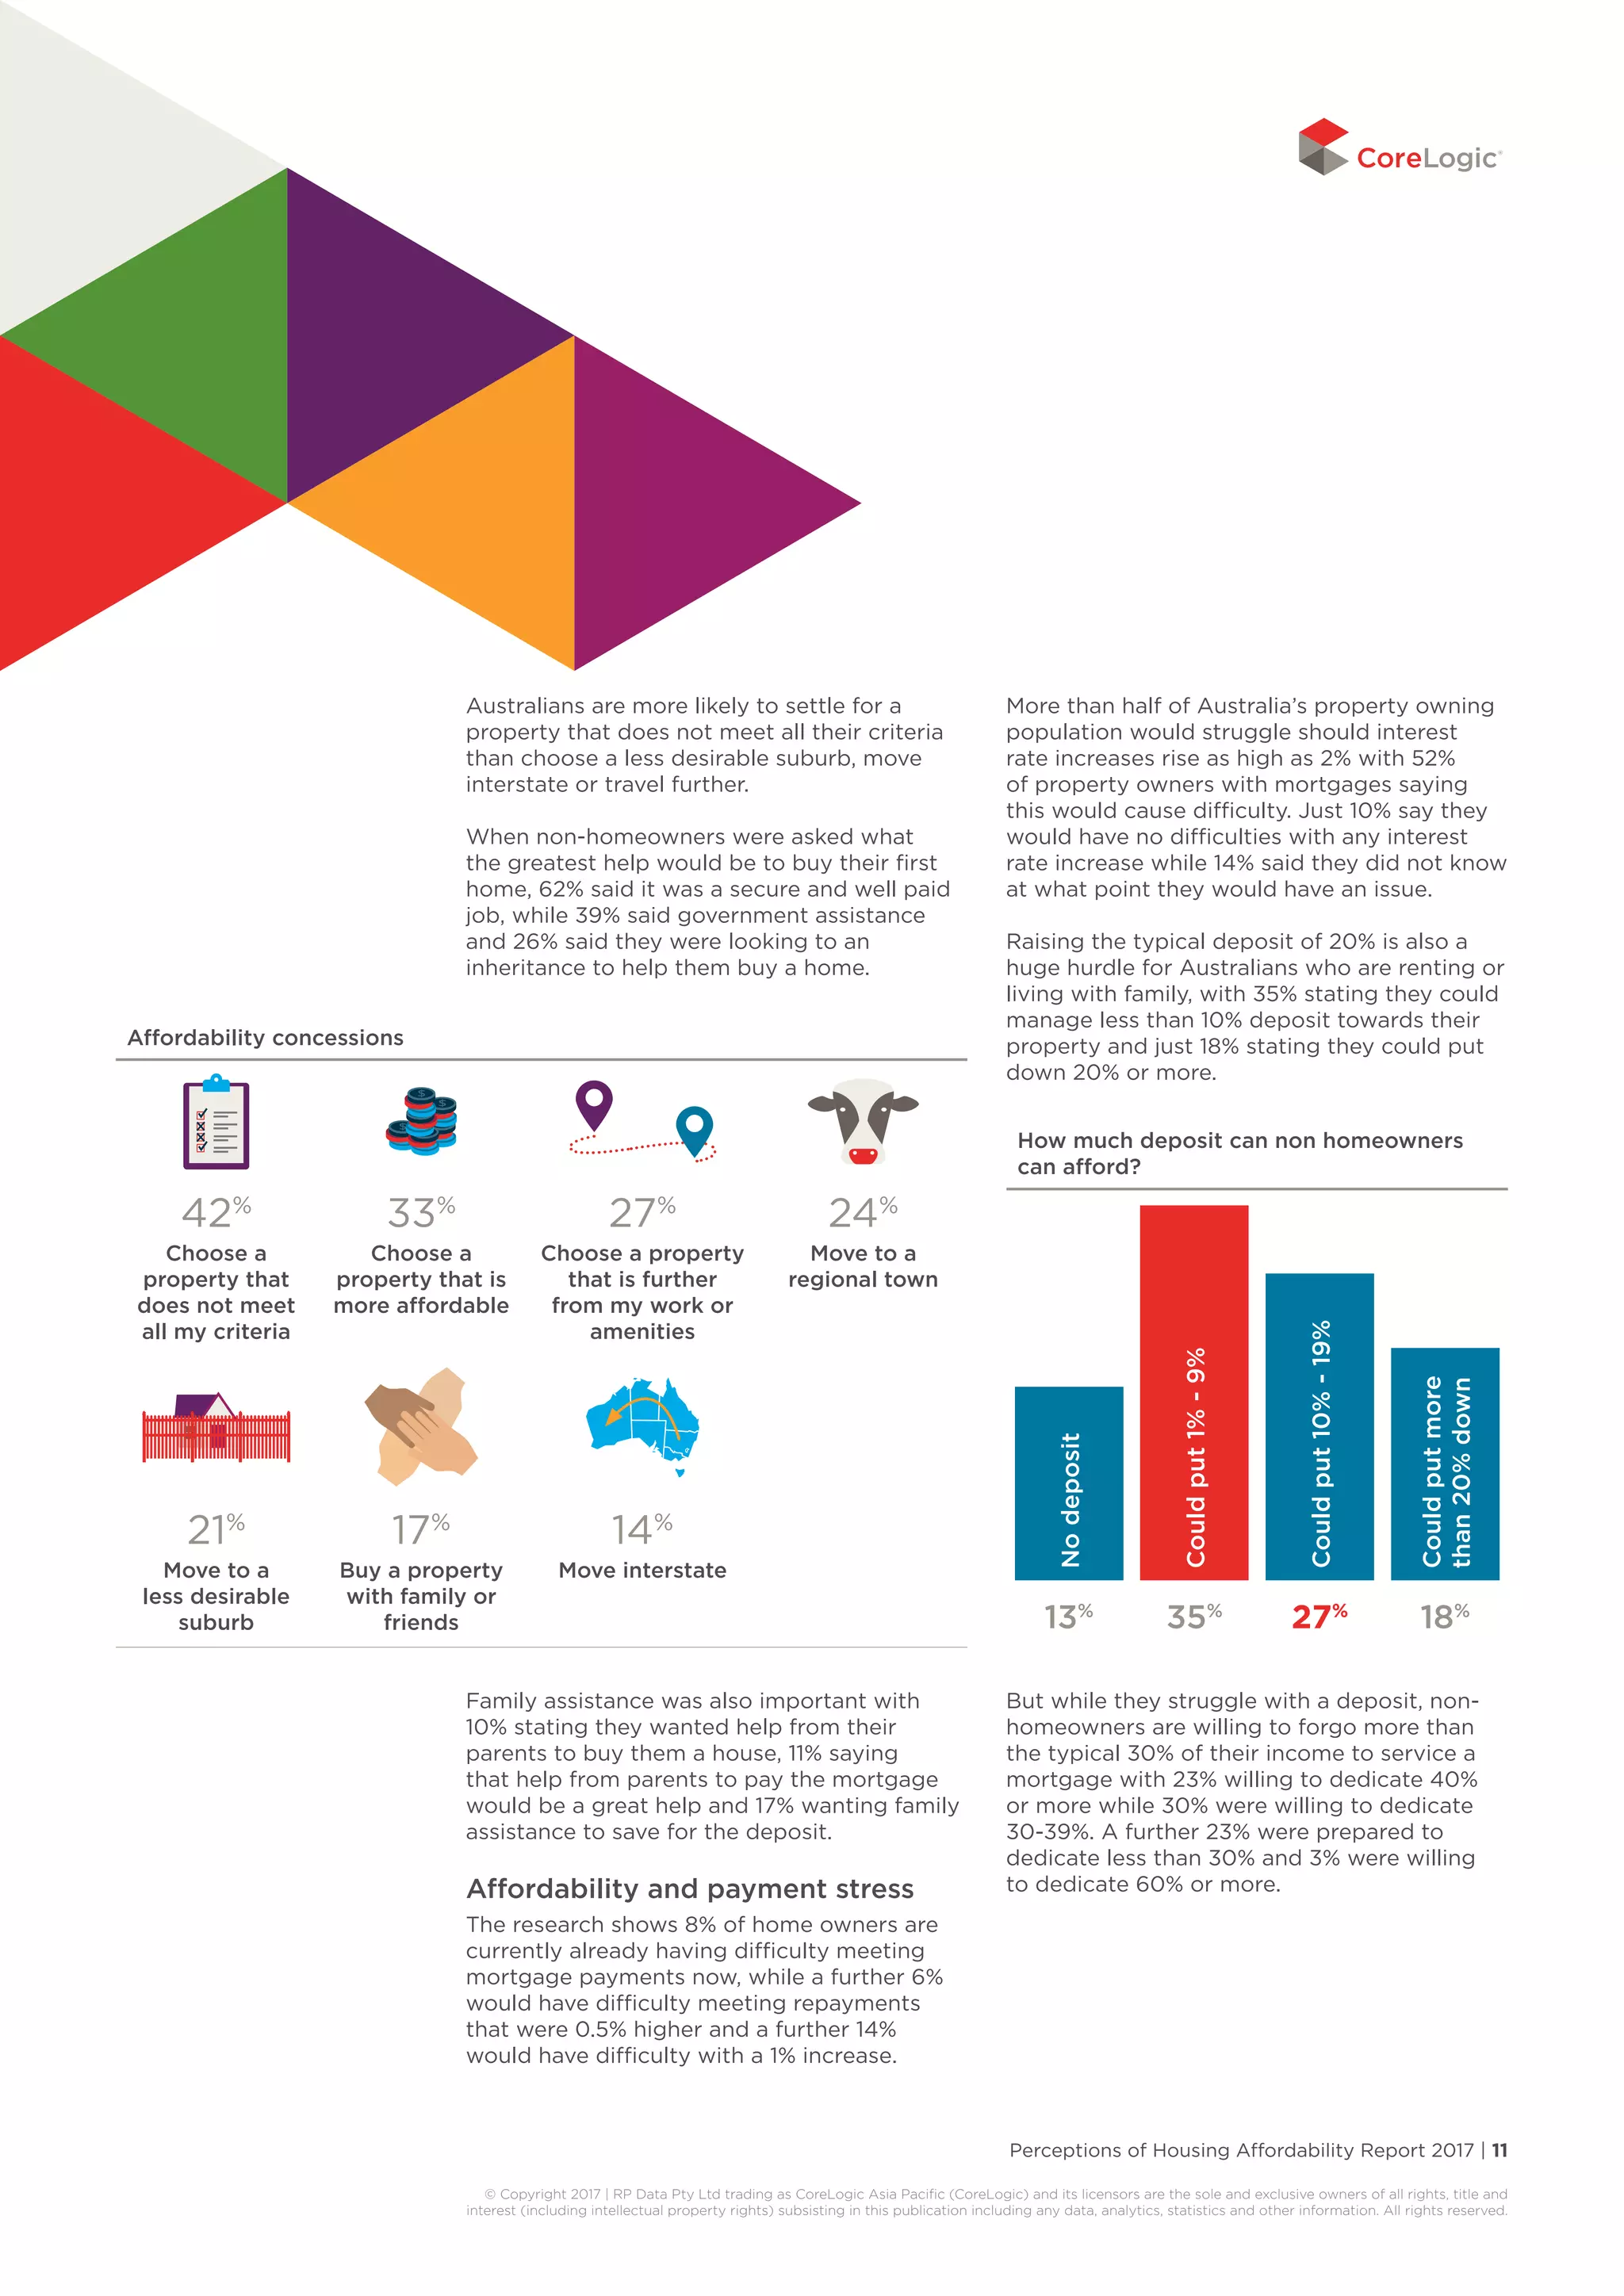
Australians are more likely to settle for a
property that does not meet all their criteria
than choose a less desirable suburb, move
interstate or travel further.
When non-homeowners were asked what
the greatest help would be to buy their first
home, 62% said it was a secure and well paid
job, while 39% said government assistance
and 26% said they were looking to an
inheritance to help them buy a home.
Family assistance was also important with
10% stating they wanted help from their
parents to buy them a house, 11% saying
that help from parents to pay the mortgage
would be a great help and 17% wanting family
assistance to save for the deposit.
Affordability and payment stress
The research shows 8% of home owners are
currently already having difficulty meeting
mortgage payments now, while a further 6%
would have difficulty meeting repayments
that were 0.5% higher and a further 14%
would have difficulty with a 1% increase.
More than half of Australia’s property owning
population would struggle should interest
rate increases rise as high as 2% with 52%
of property owners with mortgages saying
this would cause difficulty. Just 10% say they
would have no difficulties with any interest
rate increase while 14% said they did not know
at what point they would have an issue.
Raising the typical deposit of 20% is also a
huge hurdle for Australians who are renting or
living with family, with 35% stating they could
manage less than 10% deposit towards their
property and just 18% stating they could put
down 20% or more.
But while they struggle with a deposit, non-
homeowners are willing to forgo more than
the typical 30% of their income to service a
mortgage with 23% willing to dedicate 40%
or more while 30% were willing to dedicate
30-39%. A further 23% were prepared to
dedicate less than 30% and 3% were willing
to dedicate 60% or more.
Affordability concessions
42%
Choose a
property that
does not meet
all my criteria
33%
Choose a
property that is
more affordable
27%
Choose a property
that is further
from my work or
amenities
24%
Move to a
regional town
21%
Move to a
less desirable
suburb
17%
Buy a property
with family or
friends
14%
Move interstate
How much deposit can non homeowners
can afford?
13%
35%
27%
18%
Nodeposit
Couldput1%-9%
Couldput10%-19%
Couldputmore
than20%down
12 | Perceptions of Housing Affordability Report 2017
© Copyright 2017 | RP Data Pty Ltd trading as CoreLogic Asia Pacific (CoreLogic) and its licensors are the sole and exclusive owners of all rights, title and
interest (including intellectual property rights) subsisting in this publication including any data, analytics, statistics and other information. All rights reserved. 
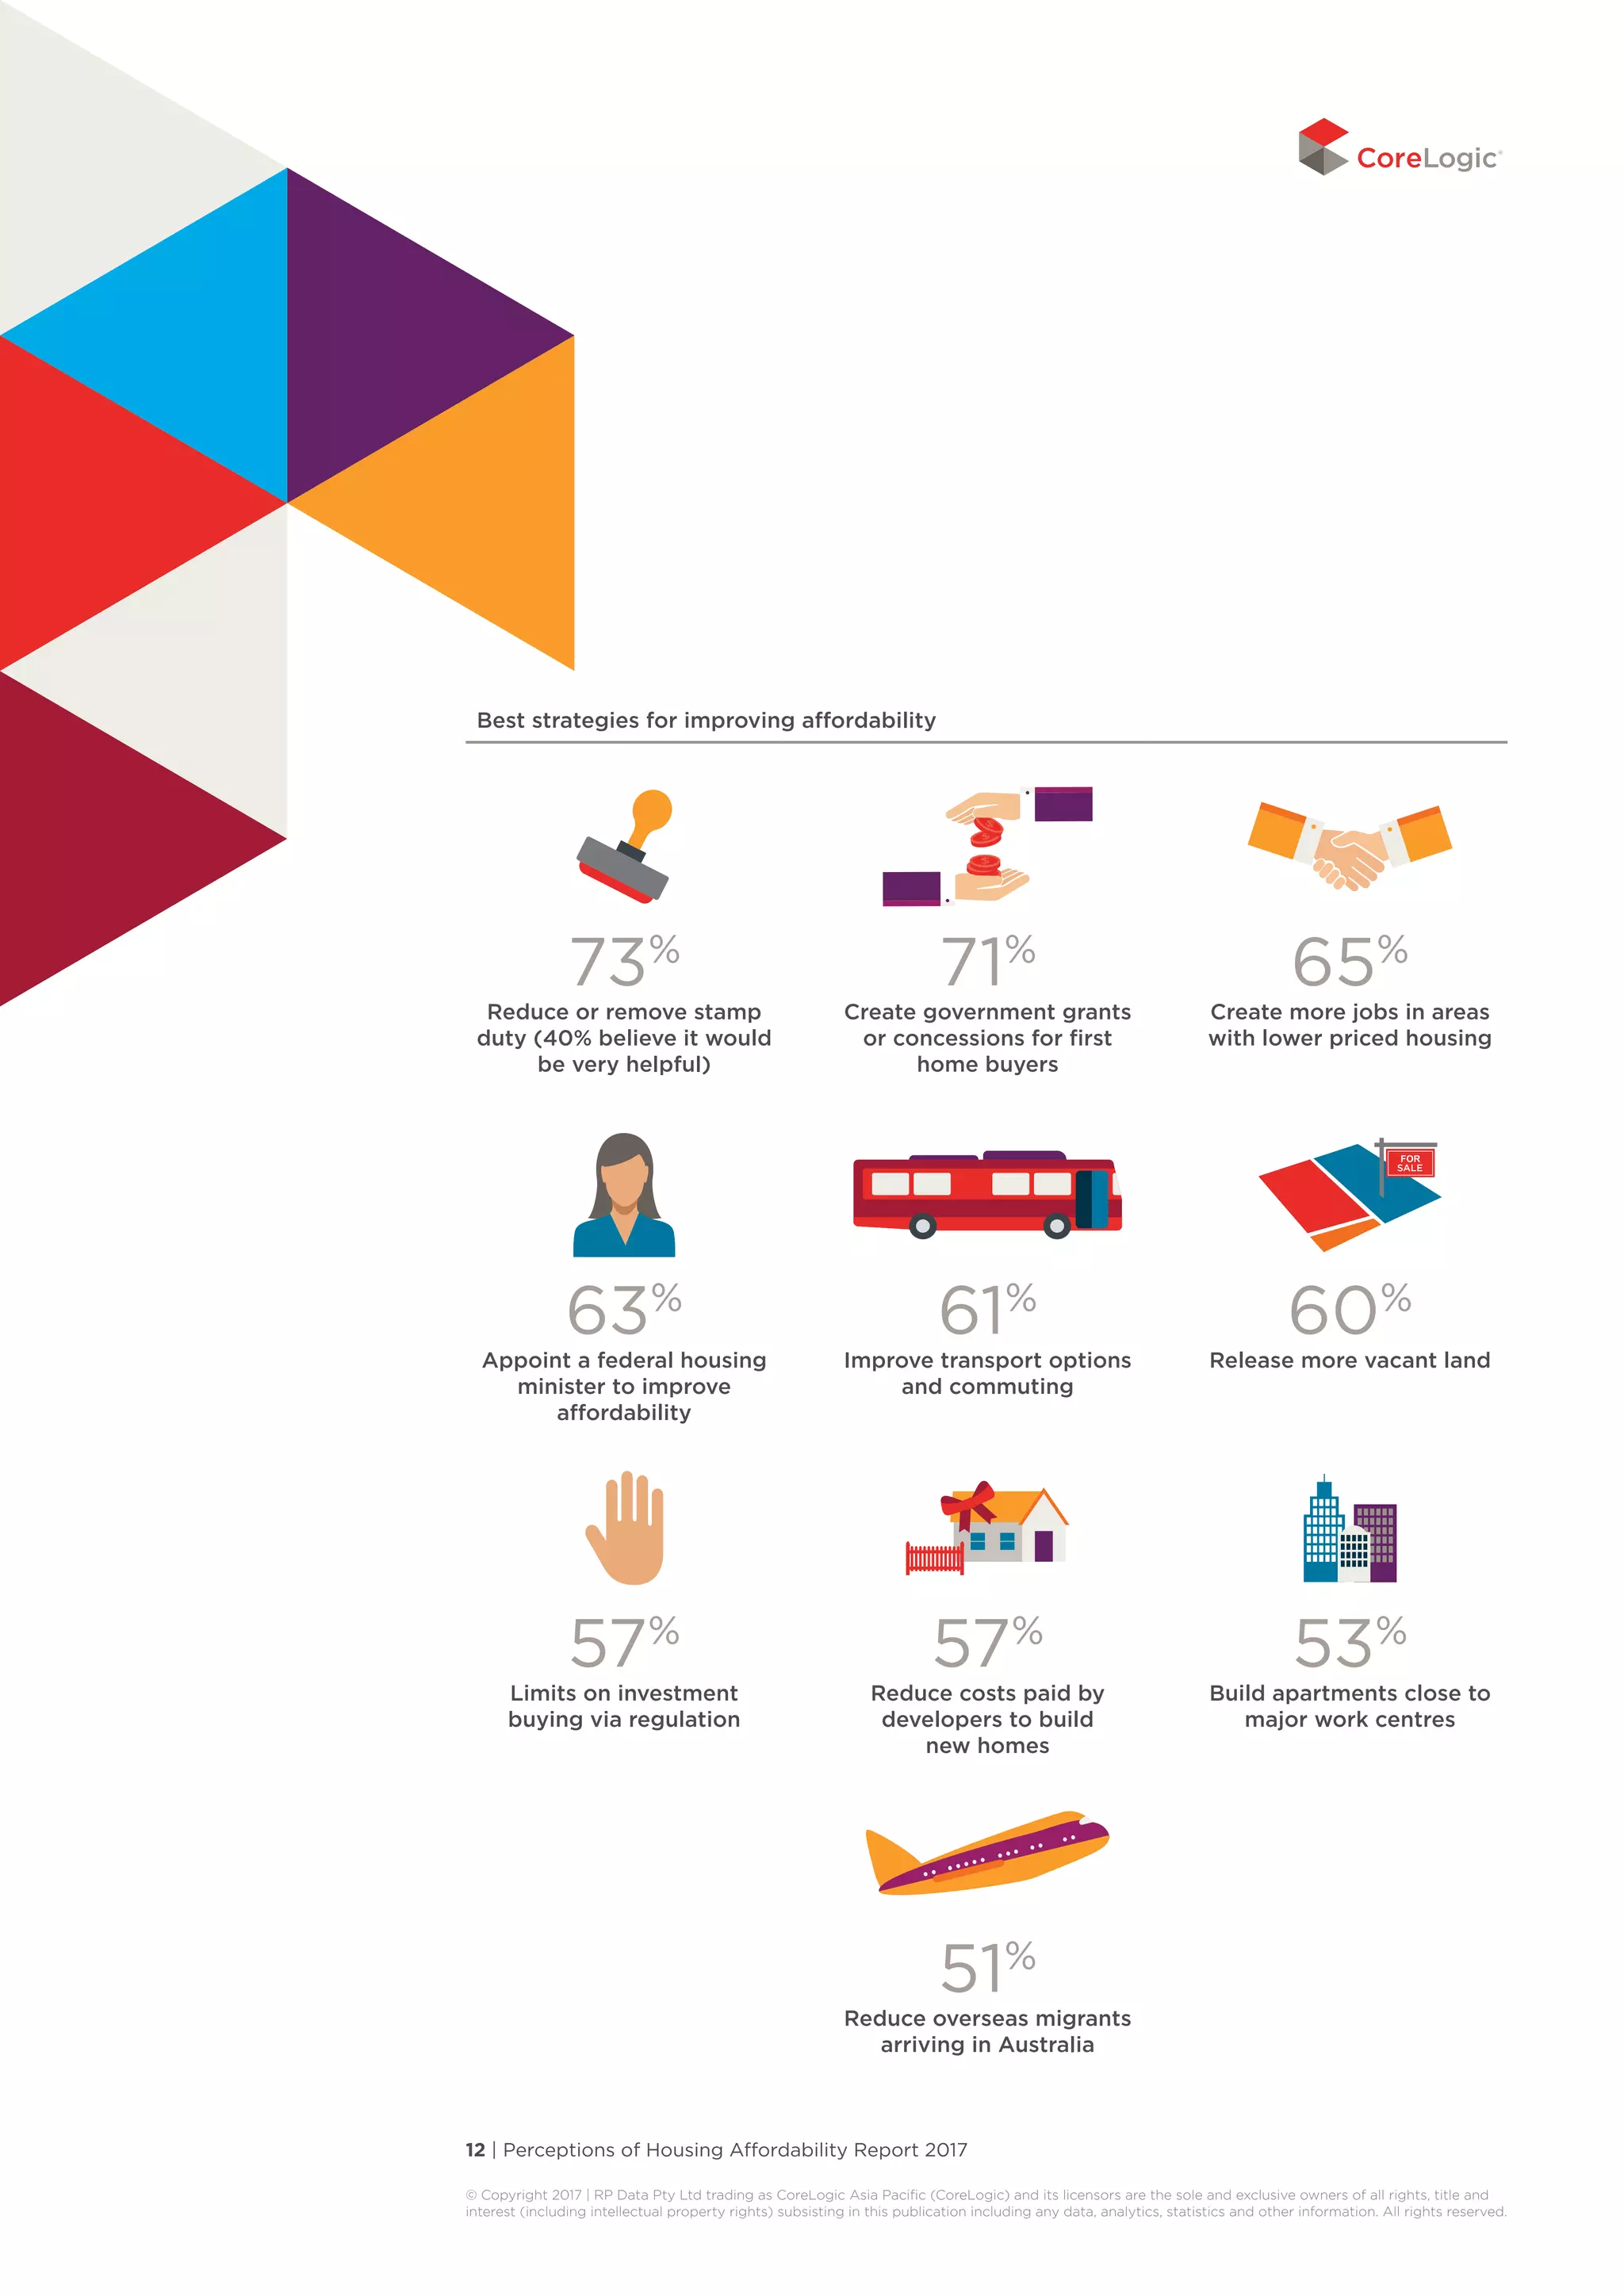
Best strategies for improving affordability
73%
Reduce or remove stamp
duty (40% believe it would
be very helpful)
71%
Create government grants
or concessions for first
home buyers
65%
Create more jobs in areas
with lower priced housing
63%
Appoint a federal housing
minister to improve
affordability
61%
Improve transport options
and commuting
60%
Release more vacant land
57%
Limits on investment
buying via regulation
57%
Reduce costs paid by
developers to build
new homes
53%
Build apartments close to
major work centres
51%
Reduce overseas migrants
arriving in Australia
Perceptions of Housing Affordability Report 2017 | 13
© Copyright 2017 | RP Data Pty Ltd trading as CoreLogic Asia Pacific (CoreLogic) and its licensors are the sole and exclusive owners of all rights, title and
interest (including intellectual property rights) subsisting in this publication including any data, analytics, statistics and other information. All rights reserved.
14 | Perceptions of Housing Affordability Report 2017
© Copyright 2017 | RP Data Pty Ltd trading as CoreLogic Asia Pacific (CoreLogic) and its licensors are the sole and exclusive owners of all rights, title and
interest (including intellectual property rights) subsisting in this publication including any data, analytics, statistics and other information. All rights reserved. 
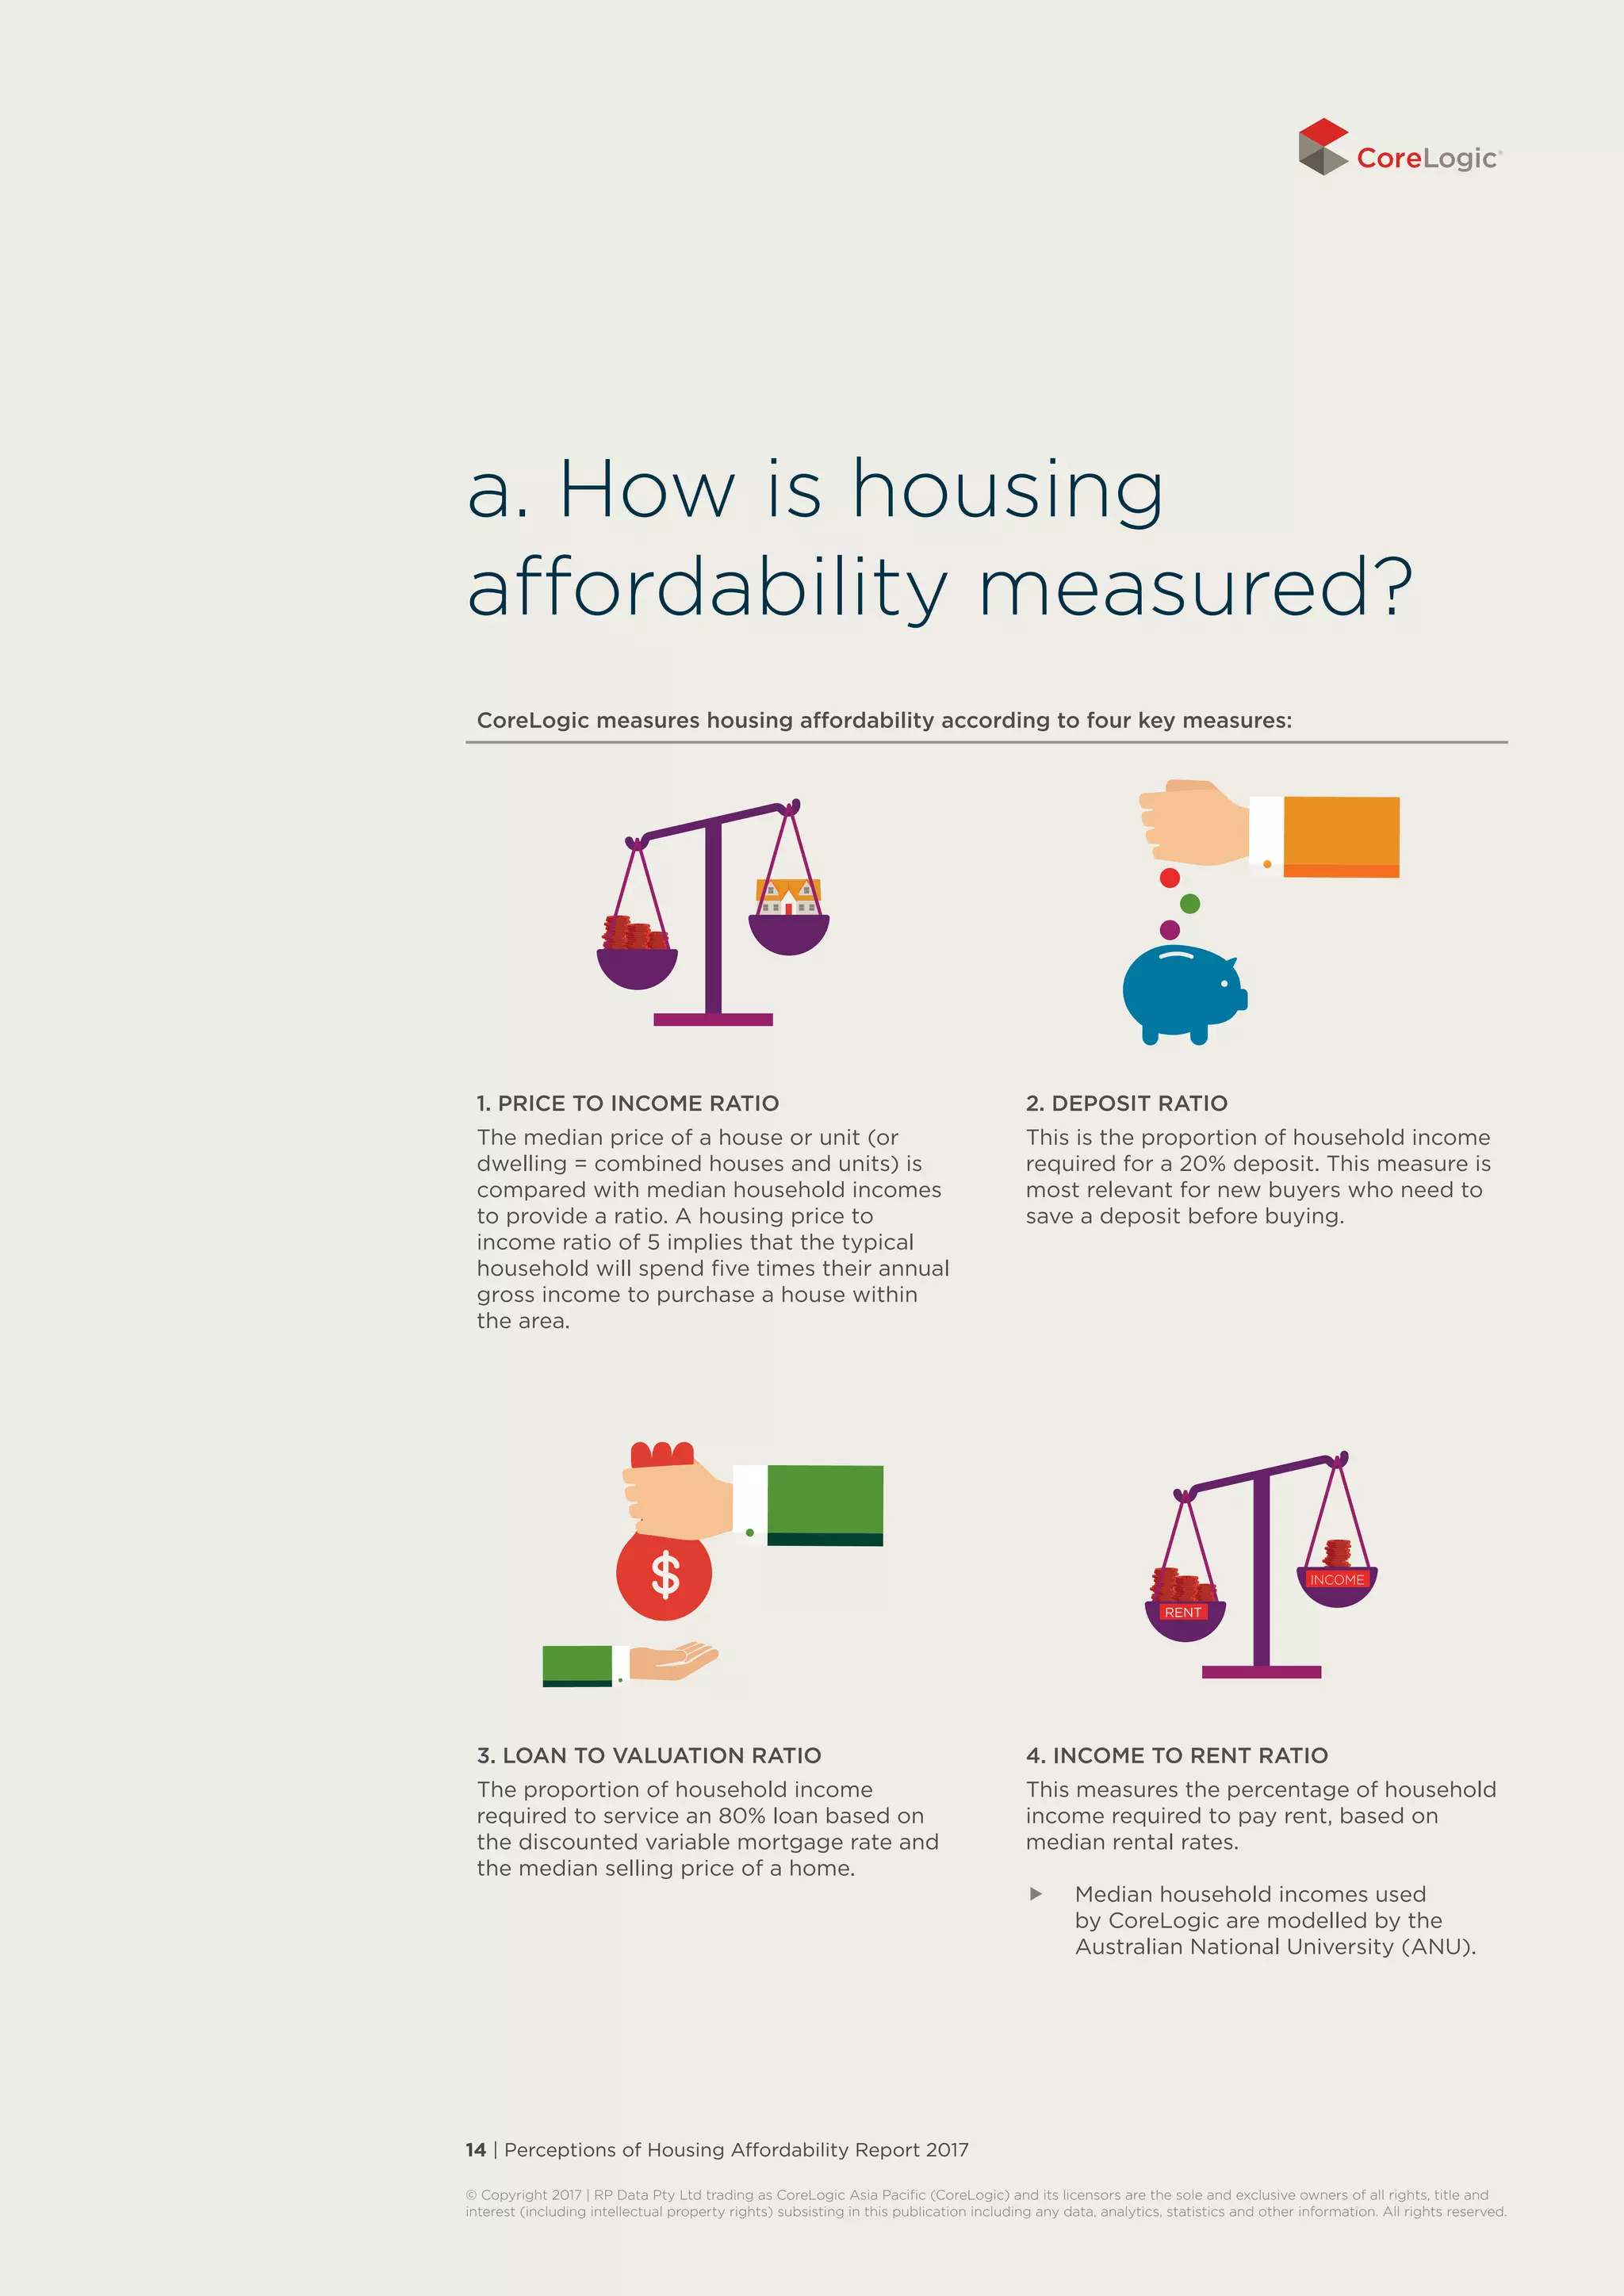
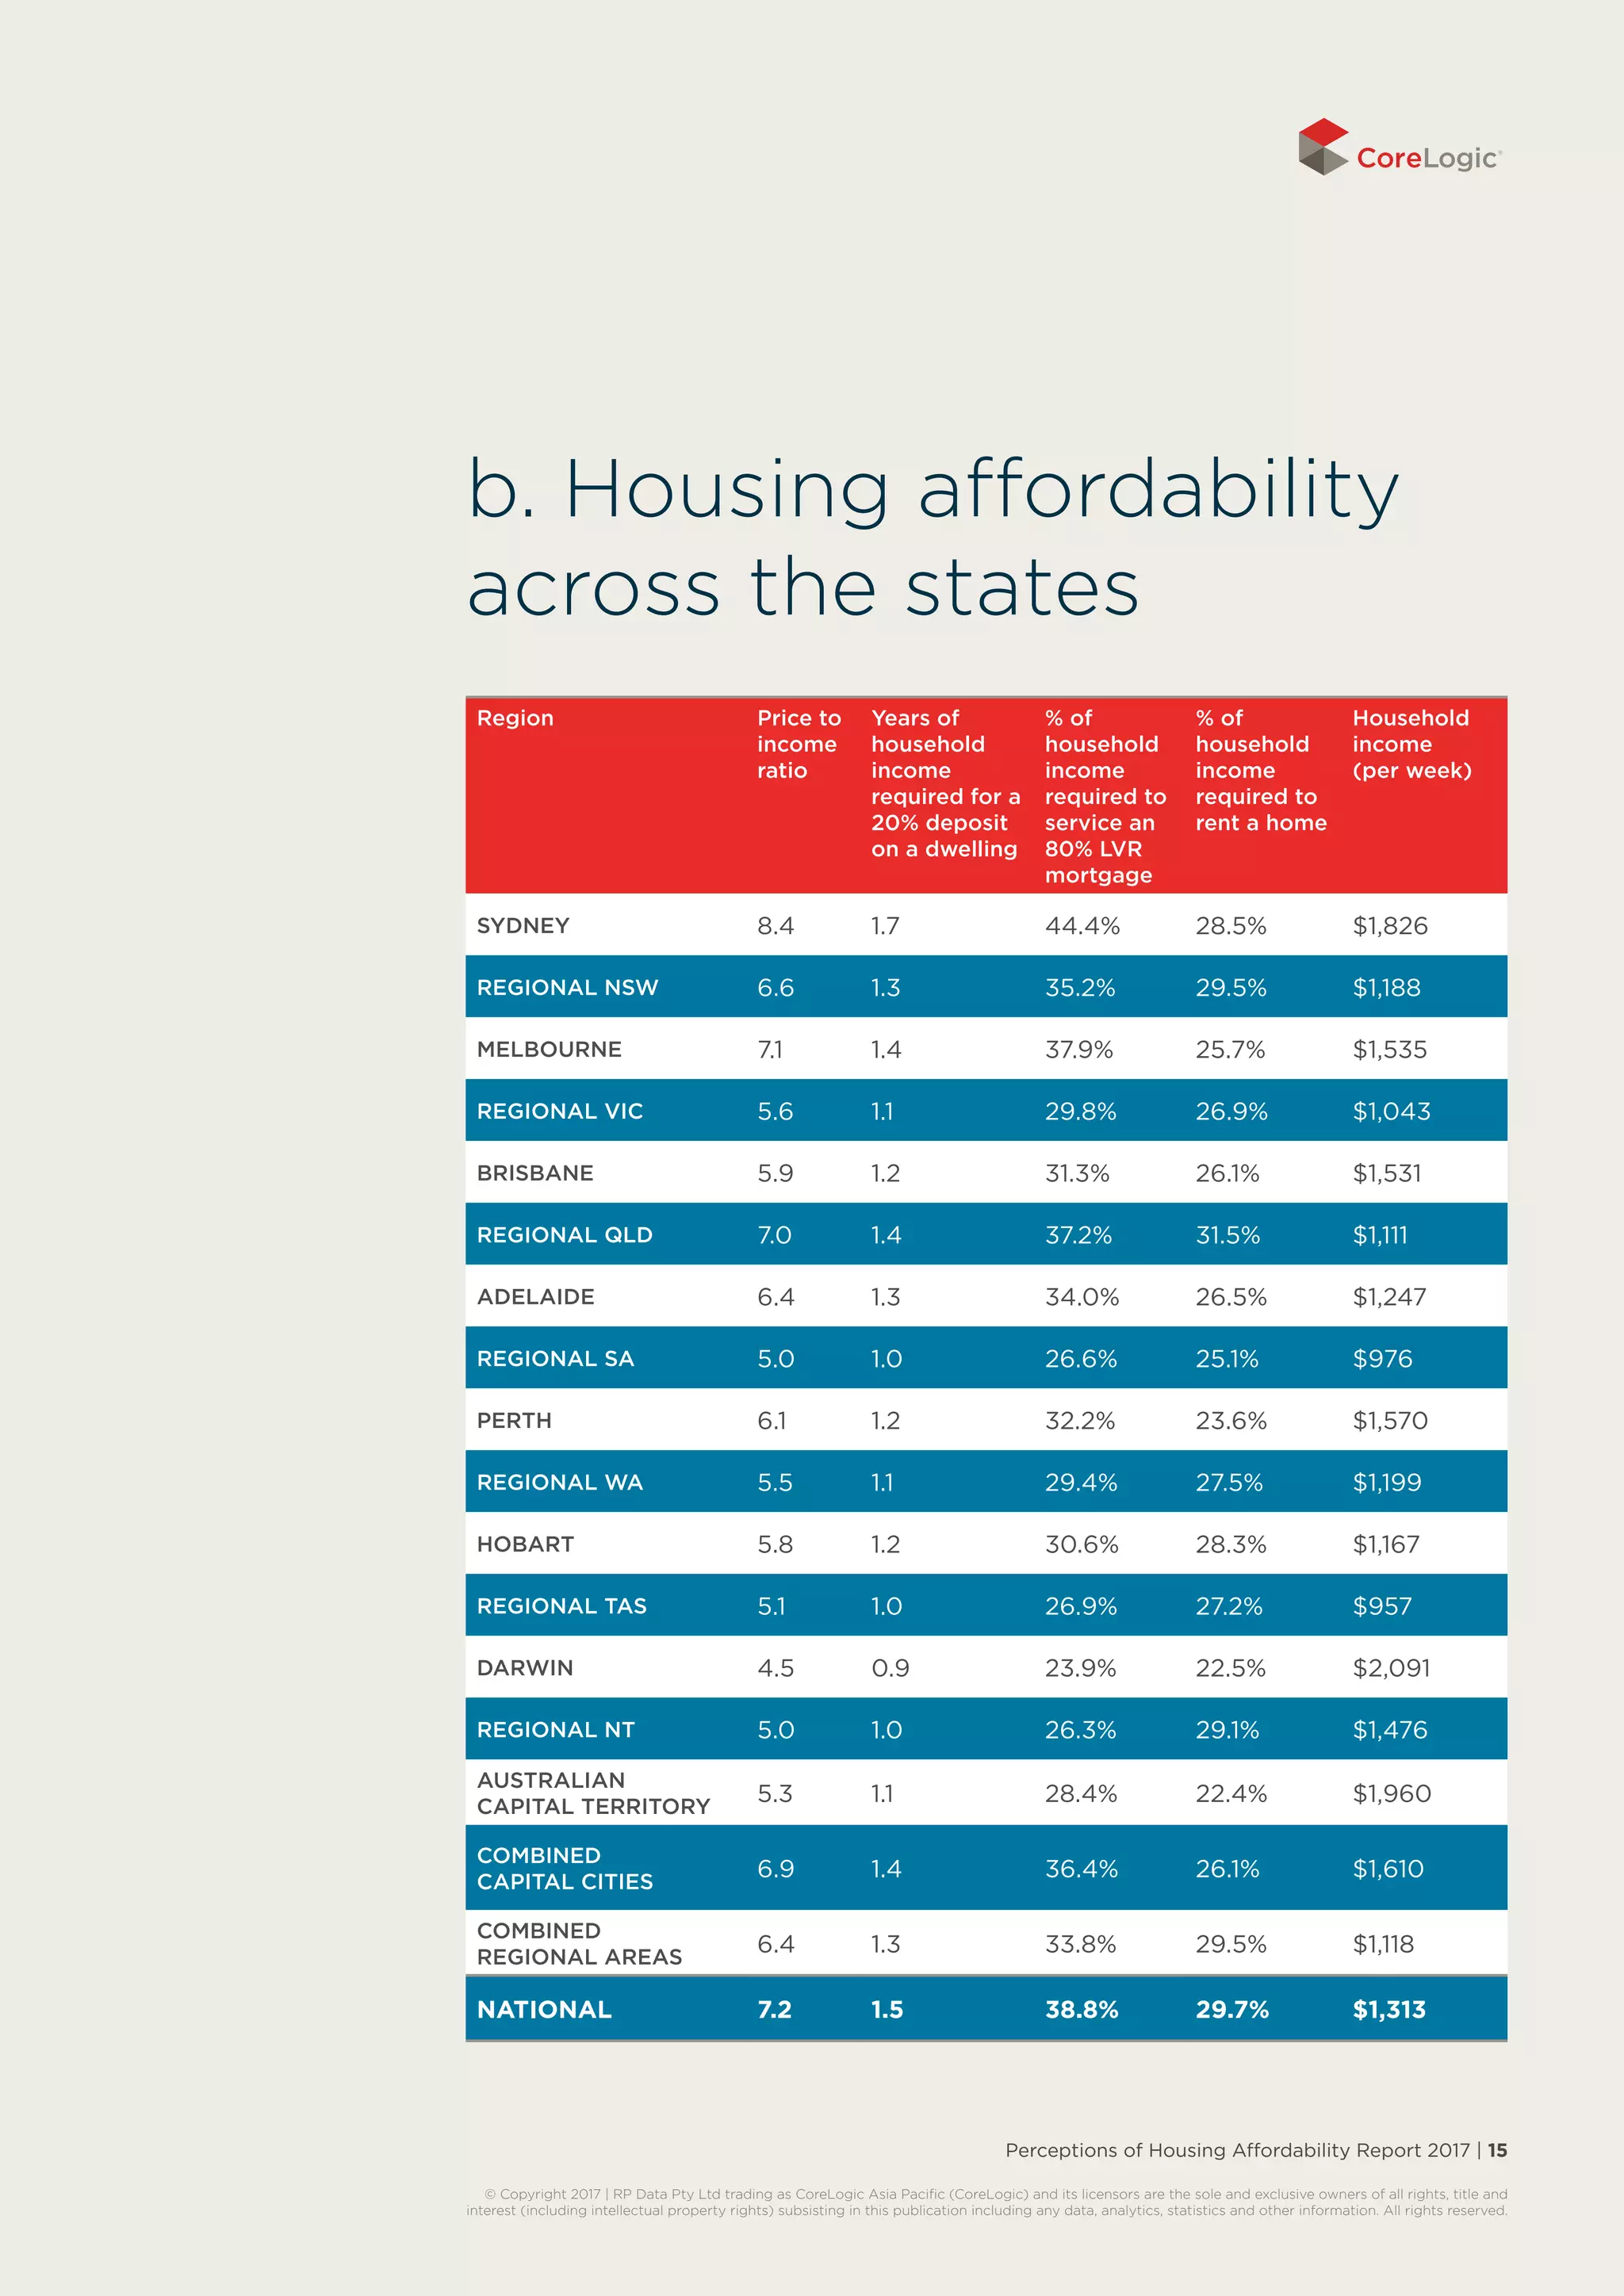
a. How is housing
affordability measured?
CoreLogic measures housing affordability according to four key measures:
1. PRICE TO INCOME RATIO
The median price of a house or unit (or
dwelling = combined houses and units) is
compared with median household incomes
to provide a ratio. A housing price to
income ratio of 5 implies that the typical
household will spend five times their annual
gross income to purchase a house within
the area.
2. DEPOSIT RATIO
This is the proportion of household income
required for a 20% deposit. This measure is
most relevant for new buyers who need to
save a deposit before buying.
3. LOAN TO VALUATION RATIO
The proportion of household income
required to service an 80% loan based on
the discounted variable mortgage rate and
the median selling price of a home.
4. INCOME TO RENT RATIO
This measures the percentage of household
income required to pay rent, based on
median rental rates.
ff Median household incomes used
by CoreLogic are modelled by the
Australian National University (ANU).
Perceptions of Housing Affordability Report 2017 | 15
© Copyright 2017 | RP Data Pty Ltd trading as CoreLogic Asia Pacific (CoreLogic) and its licensors are the sole and exclusive owners of all rights, title and
interest (including intellectual property rights) subsisting in this publication including any data, analytics, statistics and other information. All rights reserved.
b. Housing affordability
across the states
Region Price to
income
ratio
Years of
household
income
required for a
20% deposit
on a dwelling
% of
household
income
required to
service an
80% LVR
mortgage
% of
household
income
required to
rent a home
Household
income
(per week)
SYDNEY 8.4 1.7 44.4% 28.5% $1,826
REGIONAL NSW 6.6 1.3 35.2% 29.5% $1,188
MELBOURNE 7.1 1.4 37.9% 25.7% $1,535
REGIONAL VIC 5.6 1.1 29.8% 26.9% $1,043
BRISBANE 5.9 1.2 31.3% 26.1% $1,531
REGIONAL QLD 7.0 1.4 37.2% 31.5% $1,111
ADELAIDE 6.4 1.3 34.0% 26.5% $1,247
REGIONAL SA 5.0 1.0 26.6% 25.1% $976
PERTH 6.1 1.2 32.2% 23.6% $1,570
REGIONAL WA 5.5 1.1 29.4% 27.5% $1,199
HOBART 5.8 1.2 30.6% 28.3% $1,167
REGIONAL TAS 5.1 1.0 26.9% 27.2% $957
DARWIN 4.5 0.9 23.9% 22.5% $2,091
REGIONAL NT 5.0 1.0 26.3% 29.1% $1,476
AUSTRALIAN
CAPITAL TERRITORY
5.3 1.1 28.4% 22.4% $1,960
COMBINED
CAPITAL CITIES
6.9 1.4 36.4% 26.1% $1,610
COMBINED
REGIONAL AREAS
6.4 1.3 33.8% 29.5% $1,118
NATIONAL 7.2 1.5 38.8% 29.7% $1,313
16 | Perceptions of Housing Affordability Report 2017
© Copyright 2017 | RP Data Pty Ltd trading as CoreLogic Asia Pacific (CoreLogic) and its licensors are the sole and exclusive owners of all rights, title and
interest (including intellectual property rights) subsisting in this publication including any data, analytics, statistics and other information. All rights reserved. 
State-based attitudes to
housing affordability
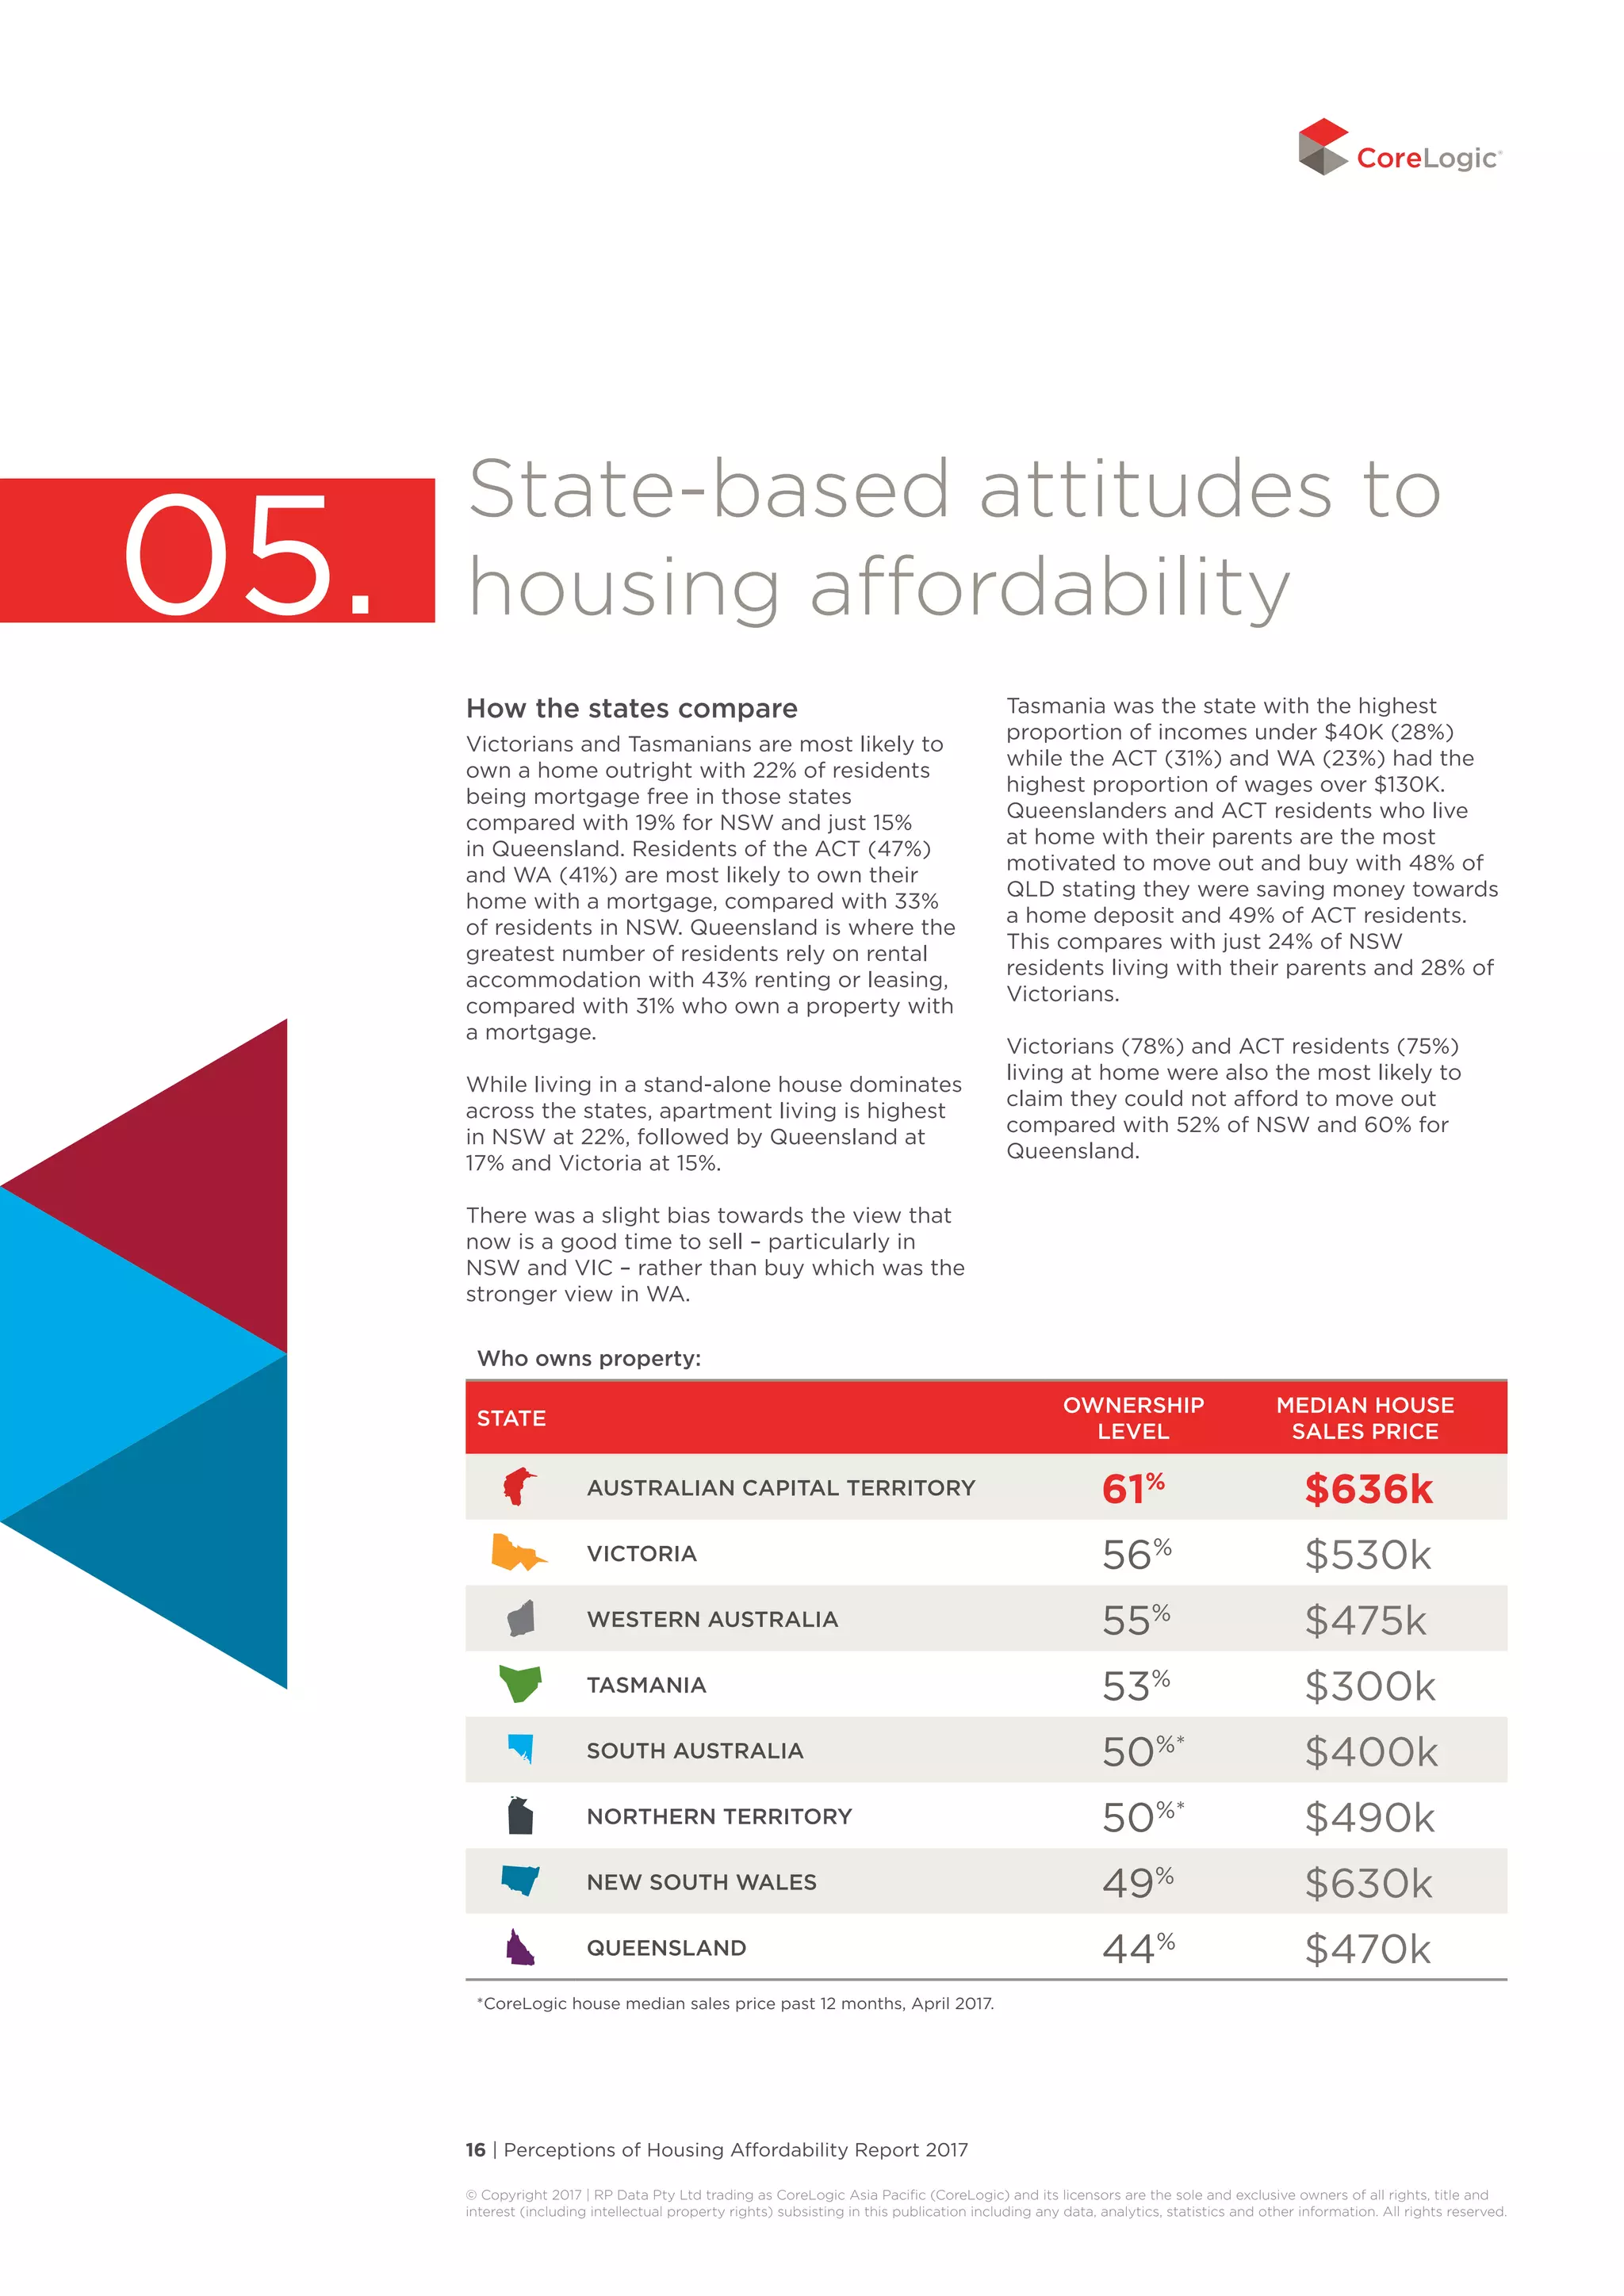
How the states compare
Victorians and Tasmanians are most likely to
own a home outright with 22% of residents
being mortgage free in those states
compared with 19% for NSW and just 15%
in Queensland. Residents of the ACT (47%)
and WA (41%) are most likely to own their
home with a mortgage, compared with 33%
of residents in NSW. Queensland is where the
greatest number of residents rely on rental
accommodation with 43% renting or leasing,
compared with 31% who own a property with
a mortgage.
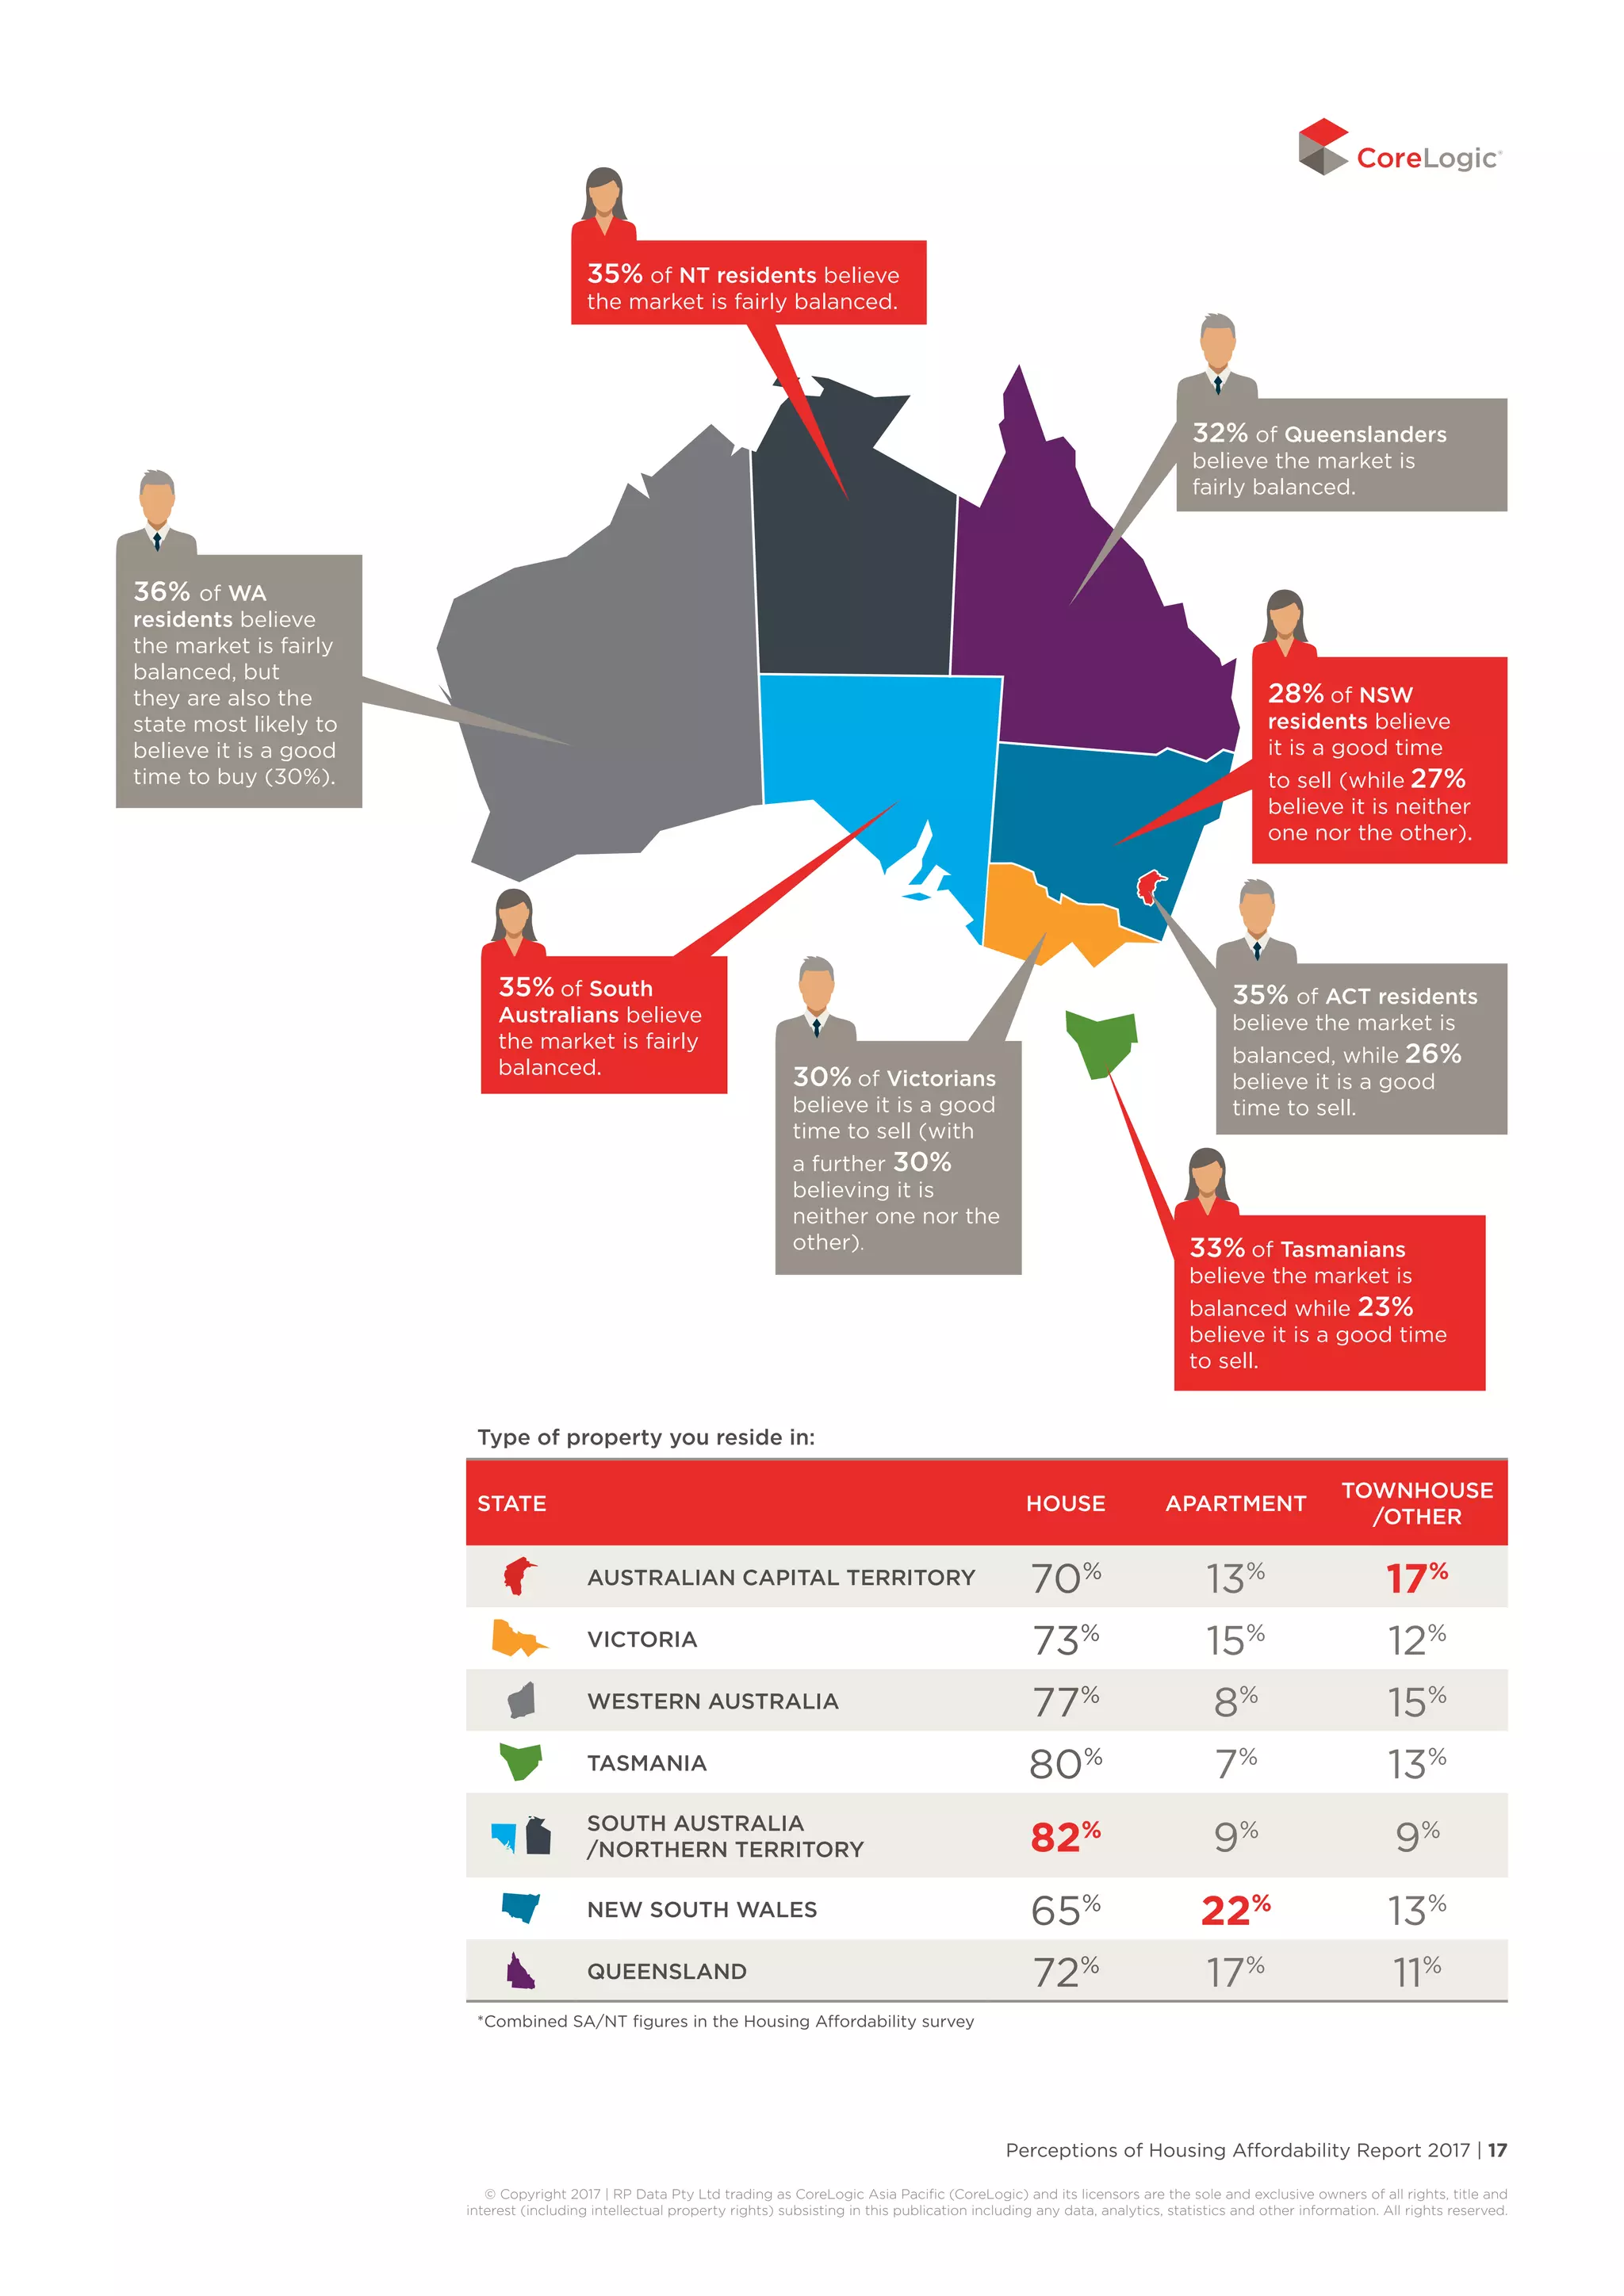
While living in a stand-alone house dominates
across the states, apartment living is highest
in NSW at 22%, followed by Queensland at
17% and Victoria at 15%.
There was a slight bias towards the view that
now is a good time to sell – particularly in
NSW and VIC – rather than buy which was the
stronger view in WA.
Tasmania was the state with the highest
proportion of incomes under $40K (28%)
while the ACT (31%) and WA (23%) had the
highest proportion of wages over $130K.
Queenslanders and ACT residents who live
at home with their parents are the most
motivated to move out and buy with 48% of
QLD stating they were saving money towards
a home deposit and 49% of ACT residents.
This compares with just 24% of NSW
residents living with their parents and 28% of
Victorians.
Victorians (78%) and ACT residents (75%)
living at home were also the most likely to
claim they could not afford to move out
compared with 52% of NSW and 60% for
Queensland.
Who owns property:
STATE
OWNERSHIP
LEVEL
MEDIAN HOUSE
SALES PRICE
AUSTRALIAN CAPITAL TERRITORY 61%
$636k
VICTORIA 56%
$530k
WESTERN AUSTRALIA 55%
$475k
TASMANIA 53%
$300k
SOUTH AUSTRALIA 50%*
$400k
NORTHERN TERRITORY 50%*
$490k
NEW SOUTH WALES 49%
$630k
QUEENSLAND 44%
$470k
*CoreLogic house median sales price past 12 months, April 2017.
05.
Perceptions of Housing Affordability Report 2017 | 17
© Copyright 2017 | RP Data Pty Ltd trading as CoreLogic Asia Pacific (CoreLogic) and its licensors are the sole and exclusive owners of all rights, title and
interest (including intellectual property rights) subsisting in this publication including any data, analytics, statistics and other information. All rights reserved.
28% of NSW
residents believe
it is a good time
to sell (while 27%
believe it is neither
one nor the other).
30% of Victorians
believe it is a good
time to sell (with
a further 30%
believing it is
neither one nor the
other). 33% of Tasmanians
believe the market is
balanced while 23%
believe it is a good time
to sell.
35% of South
Australians believe
the market is fairly
balanced.
35% of NT residents believe
the market is fairly balanced.
36% of WA
residents believe
the market is fairly
balanced, but
they are also the
state most likely to
believe it is a good
time to buy (30%).
32% of Queenslanders
believe the market is
fairly balanced.
35% of ACT residents
believe the market is
balanced, while 26%
believe it is a good
time to sell.
Type of property you reside in:
STATE HOUSE APARTMENT
TOWNHOUSE
/OTHER
AUSTRALIAN CAPITAL TERRITORY 70%
13%
17%
VICTORIA 73%
15%
12%
WESTERN AUSTRALIA 77%
8%
15%
TASMANIA 80%
7%
13%
SOUTH AUSTRALIA
/NORTHERN TERRITORY 82%
9%
9%
NEW SOUTH WALES 65%
22%
13%
QUEENSLAND 72%
17%
11%
*Combined SA/NT figures in the Housing Affordability survey
18 | Perceptions of Housing Affordability Report 2017
© Copyright 2017 | RP Data Pty Ltd trading as CoreLogic Asia Pacific (CoreLogic) and its licensors are the sole and exclusive owners of all rights, title and
interest (including intellectual property rights) subsisting in this publication including any data, analytics, statistics and other information. All rights reserved. 
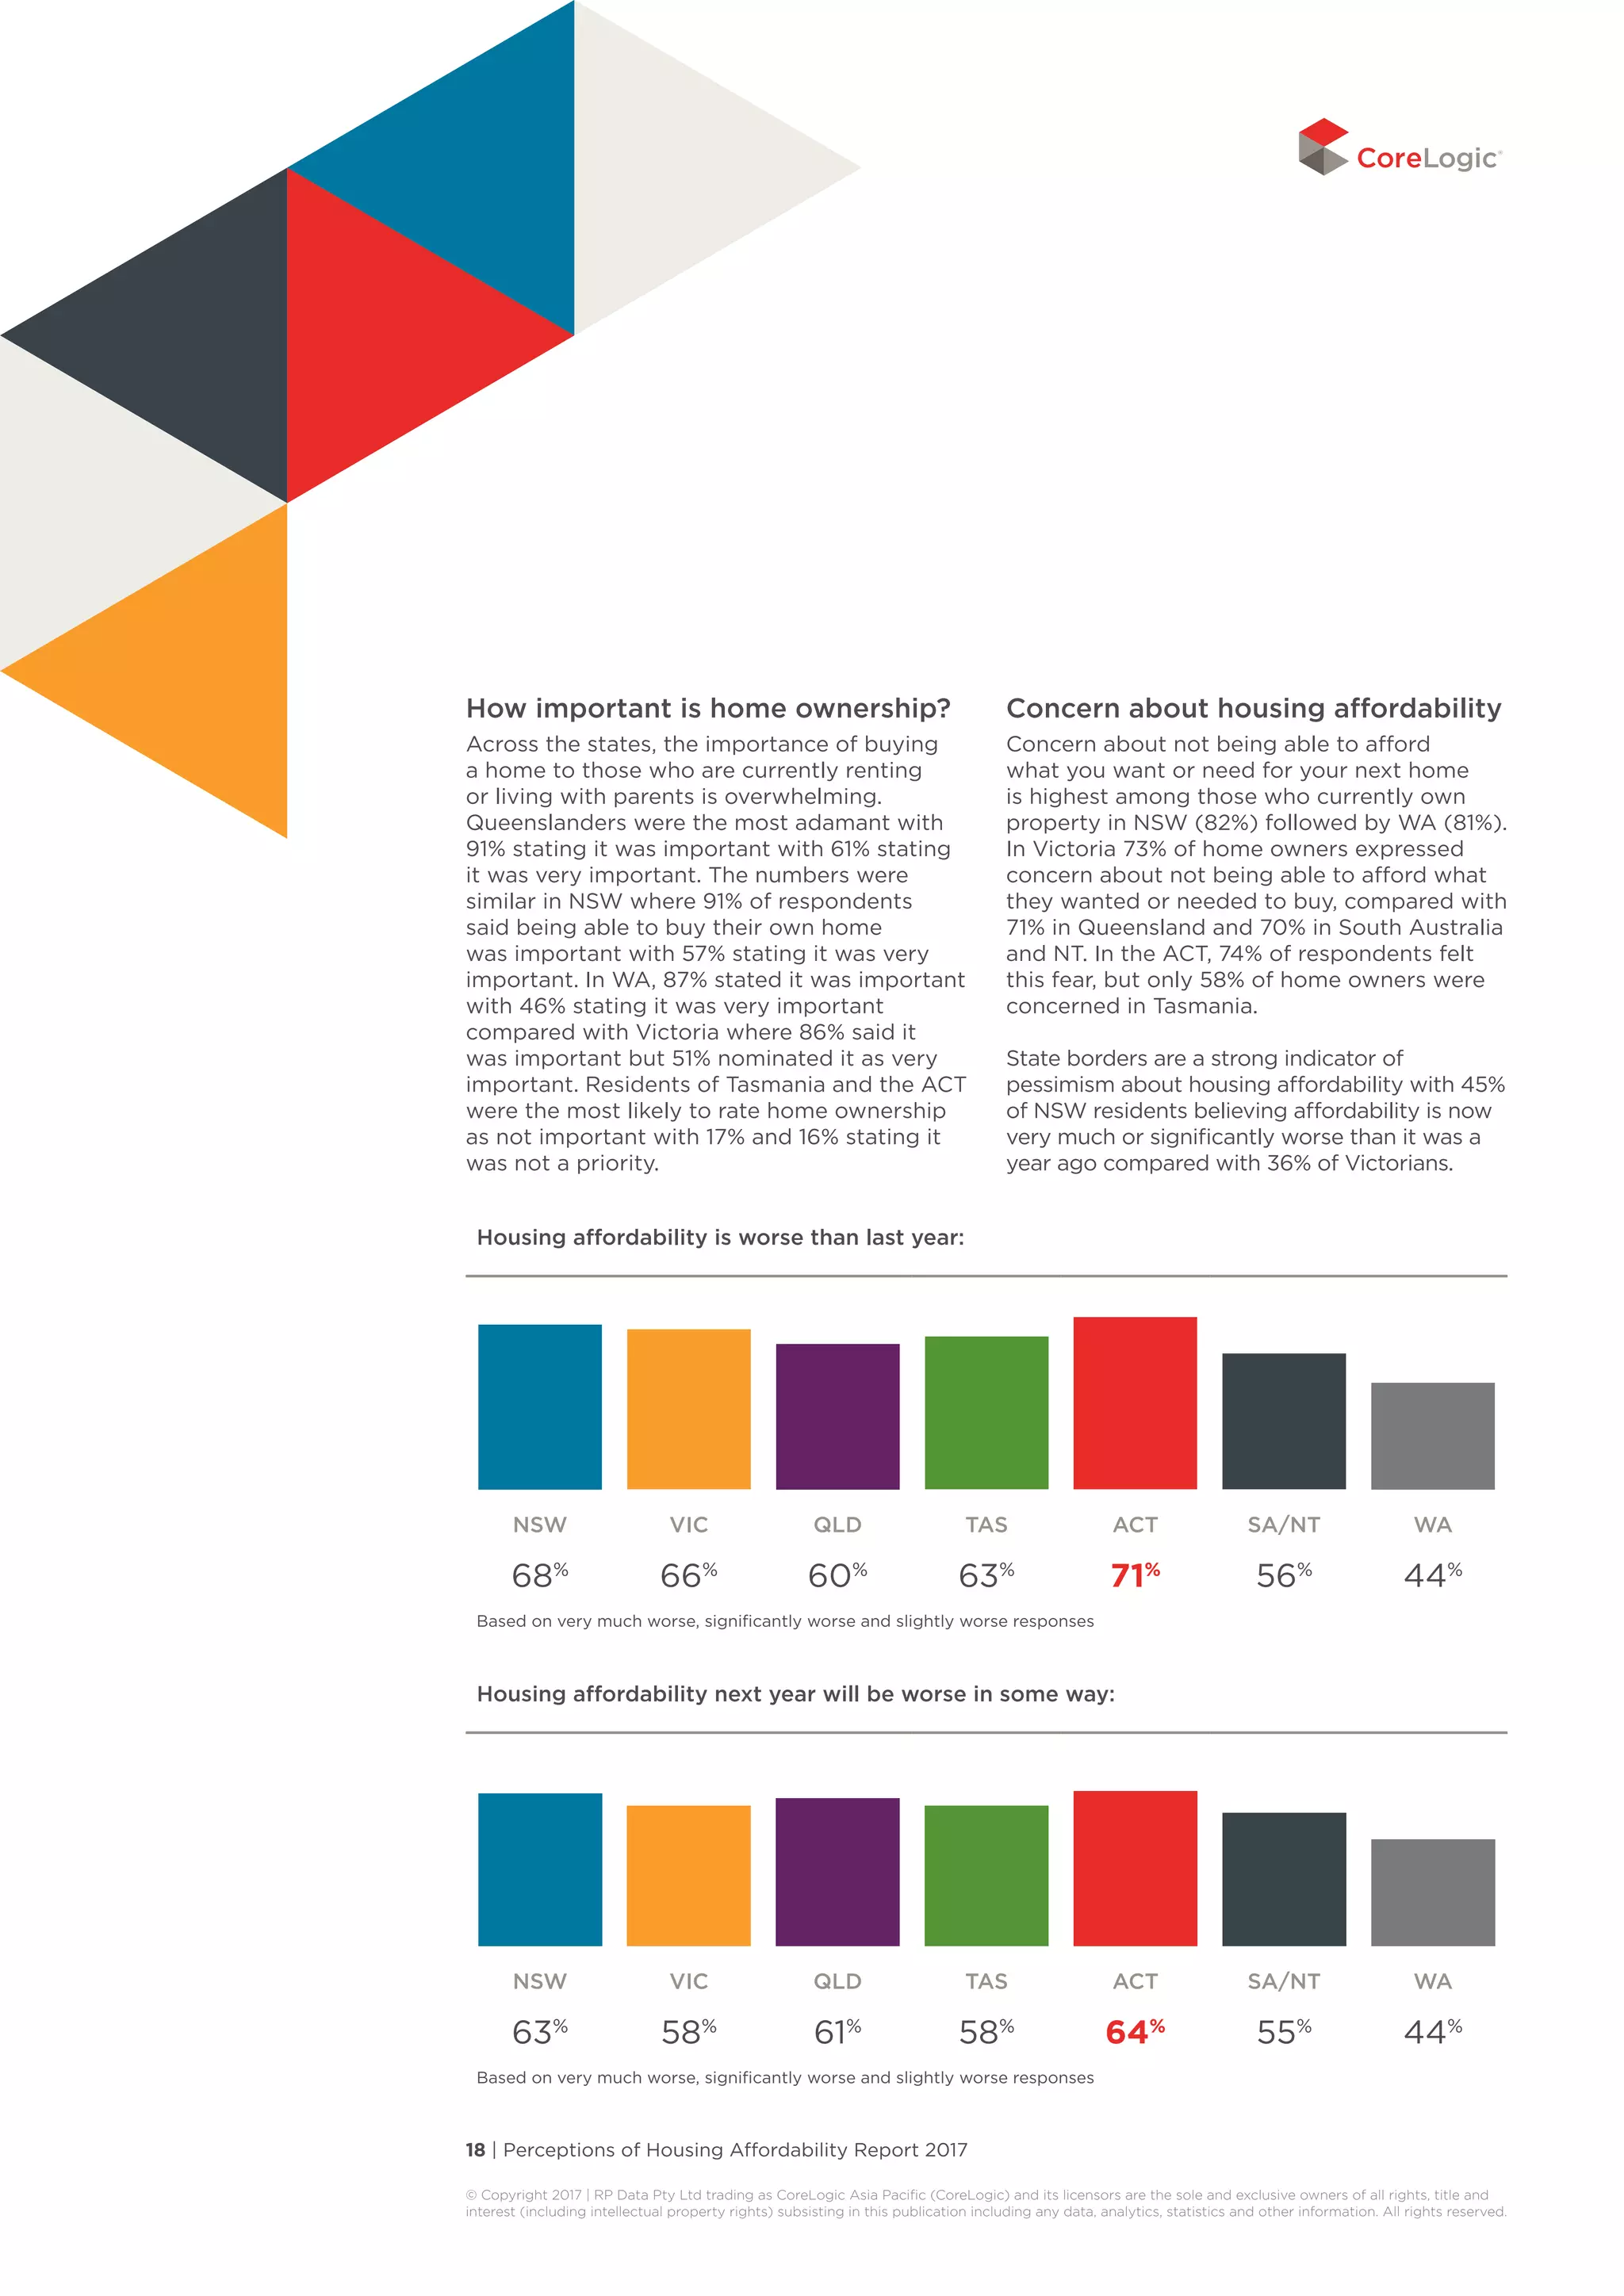
How important is home ownership?
Across the states, the importance of buying
a home to those who are currently renting
or living with parents is overwhelming.
Queenslanders were the most adamant with
91% stating it was important with 61% stating
it was very important. The numbers were
similar in NSW where 91% of respondents
said being able to buy their own home
was important with 57% stating it was very
important. In WA, 87% stated it was important
with 46% stating it was very important
compared with Victoria where 86% said it
was important but 51% nominated it as very
important. Residents of Tasmania and the ACT
were the most likely to rate home ownership
as not important with 17% and 16% stating it
was not a priority.
Concern about housing affordability
Concern about not being able to afford
what you want or need for your next home
is highest among those who currently own
property in NSW (82%) followed by WA (81%).
In Victoria 73% of home owners expressed
concern about not being able to afford what
they wanted or needed to buy, compared with
71% in Queensland and 70% in South Australia
and NT. In the ACT, 74% of respondents felt
this fear, but only 58% of home owners were
concerned in Tasmania.
State borders are a strong indicator of
pessimism about housing affordability with 45%
of NSW residents believing affordability is now
very much or significantly worse than it was a
year ago compared with 36% of Victorians.
Housing affordability next year will be worse in some way:
NSW VIC QLD TAS ACT SA/NT WA
63%
58%
61%
58%
64%
55%
44%
Based on very much worse, significantly worse and slightly worse responses
Housing affordability is worse than last year:
NSW VIC QLD TAS ACT SA/NT WA
68%
66%
60%
63%
71%
56%
44%
Based on very much worse, significantly worse and slightly worse responses
Perceptions of Housing Affordability Report 2017 | 19
© Copyright 2017 | RP Data Pty Ltd trading as CoreLogic Asia Pacific (CoreLogic) and its licensors are the sole and exclusive owners of all rights, title and
interest (including intellectual property rights) subsisting in this publication including any data, analytics, statistics and other information. All rights reserved.
What are the obstacles to housing
affordability?
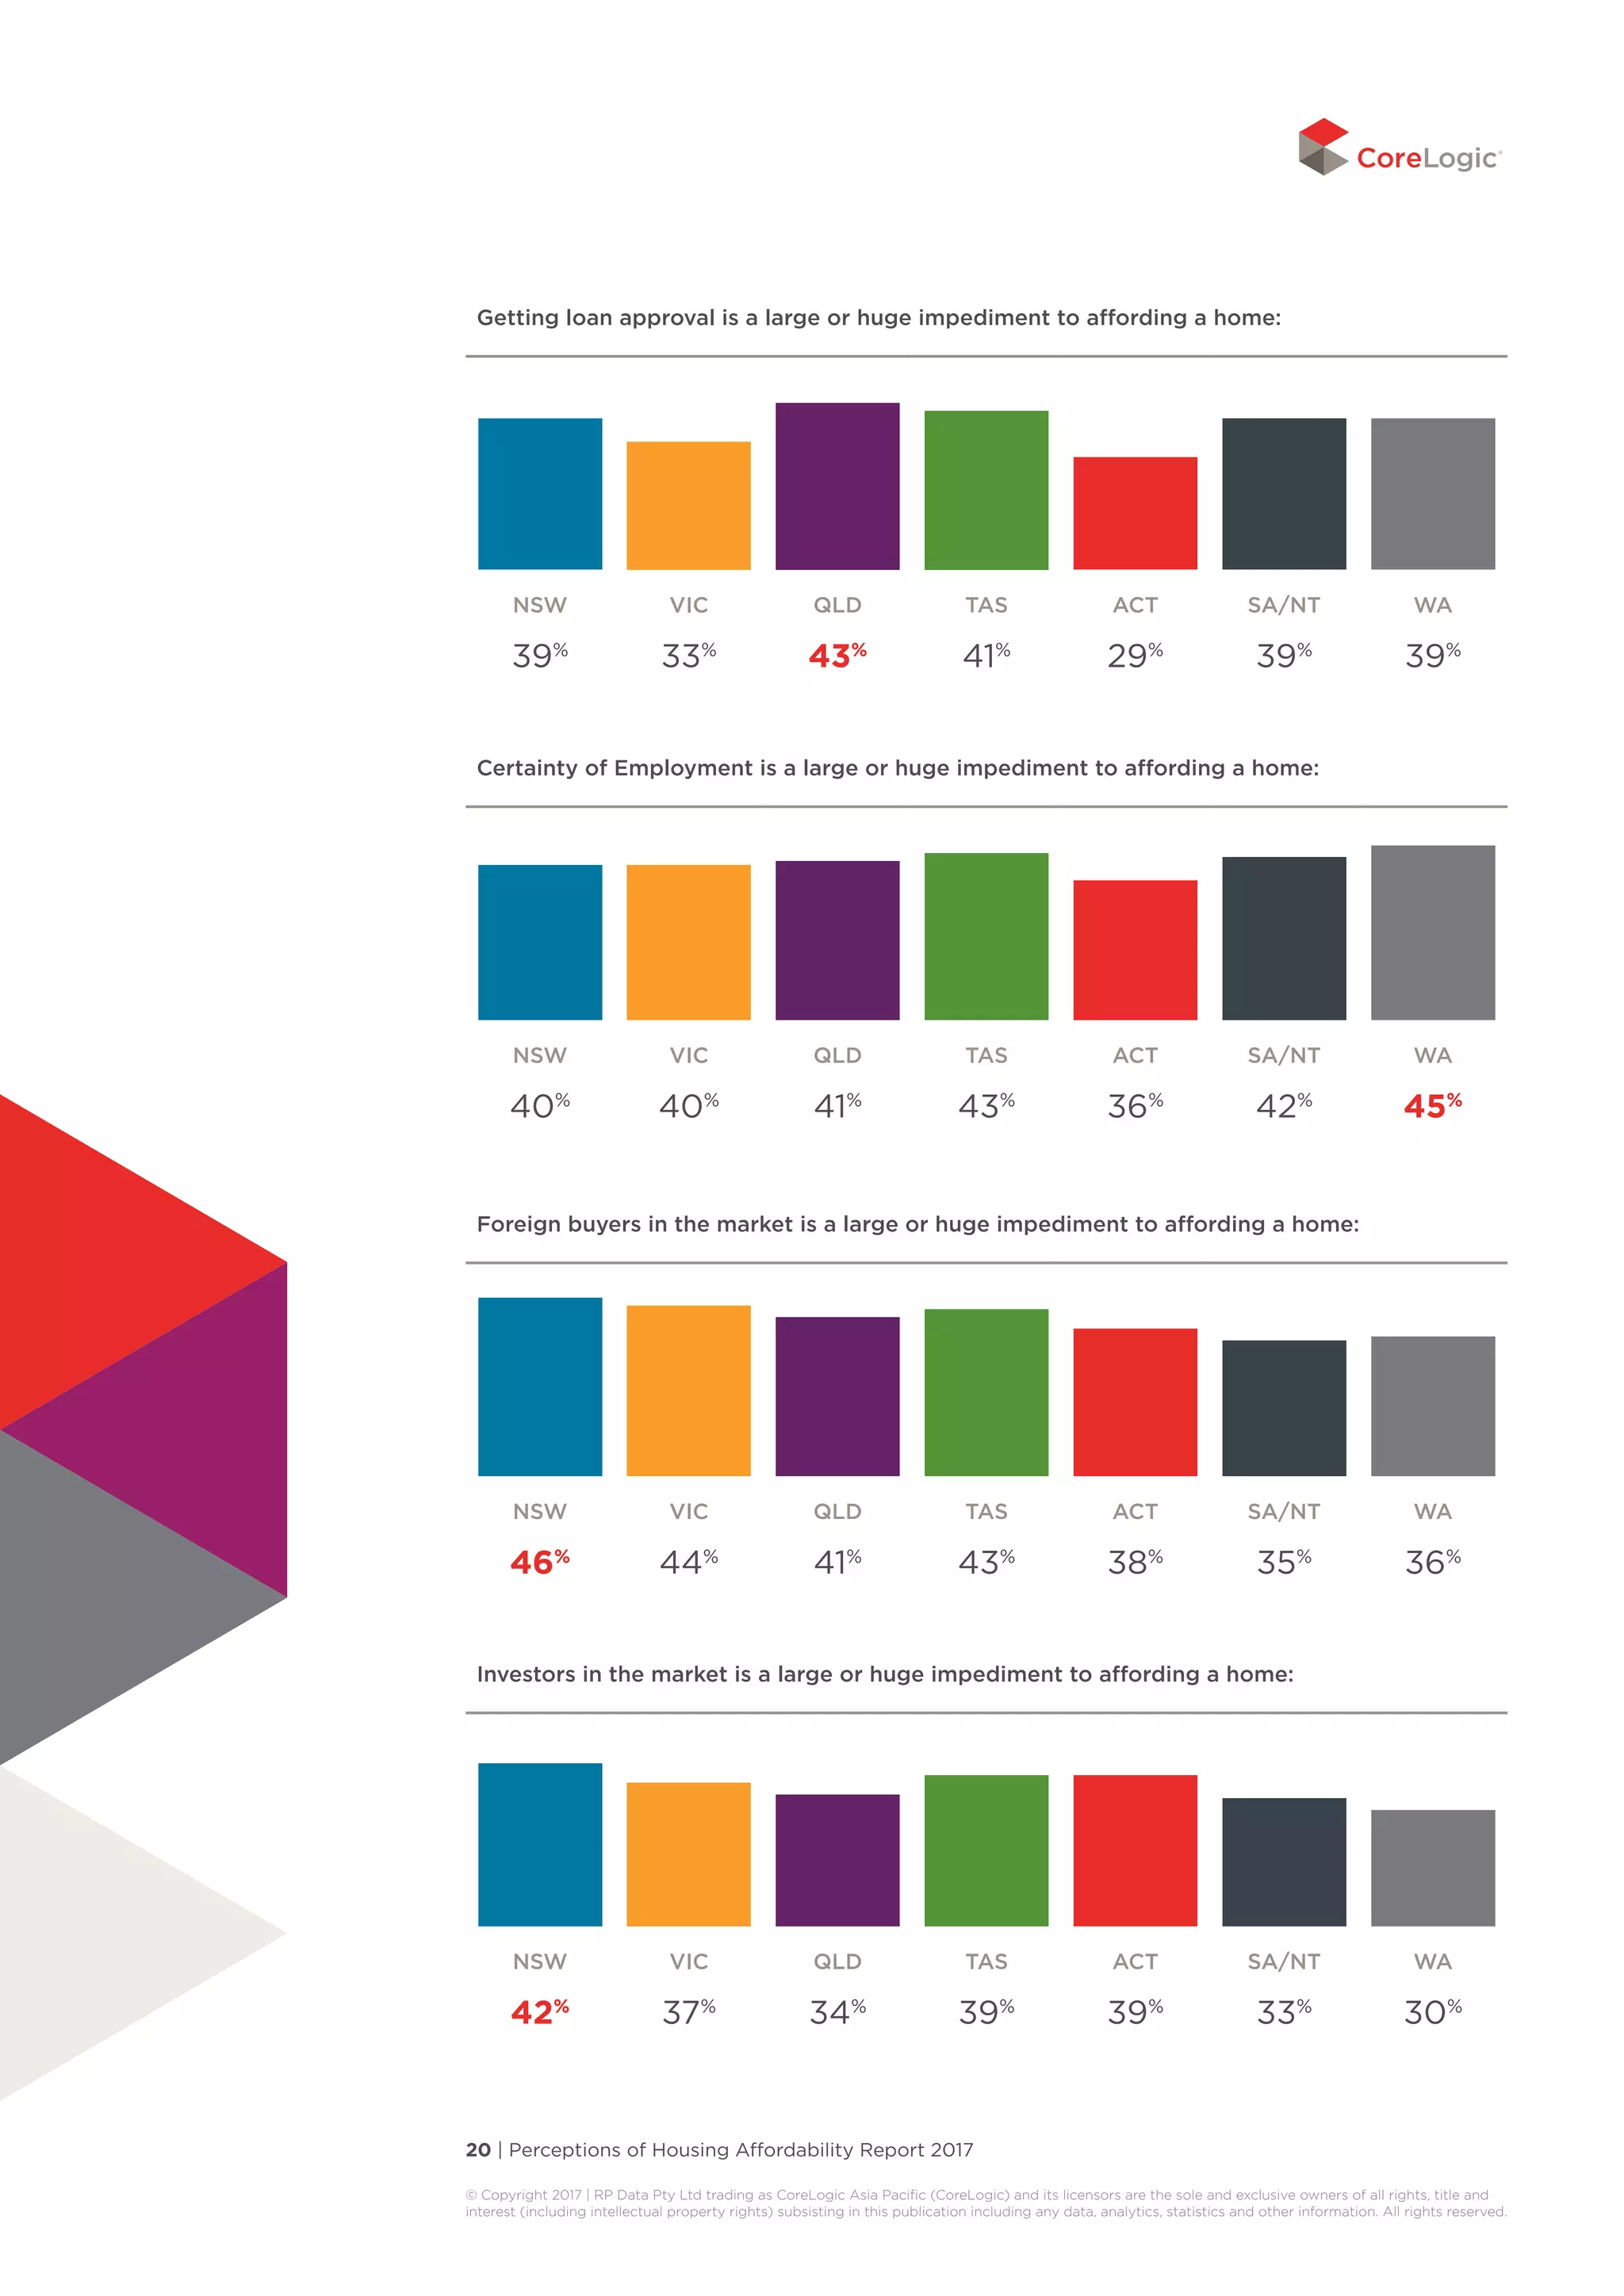
For NSW residents, the biggest impediments
to affordability are stamp duty (48%), foreign
buyers in the market (46%) and investors
in the market and having the deposit (42%
each). For Victorians, having the deposit
and foreign buyers in the market (44% each)
are large or huge impediments followed by
certainty of employment (40%).
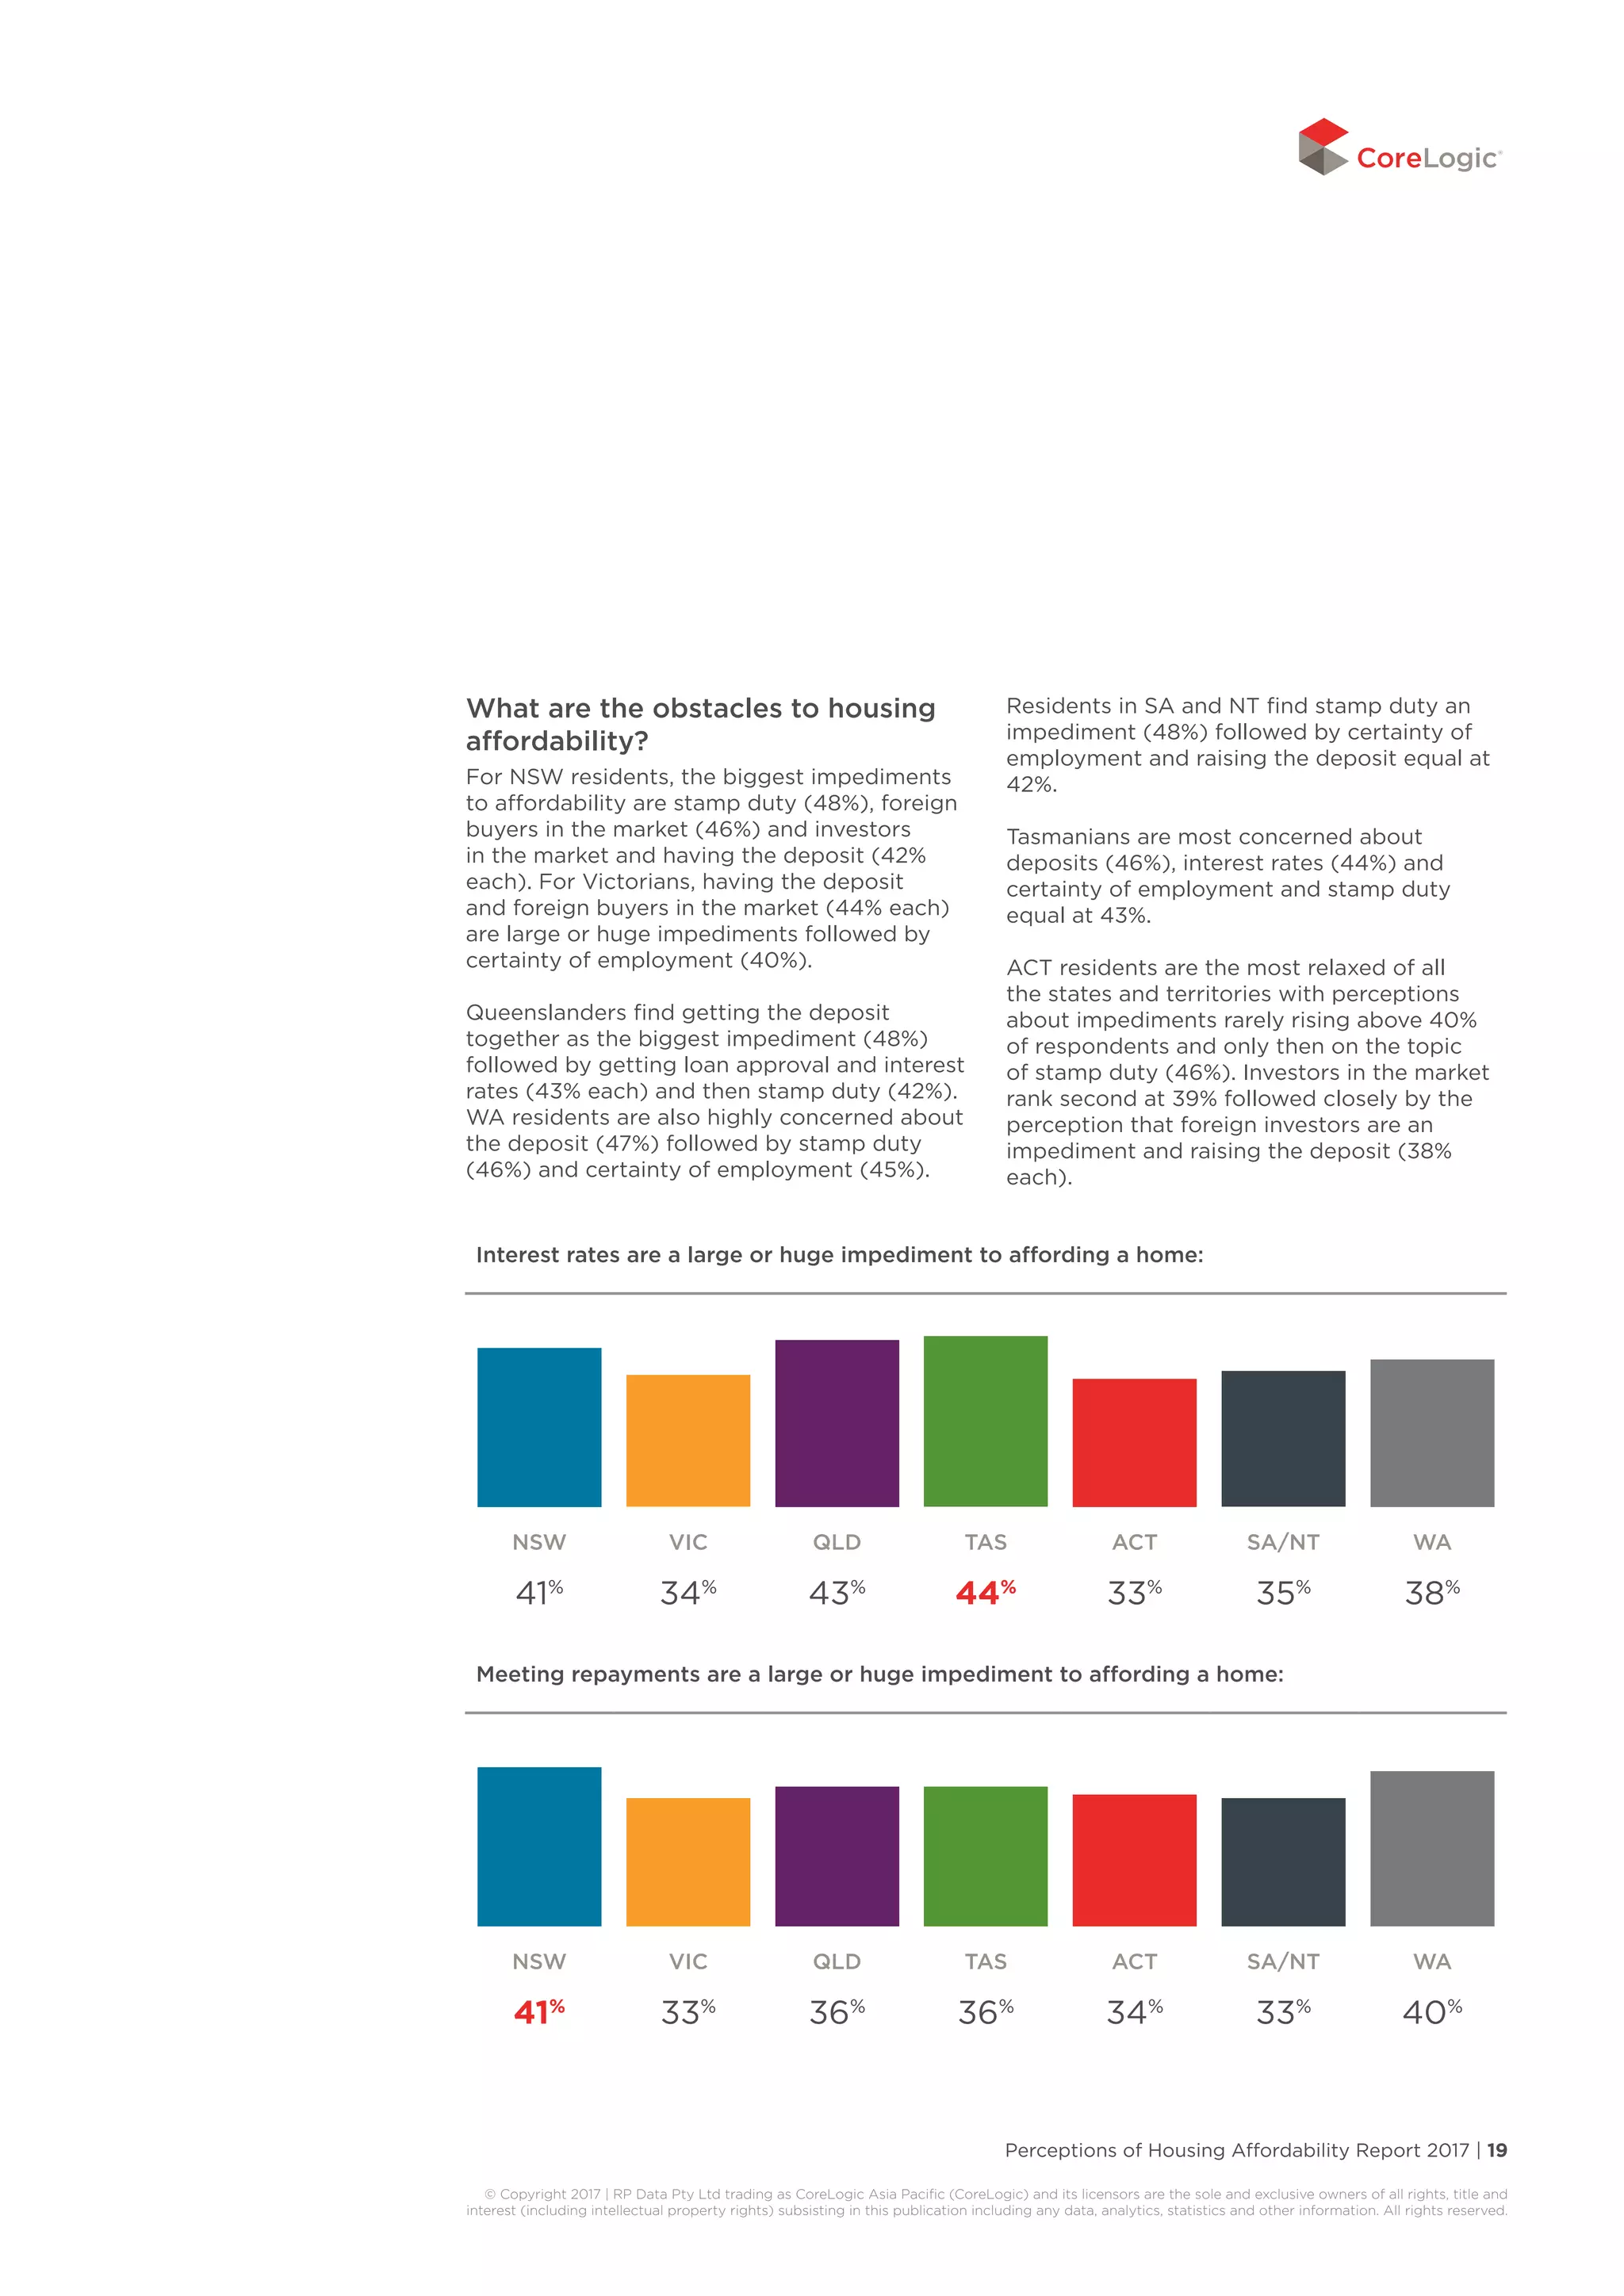
Queenslanders find getting the deposit
together as the biggest impediment (48%)
followed by getting loan approval and interest
rates (43% each) and then stamp duty (42%).
WA residents are also highly concerned about
the deposit (47%) followed by stamp duty
(46%) and certainty of employment (45%).
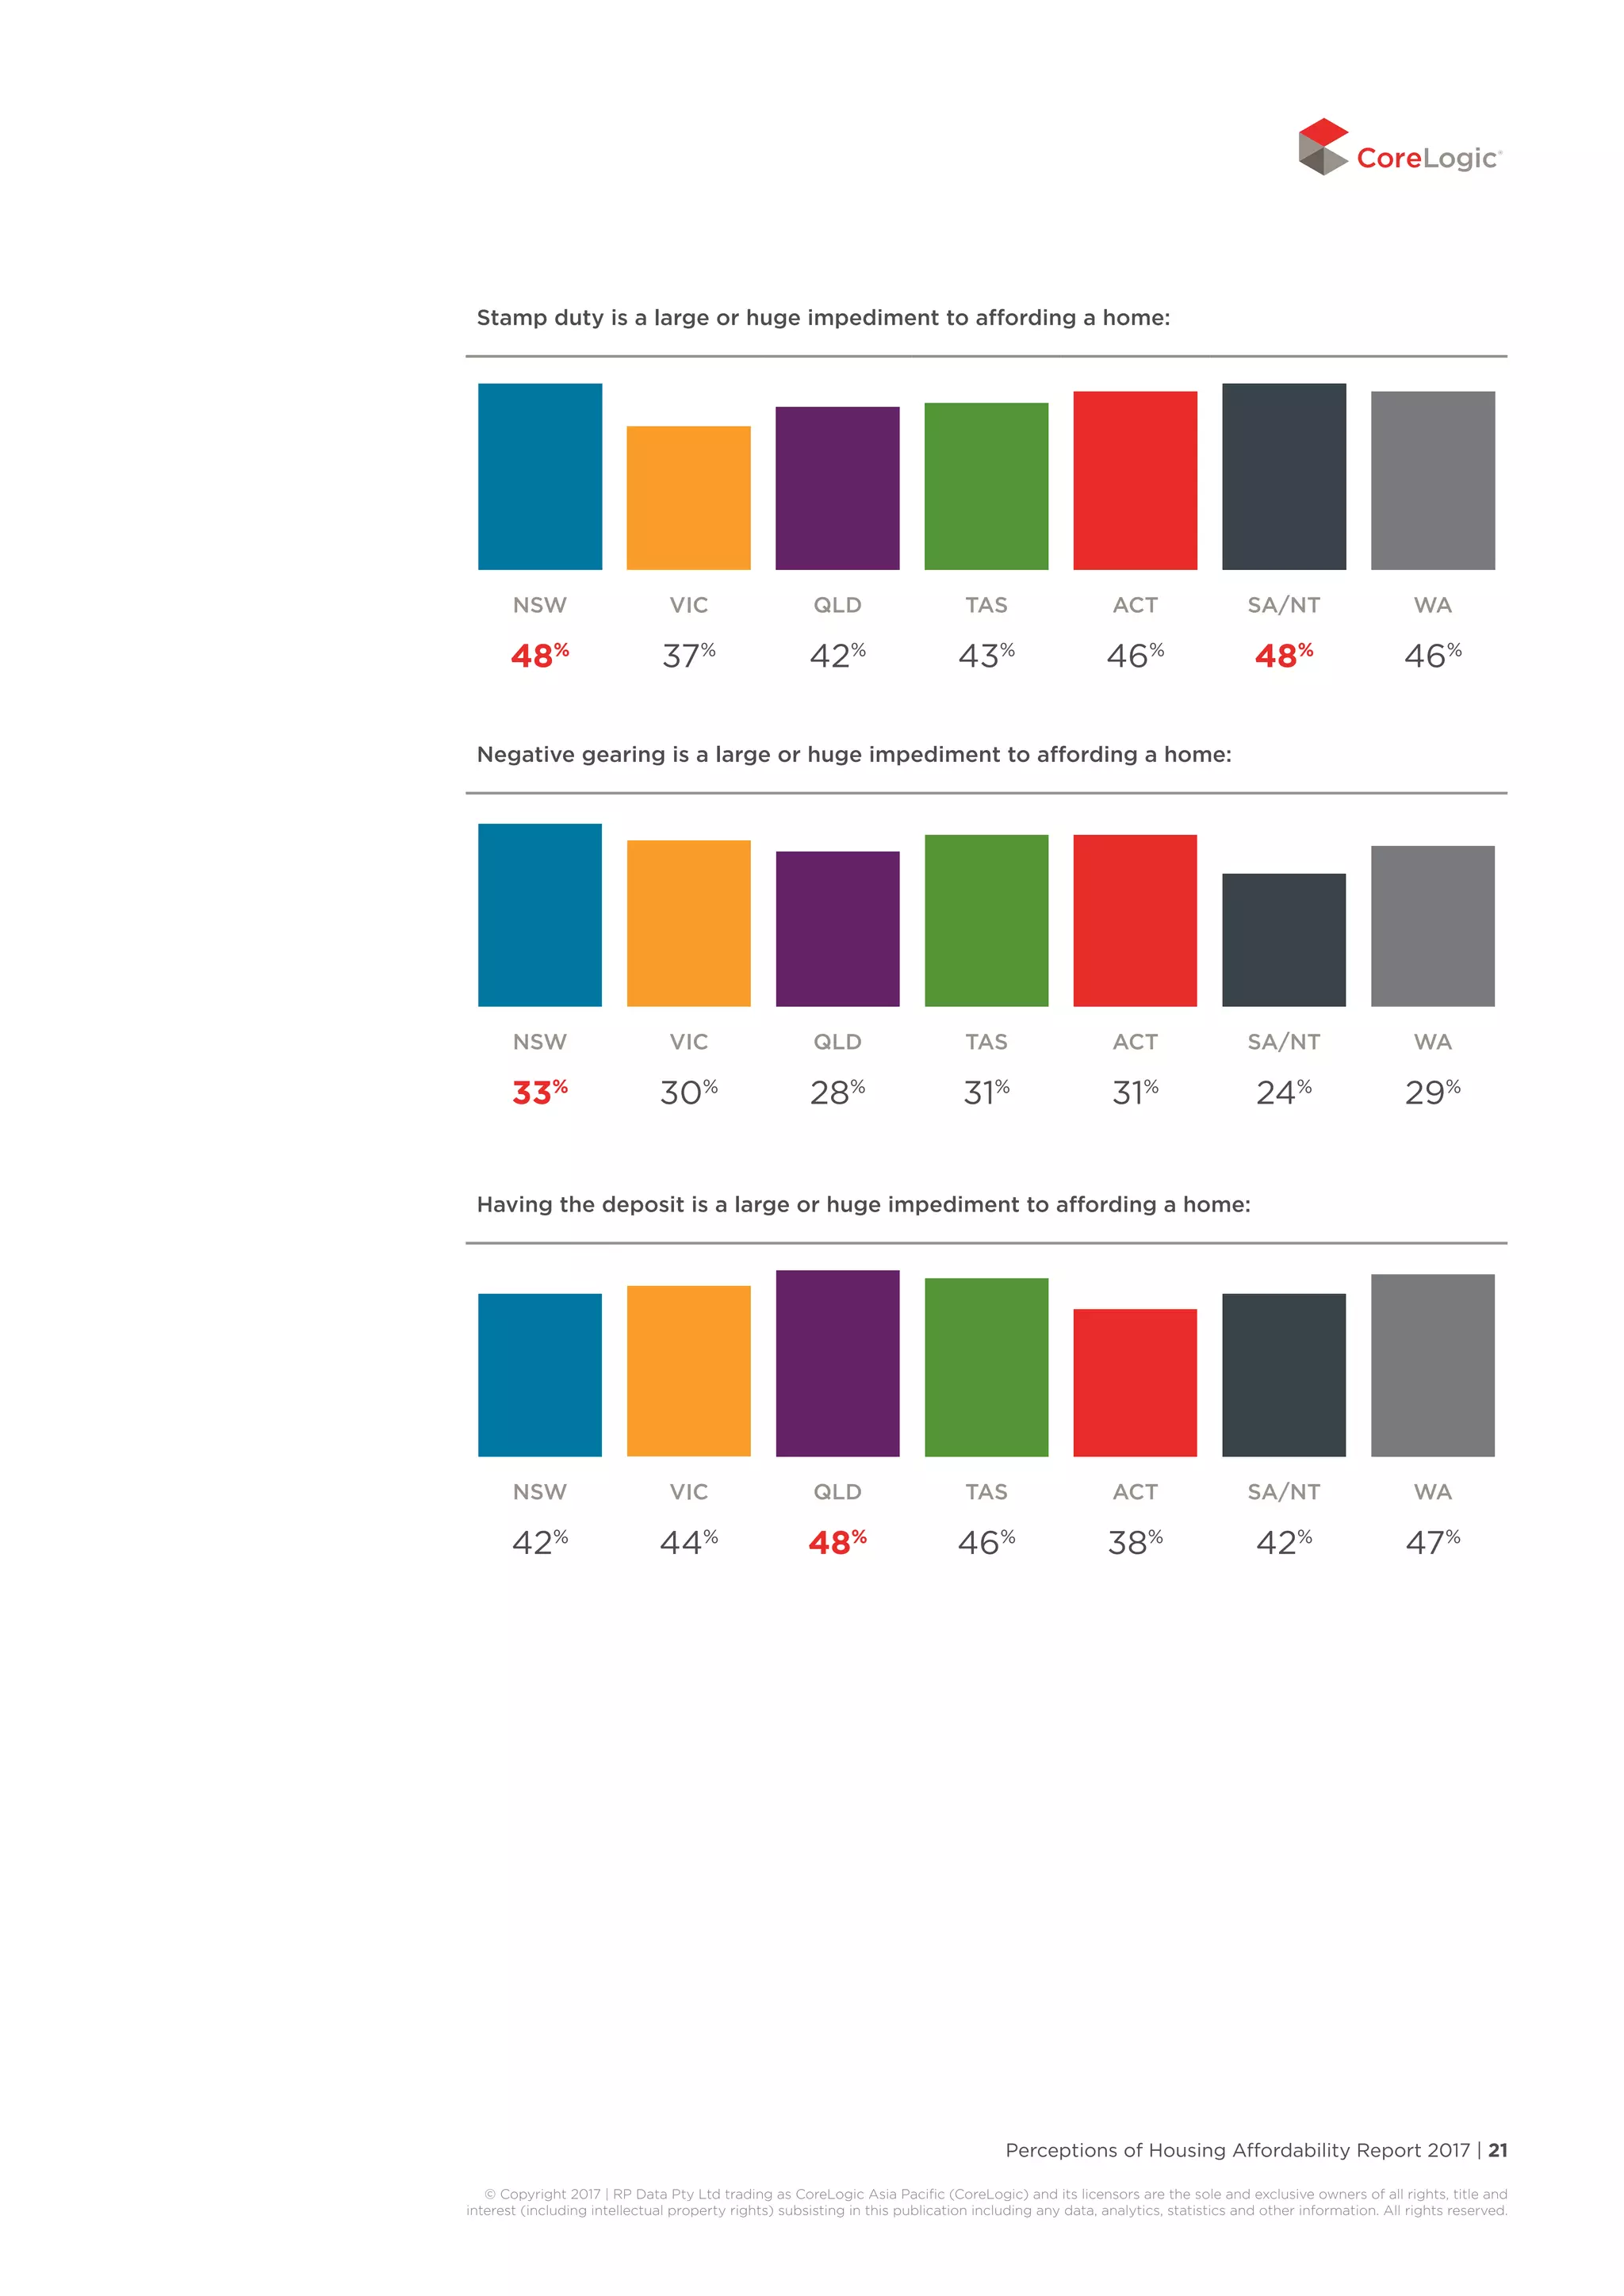
Residents in SA and NT find stamp duty an
impediment (48%) followed by certainty of
employment and raising the deposit equal at
42%.
Tasmanians are most concerned about
deposits (46%), interest rates (44%) and
certainty of employment and stamp duty
equal at 43%.
ACT residents are the most relaxed of all
the states and territories with perceptions
about impediments rarely rising above 40%
of respondents and only then on the topic
of stamp duty (46%). Investors in the market
rank second at 39% followed closely by the
perception that foreign investors are an
impediment and raising the deposit (38%
each).
Meeting repayments are a large or huge impediment to affording a home:
NSW VIC QLD TAS ACT SA/NT WA
41%
33%
36%
36%
34%
33%
40%
Interest rates are a large or huge impediment to affording a home:
NSW VIC QLD TAS ACT SA/NT WA
41%
34%
43%
44%
33%
35%
38%
20 | Perceptions of Housing Affordability Report 2017
© Copyright 2017 | RP Data Pty Ltd trading as CoreLogic Asia Pacific (CoreLogic) and its licensors are the sole and exclusive owners of all rights, title and
interest (including intellectual property rights) subsisting in this publication including any data, analytics, statistics and other information. All rights reserved. 
Investors in the market is a large or huge impediment to affording a home:
NSW VIC QLD TAS ACT SA/NT WA
42%
37%
34%
39%
39%
33%
30%
Foreign buyers in the market is a large or huge impediment to affording a home:
NSW VIC QLD TAS ACT SA/NT WA
46%
44%
41%
43%
38%
35%
36%
Certainty of Employment is a large or huge impediment to affording a home:
NSW VIC QLD TAS ACT SA/NT WA
40%
40%
41%
43%
36%
42%
45%
Getting loan approval is a large or huge impediment to affording a home:
NSW VIC QLD TAS ACT SA/NT WA
39%
33%
43%
41%
29%
39%
39%
Perceptions of Housing Affordability Report 2017 | 21
© Copyright 2017 | RP Data Pty Ltd trading as CoreLogic Asia Pacific (CoreLogic) and its licensors are the sole and exclusive owners of all rights, title and
interest (including intellectual property rights) subsisting in this publication including any data, analytics, statistics and other information. All rights reserved.
Having the deposit is a large or huge impediment to affording a home:
NSW VIC QLD TAS ACT SA/NT WA
42%
44%
48%
46%
38%
42%
47%
Negative gearing is a large or huge impediment to affording a home:
NSW VIC QLD TAS ACT SA/NT WA
33%
30%
28%
31%
31%
24%
29%
Stamp duty is a large or huge impediment to affording a home:
NSW VIC QLD TAS ACT SA/NT WA
48%
37%
42%
43%
46%
48%
46%
22 | Perceptions of Housing Affordability Report 2017
© Copyright 2017 | RP Data Pty Ltd trading as CoreLogic Asia Pacific (CoreLogic) and its licensors are the sole and exclusive owners of all rights, title and
interest (including intellectual property rights) subsisting in this publication including any data, analytics, statistics and other information. All rights reserved. 
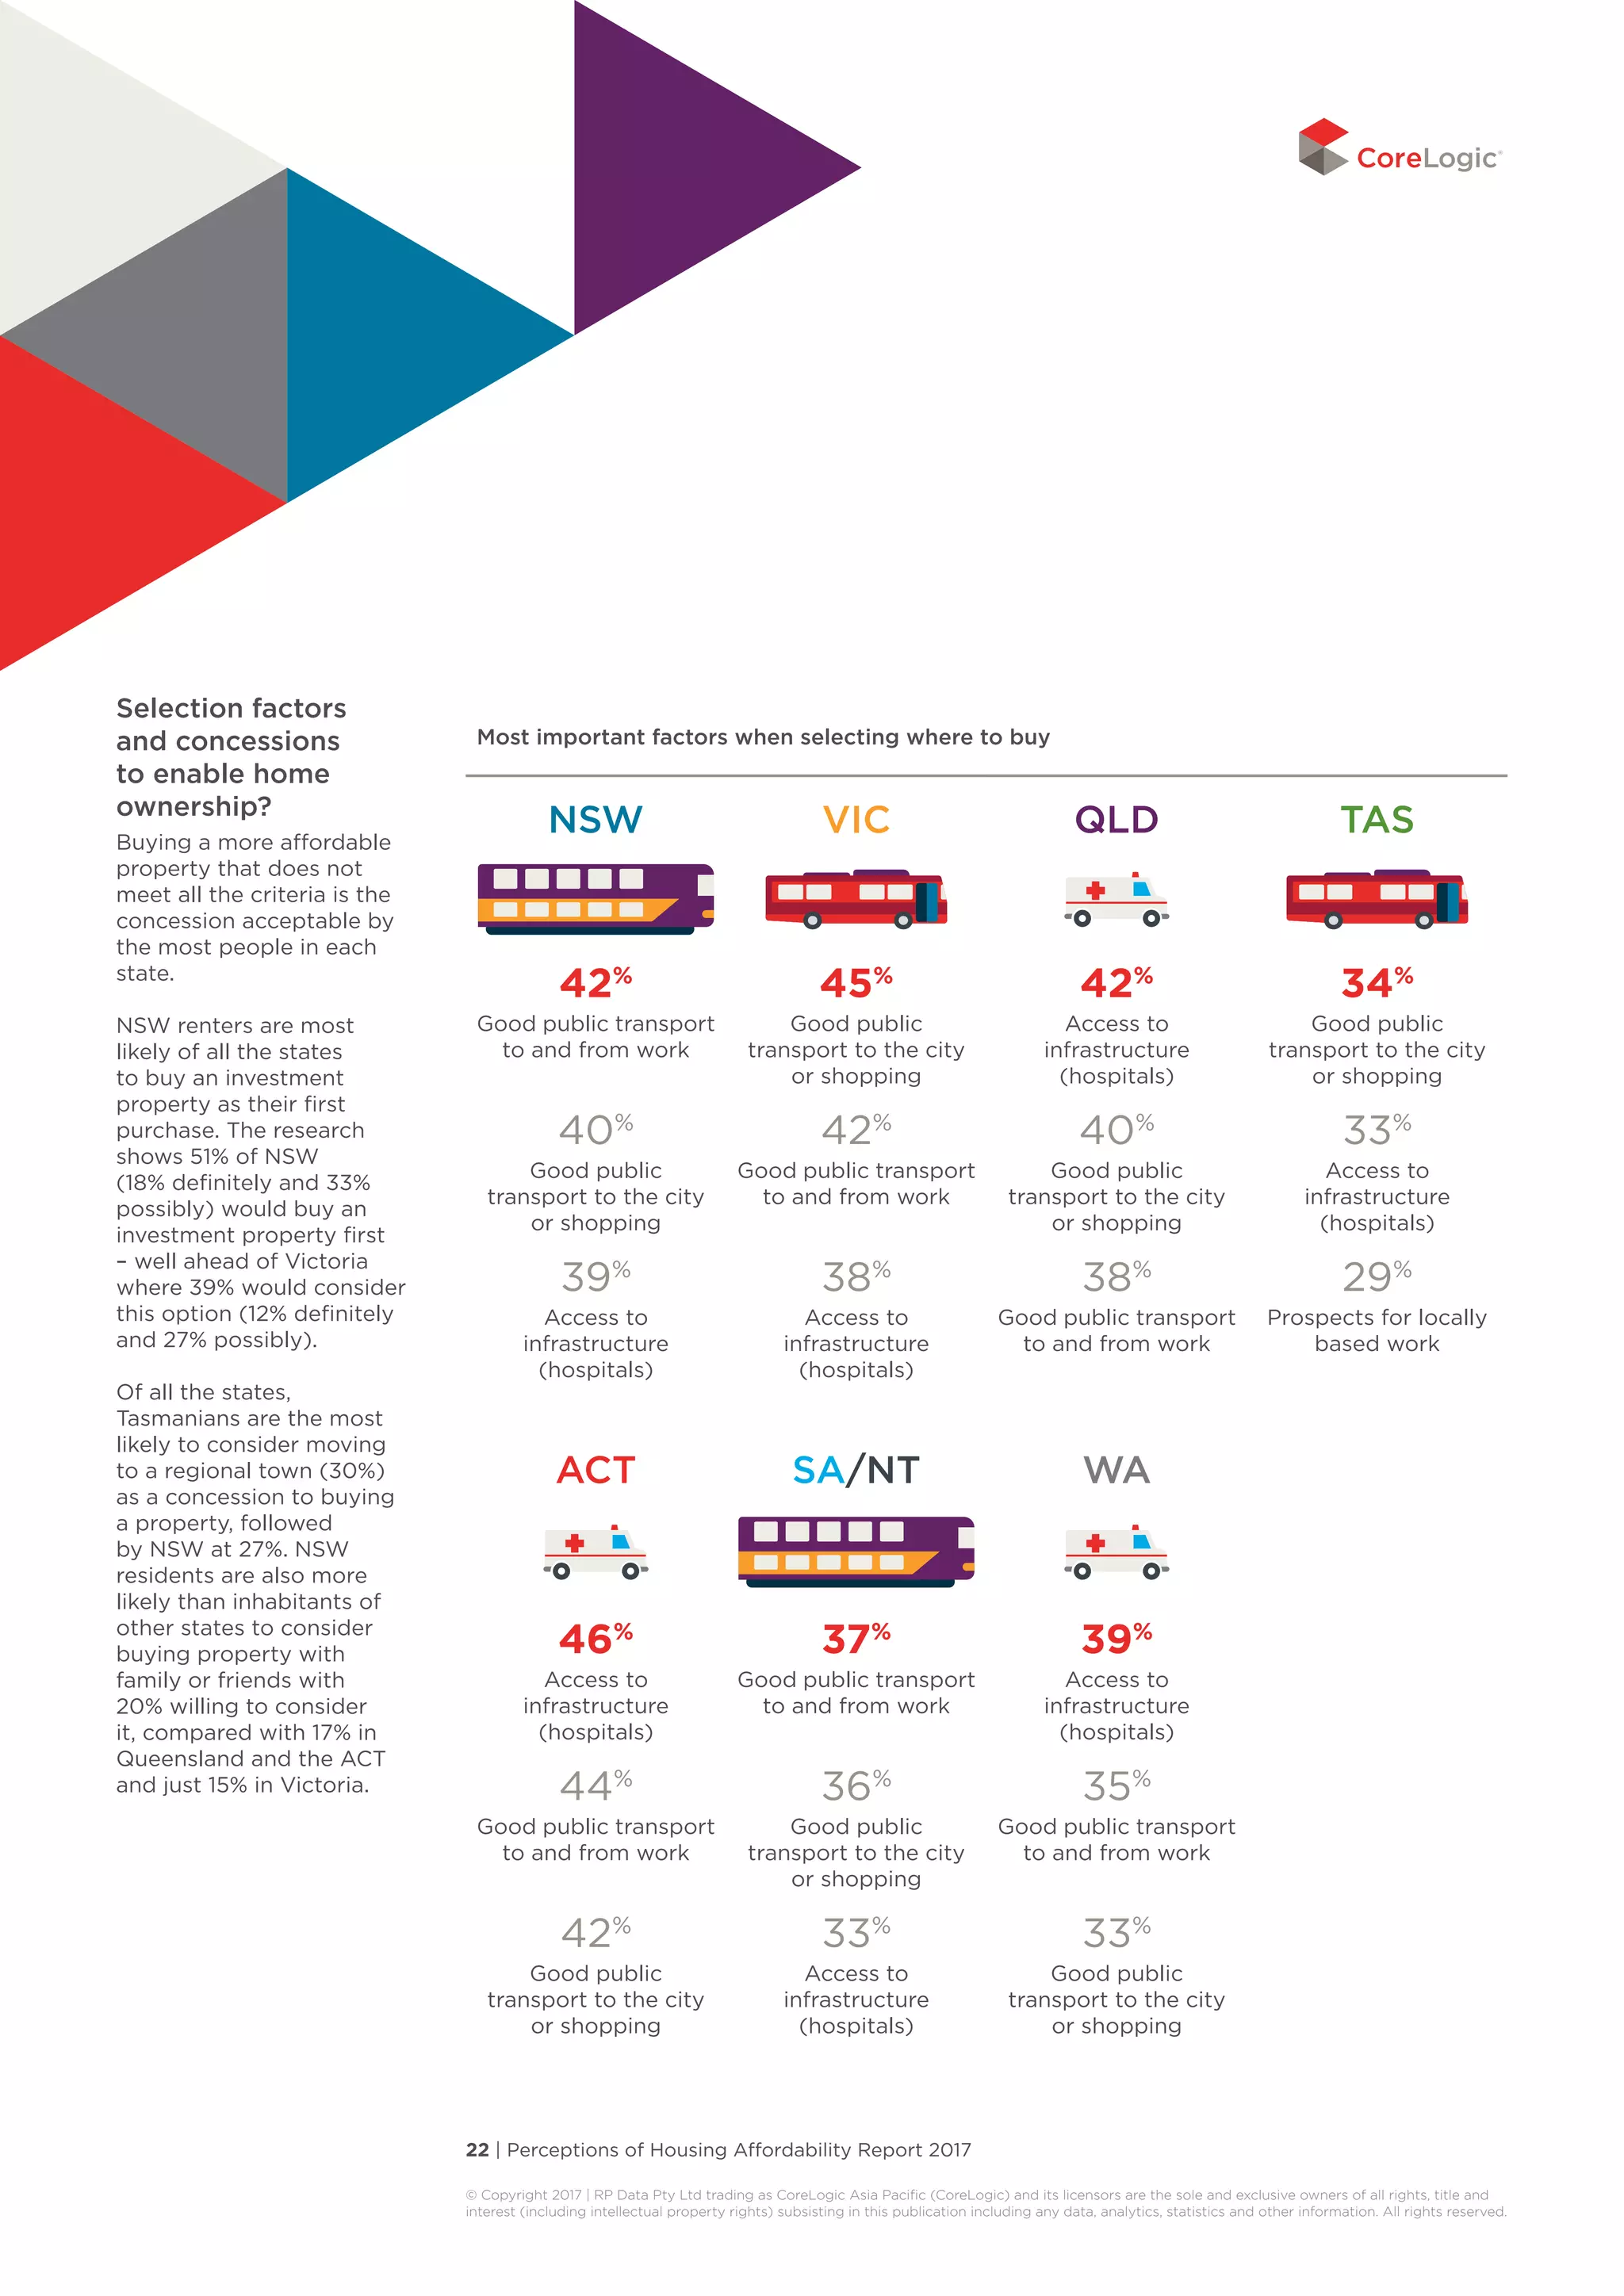
Most important factors when selecting where to buy
NSW VIC QLD TAS
42%
Good public transport
to and from work
45%
Good public
transport to the city
or shopping
42%
Access to
infrastructure
(hospitals)
34%
Good public
transport to the city
or shopping
40%
Good public
transport to the city
or shopping
42%
Good public transport
to and from work
40%
Good public
transport to the city
or shopping
33%
Access to
infrastructure
(hospitals)
39%
Access to
infrastructure
(hospitals)
38%
Access to
infrastructure
(hospitals)
38%
Good public transport
to and from work
29%
Prospects for locally
based work
ACT SA/NT WA
46%
Access to
infrastructure
(hospitals)
37%
Good public transport
to and from work
39%
Access to
infrastructure
(hospitals)
44%
Good public transport
to and from work
36%
Good public
transport to the city
or shopping
35%
Good public transport
to and from work
42%
Good public
transport to the city
or shopping
33%
Access to
infrastructure
(hospitals)
33%
Good public
transport to the city
or shopping
Selection factors
and concessions
to enable home
ownership?
Buying a more affordable
property that does not
meet all the criteria is the
concession acceptable by
the most people in each
state.
NSW renters are most
likely of all the states
to buy an investment
property as their first
purchase. The research
shows 51% of NSW
(18% definitely and 33%
possibly) would buy an
investment property first
– well ahead of Victoria
where 39% would consider
this option (12% definitely
and 27% possibly).
Of all the states,
Tasmanians are the most
likely to consider moving
to a regional town (30%)
as a concession to buying
a property, followed
by NSW at 27%. NSW
residents are also more
likely than inhabitants of
other states to consider
buying property with
family or friends with
20% willing to consider
it, compared with 17% in
Queensland and the ACT
and just 15% in Victoria.
Perceptions of Housing Affordability Report 2017 | 23
© Copyright 2017 | RP Data Pty Ltd trading as CoreLogic Asia Pacific (CoreLogic) and its licensors are the sole and exclusive owners of all rights, title and
interest (including intellectual property rights) subsisting in this publication including any data, analytics, statistics and other information. All rights reserved.
Affordability and payment stress
A third or more of renters in each state
believe they will need to forego more than the
traditional 30% of income into their mortgage
when they get one and this is roughly aligned
with the perception of affordability in each
state.
Renters in NSW (48%) are more likely to
be willing to dedicate between 30 to 49%
of their income to servicing a mortgage,
compared with 45% in Queensland, 41% in WA
and 37% in Victoria.
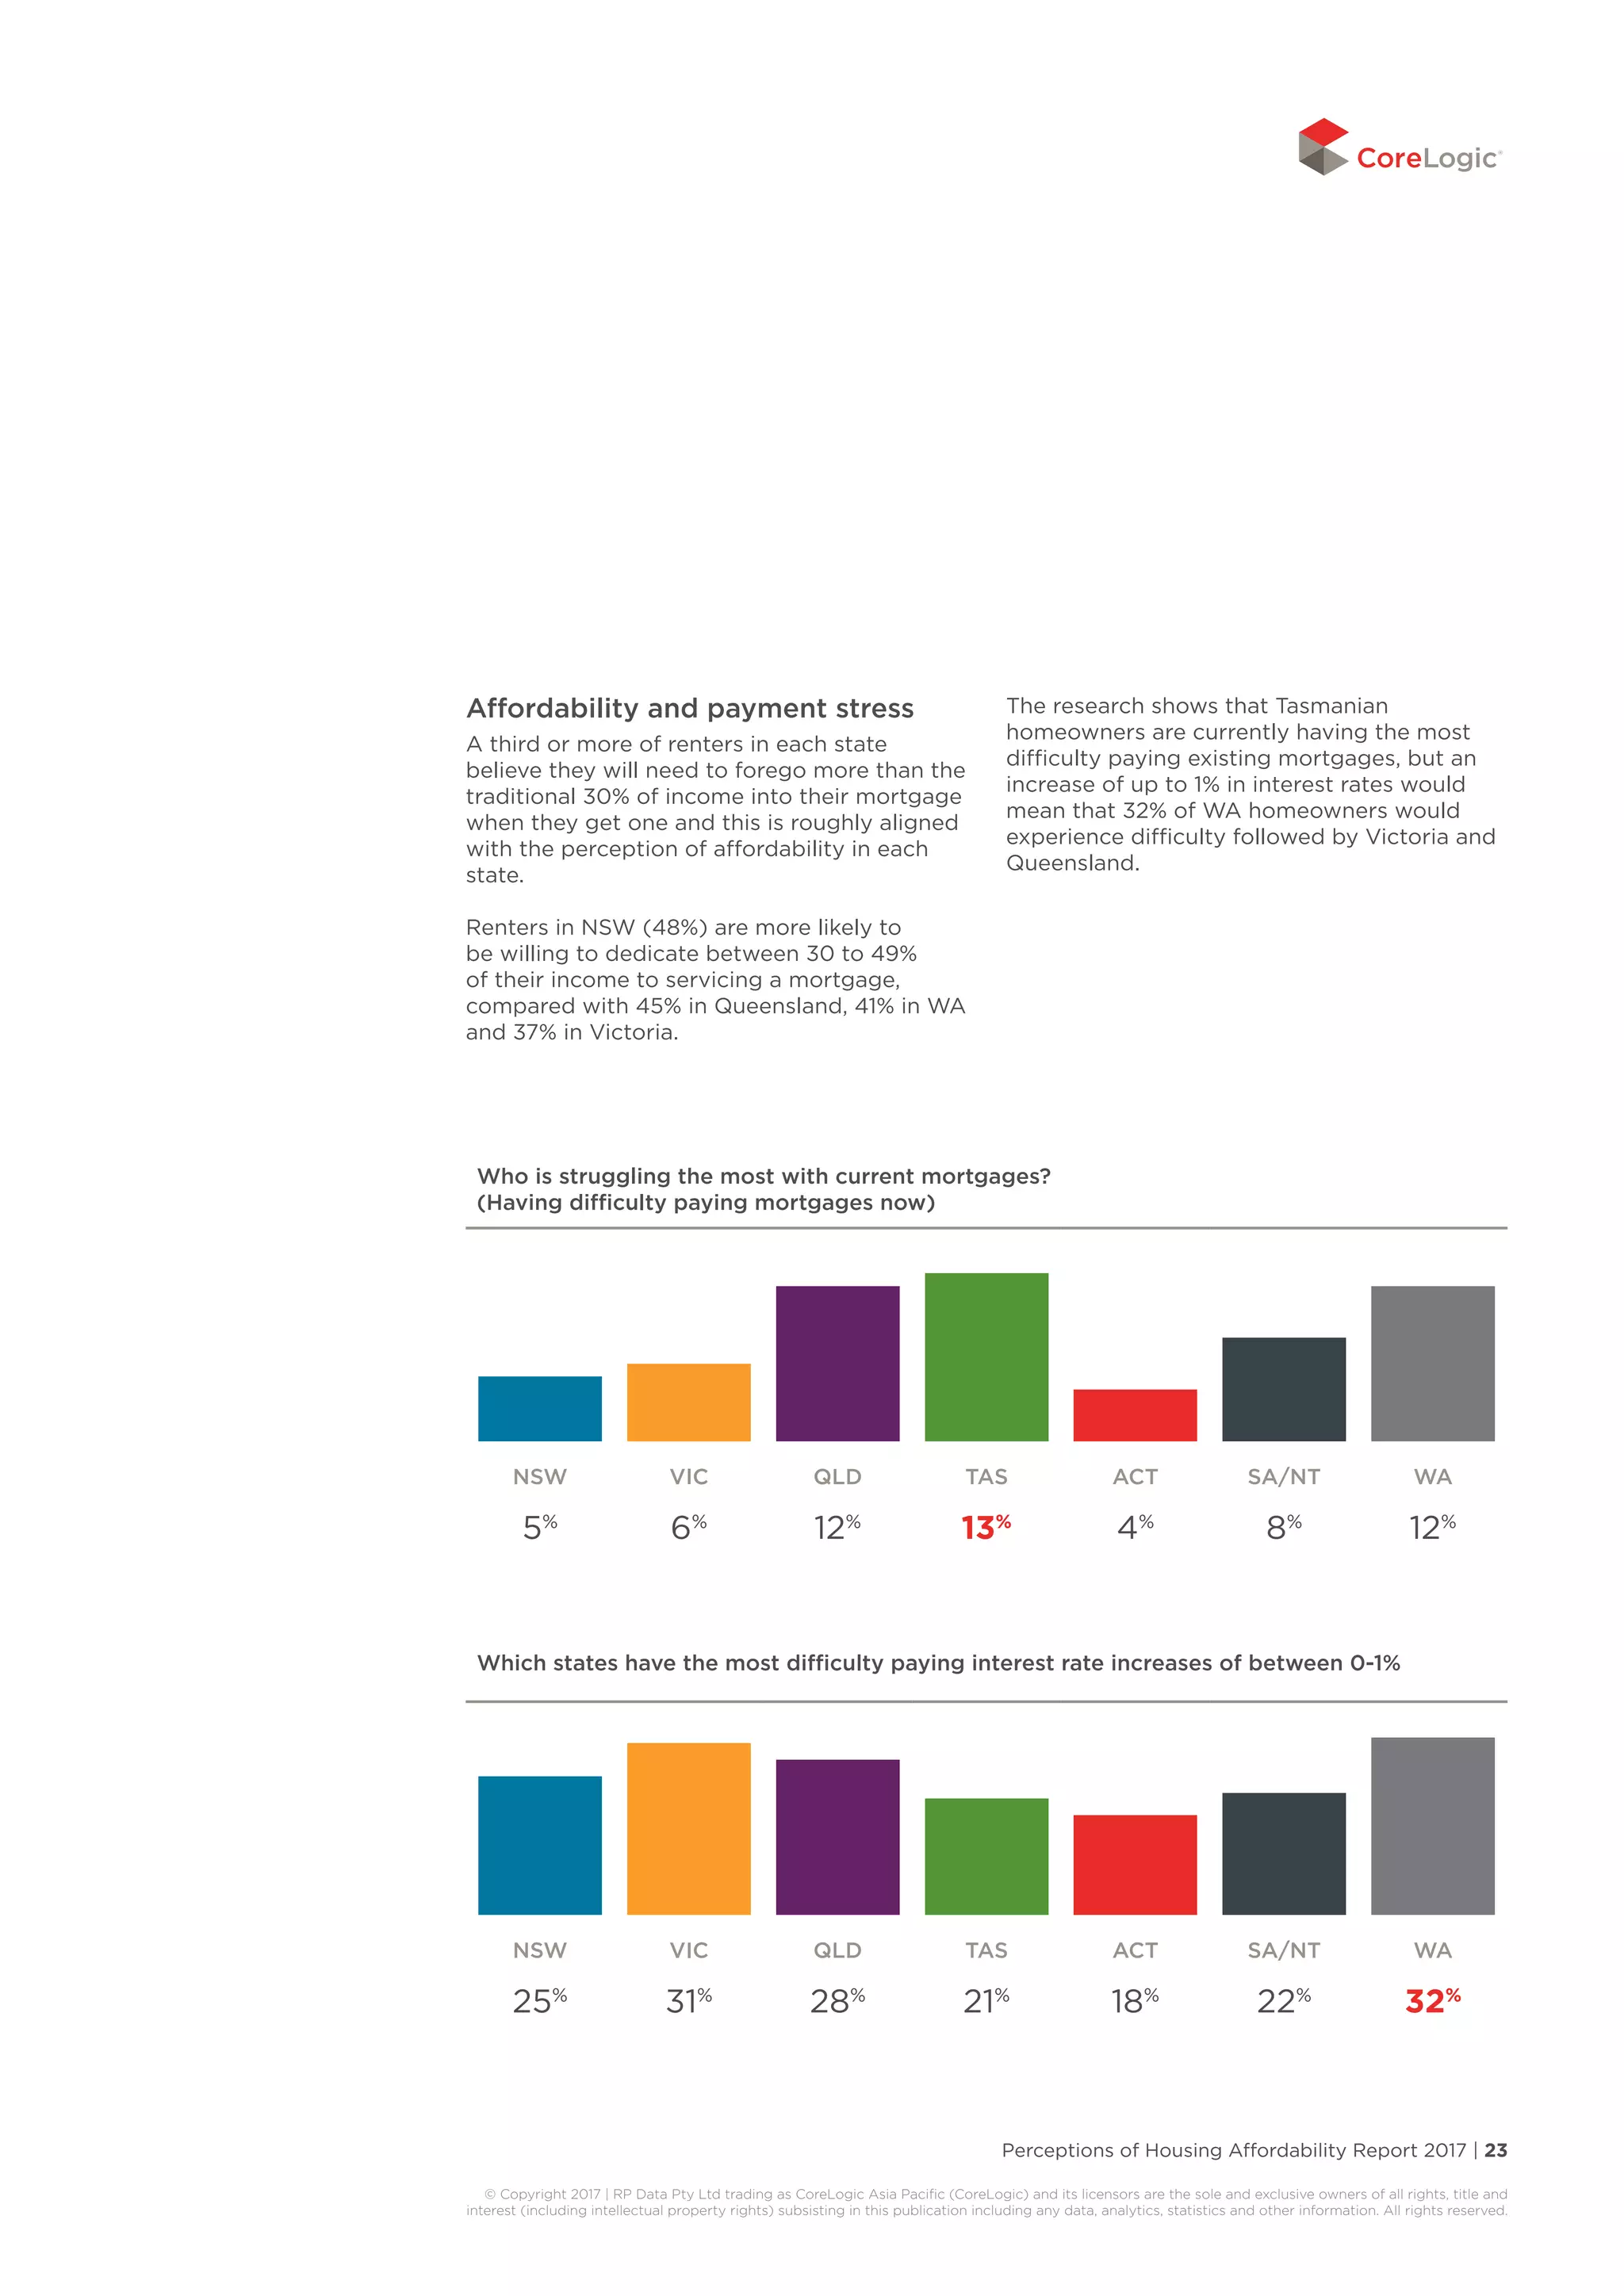
The research shows that Tasmanian
homeowners are currently having the most
difficulty paying existing mortgages, but an
increase of up to 1% in interest rates would
mean that 32% of WA homeowners would
experience difficulty followed by Victoria and
Queensland.
Who is struggling the most with current mortgages?
(Having difficulty paying mortgages now)
NSW VIC QLD TAS ACT SA/NT WA
5%
6%
12%
13%
4%
8%
12%
Which states have the most difficulty paying interest rate increases of between 0-1%
NSW VIC QLD TAS ACT SA/NT WA
25%
31%
28%
21%
18%
22%
32%
24 | Perceptions of Housing Affordability Report 2017
© Copyright 2017 | RP Data Pty Ltd trading as CoreLogic Asia Pacific (CoreLogic) and its licensors are the sole and exclusive owners of all rights, title and
interest (including intellectual property rights) subsisting in this publication including any data, analytics, statistics and other information. All rights reserved. 
Best strategies for
improving affordability
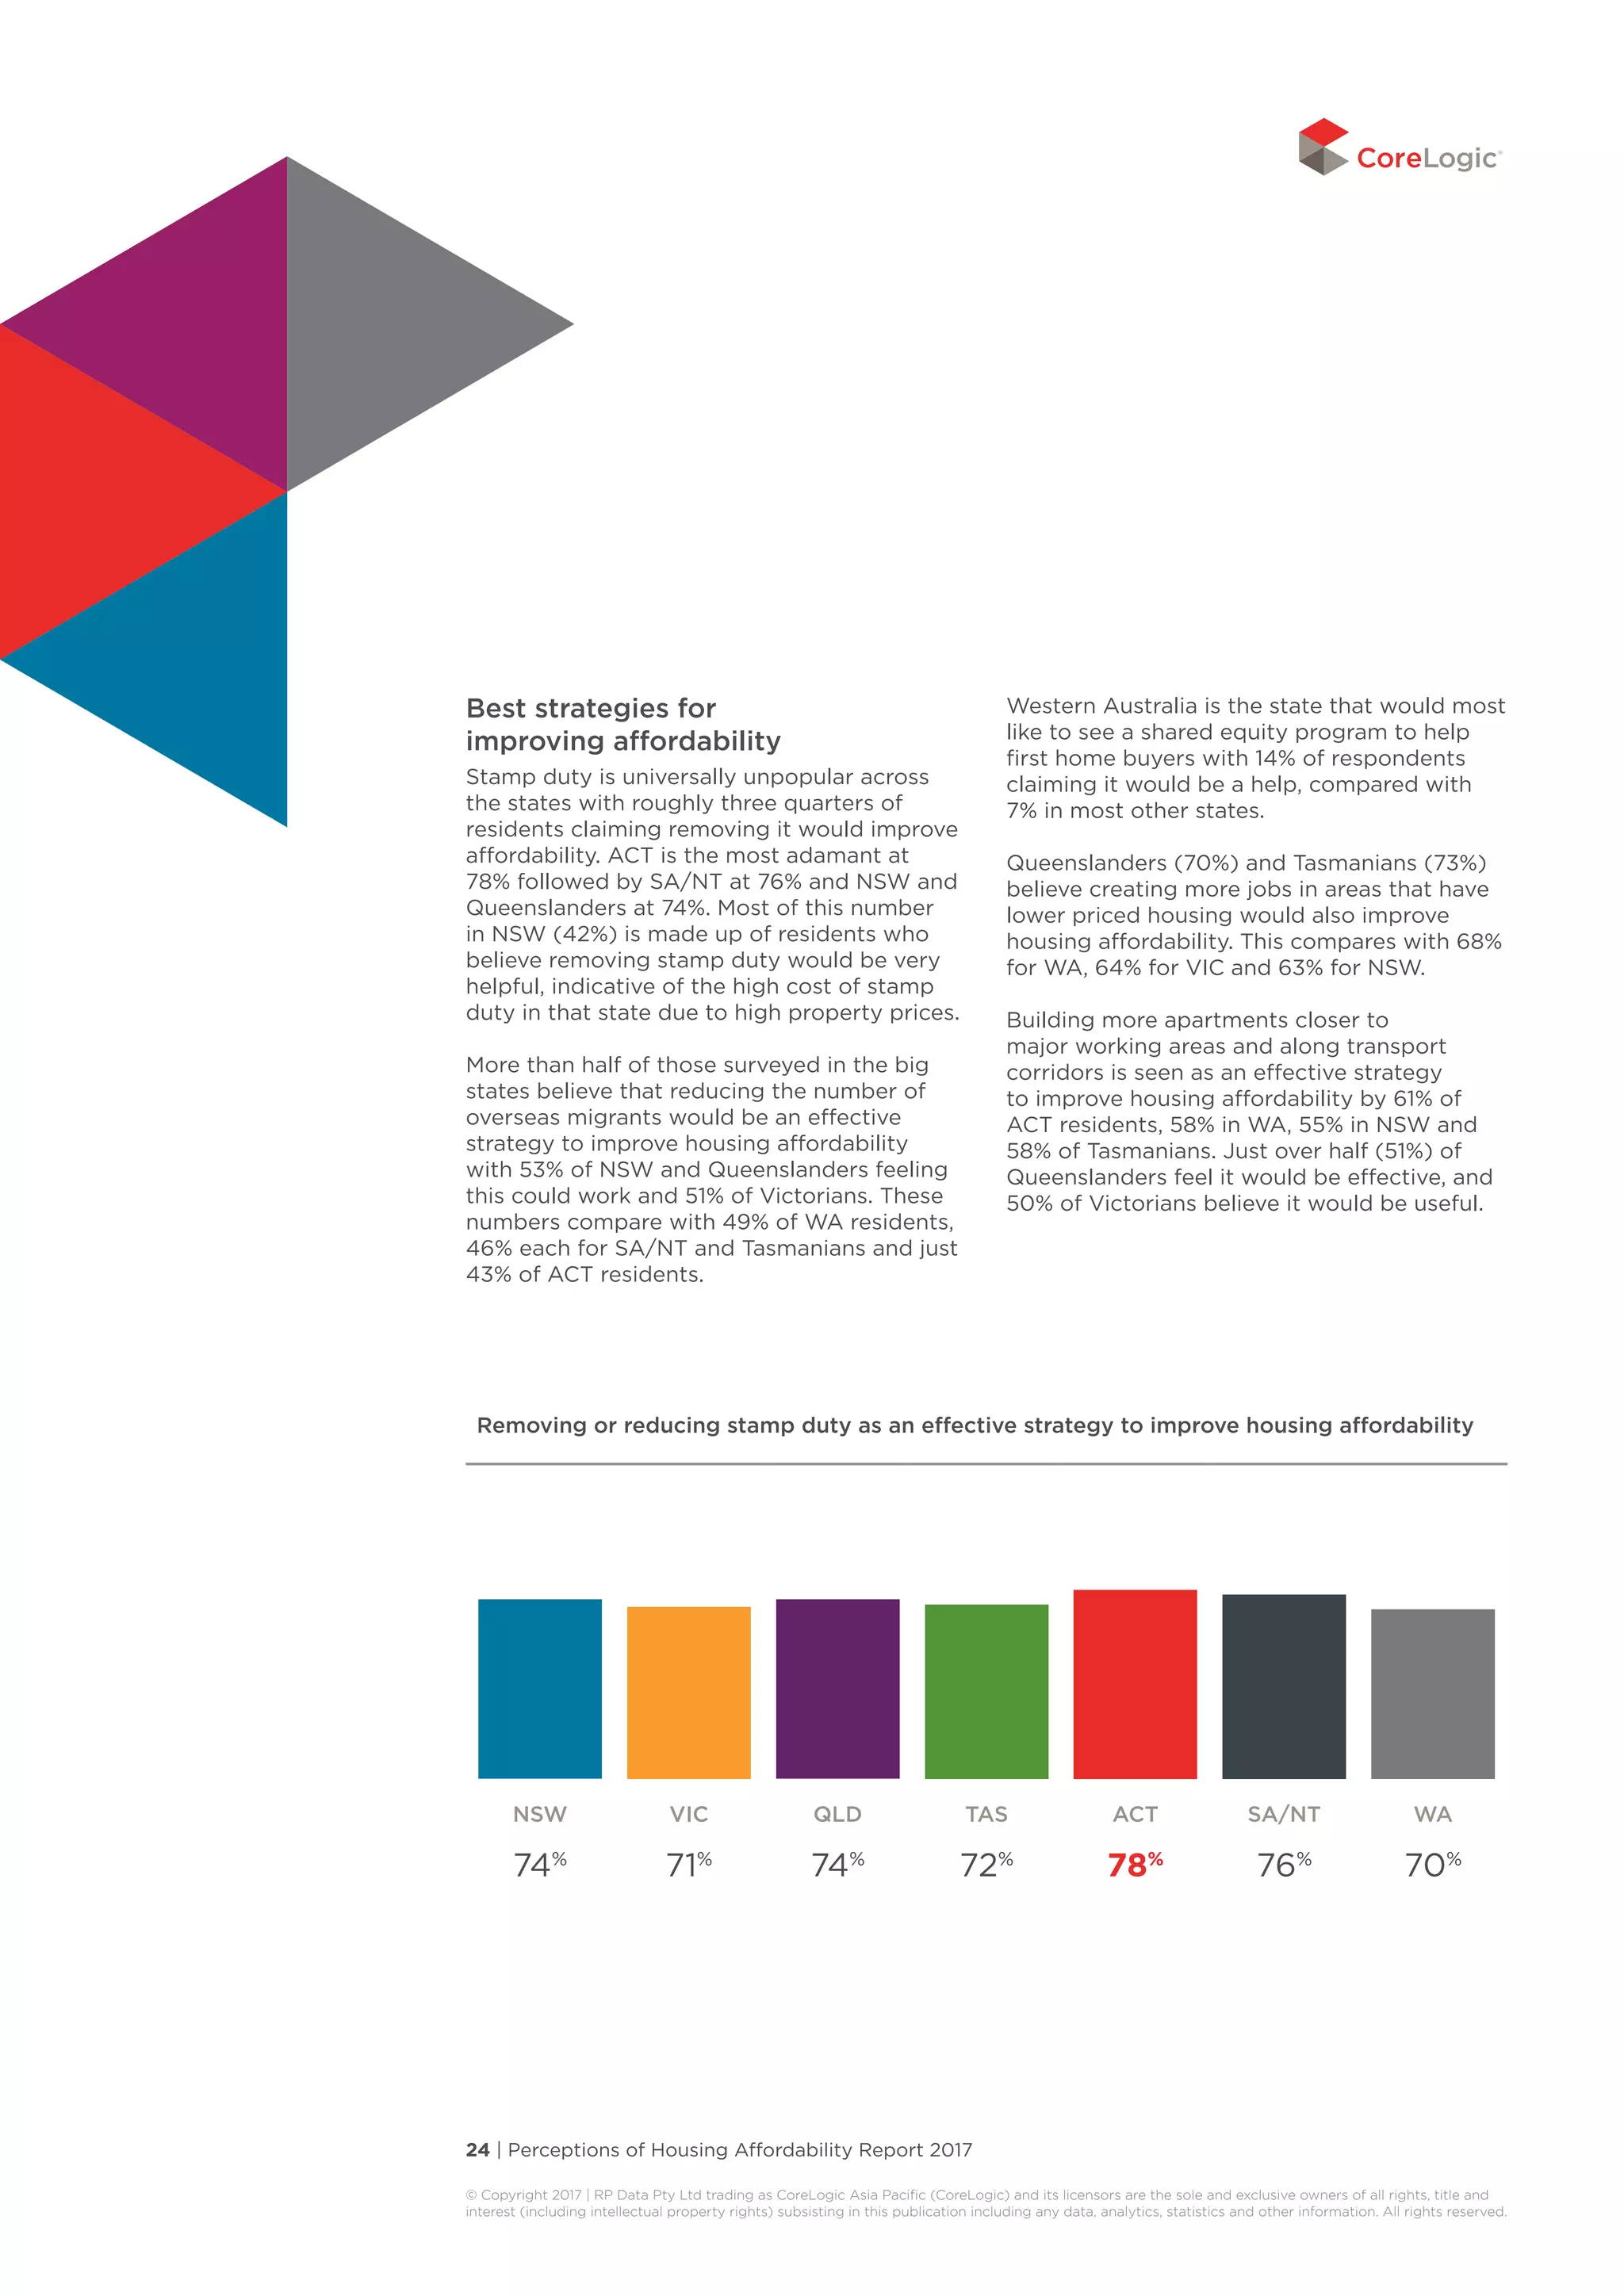
Stamp duty is universally unpopular across
the states with roughly three quarters of
residents claiming removing it would improve
affordability. ACT is the most adamant at
78% followed by SA/NT at 76% and NSW and
Queenslanders at 74%. Most of this number
in NSW (42%) is made up of residents who
believe removing stamp duty would be very
helpful, indicative of the high cost of stamp
duty in that state due to high property prices.
More than half of those surveyed in the big
states believe that reducing the number of
overseas migrants would be an effective
strategy to improve housing affordability
with 53% of NSW and Queenslanders feeling
this could work and 51% of Victorians. These
numbers compare with 49% of WA residents,
46% each for SA/NT and Tasmanians and just
43% of ACT residents.
Western Australia is the state that would most
like to see a shared equity program to help
first home buyers with 14% of respondents
claiming it would be a help, compared with
7% in most other states.
Queenslanders (70%) and Tasmanians (73%)
believe creating more jobs in areas that have
lower priced housing would also improve
housing affordability. This compares with 68%
for WA, 64% for VIC and 63% for NSW.
Building more apartments closer to
major working areas and along transport
corridors is seen as an effective strategy
to improve housing affordability by 61% of
ACT residents, 58% in WA, 55% in NSW and
58% of Tasmanians. Just over half (51%) of
Queenslanders feel it would be effective, and
50% of Victorians believe it would be useful.
Removing or reducing stamp duty as an effective strategy to improve housing affordability
NSW VIC QLD TAS ACT SA/NT WA
74%
71%
74%
72%
78%
76%
70%
Perceptions of Housing Affordability Report 2017 | 25
© Copyright 2017 | RP Data Pty Ltd trading as CoreLogic Asia Pacific (CoreLogic) and its licensors are the sole and exclusive owners of all rights, title and
interest (including intellectual property rights) subsisting in this publication including any data, analytics, statistics and other information. All rights reserved.
The research shows that 43% of investors
own their home mortgage free, while 41% of
investors own a home but are paying it off
with a mortgage. Only 11% of those who own
an investment property are renting, while 5%
live with parents.
Not surprisingly, only 25% of people who
own an investment property believe that
negative gearing is an impediment to housing
affordability while 31% of those surveyed
believe it is not an impediment at all.
Investment properties are also more likely to
be owned by families with children living at
home. The survey showed 22% of those with
children aged 5 to 17 owned an investment
property followed by 18% of those with very
young children aged 0 to 4 and 17% of those
with children 18+, indicating that property is
an important family investment strategy.
a. The investor landscape
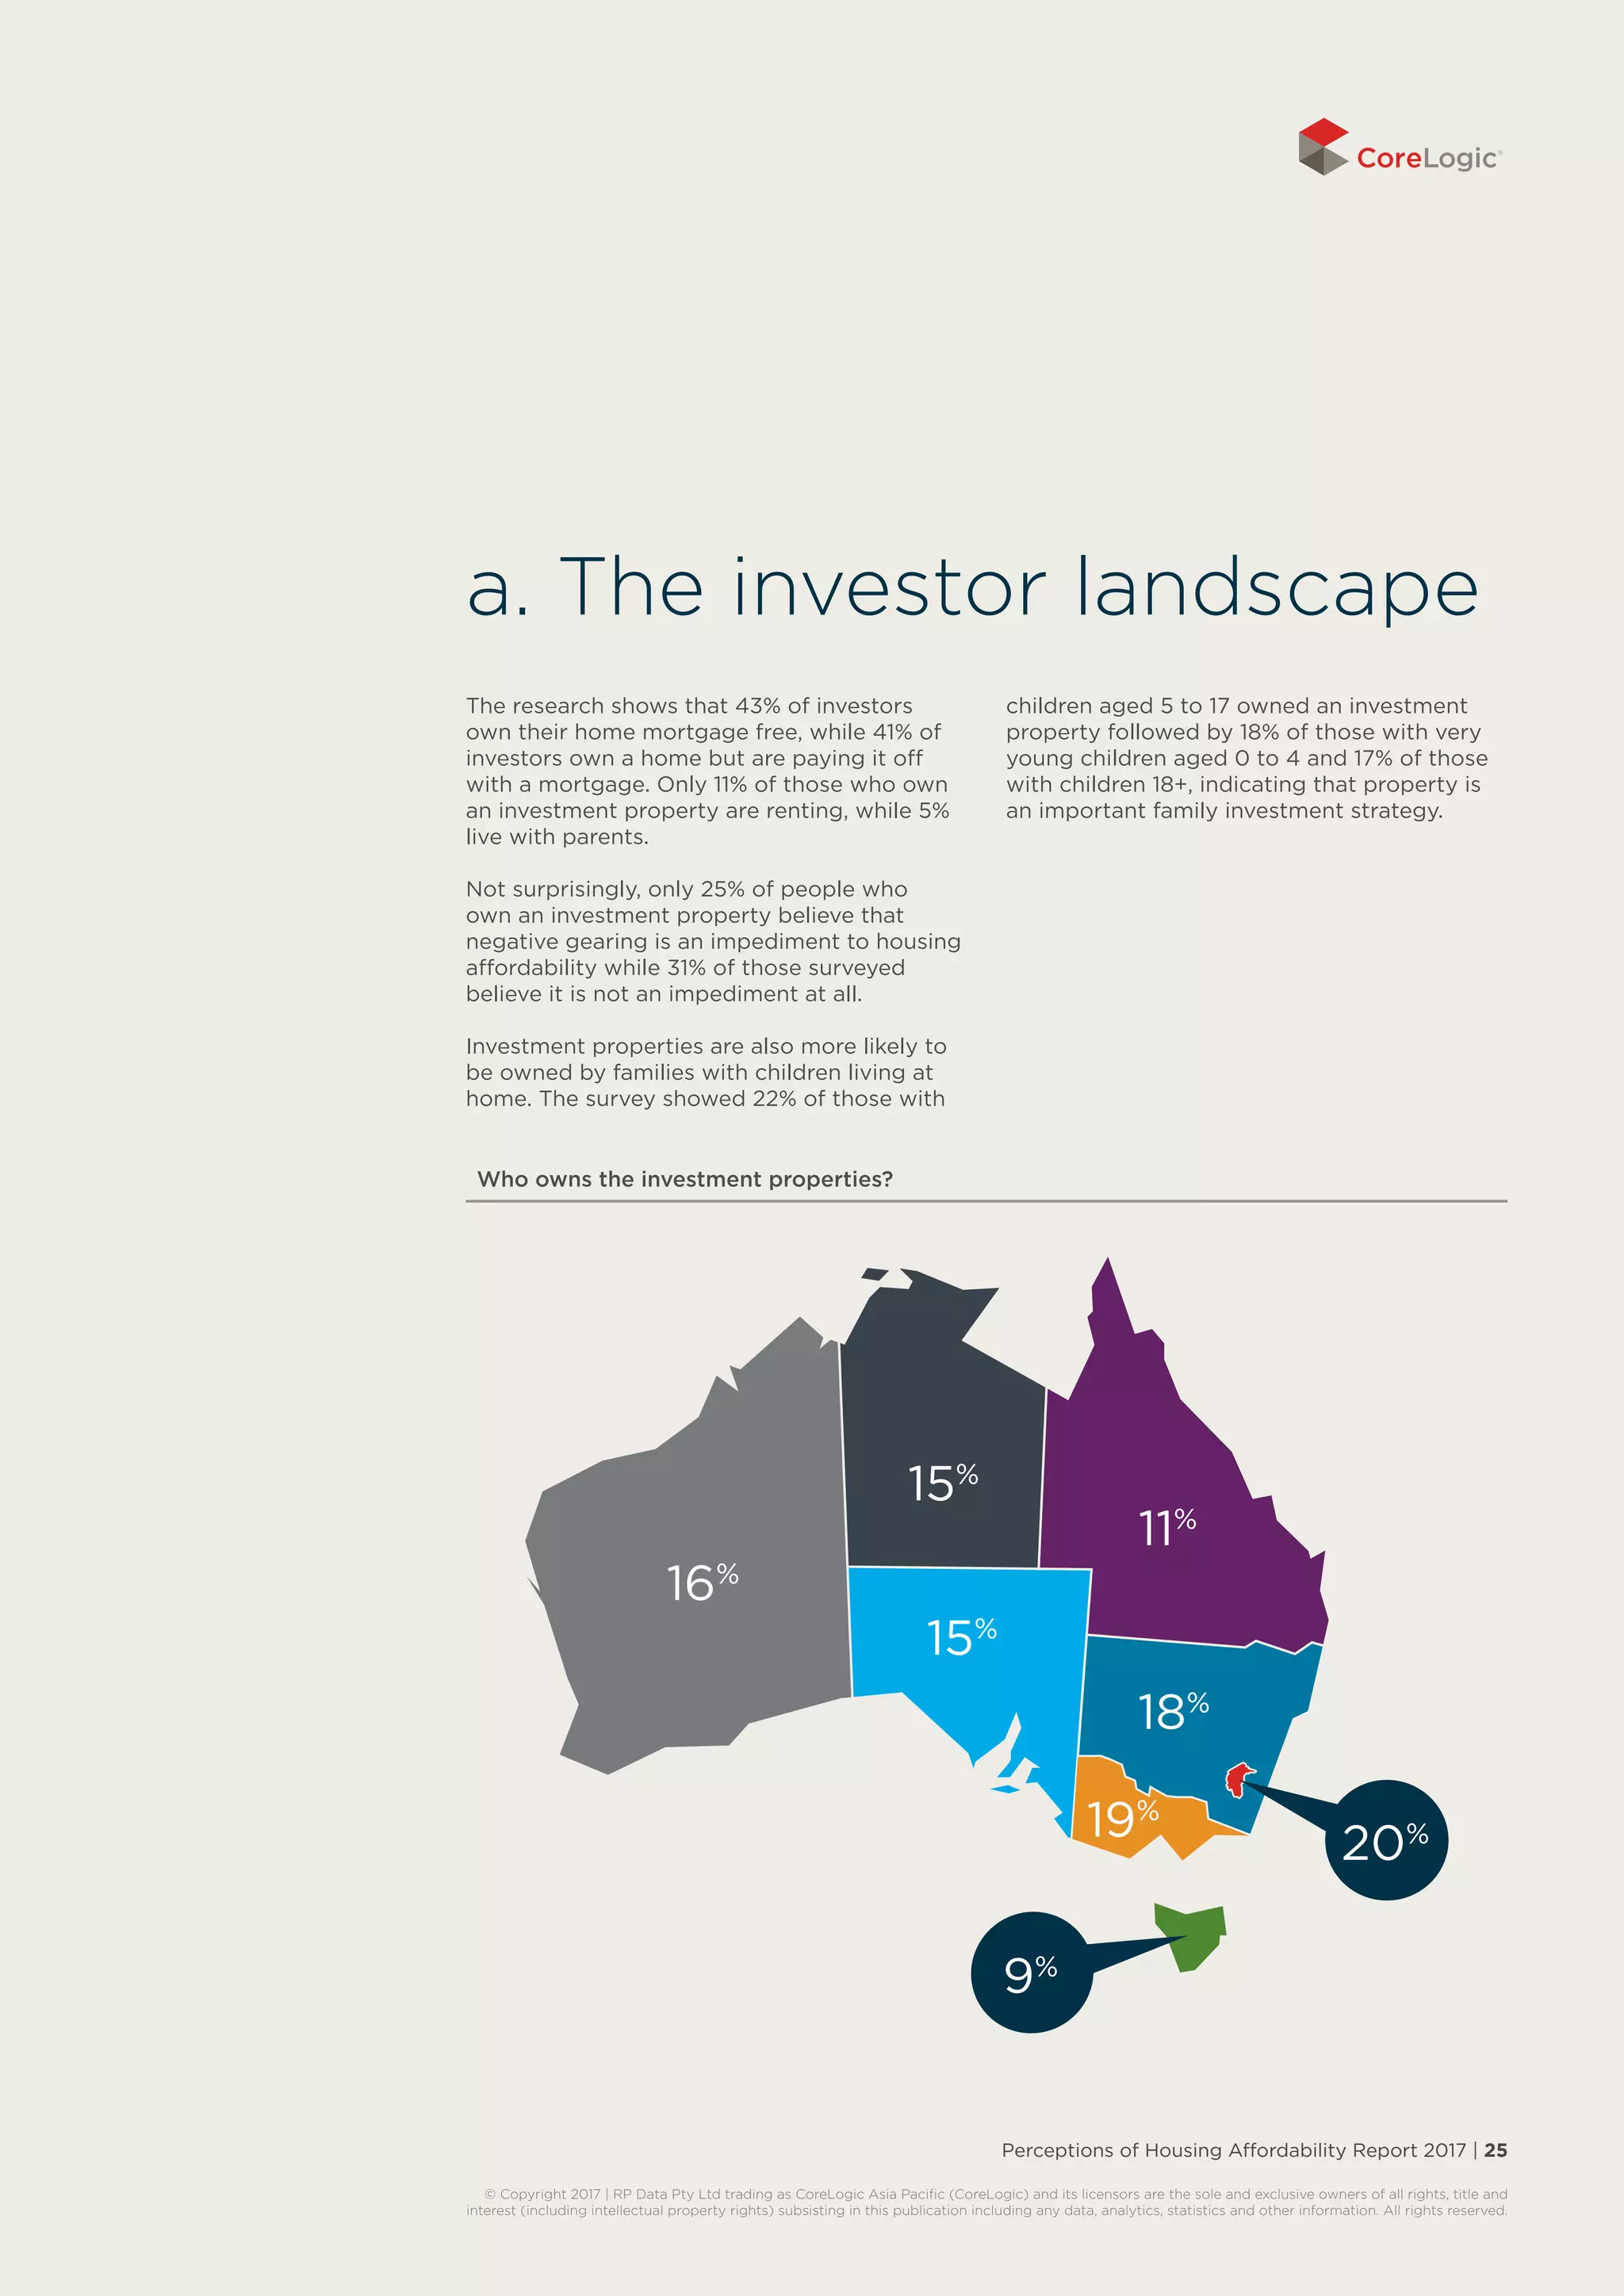
Who owns the investment properties?
20%
18%
11%
15%
15%
16%
9%
19%
26 | Perceptions of Housing Affordability Report 2017
© Copyright 2017 | RP Data Pty Ltd trading as CoreLogic Asia Pacific (CoreLogic) and its licensors are the sole and exclusive owners of all rights, title and
interest (including intellectual property rights) subsisting in this publication including any data, analytics, statistics and other information. All rights reserved. 
Generational
attitudes towards
housing affordability
How the generations compare:
Within the survey, respondents were broken
down into three generational categories. The
youngest were Millennials aged 18-34, Gen X
aged 34-49 and Baby Boomers aged 50-64.
Their responses identified some significant
differences in both the level of home
ownership and the degree to which it
was likely to be obtained. There were also
differences in opinion between the issues
that each generation believed were making
housing affordability difficult and the
measures best to address it.
The difference in levels of property ownership
across the generations was marked with
34% of Millennials currently owning property,
jumping to 62% of Gen X and 68% of Baby
Boomers. The more mature generations
of Gen X and Baby Boomers have had the
benefits of substantial equity creation,
particularly benefiting from the strong
housing market growth cycles that occurred
between 2000 to 2003 (when capital city
dwelling values rose +74%), 2006 to 2007
(when capital city dwelling values rose +22%)
and 2009 to 2010 (growth of +20%) as well as
the current cycle of growth where capital city
dwellings are now 49.3% higher.7
Perhaps unsurprisingly given the amount of
time they have had to pay off a mortgage,
Baby Boomers were most likely to own a
property outright (37%) compared with 13%
for Gen X and 9% for Millennials.
Within the survey, 44% of the Millennials
worked full time, while 55% of Gen X and
37% of Baby Boomers worked full time. Baby
Boomers were the most likely not to work
with 41% currently not working at all, which
is most likely indicative of retirement at the
higher end of the age bracket.
Millennials were least likely to own a home
with 60% stating they had never owned a
property. Millennials were most likely to rent
(38%) or live with parents (27%). A small
proportion – 12% - owned an investment
property.
About a third (31%) of Gen X rent or lease
while 15% are likely to live at home. Meanwhile
28% of Baby Boomers rent or lease and 1%
live at home.
The proportion of Gen X and Baby Boomers
who own an investment property are 19% and
18% respectively.
How important is home ownership?
The survey shows that while home ownership
is overwhelmingly important across the
generations, the degree of that importance
drops off somewhat with age.
Of the Millennials who are either renting or
living at home, 96% stated it was important
with 61% stating it was very important while
87% of Gen X stated it was important (53%
stating it was very important). Although also
in a significant majority, just 73% of Baby
Boomers stated that home ownership was
important and less than half (40%) said it was
very important.
Concern about housing affordability
The research shows that concern levels about
housing affordability are extraordinarily high
across the generations, although again, this
decreases slightly with age.
Amongst those who do not currently own a
property, 95% of Millennials are concerned to
some degree about being able to afford to
buy either their first home or their next home,
of whom 50% are very concerned.
This compares with 86% of Gen Xers, 54% of
whom are very concerned, and 72% of Baby
Boomers with 45% very concerned.
Anxiety levels remain significant even once
a property has been purchased with 91% of
Millennials concerned they will not be able to
afford their next move, compared with 77% of
Gen X and just 64% of Baby Boomers.
Millennials however are likely to be slightly
less gloomy about how housing affordability
is tracking than other generations. When
06.
7
CoreLogic 2017
Perceptions of Housing Affordability Report 2017 | 27
© Copyright 2017 | RP Data Pty Ltd trading as CoreLogic Asia Pacific (CoreLogic) and its licensors are the sole and exclusive owners of all rights, title and
interest (including intellectual property rights) subsisting in this publication including any data, analytics, statistics and other information. All rights reserved.
compared with last year, 29% of Millennials
believe housing affordability is worse now.
Older generations feel this is more the case
with 38% of Gen X feeling affordability is
worse now than it was a year ago and 40% of
Baby Boomers believing it to be the case.
Gloominess about affordability into the
future likewise increases with age with 54%
of Millennials believing housing affordability
will be even worse to some degree next year
compared with 59% of Generation X and 64%
of Baby Boomers.
What are the obstacles to housing
affordability?
The obstacles to housing affordability
are perceived very differently across the
generations especially across the headline
issues of stamp duty and foreign investment.
Millennials are least likely to see foreign
investors as an impediment to housing
affordability with just 17% stating they were
a huge impediment in comparison to 26% of
Gen X and 31% Baby Boomers. Similarly, only
13% of Millennials found stamp duty a huge
impediment compared with 23% of Gen X and
29% of Baby Boomers.
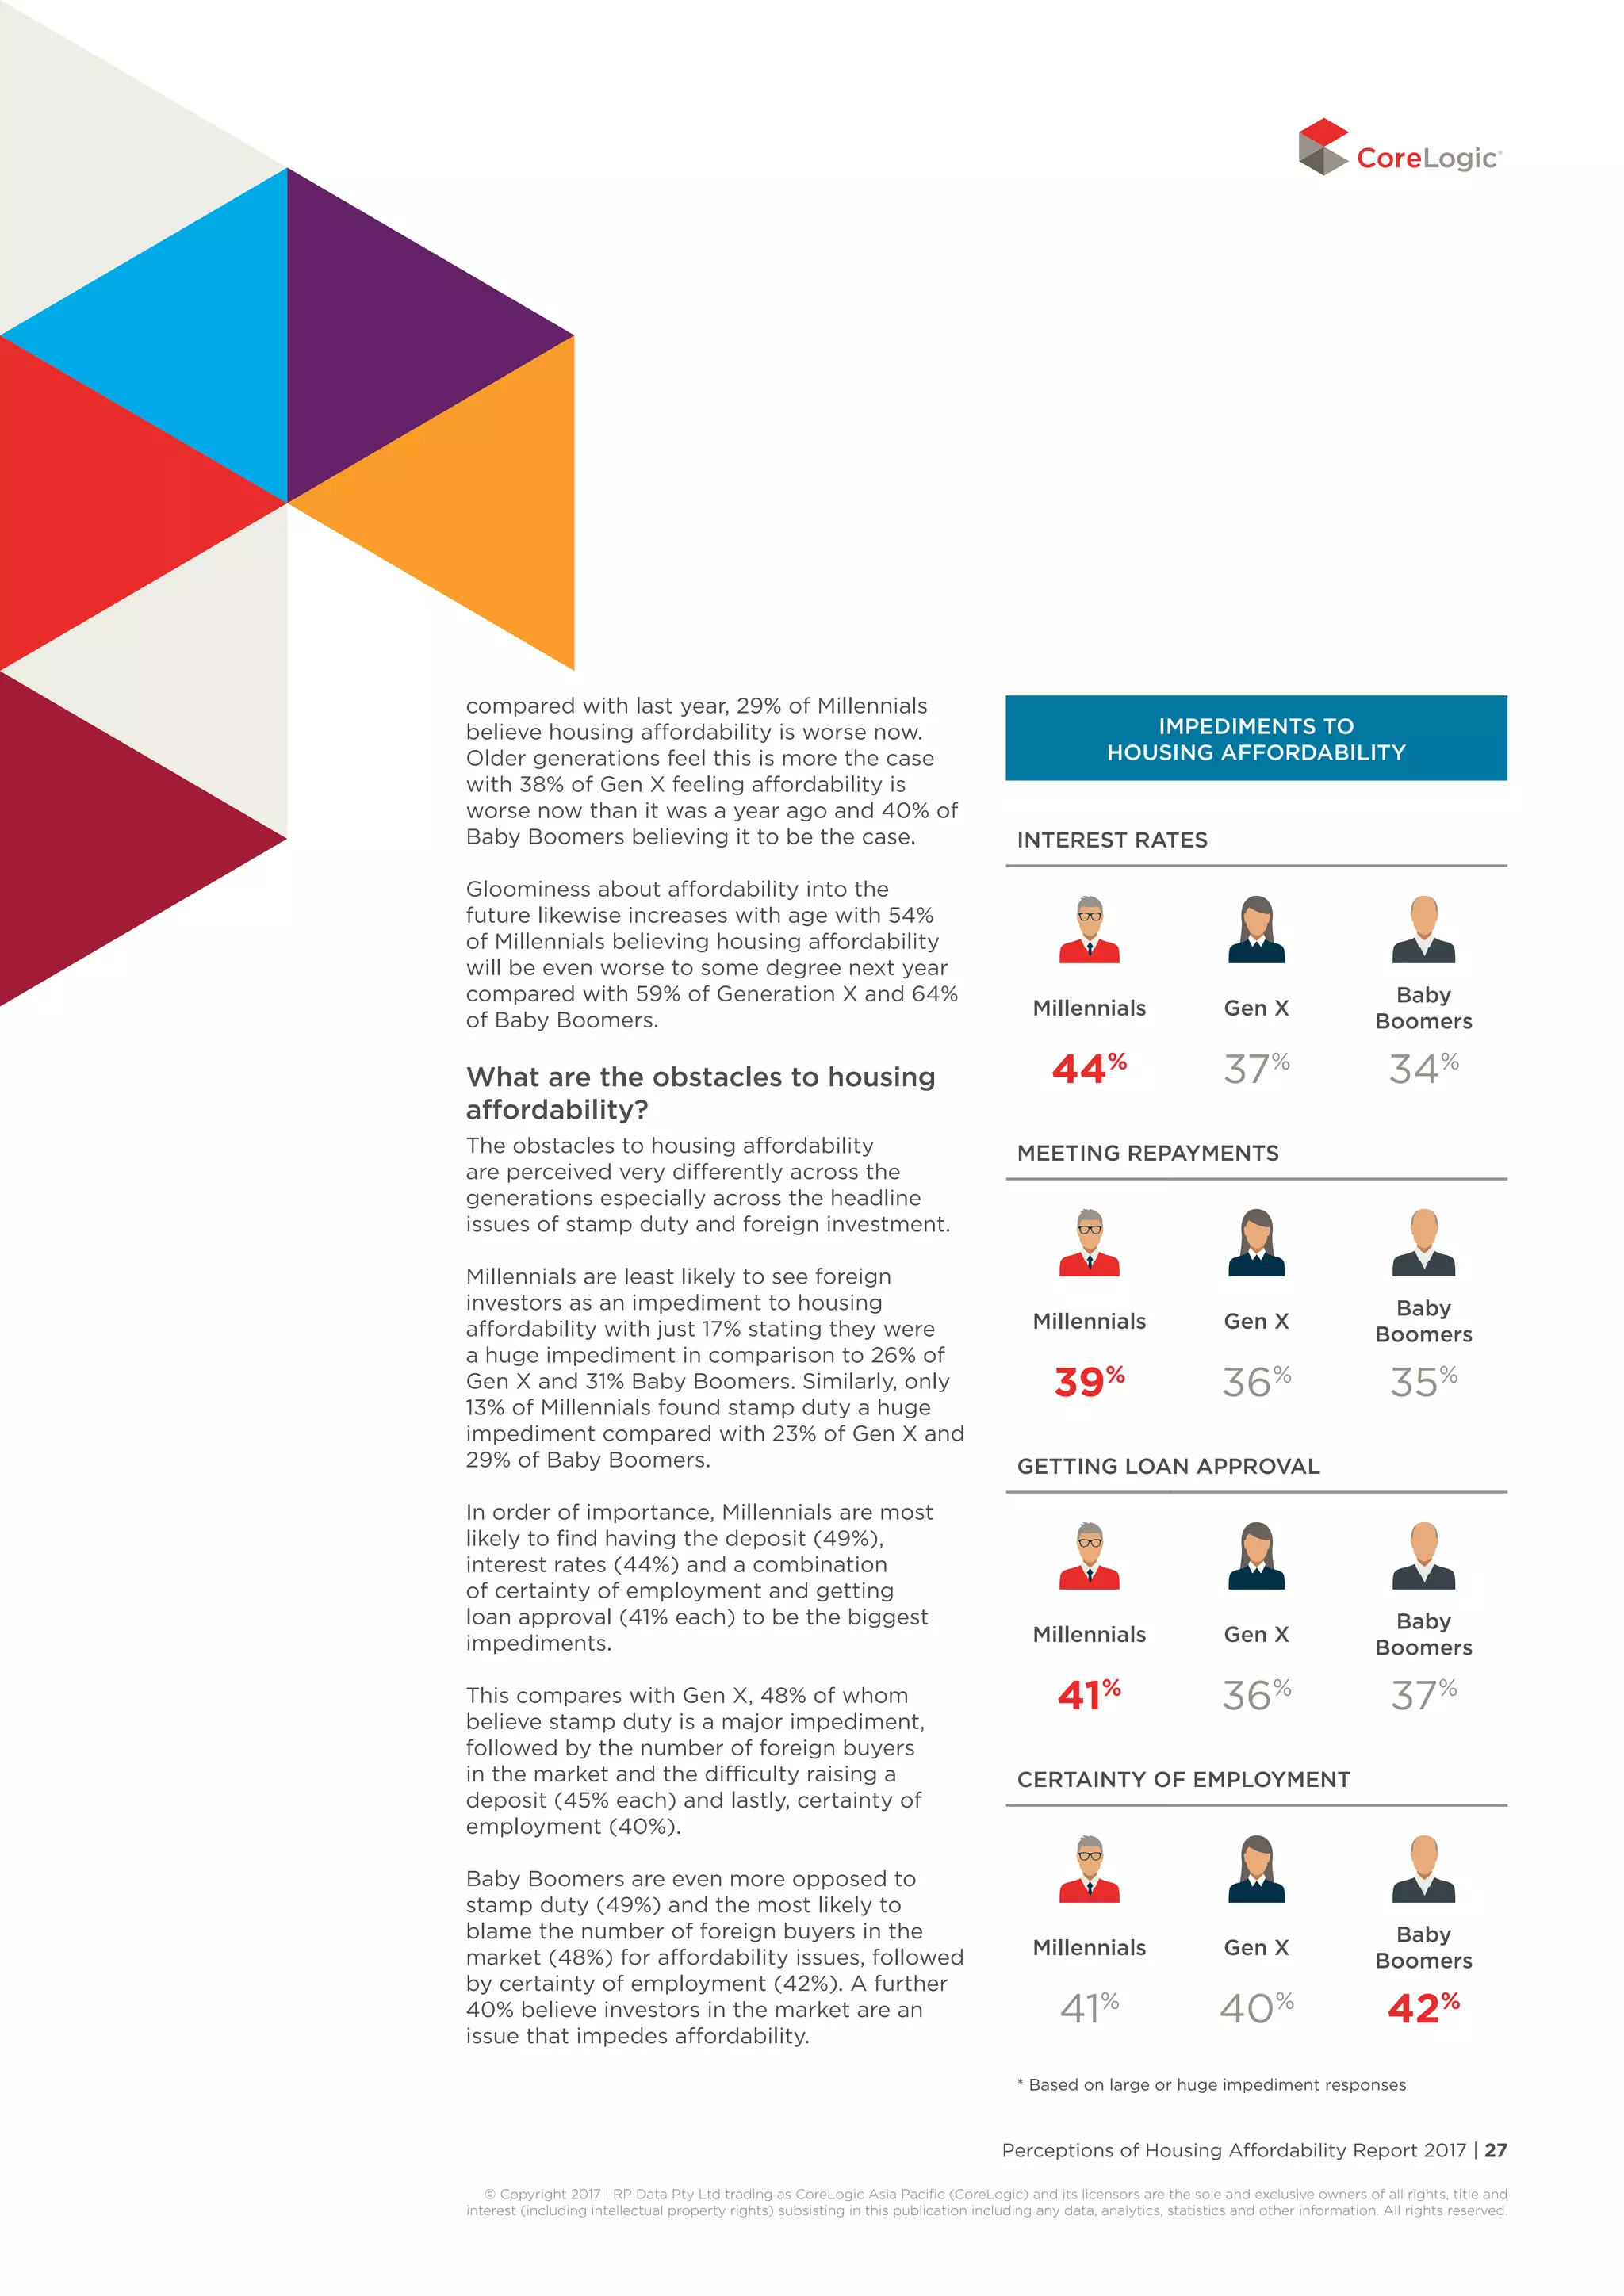
In order of importance, Millennials are most
likely to find having the deposit (49%),
interest rates (44%) and a combination
of certainty of employment and getting
loan approval (41% each) to be the biggest
impediments.
This compares with Gen X, 48% of whom
believe stamp duty is a major impediment,
followed by the number of foreign buyers
in the market and the difficulty raising a
deposit (45% each) and lastly, certainty of
employment (40%).
Baby Boomers are even more opposed to
stamp duty (49%) and the most likely to
blame the number of foreign buyers in the
market (48%) for affordability issues, followed
by certainty of employment (42%). A further
40% believe investors in the market are an
issue that impedes affordability.
IMPEDIMENTS TO
HOUSING AFFORDABILITY
INTEREST RATES
Millennials Gen X
Baby
Boomers
44%
37%
34%
MEETING REPAYMENTS
Millennials Gen X
Baby
Boomers
39%
36%
35%
GETTING LOAN APPROVAL
Millennials Gen X
Baby
Boomers
41%
36%
37%
CERTAINTY OF EMPLOYMENT
Millennials Gen X
Baby
Boomers
41%
40%
42%
* Based on large or huge impediment responses
28 | Perceptions of Housing Affordability Report 2017
© Copyright 2017 | RP Data Pty Ltd trading as CoreLogic Asia Pacific (CoreLogic) and its licensors are the sole and exclusive owners of all rights, title and
interest (including intellectual property rights) subsisting in this publication including any data, analytics, statistics and other information. All rights reserved. 
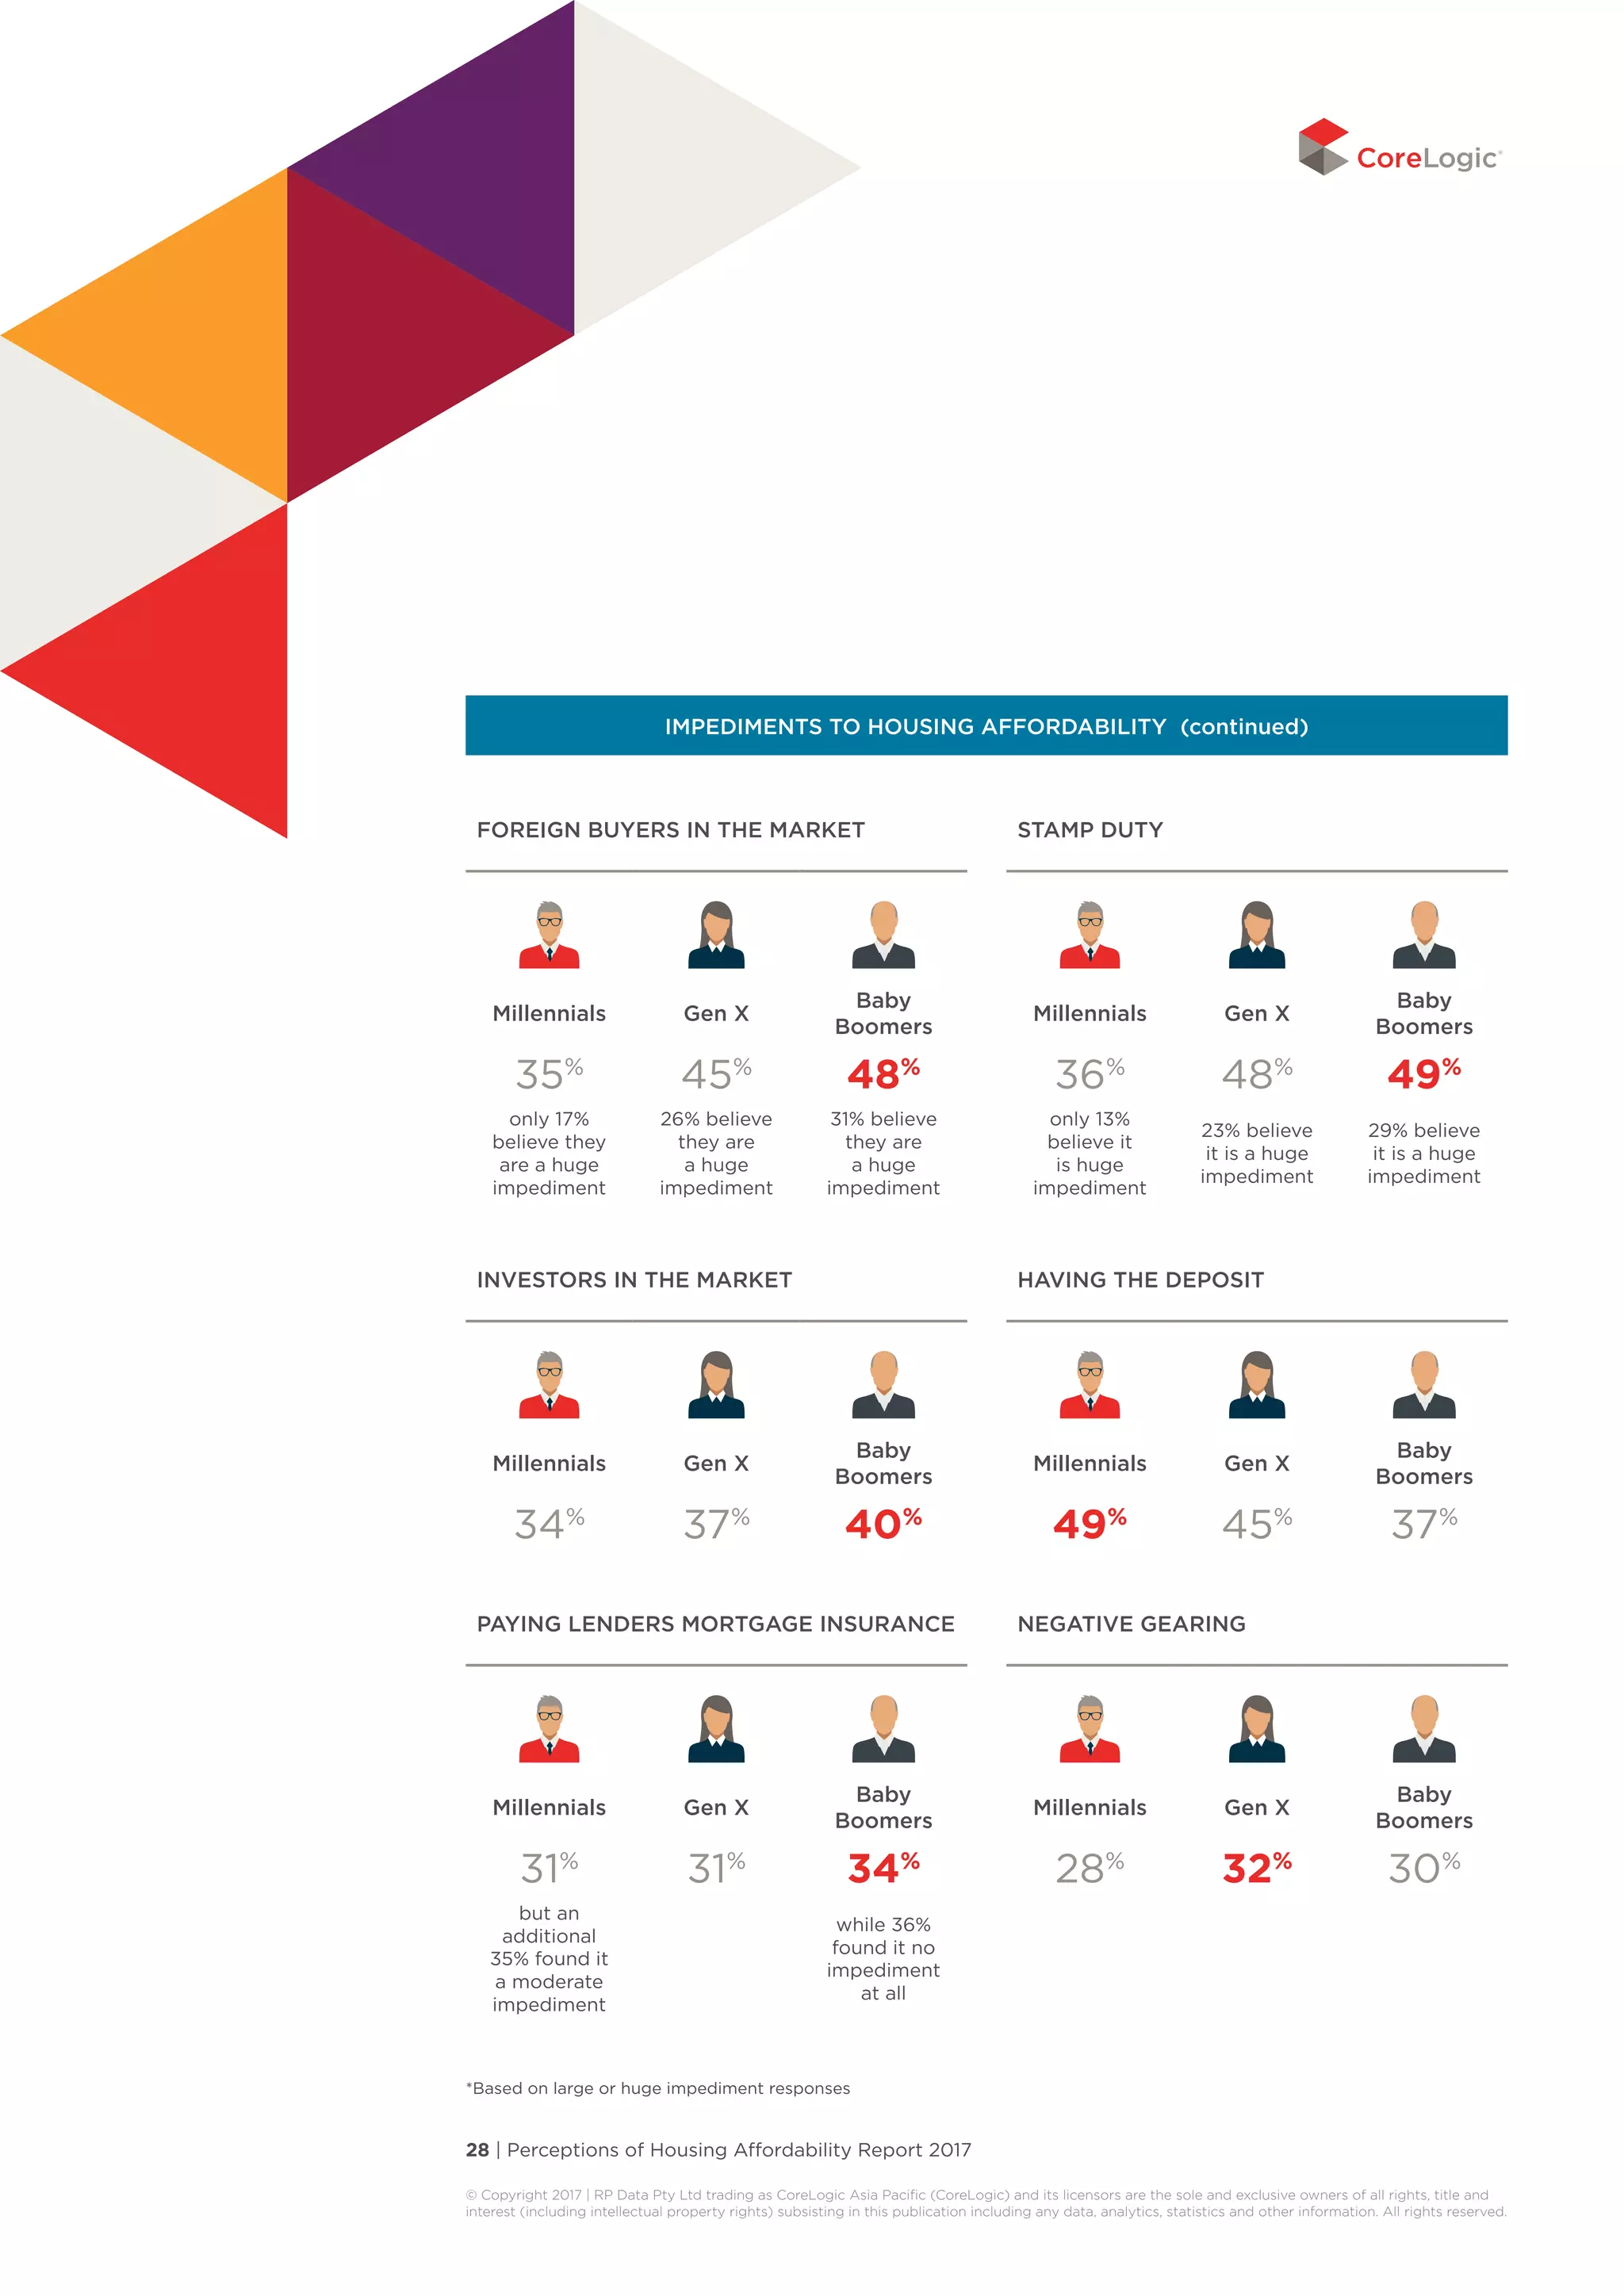
FOREIGN BUYERS IN THE MARKET
Millennials Gen X
Baby
Boomers
35%
45%
48%
only 17%
believe they
are a huge
impediment
26% believe
they are
a huge
impediment
31% believe
they are
a huge
impediment
INVESTORS IN THE MARKET
Millennials Gen X
Baby
Boomers
34%
37%
40%
PAYING LENDERS MORTGAGE INSURANCE
Millennials Gen X
Baby
Boomers
31%
31%
34%
but an
additional
35% found it
a moderate
impediment
while 36%
found it no
impediment
at all
STAMP DUTY
Millennials Gen X
Baby
Boomers
36%
48%
49%
only 13%
believe it
is huge
impediment
23% believe
it is a huge
impediment
29% believe
it is a huge
impediment
HAVING THE DEPOSIT
Millennials Gen X
Baby
Boomers
49%
45%
37%
NEGATIVE GEARING
Millennials Gen X
Baby
Boomers
28%
32%
30%
IMPEDIMENTS TO HOUSING AFFORDABILITY (continued)
*Based on large or huge impediment responses
Perceptions of Housing Affordability Report 2017 | 29
© Copyright 2017 | RP Data Pty Ltd trading as CoreLogic Asia Pacific (CoreLogic) and its licensors are the sole and exclusive owners of all rights, title and
interest (including intellectual property rights) subsisting in this publication including any data, analytics, statistics and other information. All rights reserved.
Selection factors and concessions to
enable home ownership
Price was the most important factor across
the generations when selecting where to
buy although it was most important to Baby
Boomers (83%) compared with Millennials
(75%).
Proximity to work was the second most
important category with 52% of Millennials
prioritising this, compared with 44% of Gen
X and 37% of Baby Boomers. The third most
important factor when selecting where to buy
was distance to the city, which was important
to 40% of Gen X, 38% of Millennials and 33%
of Baby Boomers.
Public transport to and from work was
important to 43% of Gen X and 42% of
Millennials, but just 32% of Baby Boomers. In
comparison, Baby Boomers felt that being
near infrastructure such as hospitals was more
important (49%) and having good public
transport to the city (44%) was important.
To achieve the dream of ownership, 46% of
Millennials who currently rent are prepared
to dedicate between 30-50% of their gross
household income to servicing a mortgage.
This compares with 42% of Gen X and 36% of
Baby Boomers.
Millennials are also more likely to consider
buying a property with family or friends
with 24% saying they would consider this
compared with just 13% of Gen X and 12% of
Baby Boomers.
Baby Boomers meantime are more likely
to consider moving to a regional town to
purchase a property (30%) in comparison
to 21% of Millennials and 22% of Gen X.
Millennials however will consider moving to
a less desirable suburb with 25% prepared to
make this concession compared with just 17%
of Baby Boomers.
Millennials who rent or lease are significantly
more likely to consider an investment
property than other generations with 51%
stating they would definitely (20%) or
possibly (31%) buy something they would not
personally live in first compared with just 33%
of Gen X (8% definitely) and 24% of Baby
Boomers (5% definitely).
30 | Perceptions of Housing Affordability Report 2017
© Copyright 2017 | RP Data Pty Ltd trading as CoreLogic Asia Pacific (CoreLogic) and its licensors are the sole and exclusive owners of all rights, title and
interest (including intellectual property rights) subsisting in this publication including any data, analytics, statistics and other information. All rights reserved. 
8
RBA 13 April 2017
Affordability and payment stress
With raising the deposit identified as one
of the biggest hurdles for Millennials, it is
probably not surprising that this generation
is most likely to seek help from a family
member, with 21% saying they would
approach parents. This compares with 17% for
Gen X and just 9% for Baby Boomers. Gen X
(32%) were most likely to find an inheritance
a help to buying, compared with 22% of
Millennials and 27% of Baby Boomers.
Across the generations, the maximum
deposit that could be paid by those who are
currently renting is between 0-9% with 29%
of Millennials saying this is affordable, 43% of
Gen X and 43% of Baby Boomers.
This compares with 27% of Millennials who
state they could raise between 10-19% as a
deposit as do 28% of Gen X and 14% of Baby
Boomers. Only 12% of Millennials, 11% of Gen
X and 10% of Baby Boomers who are renting
say they could afford between 20-29% as a
deposit.
The findings of the report support recent
Reserve Bank of Australia figures8
that
identified mortgage stress amongst those
who already own property and confirms
that the younger generation is the most
vulnerable.
Baby Boomers (10%) are most likely to
already be struggling to pay their existing
mortgage, followed by 8% for Millennials and
6% for Gen X. However Millennials overtake
considerably once future interest rate rises
of up to 1% are taken into account with 35%
of Millennials claiming this would make them
struggle, compared with 23% of Gen X and
27% of Baby Boomers.
Should interest rates increase between 1.5%
and 2.0%, the research shows a total of 66%
of Millennials struggling to pay, compared
with a total of 47% of Gen X and 48% of Baby
Boomers.
Best strategies for improving
housing affordability
Millennials are the most likely (68%) to
believe that a well-paying and secure job is
the greatest help when buying a first home
compared with 58% of Gen X and 49% of
Baby Boomers.
Baby Boomers it seems dislike stamp duty
more than any generation and believe it is
an impediment. The research shows 80% of
Baby Boomers said the reduction or removal
of stamp duty for first home buyers would be
helpful compared with 69% of Millennials -
arguably those who would be most affected
by any change - and 71% of Gen X.
Baby Boomers are also more likely than other
generations to feel that a reduction in the
number of migrants to Australia would be an
effective strategy (56%) to improve housing
affordability compared with 51% of Gen X and
47% of Millennials.
Millenninals are most likely to believe that
the appointment of a federal housing
minister responsible for addressing housing
affordability issues nationally could be
effective with 61% of respondents claiming it
would be valuable compared with 56% of Gen
X and 53% of Baby Boomers.
REDUCING OR REMOVING STAMP DUTY WOULD BE AN EFFECTIVE STRATEGY:
Millennials Gen X Baby Boomers
69%
71%
80%
Perceptions of Housing Affordability Report 2017 | 31
© Copyright 2017 | RP Data Pty Ltd trading as CoreLogic Asia Pacific (CoreLogic) and its licensors are the sole and exclusive owners of all rights, title and
interest (including intellectual property rights) subsisting in this publication including any data, analytics, statistics and other information. All rights reserved.
When property owners feel constrained in
their decision to sell their property, supply
starts to dwindle and the entire property
market is affected.
Research conducted by one of Australia’s
largest real estate franchises, LJ Hooker,
identified that insecurity about finding a
new home and costs such as stamp duty are
actively discouraging property owners from
selling in the belief that the move to a new
residence will not be worth the cost.
The LJ Hooker research9
surveyed more than
2700 Australian property owners, 70% of
whom had had their property appraised by an
agent within 12 months of the survey – a sign
that they were considering selling.
However, of those who had a property
appraised, 60% did not proceed and list their
property for sale.
The survey identified that a lack of choice and
stock on the market which made it difficult
to feel confident about finding a new home
was the number one reason for not listing
with 35% of respondents identifying this as a
roadblock.
Transactional costs involved in buying
and selling were also blockers with 26% of
respondents deciding not to list their property
for sale because the cost of buying their next
home was too high due to stamp duty. A
further 18% stated that the cost of selling was
too high, taking into consideration solicitor
fees, conveyancer costs and real estate agents
commissions.
The LJ Hooker survey showed that changing
government stamp duty laws could be a
major stimulus to increasing listings. The
survey found 51% of those who didn’t list after
receiving an appraisal would do so if stamp
duty was lower, while 61% said they would list
if stamp duty was abolished altogether.
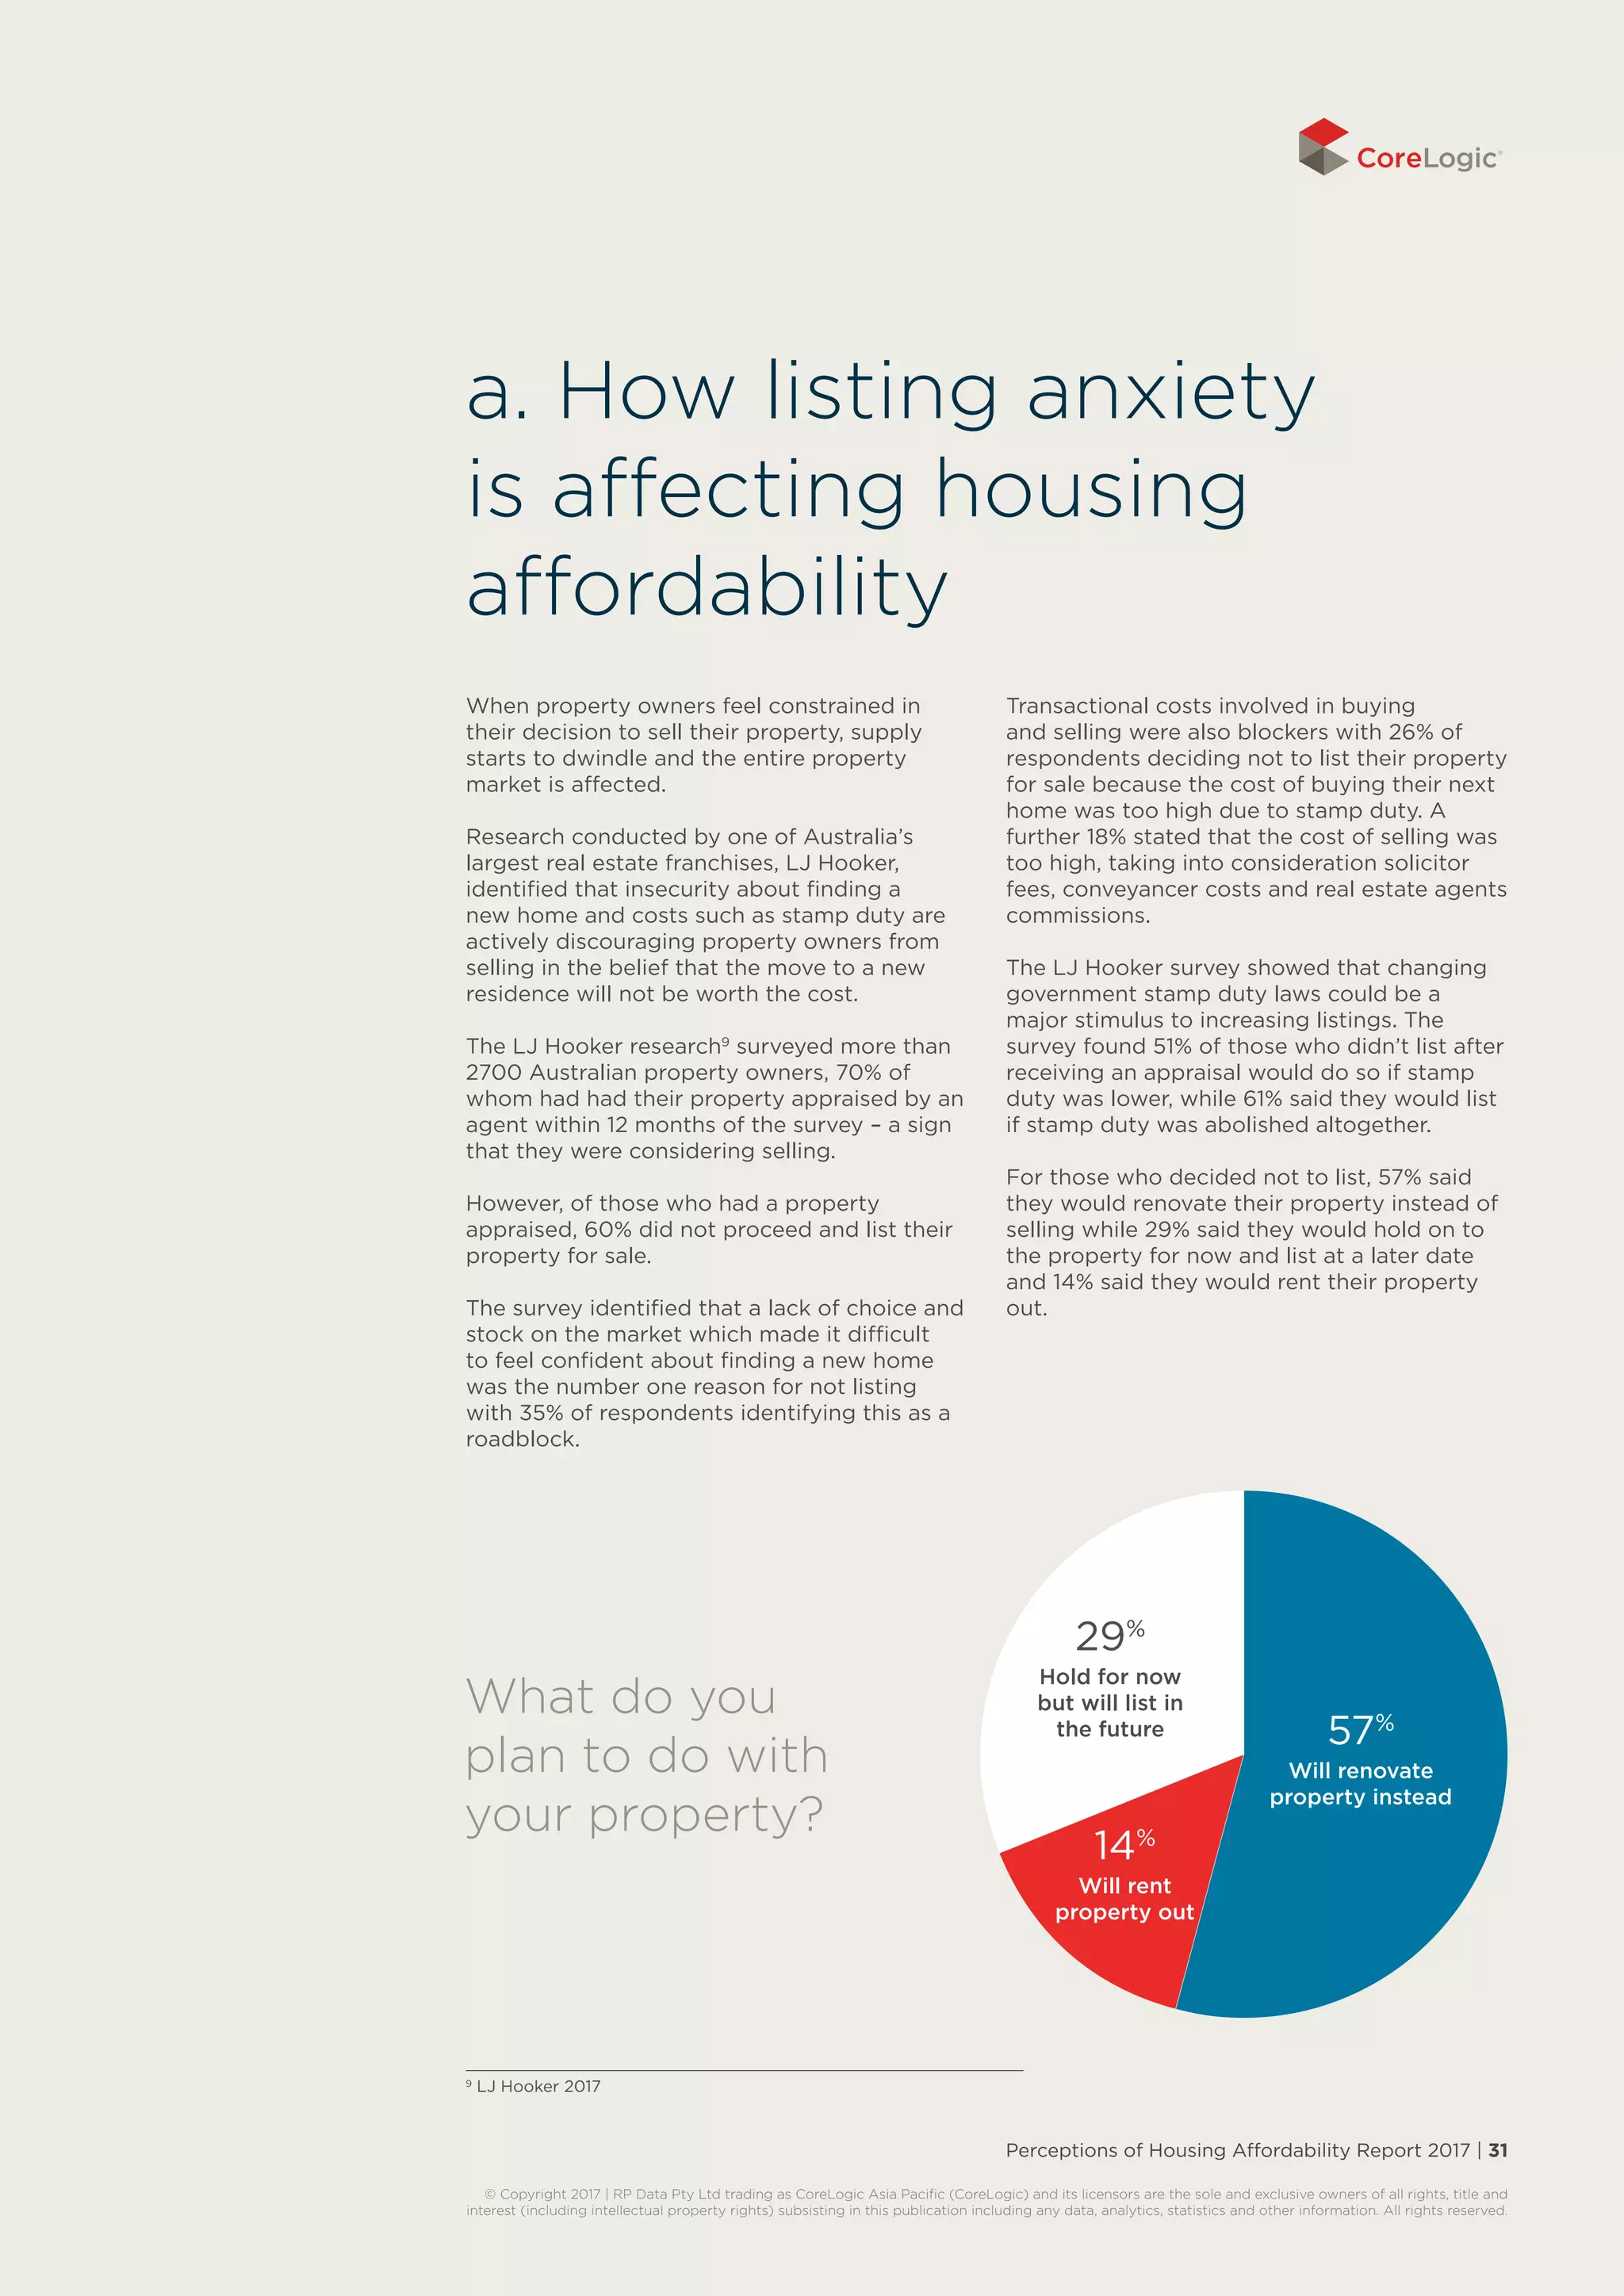
For those who decided not to list, 57% said
they would renovate their property instead of
selling while 29% said they would hold on to
the property for now and list at a later date
and 14% said they would rent their property
out.
a. How listing anxiety
is affecting housing
affordability
What do you
plan to do with
your property?
57%
Will renovate
property instead
29%
Hold for now
but will list in
the future
14%
Will rent
property out
9
LJ Hooker 2017
32 | Perceptions of Housing Affordability Report 2017
© Copyright 2017 | RP Data Pty Ltd trading as CoreLogic Asia Pacific (CoreLogic) and its licensors are the sole and exclusive owners of all rights, title and
interest (including intellectual property rights) subsisting in this publication including any data, analytics, statistics and other information. All rights reserved. 
Families, children
and housing affordability
How different family groups
compare:
Within the survey, respondents were broken
down into four styles of family. These included
those families with children aged 0 to 4 living
at home, those with children aged 5 to 17,
those with families aged 18+ and those with
no children living at home.
The survey found that the age of the children
living at home was likely to affect the
behaviours and views of affordability, with
those who had very small children more likely
to both value the importance of affordable
housing more highly, while at the same time
finding it less affordable or struggling to pay
mortgages.
Within the survey, 57% of those with children
aged 0 to 4 were current home owners, 60%
had children 5 to 17, 56% had children aged
18+ and 44% had no children at home.
The survey confirmed that families with young
children are most likely to have mortgages
with 50% of families with children aged
between 0 to 4 owning their home with
a mortgage and just 10% of families with
children this age own their homes outright.
A further 50% of families with children aged
between 5 to 17 years have mortgages while
16% own their homes outright.
The proportion of families with mortgages
drops to just 38% by the time children reach
18, and outright ownership rises to 25%, while
24% of those who have no children at home
have a mortgage and 20% own their home
outright. From here on, this section of the
report will focus on families with children at
home with observations about those without
children captured in the marital status section.
Of those families who had very small children
aged 0 to 4, 47% worked full time, compared
with 52% of those with children aged 5 to 17
and 36% of those with children aged 18+.
How important is home ownership?
Families with children at home who do not
own property are very likely to be concerned
about being able to afford a home.
Families who are currently renting and have
children at home are insistent that being
able to buy their own home is important. The
younger the children, the more important this
is regarded with 98% of families with children
0 to 4 stated it was important (71% very
important), compared with 94% of families
with children 5 to 17 (65% very important) and
90% importance for those with children 18+
(57% very important).
Concern about housing affordability
The younger the children, the greater the
concern from families that they may not be
able to afford to upgrade their property.
The survey found 84% of families with
children aged 0 to 4 who own property
currently are concerned to some degree that
they will not be able to afford to upgrade with
31% very concerned. This compares with 79%
of families with children aged 5 to 17 who
own property who expressed concern about
upgrading (with 23% of this bracket stating
they were very concerned).
By the time children are 18+, the fear eases
with 67% of families who own their own home
and have older children stating they had some
concerns, but only 16% said they were very
concerned.
Nevertheless, the older the children at home,
the gloomier the different family groups are
likely to be about the direction of housing
affordability. The survey found that while
28% of families with children aged 0 to 4 felt
that housing affordability was very much or
significantly worse now compared with last
year (with an additional 27% believing it was
slightly worse), 36% of those with children
aged 5 to 17 felt this was the case (with an
additional 26% stating it was slightly worse)
and 35% of families with children aged over
18 believing it was significantly or very much
worse (with 33% stating slightly worse).
The sentiment is very similar for the direction
07.
Perceptions of Housing Affordability Report 2017 | 33
© Copyright 2017 | RP Data Pty Ltd trading as CoreLogic Asia Pacific (CoreLogic) and its licensors are the sole and exclusive owners of all rights, title and
interest (including intellectual property rights) subsisting in this publication including any data, analytics, statistics and other information. All rights reserved.
of housing affordability next year with 26%
of families with children aged 0 to 4 feeling
it would be significantly or very much worse,
while 35% of both families with children 5 to
17 and 18+ both felt this way.
What are the obstacles to housing
affordability?
The obstacles to housing affordability are
perceived somewhat differently across
families with children of different ages,
especially across the headline issues of stamp
duty and saving for a deposit.
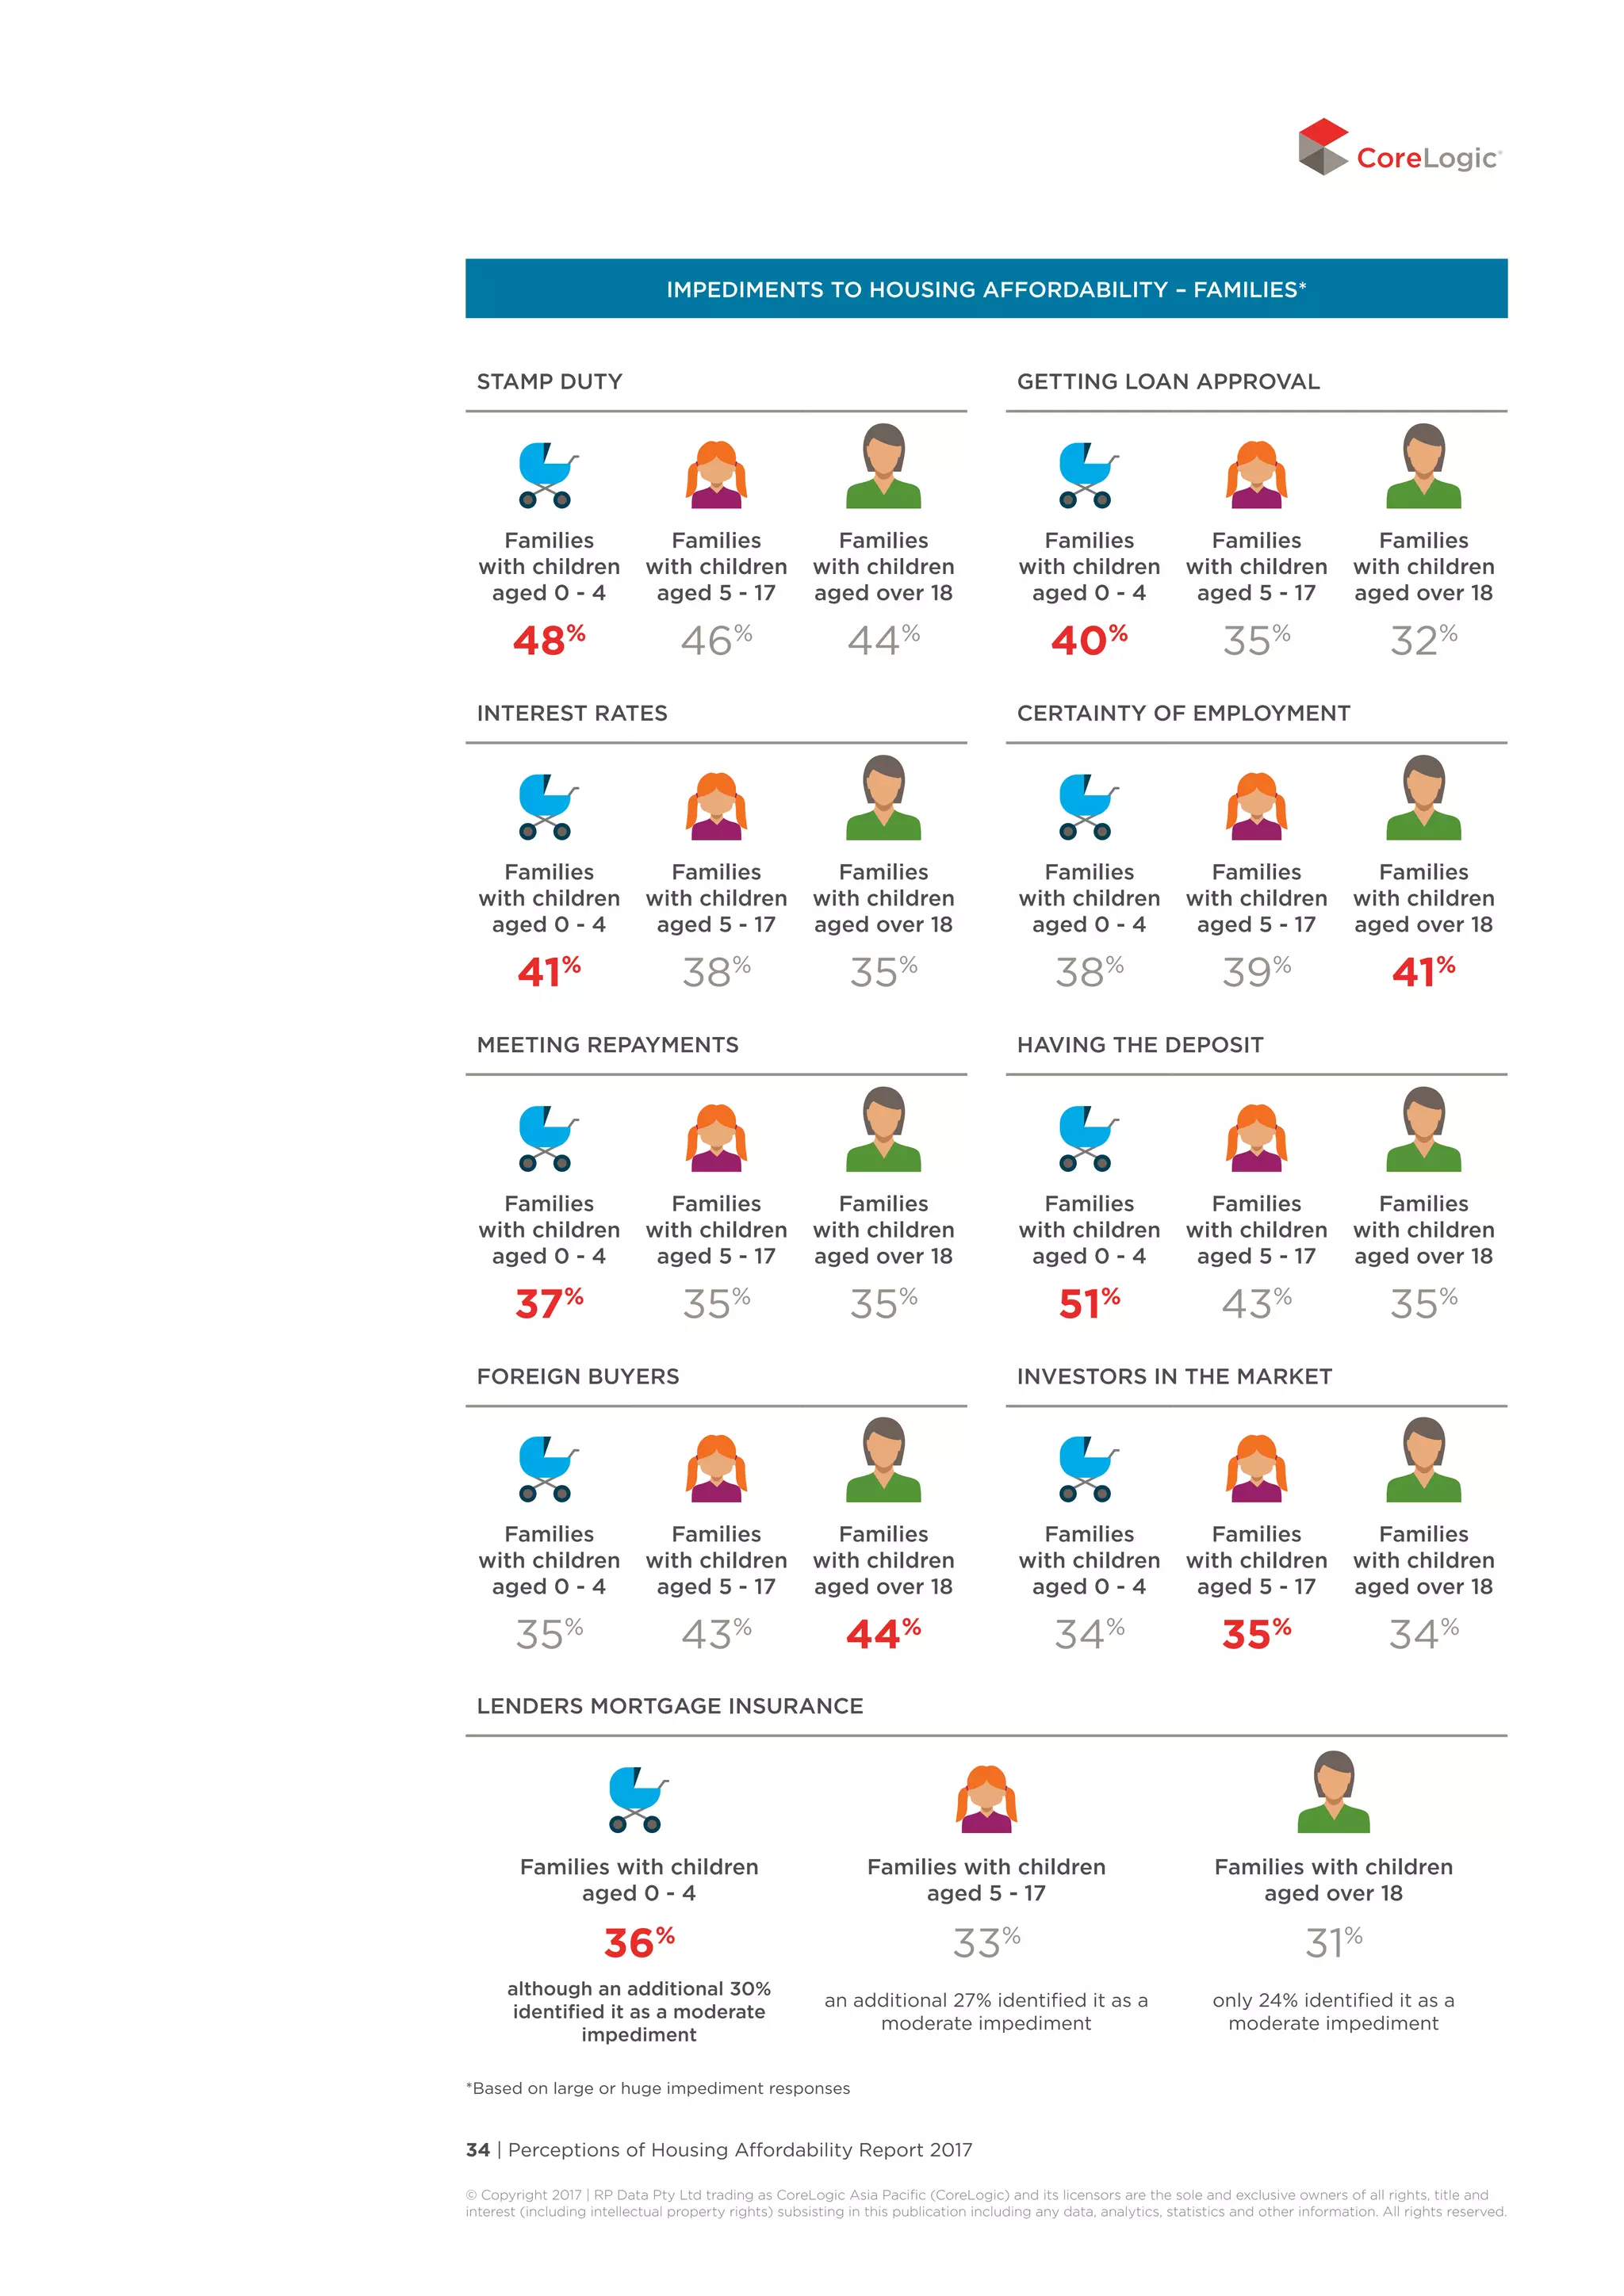
For those with children aged 0 to 4 years, the
biggest impediments to home ownership are
saving for a deposit, followed by the cost of
stamp duty and interest rates. Families with
slightly older children were most likely to find
stamp duty the biggest impediment, followed
by saving for the deposit and then certainty
of employment.
Finally, those with children over 18 were
most likely to find stamp duty and foreign
buyers the biggest impediments, followed by
certainty of employment and then a mix of
factors, including saving for a deposit, interest
rates and meeting repayments.
34 | Perceptions of Housing Affordability Report 2017
© Copyright 2017 | RP Data Pty Ltd trading as CoreLogic Asia Pacific (CoreLogic) and its licensors are the sole and exclusive owners of all rights, title and
interest (including intellectual property rights) subsisting in this publication including any data, analytics, statistics and other information. All rights reserved. 
STAMP DUTY
Families
with children
aged 0 - 4
Families
with children
aged 5 - 17
Families
with children
aged over 18
48%
46%
44%
INTEREST RATES
Families
with children
aged 0 - 4
Families
with children
aged 5 - 17
Families
with children
aged over 18
41%
38%
35%
MEETING REPAYMENTS
Families
with children
aged 0 - 4
Families
with children
aged 5 - 17
Families
with children
aged over 18
37%
35%
35%
FOREIGN BUYERS
Families
with children
aged 0 - 4
Families
with children
aged 5 - 17
Families
with children
aged over 18
35%
43%
44%
GETTING LOAN APPROVAL
Families
with children
aged 0 - 4
Families
with children
aged 5 - 17
Families
with children
aged over 18
40%
35%
32%
CERTAINTY OF EMPLOYMENT
Families
with children
aged 0 - 4
Families
with children
aged 5 - 17
Families
with children
aged over 18
38%
39%
41%
HAVING THE DEPOSIT
Families
with children
aged 0 - 4
Families
with children
aged 5 - 17
Families
with children
aged over 18
51%
43%
35%
INVESTORS IN THE MARKET
Families
with children
aged 0 - 4
Families
with children
aged 5 - 17
Families
with children
aged over 18
34%
35%
34%
LENDERS MORTGAGE INSURANCE
Families with children
aged 0 - 4
Families with children
aged 5 - 17
Families with children
aged over 18
36%
33%
31%
although an additional 30%
identified it as a moderate
impediment
an additional 27% identified it as a
moderate impediment
only 24% identified it as a
moderate impediment
IMPEDIMENTS TO HOUSING AFFORDABILITY – FAMILIES*
*Based on large or huge impediment responses
Perceptions of Housing Affordability Report 2017 | 35
© Copyright 2017 | RP Data Pty Ltd trading as CoreLogic Asia Pacific (CoreLogic) and its licensors are the sole and exclusive owners of all rights, title and
interest (including intellectual property rights) subsisting in this publication including any data, analytics, statistics and other information. All rights reserved.
Selection factors and concessions to
enable home ownership
While price is the number one factor that
dictates how families with children will select
a property, there was no significant statistical
differences between the age groups of
children that provided any specific insights.
When selecting where to buy, proximity to
schools was the number one priority for 58%
of families with children 0 to 4 and 50% of
those with children aged 5 to 17. The second
priority was proximity to work with 48% of
families with very young children ranking this
second, compared with 42% each for both
families with children aged 5 to 17 and 18+.
When selecting where to buy, families with
children 18+ were more likely to rank good
public transport to and from the city centre
or shopping as a priority (44%) than the other
family styles, while good public transport to
and from work was identified as important for
39% of families with babies and 40% families
with children aged 5 to 17.
Families with small children 0 to 4 are much
more likely to make the concession of buying
an affordable property that does not meet all
their criteria (54%) compared with those with
children 18+ (21%).
Families with children are also more likely to
buy a property further from their workplace
or other amenities (33% for 0 to 4 and 32%
for 5 to 17) than those with children 18+ where
only 21% would consider this concession.
Affordability and payment stress
The survey indicates that the cost of raising
children makes families the most open to
receiving support for the upfront costs of
buying a home.
Families with very young children 0 to 4 who
are currently renting are most likely to require
help of some kind to buy their first home with
52% stating government assistance would be
helpful and 23% stating financial assistance
from a family member for the deposit was
required. An additional 20% also said help
from family to make mortgage payments was
required.
This compares with 45% of families with
children aged 5 to 17 who were renting who
felt government assistance was necessary and
17% who wanted family deposit assistance.
Only 10% of families with children in this
bracket thought ongoing help with mortgage
payments was needed.
Finding the deposit is also difficult for those
with younger families with 41% of those
renting with children aged 0 to 4 stating they
could only raise between 0-9% for a deposit
and 40% of those with children aged 5 to 17.
This compares with 34% of renting families
with children 18+ who could raise a deposit
between 0-9%.
Nevertheless, once a home has been
purchased, families with small children 0 to
4 who are renting are willing to make strong
commitments to mortgages. While this group
displayed the strongest preference of all
family types to want to dedicate 30% or less
to their mortgage (32%) this bracket is also
most likely to be willing to dedicate between
30 to 49% with half the respondents believing
this could be necessary. That compares
with 39% of families with children 5 to 17
who believe paying 30 to 49% of income is
possible.
Families with children are the least likely to
be suffering from mortgage stress with 8% of
those with children 0 to 4 stating they were
having difficulty paying their mortgage now,
compared with 5% for children 5 to 17 and just
3% for those with children 18+.
However those with very young children are
most susceptible to interest rate increases
with 28% of those with children 0 to 4
stating they would struggle with interest rate
increases of between 0-1% and a further 35%
stating they would struggle with interest rate
increases between 1.5 and 2%.
36 | Perceptions of Housing Affordability Report 2017
© Copyright 2017 | RP Data Pty Ltd trading as CoreLogic Asia Pacific (CoreLogic) and its licensors are the sole and exclusive owners of all rights, title and
interest (including intellectual property rights) subsisting in this publication including any data, analytics, statistics and other information. All rights reserved. 
This compares with 22% of those with children
5 to 17 who would struggle with 0-1% and 29%
who would struggle with increases of 1.5-2%
and 17% of those with children over 18 who
would struggle with 0-1% and 26% who would
struggle with increases of 1.5% to 2%.
This means that an increase of between 1.5%
and 2% in interest rates would cause 63% of
families with children 0 to 4 to struggle to
make mortgage payments and 51% of families
with children 5 to 17. For those with children
18+, an increase of between 1.5% and 2%
in interest rates would cause 43% to suffer
hardship.
Best strategies for improving
affordability
Stamp duty was the number one priority that
families with children felt should be removed
to improve housing affordability. The survey
shows 74% of families with children 0 to 4
felt reducing or removing stamp duty would
be helpful, while 72% of those with children
aged 5 to 17 felt it would assist. However 82%
of those with children at home aged 18+ felt it
would improve housing affordability with 52%
of these believing it would be very helpful.
The numbers were similarly weighted when
asked whether reducing or removing stamp
duty for first home buyers would help. Again,
those with older children were most likely
to believe this to be valuable with 79% of
those with children aged 18+ stating it would
be helpful (51% said very helpful), 72% of
those with children aged 0 to 4 and 69% of
those with children aged 5 to 17 believing the
measure would assist.
The older the children, the more families
were likely to think government concessions
were an appropriate response with 70% of
those with children aged 0 to 4, 71% of those
with children 5 to 17 and 80% of those with
children 18+ living at home believing first
home buyer grants would assist affordability.
Perceptions of Housing Affordability Report 2017 | 37
© Copyright 2017 | RP Data Pty Ltd trading as CoreLogic Asia Pacific (CoreLogic) and its licensors are the sole and exclusive owners of all rights, title and
interest (including intellectual property rights) subsisting in this publication including any data, analytics, statistics and other information. All rights reserved.
38 | Perceptions of Housing Affordability Report 2017
© Copyright 2017 | RP Data Pty Ltd trading as CoreLogic Asia Pacific (CoreLogic) and its licensors are the sole and exclusive owners of all rights, title and
interest (including intellectual property rights) subsisting in this publication including any data, analytics, statistics and other information. All rights reserved. 
a. When will the kids
leave home?
“When are you going to move out, kid?”
is a cry heard across the living rooms of
Australia as parents ask their older teens -
and increasingly children in their 20s and 30s
according to the data – when they can expect
an end to the cleaning, cooking, laundry and
fighting for the remote with adult children.
The majority of Australians (62%) living with
their parents say that they cannot afford to
move out of the family home with 32% saying
living with parents keeps their expenses low,
and 20% admitting that it is “too comfortable
at home”.
While 27% are saving towards a home deposit
and 29% are still on education courses and
have yet to think about leaving home, over
20% of Australians still living with their
parents (21%) expect to move out after they
turn 30. Of those who live at home, only 4%
owned an investment property.
Of those who live with parents, 28% of
Millennials say they are saving money towards
a deposit, compared with 19% of Gen X and
25% of Baby Boomers. In addition, 35% of
Millennials said educational courses and study
costs were the reason they lived at home with
their parents.
Across the generations, most live at home
because they claim they cannot afford
to move out. This is the case for 62% of
Millennials, 60% of Gen X and 75% of Baby
Boomers who live with parents. Baby
Boomers were also overwhelmingly the most
likely to be living at home because they were
“too comfortable to move out” with 75% of
those living at home stating this reason.
Millennials (45%) state they will move out of
the family home between the ages of 25-29.
This compares with 48% of Baby Boomers
still living at home who say they do not intend
to move out at all, indicating their decision
to live with parents may not be due to
affordability issues.
Families with children at home who live with
their parents are likely to be saving for a
deposit with 40% of those with children 0 to
4 stating this, in comparison to 32% of those
with children 5 to 17 and just 22% of those
with children 18+. However, families with
children 5 to 17 and 18+ are likely to be living
with parents due to cost restraints created by
further study with 45% of those with children
5 to 17 and 44% of those with children 18+ still
undertaking educational courses.
Surprisingly, a higher wage makes little
difference in the perception of being able to
afford to move out of the parental home with
similar percentages across all wage levels. The
survey shows 65% of those earning less than
$40K said they could not afford to move out
compared with 67% for $40-$90K, 61% for
$90-$130K and 63% for those earning $130K
plus.
Those earning less than $40K were however
more likely to be honest about why they lived
at home, with 33% claiming they were “too
comfortable” to move out, compared with 17-
20% of those on higher wages.
Queenslanders (38%) and ACT residents
(32%) are more likely to move out of the
family home before the age of 25, while
across the states moving out of home before
the age of 35 seems to have become the
When will they move out?
(Australians 18 years or older still living at home)
21%
38%
19%
3%
19%
atleast30
yearsofage
between25-29
yearsofage
between
20-29
yearsofage
don’tknow
between18-19years
ofage
Perceptions of Housing Affordability Report 2017 | 39
© Copyright 2017 | RP Data Pty Ltd trading as CoreLogic Asia Pacific (CoreLogic) and its licensors are the sole and exclusive owners of all rights, title and
interest (including intellectual property rights) subsisting in this publication including any data, analytics, statistics and other information. All rights reserved.
new norm. The research shows that 77% of
those living at home in SA/NT will move out
before 35, with 75% in Queensland, 71% in
NSW and 69% in Victoria. Tasmanians are
the least decided about when they will move
out with 46% declaring they ‘did not know’ in
comparison to numbers around 15% in most
other states.
Queenslanders are also more likely to rent
before they buy (61%) compared with 40%
for ACT, 41% for Victorians and 38% for NSW
residents living with parents. Equally, SA/
NT residents living at home (53%) and NSW
(31%) believe they will live at home until they
find somewhere to buy. SA and NT residents
living at home are the least adventurous of
the states with none identifying that they
would stay at home to save for overseas
travel, compared with 10% for NSW and 11%
for WA residents.
Singles (41%) are more likely to want to move
out of the family home and are willing to
rent first, compared with married or defacto
couples (34%), while couples are more
comfortable living at home until they buy
(42%) compared with 28% of singles.
40 | Perceptions of Housing Affordability Report 2017
© Copyright 2017 | RP Data Pty Ltd trading as CoreLogic Asia Pacific (CoreLogic) and its licensors are the sole and exclusive owners of all rights, title and
interest (including intellectual property rights) subsisting in this publication including any data, analytics, statistics and other information. All rights reserved. 
Housing affordability,
wages and employment
How incomes and employment
status compare:
Within the survey, respondents were broken
down into four income groups; those in
households where income was under $40K,
those where household incomes were $40-
$90K, those whose incomes were between
$90-$130K and those who had household
incomes over $130K.
Those with incomes under $40K (55%) are
most likely to rent while those on incomes
over $90K are most likely to own their own
home and have mortgages.
In the survey, those with incomes less than
$40K were least likely to work full time (10%)
and most likely to not work at all (62%), while
50% of those earning between $40K-$90K
worked full time, and 64% of those earning
$90-$130K worked full time. Of those earning
$130K+, 67% worked full time.
How important is home ownership?
Work status is a significant indicator of
importance when it comes to attitudes
towards home ownership. Of those who work
full time and who rent or live with parents,
92% stated being able to buy their own home
was important, with 59% stating it was very
important.
Home ownership increases with household
income. In household incomes under $40K,
30% own their own homes, increasing to 65%
among household income $90K-$130K up to
71% among households with $130K household
income.
Just 30% of Australians with household
income of less than $40K a year own their
own home with 19% owning it outright and
11% paying off a mortgage. This compares
with 52% of people with income between
$40K-$90K and 65% of those earning
between $90K-$130K. Home ownership for
those with income over $130K is 71%.
A higher household income however, is an
indicator of a mortgage with 52% of those
earning over $130K paying off a home, while
49% of those earning between $90K-$130K
are paying it off.
The higher the income, the greater the
importance of owning a home to those who
are renting or living with family with 94%
of those earning $130K+ believing home
ownership is important compared with 90%
for $90-130K, 89% for $40-$90K and 86% for
under $40K.
Concern about housing affordability
The survey shows that concern about housing
affordability is fairly similar across the
different income brackets with nearly two-
thirds across each category believing housing
affordability is worse in some way now
compared with last year.
Of those earning less than $40K, 58% feel
affordability is worse in some way (including
39% significantly or very much worse) than
last year while 60% of those earning between
$40-$90K (34% significantly or very much
worse) and 67% of those earning between
$90-$130K agree (with 33% believing it is
significantly or very much worse). Of those
with incomes $130K or higher, 65% believe it
is now worse in some way with 35% believing
affordability is now significantly or very much
worse.
Fairly similar numbers believe that
affordability will be worse next year. A total of
08.
Who owns property?
30%
49%
65%
71%
Household
incomesunder
$40k-$90k
Household
incomeunder
$90k-$130k
Household
incomeover
$130k
Household
incomeunder
$40k
Perceptions of Housing Affordability Report 2017 | 41
© Copyright 2017 | RP Data Pty Ltd trading as CoreLogic Asia Pacific (CoreLogic) and its licensors are the sole and exclusive owners of all rights, title and
interest (including intellectual property rights) subsisting in this publication including any data, analytics, statistics and other information. All rights reserved.
54% of those earning less than $40K believe
housing affordability will be worse in some
way next year, compared with 61% of those
earning $40-$90K, 62% of those earning $90-
$130K and 59% of those earning $130K+.
What are the obstacles to housing
affordability?
Perhaps unsurprisingly, employment status
is a strong dictator of the level of concern
Australians have about obstacles to housing
affordability. While only a third of those
working full time felt that employment
certainty and meeting repayments were
impediments, those who worked part time or
not at all found them to be larger issues.
The survey found that 47% of those working
part time, and 46% of those not working
believed employment certainty was a large
or huge impediment to affordability, while
meeting repayments was an issue for 41% of
those who work part time and 43% of those
not working.
For those on incomes less than $40K, the
biggest impediments to housing affordability
were having the deposit and getting loan
approval with 56% of respondents nominating
each of these issues, followed by certainty of
employment (51%) and meeting repayments
(49%). For those on incomes between
$40K-$90K, the biggest impediments
were having the deposit (48%) and paying
stamp duty (43%), followed by certainty of
employment (42%).
At the higher end, the impediments identified
by those earning between $90K-$130K were
foreign buyers in the market (42%) followed
equally by the cost of stamp duty and having
the deposit (39%) and finally certainty of
employment (34%).
For top income earners over $130K, the
impediments were perceived equally as
foreign buyers and stamp duty (46%)
followed by having the deposit (36%) and
certainty of employment (34%).
42 | Perceptions of Housing Affordability Report 2017
© Copyright 2017 | RP Data Pty Ltd trading as CoreLogic Asia Pacific (CoreLogic) and its licensors are the sole and exclusive owners of all rights, title and
interest (including intellectual property rights) subsisting in this publication including any data, analytics, statistics and other information. All rights reserved. 
Interest rates as a housing affordability
impediment*
45%
41%
32%
30%
Lessthan
$40k
$40k
to$90k
$90k
to$130k
$130k+
Meeting repayments as a housing
affordability impediment*
49%
41%
26%
27%
Getting loan approval as a housing
affordability impediment*
56%
40%
30%
26%
Certainty of Employment as a housing
affordability impediment*
51%
42%
34%
34%
Lessthan
$40k
$40k
to$90k
$90k
to$130k
$130k+
Foreign buyers as a housing affordability
impediment*
43%
40%
42%
46%
Lessthan
$40k
$40k
to$90k
$90k
to$130k
$130k+
Stamp duty as a housing affordability
impediment*
47%
43%
39%
46%
Lessthan
$40k
$40k
to$90k
$90k
to$130k
$130k+
Lessthan
$40k
$40k
to$90k
$90k
to
$130k
$130k+
Lessthan
$40k
$40k
to$90k
$90k
to
$130k
$130k+
Having the deposit as a housing
affordability impediment*
56%
48%
39%
36%
Lessthan
$40k
$40k
to$90k
$90k
to$130k
$130k+
*Large or huge impediment
Obstacles
by level of
income
Perceptions of Housing Affordability Report 2017 | 43
© Copyright 2017 | RP Data Pty Ltd trading as CoreLogic Asia Pacific (CoreLogic) and its licensors are the sole and exclusive owners of all rights, title and
interest (including intellectual property rights) subsisting in this publication including any data, analytics, statistics and other information. All rights reserved.
Selection factors and concessions to
enable home ownership
Moving further away from work is one of
the least desirable options for those earning
under $40K as an option to make housing
more affordable with just 19% saying they
would consider it, compared with 30% for
those earning $40K-$90K and $130K+ and
33% for $90K to $130K.
The higher the household income, the greater
the importance of being close to the city and
employment. The survey found 54% of those
earning $130K+ felt that proximity to work
was important, compared with just 30% of
those earning less than $40K. In addition,
50% of those earning above $130K said
proximity to the city was an important factor,
compared with 35% of those earning less than
$40K.
The higher the wage, the less likely the belief
government assistance was necessary to help
renters buy their first home with just 33% of
renters with salaries over $130K believing
government assistance was required,
compared with 42% of those with salaries
under $40K.
However, those renting on higher salaries
of $130K plus were more likely to expect
parental assistance, either through an
inheritance or their parents buying them a
house (34%) compared with 26% of those
earning under $40K.
The higher the income, the more likely
that those who currently rent will consider
purchasing an investment property as a
first step with 50% of those earning $130K+
considering this as an option (15% definitely)
which scaled down to 32% of those earning
less than $40K (11% definitely).
Affordability and payment stress
The lower the income, the more likely
homeowners are to suffer from mortgage
stress. The survey shows 35% of those earning
less than $40K are currently struggling with
their interest payments, in comparison to just
6% for those earning between $40K
up to $130K and just 5% for those earning
over $130K.
Low earners are also therefore most at risk of
interest rate rises with more than half (51%)
stating they would struggle with interest rate
rises between 0-1% compared with 19% for
those earning $130K+.
Should interest rates rise up to 2%, the survey
indicates that 77% of low income earners
would have gone into mortgage shock, with
61% of those earning $40K-$90K struggling
to make repayments. Higher income brackets
fare less badly with 49% of those earning
$90K-$130K having difficulty and 44% of
those earning $130K+ struggling.
Of those who work full time and rent, the
largest proportion (34%) are able to raise a
deposit of between 0-9% with 27% able to
raise a deposit of between 10-19%.
Best strategies for improving
affordability
Removing or reducing stamp duty is the best
strategy for addressing housing affordability
according to the nearly two thirds of
residents at all salary levels with 71% of those
earning less than $40K believing this would
assist, compared with 75% of those earning
$40K-$90K, 71% of those earning $90K-$130K
and 74% of those earning $130+.
Government grants for first home buyers are
also favoured by this category – although
support wanes slightly with higher salaries
- with 73% of those earning less than $40K
favouring this strategy, compared with 76%
for those earning $40-$90K, 69% of those
earning $90K-$130K and 67% of those
earning $130K+.
Creating more jobs in areas that have lower
priced housing is also seen as worth pursuing
for 68% of those earning less than $40K, 67%
of those earning $40K-$90K but only 61% of
those earning $90K-$130K. The initiative is
supported by 64% of those earning $130K+.
44 | Perceptions of Housing Affordability Report 2017
© Copyright 2017 | RP Data Pty Ltd trading as CoreLogic Asia Pacific (CoreLogic) and its licensors are the sole and exclusive owners of all rights, title and
interest (including intellectual property rights) subsisting in this publication including any data, analytics, statistics and other information. All rights reserved. 
Despite their lower prices compared with
houses, the data shows that apartments
are still significantly more expensive and
harder to afford than 15 years ago. The price
to income ratio of apartment ownership is
currently 6.6x income for units now compared
with 4.8x 15 years ago.
The new survey shows however that
despite the generally cheaper price point of
apartments when compared with houses,
apartment dwellers are even more sensitive
to the impediments of ownership than those
who live in houses, are more likely to perceive
impediments to ownership, are gloomier
about affordability changing for the better
and are more concerned about their next
move.
This is possibly why fewer renters who
live in apartments see home ownership as
important as those who live in houses - 91%
of those who rented a house stated home
ownership is important (57% very important)
in comparison to 86% of those renting
apartments (50% very important).
The research identifies that raising the
deposit is one of the biggest impediments to
apartment dwellers with 52% stating it a large
impediment to ownership, compared with
42% of those who live in houses.
Apartment dwellers are also most likely to
feel that foreign buyers are an impediment to
affordability with 50% feeling this is a factor,
compared with 41% of people who live in
houses.
Other concerns held by apartment dwellers
ahead of those who live in houses are
worries about investors in the market being
an impediment to affordability with 45% of
apartment dwellers concerned compared
with 34% of those who live in houses, and
the belief that negative gearing benefits
are an issue with 37% of those who live in
apartments rating it as a concern compared
with 28% of those who live in houses. Meeting
repayments are also concerns for a greater
proportion of apartment dwellers with 42%
stating interest rates are a large or huge
impediment to housing affordability. This
compares with 37% for those who live in a
house.
And while 34% of residents who live in
houses believe that meeting repayments is
an impediment to housing affordability, this
number jumps to 47% of those who dwell in
apartments. Equally, getting loan approval
is also more of an impediment to those who
live in apartments with 46% of apartment
dwellings saying finance is an impediment,
compared with 36% of those who live in
houses.
Apartment owners are also more anxious
about their next move. While 76% of property
owners are concerned to some extent about
being able to afford what they want and need
for their next home move, this number jumps
to 88% of apartment owners. The research
shows 41% of those who live in an apartment
are very concerned that they might not
be able to afford their next family home,
compared with just 20% of house owners.
This is possibly because those who live
in apartments are more concerned about
affordability with 43% claiming properties
are less affordable now than they were a year
ago, compared with 33% of those who live in
houses.
The research also shows that people who live
in apartments have slightly different priorities
to those who live in houses when it comes to
property selection. While price was identified
by 80% of those who lived in houses as the
most important factor when deciding to buy,
only 73% of apartment dwellers nominated
price. Apartment residents were more likely to
nominate distance to the city as an important
factor (45%) compared with those who lived
in houses (34%).
People who rent an apartment are also less
likely to believe government assistance
could help them with just 34% believing the
government should play a role, compared
with 42% of those who rent houses.
a. Is apartment ownership
more realistic?
The research confirms the
overwhelming majority of
Australians live in houses
(72%) and while they are
an increasing proportion
in some states, apartment
dwellers make up just
15% of the population.
Add to that duplexes
and townhouses and
the number of people
living in shared title
accommodation is still
small at 28%.
Perceptions of Housing Affordability Report 2017 | 45
© Copyright 2017 | RP Data Pty Ltd trading as CoreLogic Asia Pacific (CoreLogic) and its licensors are the sole and exclusive owners of all rights, title and
interest (including intellectual property rights) subsisting in this publication including any data, analytics, statistics and other information. All rights reserved.
46 | Perceptions of Housing Affordability Report 2017
© Copyright 2017 | RP Data Pty Ltd trading as CoreLogic Asia Pacific (CoreLogic) and its licensors are the sole and exclusive owners of all rights, title and
interest (including intellectual property rights) subsisting in this publication including any data, analytics, statistics and other information. All rights reserved. 
Owning a property – or more to the point,
owning a mortgage - is a stress best shared,
insights from the research reveal, with anxiety
levels of singles significantly higher than
those of couples across key decision points.
Couples who own property are slightly less
concerned about being able to afford their
next home than singles with 74% of married
or defacto couples concerned while 80% of
singles are concerned.
Meeting repayments is regarded as a large or
huge impediment for 42% of singles, but just
33% of couples, while getting a loan is also
more stressful done solo with 43% of singles
stating it was a large or huge impediment
compared with 34% of couples.
Having a plus one to fall back on is also a
reassurance with 39% of couples stating
employment certainty was an impediment
while 44% of singles sweat it out.
Offence at government duties however
are amplified for couples with 47% of
married/defacto believing stamp duty is
an impediment to housing affordability
compared with 39% of singles.
Singles are more likely to consider purchasing
with family or friends (22%) compared with
13% of married or defacto couples and 36%
of singles would consider moving into an
apartment rather than a house, compared
with 33% of couples.
b. Home ownership:
a team sport
Perceptions of Housing Affordability Report 2017 | 47
© Copyright 2017 | RP Data Pty Ltd trading as CoreLogic Asia Pacific (CoreLogic) and its licensors are the sole and exclusive owners of all rights, title and
interest (including intellectual property rights) subsisting in this publication including any data, analytics, statistics and other information. All rights reserved.
48 | Perceptions of Housing Affordability Report 2017
© Copyright 2017 | RP Data Pty Ltd trading as CoreLogic Asia Pacific (CoreLogic) and its licensors are the sole and exclusive owners of all rights, title and
interest (including intellectual property rights) subsisting in this publication including any data, analytics, statistics and other information. All rights reserved. 
Options to fix housing
affordability
Housing affordability cannot be fixed with
a single action. Australian households have
more than half their wealth tied up in the
residential housing sector and about 70%
of their debt is housing related.10
The desire
to improve housing affordability needs to
be balanced with the knowledge that a
downturn in housing values would likely
result in less household consumption and
impact negatively on economic growth
and Australian retirement assets and no
solution can be implemented without careful
economic and statistical modelling.
Below is a summary of policy initiatives that
are part of the debate:
A COORDINATED APPROACH
Residential real estate is Australia’s largest
asset class worth an estimated $7.0 trillion
– far outstripping superannuation at $2.2
trillion and listed stocks at $1.8 trillion11
. A
coordinated and cooperative approach across
different government levels and sectors is
one of the greatest challenges to housing
affordability. Options in this space include
making housing policy a prominent and
permanent part of the COAG (Council of
Australian Governments) agenda and the
appointment of a Federal Housing Minister
who is tasked with formulating and executing
a cross-jurisdictional housing strategy. These
initiatives should be matched with a strategy
that blends land release, zoning changes,
infrastructure development and decentralising
employment opportunities into areas where
housing costs are substantially lower, and
counterpart roles within state governments,
as well as broader coordinated town planning
strategies for major metropolitan areas.
INCREASE SUPPLY
Reduce or remove stamp duty
Buyers pay stamp duty to state governments
to cover the costs of property transfers. In
Sydney and Melbourne, based on median
sales prices these taxes regularly add close to
$35K and more to the cost of buying a house.
When property prices are over $1.5m - not
an uncommon price for a house in inner city
Sydney - stamp duty costs jump to $68K.
This makes stamp duty a major up front
barrier to buyers, especially when combined
with the lump sum of saving for a deposit.
It is also a deterrent to the decision to sell
properties within inner city areas in particular,
which affects housing supply, pushes up
prices and detracts from the efficient transfer
of housing stock across generations.
Removing or reducing stamp duty addresses
this barrier, however, it is a lucrative tax to
state governments who benefit when either
market volume is high, or property prices rise,
and significant state budget shortfalls would
be experienced without it.
Release more land for housing
State governments have the power to release
additional land for housing which can increase
supply of new dwellings. However, these are
usually on urban fringes and require significant
investment in infrastructure for roads, schools,
shops and public transport. This must also
be managed and requires coordination and
funding from federal government as well as
significant contributions from private sector
developers who ultimately pass these costs on
to consumers.
Invest in transport infrastructure
An underinvestment in efficient transport
infrastructure projects relative to population
growth can be one of the primary contributors
to high dwelling values in certain areas
because housing demand becomes focused
within those areas that are in a convenient
location relative to work and essential
amenities. This is one of the reasons why
growth rates are so disparate between the
Australian capital cities and regional areas.
Encourage more owner-occupier
apartment development
There are just over 152,600 units under
construction across Australia12
– 85% more
than the decade average and virtually double
the 30 year average. With much of this stock
being high rise units, and the majority being
one and two bedrooms, this kind of housing
09.
10
RBA household finances – selected ratios (http://www.rba.gov.au/statistics/tables/xls/e02hist.xls?v=2017-04-26-20 to 41-28)
11
CoreLogic 2017
12
Australian Bureau of Statistics Building Activity December 16
Perceptions of Housing Affordability Report 2017 | 49
© Copyright 2017 | RP Data Pty Ltd trading as CoreLogic Asia Pacific (CoreLogic) and its licensors are the sole and exclusive owners of all rights, title and
interest (including intellectual property rights) subsisting in this publication including any data, analytics, statistics and other information. All rights reserved.
50 | Perceptions of Housing Affordability Report 2017
© Copyright 2017 | RP Data Pty Ltd trading as CoreLogic Asia Pacific (CoreLogic) and its licensors are the sole and exclusive owners of all rights, title and
interest (including intellectual property rights) subsisting in this publication including any data, analytics, statistics and other information. All rights reserved. 
development is more suited to investors and
consequently rental markets rather than
families.
Zoning and planning laws are controlled
by local government which can make it
difficult for state and federal governments to
affect change in this space with any kind of
uniformity. Nevertheless, state governments
can play a role through legislative frameworks
to encourage development along, for
example, growth corridors, while federal
government can create tax incentives for
developers to create more affordable and
social housing.
REDUCE DEMAND
Change negative gearing policies to
reduce investors in the market
Investors have historically comprised of 33%
to 40% of housing demand however the latest
data from the Australian Bureau of Statistics
shows investors comprised closer to 50% of
new mortgage demand nationally.13
Actions that reduce the numbers of investors
in the market need to be carefully managed
as they affect the availability and therefore
cost of rental accommodation. Additionally as
the nation moves through an unprecedented
‘boom’ in apartment construction, investors
play a critical role in absorbing new unit
supply and ensuring off the plan sales
transition smoothly to settlement.
Discussion has focused around limiting
negative gearing for new property purchases
only. The latest Australian Taxation Office
data14
show 9.7% of all tax payers incurred
a net rental loss over the 2016 financial year
and are therefore likely to be using a negative
gearing strategy.
While negative gearing is widely believed
to be responsible for the influx of investors
into the market, low interest rates, a 50%
capital gains tax concession on properties
held for at least 12 months, an uncertain
stock market and the ability of self-managed
superannuation funds to purchase property
13
Australian Bureau of Statistics Housing finance February 17
14
ATO 2015
Perceptions of Housing Affordability Report 2017 | 51
© Copyright 2017 | RP Data Pty Ltd trading as CoreLogic Asia Pacific (CoreLogic) and its licensors are the sole and exclusive owners of all rights, title and
interest (including intellectual property rights) subsisting in this publication including any data, analytics, statistics and other information. All rights reserved.
Housing Affordability Report Reveals Generational Struggle

More Related Content

Similar to Housing Affordability Report Reveals Generational Struggle

Institutional Pitchbook
Institutional PitchbookInstitutional Pitchbook
Institutional PitchbookSam Vong
 
The Investment Case for Senior Housing: It’s Much More Than Just Demographics...
The Investment Case for Senior Housing: It’s Much More Than Just Demographics...The Investment Case for Senior Housing: It’s Much More Than Just Demographics...
The Investment Case for Senior Housing: It’s Much More Than Just Demographics...Virtual ULI
 
Charles Wurtzebach - 2017 Market Outlook
Charles Wurtzebach - 2017 Market OutlookCharles Wurtzebach - 2017 Market Outlook
Charles Wurtzebach - 2017 Market OutlookJessKern
 
Retire with rentals
Retire with rentalsRetire with rentals
Retire with rentalsBobby Sharma
 
review-housing-markets
review-housing-marketsreview-housing-markets
review-housing-marketsEmily Condos
 
The Australian Residential Property Market & Economy
The Australian Residential Property Market & EconomyThe Australian Residential Property Market & Economy
The Australian Residential Property Market & EconomyNational Property Buyers
 
New Affordable Seniors Housing Project
New Affordable Seniors Housing ProjectNew Affordable Seniors Housing Project
New Affordable Seniors Housing ProjectAnthony Adsit
 
Newsletter Fall 2008
Newsletter Fall 2008Newsletter Fall 2008
Newsletter Fall 2008Dan Flanagan
 
Renting vs Buying Home SD model v.1 (manuscript; © Sinisa Sovilj)
Renting vs Buying Home SD model v.1 (manuscript; © Sinisa Sovilj)Renting vs Buying Home SD model v.1 (manuscript; © Sinisa Sovilj)
Renting vs Buying Home SD model v.1 (manuscript; © Sinisa Sovilj)Siniša Sovilj
 
A Systematic Review of Affordable Homeownership using Data Science Methods
A Systematic Review of Affordable Homeownership using Data Science MethodsA Systematic Review of Affordable Homeownership using Data Science Methods
A Systematic Review of Affordable Homeownership using Data Science MethodsKarthikeyan Umapathy
 
Bullseye Investments Presentation 8 2011
Bullseye Investments Presentation 8 2011Bullseye Investments Presentation 8 2011
Bullseye Investments Presentation 8 2011k_takhar1
 
MJD Business Plan Highlights
MJD Business Plan HighlightsMJD Business Plan Highlights
MJD Business Plan HighlightsMario Jimenez
 
Buyinga homesummer2020
Buyinga homesummer2020Buyinga homesummer2020
Buyinga homesummer2020BrockHarris7
 
List all the advantages of purchasing foreclosed homes as an inves.docx
List all the advantages of purchasing foreclosed homes as an inves.docxList all the advantages of purchasing foreclosed homes as an inves.docx
List all the advantages of purchasing foreclosed homes as an inves.docxsmile790243
 

Similar to Housing Affordability Report Reveals Generational Struggle (20)

Cl housing affordability-dec-2016
Cl housing affordability-dec-2016Cl housing affordability-dec-2016
Cl housing affordability-dec-2016
 
Institutional Pitchbook
Institutional PitchbookInstitutional Pitchbook
Institutional Pitchbook
 
The Investment Case for Senior Housing: It’s Much More Than Just Demographics...
The Investment Case for Senior Housing: It’s Much More Than Just Demographics...The Investment Case for Senior Housing: It’s Much More Than Just Demographics...
The Investment Case for Senior Housing: It’s Much More Than Just Demographics...
 
Charles Wurtzebach - 2017 Market Outlook
Charles Wurtzebach - 2017 Market OutlookCharles Wurtzebach - 2017 Market Outlook
Charles Wurtzebach - 2017 Market Outlook
 
Retire with rentals
Retire with rentalsRetire with rentals
Retire with rentals
 
review-housing-markets
review-housing-marketsreview-housing-markets
review-housing-markets
 
The Australian Residential Property Market & Economy
The Australian Residential Property Market & EconomyThe Australian Residential Property Market & Economy
The Australian Residential Property Market & Economy
 
New Affordable Seniors Housing Project
New Affordable Seniors Housing ProjectNew Affordable Seniors Housing Project
New Affordable Seniors Housing Project
 
Newsletter Fall 2008
Newsletter Fall 2008Newsletter Fall 2008
Newsletter Fall 2008
 
AU_Women_and_Property_2023_Research
AU_Women_and_Property_2023_ResearchAU_Women_and_Property_2023_Research
AU_Women_and_Property_2023_Research
 
Renting vs Buying Home SD model v.1 (manuscript; © Sinisa Sovilj)
Renting vs Buying Home SD model v.1 (manuscript; © Sinisa Sovilj)Renting vs Buying Home SD model v.1 (manuscript; © Sinisa Sovilj)
Renting vs Buying Home SD model v.1 (manuscript; © Sinisa Sovilj)
 
A Systematic Review of Affordable Homeownership using Data Science Methods
A Systematic Review of Affordable Homeownership using Data Science MethodsA Systematic Review of Affordable Homeownership using Data Science Methods
A Systematic Review of Affordable Homeownership using Data Science Methods
 
Bullseye Investments Presentation 8 2011
Bullseye Investments Presentation 8 2011Bullseye Investments Presentation 8 2011
Bullseye Investments Presentation 8 2011
 
2018 08--cl18 quarterly-economic_and_property_review
2018 08--cl18 quarterly-economic_and_property_review2018 08--cl18 quarterly-economic_and_property_review
2018 08--cl18 quarterly-economic_and_property_review
 
12 tmire dec_us_2010
12 tmire dec_us_201012 tmire dec_us_2010
12 tmire dec_us_2010
 
MJD Presentation1
MJD Presentation1MJD Presentation1
MJD Presentation1
 
MJD Business Plan Highlights
MJD Business Plan HighlightsMJD Business Plan Highlights
MJD Business Plan Highlights
 
-housing-accessibility-for-first-home-buyers #2017
-housing-accessibility-for-first-home-buyers #2017-housing-accessibility-for-first-home-buyers #2017
-housing-accessibility-for-first-home-buyers #2017
 
Buyinga homesummer2020
Buyinga homesummer2020Buyinga homesummer2020
Buyinga homesummer2020
 
List all the advantages of purchasing foreclosed homes as an inves.docx
List all the advantages of purchasing foreclosed homes as an inves.docxList all the advantages of purchasing foreclosed homes as an inves.docx
List all the advantages of purchasing foreclosed homes as an inves.docx
 

Recently uploaded

Collective Mining | Corporate Presentation - April 2024
Collective Mining | Corporate Presentation - April 2024Collective Mining | Corporate Presentation - April 2024
Collective Mining | Corporate Presentation - April 2024CollectiveMining1
 
High Profile Call Girls Kolkata Gayatri 🤌 8250192130 🚀 Vip Call Girls Kolkata
High Profile Call Girls Kolkata Gayatri 🤌  8250192130 🚀 Vip Call Girls KolkataHigh Profile Call Girls Kolkata Gayatri 🤌  8250192130 🚀 Vip Call Girls Kolkata
High Profile Call Girls Kolkata Gayatri 🤌 8250192130 🚀 Vip Call Girls Kolkataanamikaraghav4
 
High Profile Call Girls Kolkata Trisha 🤌 8250192130 🚀 Vip Call Girls Kolkata
High Profile Call Girls Kolkata Trisha 🤌  8250192130 🚀 Vip Call Girls KolkataHigh Profile Call Girls Kolkata Trisha 🤌  8250192130 🚀 Vip Call Girls Kolkata
High Profile Call Girls Kolkata Trisha 🤌 8250192130 🚀 Vip Call Girls Kolkataanamikaraghav4
 
VIP 7001035870 Find & Meet Hyderabad Call Girls Banjara Hills high-profile Ca...
VIP 7001035870 Find & Meet Hyderabad Call Girls Banjara Hills high-profile Ca...VIP 7001035870 Find & Meet Hyderabad Call Girls Banjara Hills high-profile Ca...
VIP 7001035870 Find & Meet Hyderabad Call Girls Banjara Hills high-profile Ca...aditipandeya
 
OKC Thunder Reveal Game 2 Playoff T Shirts
OKC Thunder Reveal Game 2 Playoff T ShirtsOKC Thunder Reveal Game 2 Playoff T Shirts
OKC Thunder Reveal Game 2 Playoff T Shirtsrahman018755
 
VIP Kolkata Call Girl Entally 👉 8250192130 Available With Room
VIP Kolkata Call Girl Entally 👉 8250192130  Available With RoomVIP Kolkata Call Girl Entally 👉 8250192130  Available With Room
VIP Kolkata Call Girl Entally 👉 8250192130 Available With Roomdivyansh0kumar0
 
如何办理密苏里大学堪萨斯分校毕业证(文凭)UMKC学位证书
如何办理密苏里大学堪萨斯分校毕业证(文凭)UMKC学位证书如何办理密苏里大学堪萨斯分校毕业证(文凭)UMKC学位证书
如何办理密苏里大学堪萨斯分校毕业证(文凭)UMKC学位证书Fir La
 
VIP 7001035870 Find & Meet Hyderabad Call Girls Abids high-profile Call Girl
VIP 7001035870 Find & Meet Hyderabad Call Girls Abids high-profile Call GirlVIP 7001035870 Find & Meet Hyderabad Call Girls Abids high-profile Call Girl
VIP 7001035870 Find & Meet Hyderabad Call Girls Abids high-profile Call Girladitipandeya
 
如何办理北卡罗来纳大学教堂山分校毕业证(文凭)UNC学位证书
如何办理北卡罗来纳大学教堂山分校毕业证(文凭)UNC学位证书如何办理北卡罗来纳大学教堂山分校毕业证(文凭)UNC学位证书
如何办理北卡罗来纳大学教堂山分校毕业证(文凭)UNC学位证书Fir La
 
Osisko Gold Royalties Ltd - Corporate Presentation, April 23, 2024
Osisko Gold Royalties Ltd - Corporate Presentation, April 23, 2024Osisko Gold Royalties Ltd - Corporate Presentation, April 23, 2024
Osisko Gold Royalties Ltd - Corporate Presentation, April 23, 2024Osisko Gold Royalties Ltd
 
slideshare Call girls Noida Escorts 9999965857 henakhan
slideshare Call girls Noida Escorts 9999965857 henakhanslideshare Call girls Noida Escorts 9999965857 henakhan
slideshare Call girls Noida Escorts 9999965857 henakhanhanshkumar9870
 
Nicola Mining Inc. Corporate Presentation April 2024
Nicola Mining Inc. Corporate Presentation April 2024Nicola Mining Inc. Corporate Presentation April 2024
Nicola Mining Inc. Corporate Presentation April 2024nicola_mining
 
CALL ON ➥8923113531 🔝Call Girls Vineet Khand Lucknow best Night Fun service 🧦
CALL ON ➥8923113531 🔝Call Girls Vineet Khand Lucknow best Night Fun service  🧦CALL ON ➥8923113531 🔝Call Girls Vineet Khand Lucknow best Night Fun service  🧦
CALL ON ➥8923113531 🔝Call Girls Vineet Khand Lucknow best Night Fun service 🧦anilsa9823
 

Recently uploaded (20)

Collective Mining | Corporate Presentation - April 2024
Collective Mining | Corporate Presentation - April 2024Collective Mining | Corporate Presentation - April 2024
Collective Mining | Corporate Presentation - April 2024
 
Call Girls In Vasant Kunj 📱 9999965857 🤩 Delhi 🫦 HOT AND SEXY VVIP 🍎 SERVICE
Call Girls In Vasant Kunj 📱  9999965857  🤩 Delhi 🫦 HOT AND SEXY VVIP 🍎 SERVICECall Girls In Vasant Kunj 📱  9999965857  🤩 Delhi 🫦 HOT AND SEXY VVIP 🍎 SERVICE
Call Girls In Vasant Kunj 📱 9999965857 🤩 Delhi 🫦 HOT AND SEXY VVIP 🍎 SERVICE
 
High Profile Call Girls Kolkata Gayatri 🤌 8250192130 🚀 Vip Call Girls Kolkata
High Profile Call Girls Kolkata Gayatri 🤌  8250192130 🚀 Vip Call Girls KolkataHigh Profile Call Girls Kolkata Gayatri 🤌  8250192130 🚀 Vip Call Girls Kolkata
High Profile Call Girls Kolkata Gayatri 🤌 8250192130 🚀 Vip Call Girls Kolkata
 
High Profile Call Girls Kolkata Trisha 🤌 8250192130 🚀 Vip Call Girls Kolkata
High Profile Call Girls Kolkata Trisha 🤌  8250192130 🚀 Vip Call Girls KolkataHigh Profile Call Girls Kolkata Trisha 🤌  8250192130 🚀 Vip Call Girls Kolkata
High Profile Call Girls Kolkata Trisha 🤌 8250192130 🚀 Vip Call Girls Kolkata
 
Call Girls 🫤 Mahipalpur ➡️ 9999965857 ➡️ Delhi 🫦 Russian Escorts FULL ENJOY
Call Girls 🫤 Mahipalpur ➡️ 9999965857  ➡️ Delhi 🫦  Russian Escorts FULL ENJOYCall Girls 🫤 Mahipalpur ➡️ 9999965857  ➡️ Delhi 🫦  Russian Escorts FULL ENJOY
Call Girls 🫤 Mahipalpur ➡️ 9999965857 ➡️ Delhi 🫦 Russian Escorts FULL ENJOY
 
Call Girls 🫤 Mukherjee Nagar ➡️ 9999965857 ➡️ Delhi 🫦 Russian Escorts FULL ...
Call Girls 🫤 Mukherjee Nagar ➡️ 9999965857  ➡️ Delhi 🫦  Russian Escorts FULL ...Call Girls 🫤 Mukherjee Nagar ➡️ 9999965857  ➡️ Delhi 🫦  Russian Escorts FULL ...
Call Girls 🫤 Mukherjee Nagar ➡️ 9999965857 ➡️ Delhi 🫦 Russian Escorts FULL ...
 
VIP 7001035870 Find & Meet Hyderabad Call Girls Banjara Hills high-profile Ca...
VIP 7001035870 Find & Meet Hyderabad Call Girls Banjara Hills high-profile Ca...VIP 7001035870 Find & Meet Hyderabad Call Girls Banjara Hills high-profile Ca...
VIP 7001035870 Find & Meet Hyderabad Call Girls Banjara Hills high-profile Ca...
 
OKC Thunder Reveal Game 2 Playoff T Shirts
OKC Thunder Reveal Game 2 Playoff T ShirtsOKC Thunder Reveal Game 2 Playoff T Shirts
OKC Thunder Reveal Game 2 Playoff T Shirts
 
@9999965857 🫦 Sexy Desi Call Girls Karol Bagh 💓 High Profile Escorts Delhi 🫶
@9999965857 🫦 Sexy Desi Call Girls Karol Bagh 💓 High Profile Escorts Delhi 🫶@9999965857 🫦 Sexy Desi Call Girls Karol Bagh 💓 High Profile Escorts Delhi 🫶
@9999965857 🫦 Sexy Desi Call Girls Karol Bagh 💓 High Profile Escorts Delhi 🫶
 
VIP Kolkata Call Girl Entally 👉 8250192130 Available With Room
VIP Kolkata Call Girl Entally 👉 8250192130  Available With RoomVIP Kolkata Call Girl Entally 👉 8250192130  Available With Room
VIP Kolkata Call Girl Entally 👉 8250192130 Available With Room
 
如何办理密苏里大学堪萨斯分校毕业证(文凭)UMKC学位证书
如何办理密苏里大学堪萨斯分校毕业证(文凭)UMKC学位证书如何办理密苏里大学堪萨斯分校毕业证(文凭)UMKC学位证书
如何办理密苏里大学堪萨斯分校毕业证(文凭)UMKC学位证书
 
VIP 7001035870 Find & Meet Hyderabad Call Girls Abids high-profile Call Girl
VIP 7001035870 Find & Meet Hyderabad Call Girls Abids high-profile Call GirlVIP 7001035870 Find & Meet Hyderabad Call Girls Abids high-profile Call Girl
VIP 7001035870 Find & Meet Hyderabad Call Girls Abids high-profile Call Girl
 
如何办理北卡罗来纳大学教堂山分校毕业证(文凭)UNC学位证书
如何办理北卡罗来纳大学教堂山分校毕业证(文凭)UNC学位证书如何办理北卡罗来纳大学教堂山分校毕业证(文凭)UNC学位证书
如何办理北卡罗来纳大学教堂山分校毕业证(文凭)UNC学位证书
 
Osisko Gold Royalties Ltd - Corporate Presentation, April 23, 2024
Osisko Gold Royalties Ltd - Corporate Presentation, April 23, 2024Osisko Gold Royalties Ltd - Corporate Presentation, April 23, 2024
Osisko Gold Royalties Ltd - Corporate Presentation, April 23, 2024
 
Model Call Girl in Udyog Vihar Delhi reach out to us at 🔝9953056974🔝
Model Call Girl in Udyog Vihar Delhi reach out to us at 🔝9953056974🔝Model Call Girl in Udyog Vihar Delhi reach out to us at 🔝9953056974🔝
Model Call Girl in Udyog Vihar Delhi reach out to us at 🔝9953056974🔝
 
slideshare Call girls Noida Escorts 9999965857 henakhan
slideshare Call girls Noida Escorts 9999965857 henakhanslideshare Call girls Noida Escorts 9999965857 henakhan
slideshare Call girls Noida Escorts 9999965857 henakhan
 
Nicola Mining Inc. Corporate Presentation April 2024
Nicola Mining Inc. Corporate Presentation April 2024Nicola Mining Inc. Corporate Presentation April 2024
Nicola Mining Inc. Corporate Presentation April 2024
 
CALL ON ➥8923113531 🔝Call Girls Vineet Khand Lucknow best Night Fun service 🧦
CALL ON ➥8923113531 🔝Call Girls Vineet Khand Lucknow best Night Fun service  🧦CALL ON ➥8923113531 🔝Call Girls Vineet Khand Lucknow best Night Fun service  🧦
CALL ON ➥8923113531 🔝Call Girls Vineet Khand Lucknow best Night Fun service 🧦
 
Call Girls 🫤 Nehru Place ➡️ 9999965857 ➡️ Delhi 🫦 Russian Escorts FULL ENJOY
Call Girls 🫤 Nehru Place ➡️ 9999965857  ➡️ Delhi 🫦  Russian Escorts FULL ENJOYCall Girls 🫤 Nehru Place ➡️ 9999965857  ➡️ Delhi 🫦  Russian Escorts FULL ENJOY
Call Girls 🫤 Nehru Place ➡️ 9999965857 ➡️ Delhi 🫦 Russian Escorts FULL ENJOY
 
Falcon Invoice Discounting - Best Platform
Falcon Invoice Discounting - Best PlatformFalcon Invoice Discounting - Best Platform
Falcon Invoice Discounting - Best Platform
 

Housing Affordability Report Reveals Generational Struggle

  • 1. MAY 2017 Perceptions of Housing Affordability Report 2017
  • 2. 2 | Perceptions of Housing Affordability Report 2017 Welcome to the 2017 Perceptions of Housing Affordability report by CoreLogic.01.
  • 3. Perceptions of Housing Affordability Report 2017 | 3 © Copyright 2017 | RP Data Pty Ltd trading as CoreLogic Asia Pacific (CoreLogic) and its licensors are the sole and exclusive owners of all rights, title and interest (including intellectual property rights) subsisting in this publication including any data, analytics, statistics and other information. All rights reserved. Perceptions of Housing Affordability is a landmark report by CoreLogic that compares current property data to the cost concerns and housing aspirations across Australia’s generations, families, states and income brackets. The report identifies how Australians of all demographics feel about affordability and its impact on their dreams of property ownership or property upgrading and provides insights into what governments and authorities can do to affect change. Residential real estate is the country’s largest asset class at $7.0 trillion – far outstripping superannuation at $2.2 trillion and listed stocks at $1.8 trillion1 . Australian households have more than half their wealth tied up in the residential housing sector and about 70% of their debt is housing related. This new survey reveals the degrees to which the great Australian dream of home ownership is becoming an insurmountable challenge. It reveals that a growing proportion of younger generations, while overwhelmingly maintaining a sustained appetite to live the dream, are staying home with parents – increasingly into their 30s – to save for deposits. It captures the degree to which parents are being expected to assist their adult children in either saving for - or paying for - a home, and reveals how families with low incomes and or young children are becoming more vulnerable to mortgage stress. The survey identifies how buying a home is becoming the privilege of high income earners who are being expected to assign ever increasing proportions of income towards servicing a mortgage. And it reveals how older Australians are deeply fearful of the costs of moving or downgrading, which in turn is affecting supply and contributing to raising housing costs even further especially in inner cities. By every measure, housing affordability has worsened over the past 15 years. The cost of buying a house currently takes 7.2 times2 the annual income of a typical household – up from 4.2 times income 15 years ago. It now takes 1.53 years of household income to save for a 20% deposit on a home and servicing a typical loan of 80% of the value of a house now requires 39%4 of household income, compared with 25% in 2001. Australia is even one of the least affordable countries for housing in the world with all five of our capitals labelled as severely unaffordable and amongst the top 20 unaffordable cities internationally.5 Addressing housing affordability cannot be fixed with a single silver bullet. It is an issue that affects every layer of government and requires unprecedented cooperation to properly address. Most importantly, it requires leadership at the highest level of government. This is the first time CoreLogic - or any other property data and analytics provider - has attempted to capture the depth and extent of the attitudes of the different strata of society and applied them to the topic of housing affordability. We have sought to quantify just how much the different strata of Australian society care about varying factors relating to affordability including their concerns, what they perceive to be the obstacles, the concessions they are prepared to make to buy property and the strategies they believe will make housing more affordable. We take this action in the firm belief that what is measured can be managed and that these measurements may help policy makers identify better policies to improve housing affordability where it is most needed. I trust you find the report valuable and I’d love to hear your feedback. Lisa Claes Chief Executive Officer, CoreLogic International 1 CoreLogic 2017 2,3,4 ibid 5 Demographica 2017
  • 4. Contents 01 02 03 Welcome Executive summary The methodology Page 2 Page 6 Page 8 04 05 06 National overview and key insights State-based attitudes to housing affordability Generational attitudes towards housing affordability a. How is housing affordability measured? a. The investor landscape a. How listing anxiety is affecting housing affordability b. Housing affordability across the states Page 9 Page 16 Page 26
  • 5. 07 08 09 Families, children and housing affordability Housing affordability, wages and employment Options to fix housing affordability a. When will the kids leave home? a. Is apartment ownership more realistic? a. How does Australia’s affordability compare internationally? b. Home ownership: a team sport Page 32 Page 40 Page 48 10 Conclusion Page 56
  • 6. 6 | Perceptions of Housing Affordability Report 2017 © Copyright 2017 | RP Data Pty Ltd trading as CoreLogic Asia Pacific (CoreLogic) and its licensors are the sole and exclusive owners of all rights, title and interest (including intellectual property rights) subsisting in this publication including any data, analytics, statistics and other information. All rights reserved.  Executive summary By every measure, housing affordability has worsened over the past 15 years. The cost of buying a dwelling currently takes 7.2 times6 the annual income of a typical household – up from 4.2 times income 15 years ago. It now takes 1.5[2] years of household income to save for a 20% deposit on a dwelling compared with 0.8 years 15 years ago and servicing a typical loan of 80% of the value of a dwelling now requires 38.8%[3] of household income, compared with 25.2% in 2001. How has this happened? As a result of low interest rates, we have seen a reduction in the costs associated with servicing a mortgage which has led to financial institutions lending ever higher amounts in markets where demand is outstripping supply. Meanwhile the ‘deposit hurdle’ has risen, creating a financial barrier for new entrants to the market and high migration has increased dwelling demand, particularly in Sydney and Melbourne. Transaction costs are also playing a significant role. Stamp duty costs on the median priced dwelling are now around $35,000 across both Sydney and Melbourne which is adding to the savings challenge of prospective buyers. To keep the dream of home ownership alive, the Perceptions of Housing Affordability Report identifies that Australians are making more and more concessions in terms of income sacrifice, property suitability factors and staying at home with parents longer to save for their own place, but they are struggling. That struggle is being fought hardest across the generations, across different family types, across different wage brackets – and even across states - with older and richer sections of society becoming the property ‘haves’ while others risk being branded ‘least likely’ unless governments at all levels come together to radically rethink ways to address supply and demand. 6 CoreLogic 2017 2,3 ibid 02.
  • 7. Perceptions of Housing Affordability Report 2017 | 7 © Copyright 2017 | RP Data Pty Ltd trading as CoreLogic Asia Pacific (CoreLogic) and its licensors are the sole and exclusive owners of all rights, title and interest (including intellectual property rights) subsisting in this publication including any data, analytics, statistics and other information. All rights reserved. 62% of respondents believe housing affordability is worse now than it was a year ago; 58% believe next year will be even worse 87% of Australian non-property owners are concerned about being able to afford their first or next home The greatest impediments to housing affordability are: 1. Having the deposit; 2. Stamp duty; and 3. Foreign buyers. Most people believe now is a good time to sell; in WA they think it’s a good time to buy Australians are not highly knowledgeable about market mechanics Price is the most important factor in selecting where to buy (79%), followed by proximity to work (45%) People are not prepared to move interstate to get affordable housing 30% are looking to inheritance or parents to buy them a house 62% of people living with parents say they can’t afford to move out 89% of non-homeowners say that it is important to be able to buy your own home Those who earn the most are most likely to rank proximity to work as an important factor (54% of those with household incomes over $130K), while households with children will nominate proximity to schools (58% for those with children 0-4 and 50% for those with children 5-17). The older we get, the more concerned we become with being near infrastructure such as hospitals with 49% of Baby Boomers identifying this as an important factor. Views of affordability
  • 8. 8 | Perceptions of Housing Affordability Report 2017 © Copyright 2017 | RP Data Pty Ltd trading as CoreLogic Asia Pacific (CoreLogic) and its licensors are the sole and exclusive owners of all rights, title and interest (including intellectual property rights) subsisting in this publication including any data, analytics, statistics and other information. All rights reserved.  The methodology The 2017 Perceptions of Housing Affordability Report is based on a study conducted by Galaxy Research using an online permission- based panel. The study was carried out between Tuesday March 7 and Thursday March 13, 2017. Age, gender and area quotas were applied to the sample. Following the completion of interviewing, the data was weighted by age, gender and area to reflect the latest ABS population estimates. The results were analysed by CoreLogic to discover the deltas that identified different attitudes and behaviours around housing affordability that were perceived to be significant or which could shed further light on the complex tapestry of affordability across states, demographics, family makeup, income and home ownership type. The final report was written to highlight these stories within the data. To make the report easier to consume, the data has not been presented where there were no significant behavioural differences indicated. In these incidences, national results are indicative of how the smaller groups also behave or feel. All percentages in this research have been rounded up to whole numbers. The study interviewed 2010 Australians aged between 18-64 years distributed across Australia as follows: New South Wales Victoria Queensland Tasmania Australian Capital Territory South Australia/ Northern Territory Western Australia 490 400 300 200 200 220 200 03.
  • 9. Perceptions of Housing Affordability Report 2017 | 9 © Copyright 2017 | RP Data Pty Ltd trading as CoreLogic Asia Pacific (CoreLogic) and its licensors are the sole and exclusive owners of all rights, title and interest (including intellectual property rights) subsisting in this publication including any data, analytics, statistics and other information. All rights reserved. National overview and key insights Owning your own home is the great Australian dream, but just over half of Australians are able to achieve it. The survey shows 53% of Australians aged 18-64 own their own home with 35% of that number having a mortgage on a property and 19% fully owning their home mortgage free. A total of 37% of Australians have never owned property, but this number is significantly higher for Millennials (those aged 18-34) at 60%. Of the 47% who do not currently own property, 33% rent or lease, while 12% live with their parents and 2% identified as having ‘other’ living arrangements. Yet despite their dream of property ownership, the research shows Australians generally do not have a huge amount of knowledge about the machinery of the real estate market. No more than half are aware of any one of the factors such as stamp duty concessions, deposit levels, investor lending limits and foreign ownership restrictions and more than a quarter - 27% - were not aware of any of the four factors. Property ownership is concentrated amongst couples, those who work full time and those who earn higher salaries. The survey shows 64% of those who are married or in a defacto relationship currently own property, while 33% of those who are single (whether never married, divorced, widowed or separated) currently own property. It further shows 64% of those who work full time own property compared with just 44% of those who work part time and 37% of people who do not work own property. Property ownership is also concentrated amongst Baby Boomers and families with small children. These demographics are covered in depth within their own chapters in the report How important is home ownership? The ideal of property ownership is extremely important for non-homeowners - 89% say it is important, which includes 55% who say it is very important. Millennials – of whom 60% have never owned a property – are the most likely to aspire to the dream with 96% rating it as important. The survey also shows the new phenomenon of ‘rent-vesting’ is also starting to take hold with 14% of non-homeowners stating they would definitely buy an investment property first, and a further 27% stating they would consider it. However, just 4% of non- homeowners already owned an investment property. Concern about housing affordability Concern about housing affordability is extremely high with 88% of Australian non- property owners concerned to some extent about being able to afford to buy a property. This is made up of 58% of those who rent/ lease who are very concerned about being able to afford to buy their first home, while 53% of those who live in an apartment are very concerned about being able to afford to buy. Even owning a property is not enough to assuage this anxiety with 77% of property owners concerned to some extent about being able to afford what they want and need for their next home move. 51% are aware that some states provide stamp duty concessions for first home buyers. 42% are aware that banks allow you to purchase property with less than 20% deposit. 29% are aware that banks have limits on the percentage of lending they can offer investors. 25% are aware that overseas buyers can only buy new properties (unless they have residency. 04.
  • 10. 10 | Perceptions of Housing Affordability Report 2017 © Copyright 2017 | RP Data Pty Ltd trading as CoreLogic Asia Pacific (CoreLogic) and its licensors are the sole and exclusive owners of all rights, title and interest (including intellectual property rights) subsisting in this publication including any data, analytics, statistics and other information. All rights reserved.  The majority of Australians (62%) believe that housing affordability is worse than a year ago with 35% of Australians saying that housing affordability is significantly worse or very much worse than a year ago. Only 10% of Australians feel that housing affordability is better to some degree than it was a year ago, while 4% don’t know and 24% believe it is the same. A total of 58% of Australians say that housing affordability this time next year will be worse with 18% saying it will be significantly worse, 15% very much worse and 26% believing it will be slightly worse. Only 12% of Australians believe housing affordability will be better in any way by the same time next year with 6% undecided, and 24% believing it will be about the same. What are the obstacles to housing affordability? The perception of which obstacles are the biggest when it comes to housing affordability changes according to generation, age of children and income levels, nationally across the board it is the ‘lump sum’ initial costs of having the deposit and payment of stamp duty that are seen as the biggest hurdles. Selection factors and concessions to enable home ownership Price is the most important factor for Australians when considering where to buy with 79% putting the dollars first. This is followed by a cohort of 73% of people who say that proximity - whether to work, family, school or distance to the city – is important, followed by a cohort of 52% who rate public transport as important. Concern levels about being able to afford a home: 50% Very Concerned 24% Quite Concerned 14% Slightly Concerned 13% Not Concerned at all Which factors are important when selecting where to buy? 79% Price 45% Proximity to work 40% Good public transport 39% Infrastructure eg: hospitals 37% Distance to city 30% Capital growth 30% Local work and jobs 30% Proximity to family 29% Proximity to school 28% Larger blocks of land The Biggest Impediments to Housing Affordability 44% 44% 42% 41% 39% 38% 37% 32% 30% 27% HavingtheDeposit StampDuty ForeignBuyers Certainty ofEmployment InterestRates GettingLoan Approval Meeting Repayments Lenders Mortgage Insurance Negative GearingBenefits toInvestors Investors intheMarket
  • 11. Perceptions of Housing Affordability Report 2017 | 11 © Copyright 2017 | RP Data Pty Ltd trading as CoreLogic Asia Pacific (CoreLogic) and its licensors are the sole and exclusive owners of all rights, title and interest (including intellectual property rights) subsisting in this publication including any data, analytics, statistics and other information. All rights reserved. Australians are more likely to settle for a property that does not meet all their criteria than choose a less desirable suburb, move interstate or travel further. When non-homeowners were asked what the greatest help would be to buy their first home, 62% said it was a secure and well paid job, while 39% said government assistance and 26% said they were looking to an inheritance to help them buy a home. Family assistance was also important with 10% stating they wanted help from their parents to buy them a house, 11% saying that help from parents to pay the mortgage would be a great help and 17% wanting family assistance to save for the deposit. Affordability and payment stress The research shows 8% of home owners are currently already having difficulty meeting mortgage payments now, while a further 6% would have difficulty meeting repayments that were 0.5% higher and a further 14% would have difficulty with a 1% increase. More than half of Australia’s property owning population would struggle should interest rate increases rise as high as 2% with 52% of property owners with mortgages saying this would cause difficulty. Just 10% say they would have no difficulties with any interest rate increase while 14% said they did not know at what point they would have an issue. Raising the typical deposit of 20% is also a huge hurdle for Australians who are renting or living with family, with 35% stating they could manage less than 10% deposit towards their property and just 18% stating they could put down 20% or more. But while they struggle with a deposit, non- homeowners are willing to forgo more than the typical 30% of their income to service a mortgage with 23% willing to dedicate 40% or more while 30% were willing to dedicate 30-39%. A further 23% were prepared to dedicate less than 30% and 3% were willing to dedicate 60% or more. Affordability concessions 42% Choose a property that does not meet all my criteria 33% Choose a property that is more affordable 27% Choose a property that is further from my work or amenities 24% Move to a regional town 21% Move to a less desirable suburb 17% Buy a property with family or friends 14% Move interstate How much deposit can non homeowners can afford? 13% 35% 27% 18% Nodeposit Couldput1%-9% Couldput10%-19% Couldputmore than20%down
  • 12. 12 | Perceptions of Housing Affordability Report 2017 © Copyright 2017 | RP Data Pty Ltd trading as CoreLogic Asia Pacific (CoreLogic) and its licensors are the sole and exclusive owners of all rights, title and interest (including intellectual property rights) subsisting in this publication including any data, analytics, statistics and other information. All rights reserved.  Best strategies for improving affordability 73% Reduce or remove stamp duty (40% believe it would be very helpful) 71% Create government grants or concessions for first home buyers 65% Create more jobs in areas with lower priced housing 63% Appoint a federal housing minister to improve affordability 61% Improve transport options and commuting 60% Release more vacant land 57% Limits on investment buying via regulation 57% Reduce costs paid by developers to build new homes 53% Build apartments close to major work centres 51% Reduce overseas migrants arriving in Australia
  • 13. Perceptions of Housing Affordability Report 2017 | 13 © Copyright 2017 | RP Data Pty Ltd trading as CoreLogic Asia Pacific (CoreLogic) and its licensors are the sole and exclusive owners of all rights, title and interest (including intellectual property rights) subsisting in this publication including any data, analytics, statistics and other information. All rights reserved.
  • 14. 14 | Perceptions of Housing Affordability Report 2017 © Copyright 2017 | RP Data Pty Ltd trading as CoreLogic Asia Pacific (CoreLogic) and its licensors are the sole and exclusive owners of all rights, title and interest (including intellectual property rights) subsisting in this publication including any data, analytics, statistics and other information. All rights reserved.  a. How is housing affordability measured? CoreLogic measures housing affordability according to four key measures: 1. PRICE TO INCOME RATIO The median price of a house or unit (or dwelling = combined houses and units) is compared with median household incomes to provide a ratio. A housing price to income ratio of 5 implies that the typical household will spend five times their annual gross income to purchase a house within the area. 2. DEPOSIT RATIO This is the proportion of household income required for a 20% deposit. This measure is most relevant for new buyers who need to save a deposit before buying. 3. LOAN TO VALUATION RATIO The proportion of household income required to service an 80% loan based on the discounted variable mortgage rate and the median selling price of a home. 4. INCOME TO RENT RATIO This measures the percentage of household income required to pay rent, based on median rental rates. ff Median household incomes used by CoreLogic are modelled by the Australian National University (ANU).
  • 15. Perceptions of Housing Affordability Report 2017 | 15 © Copyright 2017 | RP Data Pty Ltd trading as CoreLogic Asia Pacific (CoreLogic) and its licensors are the sole and exclusive owners of all rights, title and interest (including intellectual property rights) subsisting in this publication including any data, analytics, statistics and other information. All rights reserved. b. Housing affordability across the states Region Price to income ratio Years of household income required for a 20% deposit on a dwelling % of household income required to service an 80% LVR mortgage % of household income required to rent a home Household income (per week) SYDNEY 8.4 1.7 44.4% 28.5% $1,826 REGIONAL NSW 6.6 1.3 35.2% 29.5% $1,188 MELBOURNE 7.1 1.4 37.9% 25.7% $1,535 REGIONAL VIC 5.6 1.1 29.8% 26.9% $1,043 BRISBANE 5.9 1.2 31.3% 26.1% $1,531 REGIONAL QLD 7.0 1.4 37.2% 31.5% $1,111 ADELAIDE 6.4 1.3 34.0% 26.5% $1,247 REGIONAL SA 5.0 1.0 26.6% 25.1% $976 PERTH 6.1 1.2 32.2% 23.6% $1,570 REGIONAL WA 5.5 1.1 29.4% 27.5% $1,199 HOBART 5.8 1.2 30.6% 28.3% $1,167 REGIONAL TAS 5.1 1.0 26.9% 27.2% $957 DARWIN 4.5 0.9 23.9% 22.5% $2,091 REGIONAL NT 5.0 1.0 26.3% 29.1% $1,476 AUSTRALIAN CAPITAL TERRITORY 5.3 1.1 28.4% 22.4% $1,960 COMBINED CAPITAL CITIES 6.9 1.4 36.4% 26.1% $1,610 COMBINED REGIONAL AREAS 6.4 1.3 33.8% 29.5% $1,118 NATIONAL 7.2 1.5 38.8% 29.7% $1,313
  • 16. 16 | Perceptions of Housing Affordability Report 2017 © Copyright 2017 | RP Data Pty Ltd trading as CoreLogic Asia Pacific (CoreLogic) and its licensors are the sole and exclusive owners of all rights, title and interest (including intellectual property rights) subsisting in this publication including any data, analytics, statistics and other information. All rights reserved.  State-based attitudes to housing affordability How the states compare Victorians and Tasmanians are most likely to own a home outright with 22% of residents being mortgage free in those states compared with 19% for NSW and just 15% in Queensland. Residents of the ACT (47%) and WA (41%) are most likely to own their home with a mortgage, compared with 33% of residents in NSW. Queensland is where the greatest number of residents rely on rental accommodation with 43% renting or leasing, compared with 31% who own a property with a mortgage. While living in a stand-alone house dominates across the states, apartment living is highest in NSW at 22%, followed by Queensland at 17% and Victoria at 15%. There was a slight bias towards the view that now is a good time to sell – particularly in NSW and VIC – rather than buy which was the stronger view in WA. Tasmania was the state with the highest proportion of incomes under $40K (28%) while the ACT (31%) and WA (23%) had the highest proportion of wages over $130K. Queenslanders and ACT residents who live at home with their parents are the most motivated to move out and buy with 48% of QLD stating they were saving money towards a home deposit and 49% of ACT residents. This compares with just 24% of NSW residents living with their parents and 28% of Victorians. Victorians (78%) and ACT residents (75%) living at home were also the most likely to claim they could not afford to move out compared with 52% of NSW and 60% for Queensland. Who owns property: STATE OWNERSHIP LEVEL MEDIAN HOUSE SALES PRICE AUSTRALIAN CAPITAL TERRITORY 61% $636k VICTORIA 56% $530k WESTERN AUSTRALIA 55% $475k TASMANIA 53% $300k SOUTH AUSTRALIA 50%* $400k NORTHERN TERRITORY 50%* $490k NEW SOUTH WALES 49% $630k QUEENSLAND 44% $470k *CoreLogic house median sales price past 12 months, April 2017. 05.
  • 17. Perceptions of Housing Affordability Report 2017 | 17 © Copyright 2017 | RP Data Pty Ltd trading as CoreLogic Asia Pacific (CoreLogic) and its licensors are the sole and exclusive owners of all rights, title and interest (including intellectual property rights) subsisting in this publication including any data, analytics, statistics and other information. All rights reserved. 28% of NSW residents believe it is a good time to sell (while 27% believe it is neither one nor the other). 30% of Victorians believe it is a good time to sell (with a further 30% believing it is neither one nor the other). 33% of Tasmanians believe the market is balanced while 23% believe it is a good time to sell. 35% of South Australians believe the market is fairly balanced. 35% of NT residents believe the market is fairly balanced. 36% of WA residents believe the market is fairly balanced, but they are also the state most likely to believe it is a good time to buy (30%). 32% of Queenslanders believe the market is fairly balanced. 35% of ACT residents believe the market is balanced, while 26% believe it is a good time to sell. Type of property you reside in: STATE HOUSE APARTMENT TOWNHOUSE /OTHER AUSTRALIAN CAPITAL TERRITORY 70% 13% 17% VICTORIA 73% 15% 12% WESTERN AUSTRALIA 77% 8% 15% TASMANIA 80% 7% 13% SOUTH AUSTRALIA /NORTHERN TERRITORY 82% 9% 9% NEW SOUTH WALES 65% 22% 13% QUEENSLAND 72% 17% 11% *Combined SA/NT figures in the Housing Affordability survey
  • 18. 18 | Perceptions of Housing Affordability Report 2017 © Copyright 2017 | RP Data Pty Ltd trading as CoreLogic Asia Pacific (CoreLogic) and its licensors are the sole and exclusive owners of all rights, title and interest (including intellectual property rights) subsisting in this publication including any data, analytics, statistics and other information. All rights reserved.  How important is home ownership? Across the states, the importance of buying a home to those who are currently renting or living with parents is overwhelming. Queenslanders were the most adamant with 91% stating it was important with 61% stating it was very important. The numbers were similar in NSW where 91% of respondents said being able to buy their own home was important with 57% stating it was very important. In WA, 87% stated it was important with 46% stating it was very important compared with Victoria where 86% said it was important but 51% nominated it as very important. Residents of Tasmania and the ACT were the most likely to rate home ownership as not important with 17% and 16% stating it was not a priority. Concern about housing affordability Concern about not being able to afford what you want or need for your next home is highest among those who currently own property in NSW (82%) followed by WA (81%). In Victoria 73% of home owners expressed concern about not being able to afford what they wanted or needed to buy, compared with 71% in Queensland and 70% in South Australia and NT. In the ACT, 74% of respondents felt this fear, but only 58% of home owners were concerned in Tasmania. State borders are a strong indicator of pessimism about housing affordability with 45% of NSW residents believing affordability is now very much or significantly worse than it was a year ago compared with 36% of Victorians. Housing affordability next year will be worse in some way: NSW VIC QLD TAS ACT SA/NT WA 63% 58% 61% 58% 64% 55% 44% Based on very much worse, significantly worse and slightly worse responses Housing affordability is worse than last year: NSW VIC QLD TAS ACT SA/NT WA 68% 66% 60% 63% 71% 56% 44% Based on very much worse, significantly worse and slightly worse responses
  • 19. Perceptions of Housing Affordability Report 2017 | 19 © Copyright 2017 | RP Data Pty Ltd trading as CoreLogic Asia Pacific (CoreLogic) and its licensors are the sole and exclusive owners of all rights, title and interest (including intellectual property rights) subsisting in this publication including any data, analytics, statistics and other information. All rights reserved. What are the obstacles to housing affordability? For NSW residents, the biggest impediments to affordability are stamp duty (48%), foreign buyers in the market (46%) and investors in the market and having the deposit (42% each). For Victorians, having the deposit and foreign buyers in the market (44% each) are large or huge impediments followed by certainty of employment (40%). Queenslanders find getting the deposit together as the biggest impediment (48%) followed by getting loan approval and interest rates (43% each) and then stamp duty (42%). WA residents are also highly concerned about the deposit (47%) followed by stamp duty (46%) and certainty of employment (45%). Residents in SA and NT find stamp duty an impediment (48%) followed by certainty of employment and raising the deposit equal at 42%. Tasmanians are most concerned about deposits (46%), interest rates (44%) and certainty of employment and stamp duty equal at 43%. ACT residents are the most relaxed of all the states and territories with perceptions about impediments rarely rising above 40% of respondents and only then on the topic of stamp duty (46%). Investors in the market rank second at 39% followed closely by the perception that foreign investors are an impediment and raising the deposit (38% each). Meeting repayments are a large or huge impediment to affording a home: NSW VIC QLD TAS ACT SA/NT WA 41% 33% 36% 36% 34% 33% 40% Interest rates are a large or huge impediment to affording a home: NSW VIC QLD TAS ACT SA/NT WA 41% 34% 43% 44% 33% 35% 38%
  • 20. 20 | Perceptions of Housing Affordability Report 2017 © Copyright 2017 | RP Data Pty Ltd trading as CoreLogic Asia Pacific (CoreLogic) and its licensors are the sole and exclusive owners of all rights, title and interest (including intellectual property rights) subsisting in this publication including any data, analytics, statistics and other information. All rights reserved.  Investors in the market is a large or huge impediment to affording a home: NSW VIC QLD TAS ACT SA/NT WA 42% 37% 34% 39% 39% 33% 30% Foreign buyers in the market is a large or huge impediment to affording a home: NSW VIC QLD TAS ACT SA/NT WA 46% 44% 41% 43% 38% 35% 36% Certainty of Employment is a large or huge impediment to affording a home: NSW VIC QLD TAS ACT SA/NT WA 40% 40% 41% 43% 36% 42% 45% Getting loan approval is a large or huge impediment to affording a home: NSW VIC QLD TAS ACT SA/NT WA 39% 33% 43% 41% 29% 39% 39%
  • 21. Perceptions of Housing Affordability Report 2017 | 21 © Copyright 2017 | RP Data Pty Ltd trading as CoreLogic Asia Pacific (CoreLogic) and its licensors are the sole and exclusive owners of all rights, title and interest (including intellectual property rights) subsisting in this publication including any data, analytics, statistics and other information. All rights reserved. Having the deposit is a large or huge impediment to affording a home: NSW VIC QLD TAS ACT SA/NT WA 42% 44% 48% 46% 38% 42% 47% Negative gearing is a large or huge impediment to affording a home: NSW VIC QLD TAS ACT SA/NT WA 33% 30% 28% 31% 31% 24% 29% Stamp duty is a large or huge impediment to affording a home: NSW VIC QLD TAS ACT SA/NT WA 48% 37% 42% 43% 46% 48% 46%
  • 22. 22 | Perceptions of Housing Affordability Report 2017 © Copyright 2017 | RP Data Pty Ltd trading as CoreLogic Asia Pacific (CoreLogic) and its licensors are the sole and exclusive owners of all rights, title and interest (including intellectual property rights) subsisting in this publication including any data, analytics, statistics and other information. All rights reserved.  Most important factors when selecting where to buy NSW VIC QLD TAS 42% Good public transport to and from work 45% Good public transport to the city or shopping 42% Access to infrastructure (hospitals) 34% Good public transport to the city or shopping 40% Good public transport to the city or shopping 42% Good public transport to and from work 40% Good public transport to the city or shopping 33% Access to infrastructure (hospitals) 39% Access to infrastructure (hospitals) 38% Access to infrastructure (hospitals) 38% Good public transport to and from work 29% Prospects for locally based work ACT SA/NT WA 46% Access to infrastructure (hospitals) 37% Good public transport to and from work 39% Access to infrastructure (hospitals) 44% Good public transport to and from work 36% Good public transport to the city or shopping 35% Good public transport to and from work 42% Good public transport to the city or shopping 33% Access to infrastructure (hospitals) 33% Good public transport to the city or shopping Selection factors and concessions to enable home ownership? Buying a more affordable property that does not meet all the criteria is the concession acceptable by the most people in each state. NSW renters are most likely of all the states to buy an investment property as their first purchase. The research shows 51% of NSW (18% definitely and 33% possibly) would buy an investment property first – well ahead of Victoria where 39% would consider this option (12% definitely and 27% possibly). Of all the states, Tasmanians are the most likely to consider moving to a regional town (30%) as a concession to buying a property, followed by NSW at 27%. NSW residents are also more likely than inhabitants of other states to consider buying property with family or friends with 20% willing to consider it, compared with 17% in Queensland and the ACT and just 15% in Victoria.
  • 23. Perceptions of Housing Affordability Report 2017 | 23 © Copyright 2017 | RP Data Pty Ltd trading as CoreLogic Asia Pacific (CoreLogic) and its licensors are the sole and exclusive owners of all rights, title and interest (including intellectual property rights) subsisting in this publication including any data, analytics, statistics and other information. All rights reserved. Affordability and payment stress A third or more of renters in each state believe they will need to forego more than the traditional 30% of income into their mortgage when they get one and this is roughly aligned with the perception of affordability in each state. Renters in NSW (48%) are more likely to be willing to dedicate between 30 to 49% of their income to servicing a mortgage, compared with 45% in Queensland, 41% in WA and 37% in Victoria. The research shows that Tasmanian homeowners are currently having the most difficulty paying existing mortgages, but an increase of up to 1% in interest rates would mean that 32% of WA homeowners would experience difficulty followed by Victoria and Queensland. Who is struggling the most with current mortgages? (Having difficulty paying mortgages now) NSW VIC QLD TAS ACT SA/NT WA 5% 6% 12% 13% 4% 8% 12% Which states have the most difficulty paying interest rate increases of between 0-1% NSW VIC QLD TAS ACT SA/NT WA 25% 31% 28% 21% 18% 22% 32%
  • 24. 24 | Perceptions of Housing Affordability Report 2017 © Copyright 2017 | RP Data Pty Ltd trading as CoreLogic Asia Pacific (CoreLogic) and its licensors are the sole and exclusive owners of all rights, title and interest (including intellectual property rights) subsisting in this publication including any data, analytics, statistics and other information. All rights reserved.  Best strategies for improving affordability Stamp duty is universally unpopular across the states with roughly three quarters of residents claiming removing it would improve affordability. ACT is the most adamant at 78% followed by SA/NT at 76% and NSW and Queenslanders at 74%. Most of this number in NSW (42%) is made up of residents who believe removing stamp duty would be very helpful, indicative of the high cost of stamp duty in that state due to high property prices. More than half of those surveyed in the big states believe that reducing the number of overseas migrants would be an effective strategy to improve housing affordability with 53% of NSW and Queenslanders feeling this could work and 51% of Victorians. These numbers compare with 49% of WA residents, 46% each for SA/NT and Tasmanians and just 43% of ACT residents. Western Australia is the state that would most like to see a shared equity program to help first home buyers with 14% of respondents claiming it would be a help, compared with 7% in most other states. Queenslanders (70%) and Tasmanians (73%) believe creating more jobs in areas that have lower priced housing would also improve housing affordability. This compares with 68% for WA, 64% for VIC and 63% for NSW. Building more apartments closer to major working areas and along transport corridors is seen as an effective strategy to improve housing affordability by 61% of ACT residents, 58% in WA, 55% in NSW and 58% of Tasmanians. Just over half (51%) of Queenslanders feel it would be effective, and 50% of Victorians believe it would be useful. Removing or reducing stamp duty as an effective strategy to improve housing affordability NSW VIC QLD TAS ACT SA/NT WA 74% 71% 74% 72% 78% 76% 70%
  • 25. Perceptions of Housing Affordability Report 2017 | 25 © Copyright 2017 | RP Data Pty Ltd trading as CoreLogic Asia Pacific (CoreLogic) and its licensors are the sole and exclusive owners of all rights, title and interest (including intellectual property rights) subsisting in this publication including any data, analytics, statistics and other information. All rights reserved. The research shows that 43% of investors own their home mortgage free, while 41% of investors own a home but are paying it off with a mortgage. Only 11% of those who own an investment property are renting, while 5% live with parents. Not surprisingly, only 25% of people who own an investment property believe that negative gearing is an impediment to housing affordability while 31% of those surveyed believe it is not an impediment at all. Investment properties are also more likely to be owned by families with children living at home. The survey showed 22% of those with children aged 5 to 17 owned an investment property followed by 18% of those with very young children aged 0 to 4 and 17% of those with children 18+, indicating that property is an important family investment strategy. a. The investor landscape Who owns the investment properties? 20% 18% 11% 15% 15% 16% 9% 19%
  • 26. 26 | Perceptions of Housing Affordability Report 2017 © Copyright 2017 | RP Data Pty Ltd trading as CoreLogic Asia Pacific (CoreLogic) and its licensors are the sole and exclusive owners of all rights, title and interest (including intellectual property rights) subsisting in this publication including any data, analytics, statistics and other information. All rights reserved.  Generational attitudes towards housing affordability How the generations compare: Within the survey, respondents were broken down into three generational categories. The youngest were Millennials aged 18-34, Gen X aged 34-49 and Baby Boomers aged 50-64. Their responses identified some significant differences in both the level of home ownership and the degree to which it was likely to be obtained. There were also differences in opinion between the issues that each generation believed were making housing affordability difficult and the measures best to address it. The difference in levels of property ownership across the generations was marked with 34% of Millennials currently owning property, jumping to 62% of Gen X and 68% of Baby Boomers. The more mature generations of Gen X and Baby Boomers have had the benefits of substantial equity creation, particularly benefiting from the strong housing market growth cycles that occurred between 2000 to 2003 (when capital city dwelling values rose +74%), 2006 to 2007 (when capital city dwelling values rose +22%) and 2009 to 2010 (growth of +20%) as well as the current cycle of growth where capital city dwellings are now 49.3% higher.7 Perhaps unsurprisingly given the amount of time they have had to pay off a mortgage, Baby Boomers were most likely to own a property outright (37%) compared with 13% for Gen X and 9% for Millennials. Within the survey, 44% of the Millennials worked full time, while 55% of Gen X and 37% of Baby Boomers worked full time. Baby Boomers were the most likely not to work with 41% currently not working at all, which is most likely indicative of retirement at the higher end of the age bracket. Millennials were least likely to own a home with 60% stating they had never owned a property. Millennials were most likely to rent (38%) or live with parents (27%). A small proportion – 12% - owned an investment property. About a third (31%) of Gen X rent or lease while 15% are likely to live at home. Meanwhile 28% of Baby Boomers rent or lease and 1% live at home. The proportion of Gen X and Baby Boomers who own an investment property are 19% and 18% respectively. How important is home ownership? The survey shows that while home ownership is overwhelmingly important across the generations, the degree of that importance drops off somewhat with age. Of the Millennials who are either renting or living at home, 96% stated it was important with 61% stating it was very important while 87% of Gen X stated it was important (53% stating it was very important). Although also in a significant majority, just 73% of Baby Boomers stated that home ownership was important and less than half (40%) said it was very important. Concern about housing affordability The research shows that concern levels about housing affordability are extraordinarily high across the generations, although again, this decreases slightly with age. Amongst those who do not currently own a property, 95% of Millennials are concerned to some degree about being able to afford to buy either their first home or their next home, of whom 50% are very concerned. This compares with 86% of Gen Xers, 54% of whom are very concerned, and 72% of Baby Boomers with 45% very concerned. Anxiety levels remain significant even once a property has been purchased with 91% of Millennials concerned they will not be able to afford their next move, compared with 77% of Gen X and just 64% of Baby Boomers. Millennials however are likely to be slightly less gloomy about how housing affordability is tracking than other generations. When 06. 7 CoreLogic 2017
  • 27. Perceptions of Housing Affordability Report 2017 | 27 © Copyright 2017 | RP Data Pty Ltd trading as CoreLogic Asia Pacific (CoreLogic) and its licensors are the sole and exclusive owners of all rights, title and interest (including intellectual property rights) subsisting in this publication including any data, analytics, statistics and other information. All rights reserved. compared with last year, 29% of Millennials believe housing affordability is worse now. Older generations feel this is more the case with 38% of Gen X feeling affordability is worse now than it was a year ago and 40% of Baby Boomers believing it to be the case. Gloominess about affordability into the future likewise increases with age with 54% of Millennials believing housing affordability will be even worse to some degree next year compared with 59% of Generation X and 64% of Baby Boomers. What are the obstacles to housing affordability? The obstacles to housing affordability are perceived very differently across the generations especially across the headline issues of stamp duty and foreign investment. Millennials are least likely to see foreign investors as an impediment to housing affordability with just 17% stating they were a huge impediment in comparison to 26% of Gen X and 31% Baby Boomers. Similarly, only 13% of Millennials found stamp duty a huge impediment compared with 23% of Gen X and 29% of Baby Boomers. In order of importance, Millennials are most likely to find having the deposit (49%), interest rates (44%) and a combination of certainty of employment and getting loan approval (41% each) to be the biggest impediments. This compares with Gen X, 48% of whom believe stamp duty is a major impediment, followed by the number of foreign buyers in the market and the difficulty raising a deposit (45% each) and lastly, certainty of employment (40%). Baby Boomers are even more opposed to stamp duty (49%) and the most likely to blame the number of foreign buyers in the market (48%) for affordability issues, followed by certainty of employment (42%). A further 40% believe investors in the market are an issue that impedes affordability. IMPEDIMENTS TO HOUSING AFFORDABILITY INTEREST RATES Millennials Gen X Baby Boomers 44% 37% 34% MEETING REPAYMENTS Millennials Gen X Baby Boomers 39% 36% 35% GETTING LOAN APPROVAL Millennials Gen X Baby Boomers 41% 36% 37% CERTAINTY OF EMPLOYMENT Millennials Gen X Baby Boomers 41% 40% 42% * Based on large or huge impediment responses
  • 28. 28 | Perceptions of Housing Affordability Report 2017 © Copyright 2017 | RP Data Pty Ltd trading as CoreLogic Asia Pacific (CoreLogic) and its licensors are the sole and exclusive owners of all rights, title and interest (including intellectual property rights) subsisting in this publication including any data, analytics, statistics and other information. All rights reserved.  FOREIGN BUYERS IN THE MARKET Millennials Gen X Baby Boomers 35% 45% 48% only 17% believe they are a huge impediment 26% believe they are a huge impediment 31% believe they are a huge impediment INVESTORS IN THE MARKET Millennials Gen X Baby Boomers 34% 37% 40% PAYING LENDERS MORTGAGE INSURANCE Millennials Gen X Baby Boomers 31% 31% 34% but an additional 35% found it a moderate impediment while 36% found it no impediment at all STAMP DUTY Millennials Gen X Baby Boomers 36% 48% 49% only 13% believe it is huge impediment 23% believe it is a huge impediment 29% believe it is a huge impediment HAVING THE DEPOSIT Millennials Gen X Baby Boomers 49% 45% 37% NEGATIVE GEARING Millennials Gen X Baby Boomers 28% 32% 30% IMPEDIMENTS TO HOUSING AFFORDABILITY (continued) *Based on large or huge impediment responses
  • 29. Perceptions of Housing Affordability Report 2017 | 29 © Copyright 2017 | RP Data Pty Ltd trading as CoreLogic Asia Pacific (CoreLogic) and its licensors are the sole and exclusive owners of all rights, title and interest (including intellectual property rights) subsisting in this publication including any data, analytics, statistics and other information. All rights reserved. Selection factors and concessions to enable home ownership Price was the most important factor across the generations when selecting where to buy although it was most important to Baby Boomers (83%) compared with Millennials (75%). Proximity to work was the second most important category with 52% of Millennials prioritising this, compared with 44% of Gen X and 37% of Baby Boomers. The third most important factor when selecting where to buy was distance to the city, which was important to 40% of Gen X, 38% of Millennials and 33% of Baby Boomers. Public transport to and from work was important to 43% of Gen X and 42% of Millennials, but just 32% of Baby Boomers. In comparison, Baby Boomers felt that being near infrastructure such as hospitals was more important (49%) and having good public transport to the city (44%) was important. To achieve the dream of ownership, 46% of Millennials who currently rent are prepared to dedicate between 30-50% of their gross household income to servicing a mortgage. This compares with 42% of Gen X and 36% of Baby Boomers. Millennials are also more likely to consider buying a property with family or friends with 24% saying they would consider this compared with just 13% of Gen X and 12% of Baby Boomers. Baby Boomers meantime are more likely to consider moving to a regional town to purchase a property (30%) in comparison to 21% of Millennials and 22% of Gen X. Millennials however will consider moving to a less desirable suburb with 25% prepared to make this concession compared with just 17% of Baby Boomers. Millennials who rent or lease are significantly more likely to consider an investment property than other generations with 51% stating they would definitely (20%) or possibly (31%) buy something they would not personally live in first compared with just 33% of Gen X (8% definitely) and 24% of Baby Boomers (5% definitely).
  • 30. 30 | Perceptions of Housing Affordability Report 2017 © Copyright 2017 | RP Data Pty Ltd trading as CoreLogic Asia Pacific (CoreLogic) and its licensors are the sole and exclusive owners of all rights, title and interest (including intellectual property rights) subsisting in this publication including any data, analytics, statistics and other information. All rights reserved.  8 RBA 13 April 2017 Affordability and payment stress With raising the deposit identified as one of the biggest hurdles for Millennials, it is probably not surprising that this generation is most likely to seek help from a family member, with 21% saying they would approach parents. This compares with 17% for Gen X and just 9% for Baby Boomers. Gen X (32%) were most likely to find an inheritance a help to buying, compared with 22% of Millennials and 27% of Baby Boomers. Across the generations, the maximum deposit that could be paid by those who are currently renting is between 0-9% with 29% of Millennials saying this is affordable, 43% of Gen X and 43% of Baby Boomers. This compares with 27% of Millennials who state they could raise between 10-19% as a deposit as do 28% of Gen X and 14% of Baby Boomers. Only 12% of Millennials, 11% of Gen X and 10% of Baby Boomers who are renting say they could afford between 20-29% as a deposit. The findings of the report support recent Reserve Bank of Australia figures8 that identified mortgage stress amongst those who already own property and confirms that the younger generation is the most vulnerable. Baby Boomers (10%) are most likely to already be struggling to pay their existing mortgage, followed by 8% for Millennials and 6% for Gen X. However Millennials overtake considerably once future interest rate rises of up to 1% are taken into account with 35% of Millennials claiming this would make them struggle, compared with 23% of Gen X and 27% of Baby Boomers. Should interest rates increase between 1.5% and 2.0%, the research shows a total of 66% of Millennials struggling to pay, compared with a total of 47% of Gen X and 48% of Baby Boomers. Best strategies for improving housing affordability Millennials are the most likely (68%) to believe that a well-paying and secure job is the greatest help when buying a first home compared with 58% of Gen X and 49% of Baby Boomers. Baby Boomers it seems dislike stamp duty more than any generation and believe it is an impediment. The research shows 80% of Baby Boomers said the reduction or removal of stamp duty for first home buyers would be helpful compared with 69% of Millennials - arguably those who would be most affected by any change - and 71% of Gen X. Baby Boomers are also more likely than other generations to feel that a reduction in the number of migrants to Australia would be an effective strategy (56%) to improve housing affordability compared with 51% of Gen X and 47% of Millennials. Millenninals are most likely to believe that the appointment of a federal housing minister responsible for addressing housing affordability issues nationally could be effective with 61% of respondents claiming it would be valuable compared with 56% of Gen X and 53% of Baby Boomers. REDUCING OR REMOVING STAMP DUTY WOULD BE AN EFFECTIVE STRATEGY: Millennials Gen X Baby Boomers 69% 71% 80%
  • 31. Perceptions of Housing Affordability Report 2017 | 31 © Copyright 2017 | RP Data Pty Ltd trading as CoreLogic Asia Pacific (CoreLogic) and its licensors are the sole and exclusive owners of all rights, title and interest (including intellectual property rights) subsisting in this publication including any data, analytics, statistics and other information. All rights reserved. When property owners feel constrained in their decision to sell their property, supply starts to dwindle and the entire property market is affected. Research conducted by one of Australia’s largest real estate franchises, LJ Hooker, identified that insecurity about finding a new home and costs such as stamp duty are actively discouraging property owners from selling in the belief that the move to a new residence will not be worth the cost. The LJ Hooker research9 surveyed more than 2700 Australian property owners, 70% of whom had had their property appraised by an agent within 12 months of the survey – a sign that they were considering selling. However, of those who had a property appraised, 60% did not proceed and list their property for sale. The survey identified that a lack of choice and stock on the market which made it difficult to feel confident about finding a new home was the number one reason for not listing with 35% of respondents identifying this as a roadblock. Transactional costs involved in buying and selling were also blockers with 26% of respondents deciding not to list their property for sale because the cost of buying their next home was too high due to stamp duty. A further 18% stated that the cost of selling was too high, taking into consideration solicitor fees, conveyancer costs and real estate agents commissions. The LJ Hooker survey showed that changing government stamp duty laws could be a major stimulus to increasing listings. The survey found 51% of those who didn’t list after receiving an appraisal would do so if stamp duty was lower, while 61% said they would list if stamp duty was abolished altogether. For those who decided not to list, 57% said they would renovate their property instead of selling while 29% said they would hold on to the property for now and list at a later date and 14% said they would rent their property out. a. How listing anxiety is affecting housing affordability What do you plan to do with your property? 57% Will renovate property instead 29% Hold for now but will list in the future 14% Will rent property out 9 LJ Hooker 2017
  • 32. 32 | Perceptions of Housing Affordability Report 2017 © Copyright 2017 | RP Data Pty Ltd trading as CoreLogic Asia Pacific (CoreLogic) and its licensors are the sole and exclusive owners of all rights, title and interest (including intellectual property rights) subsisting in this publication including any data, analytics, statistics and other information. All rights reserved.  Families, children and housing affordability How different family groups compare: Within the survey, respondents were broken down into four styles of family. These included those families with children aged 0 to 4 living at home, those with children aged 5 to 17, those with families aged 18+ and those with no children living at home. The survey found that the age of the children living at home was likely to affect the behaviours and views of affordability, with those who had very small children more likely to both value the importance of affordable housing more highly, while at the same time finding it less affordable or struggling to pay mortgages. Within the survey, 57% of those with children aged 0 to 4 were current home owners, 60% had children 5 to 17, 56% had children aged 18+ and 44% had no children at home. The survey confirmed that families with young children are most likely to have mortgages with 50% of families with children aged between 0 to 4 owning their home with a mortgage and just 10% of families with children this age own their homes outright. A further 50% of families with children aged between 5 to 17 years have mortgages while 16% own their homes outright. The proportion of families with mortgages drops to just 38% by the time children reach 18, and outright ownership rises to 25%, while 24% of those who have no children at home have a mortgage and 20% own their home outright. From here on, this section of the report will focus on families with children at home with observations about those without children captured in the marital status section. Of those families who had very small children aged 0 to 4, 47% worked full time, compared with 52% of those with children aged 5 to 17 and 36% of those with children aged 18+. How important is home ownership? Families with children at home who do not own property are very likely to be concerned about being able to afford a home. Families who are currently renting and have children at home are insistent that being able to buy their own home is important. The younger the children, the more important this is regarded with 98% of families with children 0 to 4 stated it was important (71% very important), compared with 94% of families with children 5 to 17 (65% very important) and 90% importance for those with children 18+ (57% very important). Concern about housing affordability The younger the children, the greater the concern from families that they may not be able to afford to upgrade their property. The survey found 84% of families with children aged 0 to 4 who own property currently are concerned to some degree that they will not be able to afford to upgrade with 31% very concerned. This compares with 79% of families with children aged 5 to 17 who own property who expressed concern about upgrading (with 23% of this bracket stating they were very concerned). By the time children are 18+, the fear eases with 67% of families who own their own home and have older children stating they had some concerns, but only 16% said they were very concerned. Nevertheless, the older the children at home, the gloomier the different family groups are likely to be about the direction of housing affordability. The survey found that while 28% of families with children aged 0 to 4 felt that housing affordability was very much or significantly worse now compared with last year (with an additional 27% believing it was slightly worse), 36% of those with children aged 5 to 17 felt this was the case (with an additional 26% stating it was slightly worse) and 35% of families with children aged over 18 believing it was significantly or very much worse (with 33% stating slightly worse). The sentiment is very similar for the direction 07.
  • 33. Perceptions of Housing Affordability Report 2017 | 33 © Copyright 2017 | RP Data Pty Ltd trading as CoreLogic Asia Pacific (CoreLogic) and its licensors are the sole and exclusive owners of all rights, title and interest (including intellectual property rights) subsisting in this publication including any data, analytics, statistics and other information. All rights reserved. of housing affordability next year with 26% of families with children aged 0 to 4 feeling it would be significantly or very much worse, while 35% of both families with children 5 to 17 and 18+ both felt this way. What are the obstacles to housing affordability? The obstacles to housing affordability are perceived somewhat differently across families with children of different ages, especially across the headline issues of stamp duty and saving for a deposit. For those with children aged 0 to 4 years, the biggest impediments to home ownership are saving for a deposit, followed by the cost of stamp duty and interest rates. Families with slightly older children were most likely to find stamp duty the biggest impediment, followed by saving for the deposit and then certainty of employment. Finally, those with children over 18 were most likely to find stamp duty and foreign buyers the biggest impediments, followed by certainty of employment and then a mix of factors, including saving for a deposit, interest rates and meeting repayments.
  • 34. 34 | Perceptions of Housing Affordability Report 2017 © Copyright 2017 | RP Data Pty Ltd trading as CoreLogic Asia Pacific (CoreLogic) and its licensors are the sole and exclusive owners of all rights, title and interest (including intellectual property rights) subsisting in this publication including any data, analytics, statistics and other information. All rights reserved.  STAMP DUTY Families with children aged 0 - 4 Families with children aged 5 - 17 Families with children aged over 18 48% 46% 44% INTEREST RATES Families with children aged 0 - 4 Families with children aged 5 - 17 Families with children aged over 18 41% 38% 35% MEETING REPAYMENTS Families with children aged 0 - 4 Families with children aged 5 - 17 Families with children aged over 18 37% 35% 35% FOREIGN BUYERS Families with children aged 0 - 4 Families with children aged 5 - 17 Families with children aged over 18 35% 43% 44% GETTING LOAN APPROVAL Families with children aged 0 - 4 Families with children aged 5 - 17 Families with children aged over 18 40% 35% 32% CERTAINTY OF EMPLOYMENT Families with children aged 0 - 4 Families with children aged 5 - 17 Families with children aged over 18 38% 39% 41% HAVING THE DEPOSIT Families with children aged 0 - 4 Families with children aged 5 - 17 Families with children aged over 18 51% 43% 35% INVESTORS IN THE MARKET Families with children aged 0 - 4 Families with children aged 5 - 17 Families with children aged over 18 34% 35% 34% LENDERS MORTGAGE INSURANCE Families with children aged 0 - 4 Families with children aged 5 - 17 Families with children aged over 18 36% 33% 31% although an additional 30% identified it as a moderate impediment an additional 27% identified it as a moderate impediment only 24% identified it as a moderate impediment IMPEDIMENTS TO HOUSING AFFORDABILITY – FAMILIES* *Based on large or huge impediment responses
  • 35. Perceptions of Housing Affordability Report 2017 | 35 © Copyright 2017 | RP Data Pty Ltd trading as CoreLogic Asia Pacific (CoreLogic) and its licensors are the sole and exclusive owners of all rights, title and interest (including intellectual property rights) subsisting in this publication including any data, analytics, statistics and other information. All rights reserved. Selection factors and concessions to enable home ownership While price is the number one factor that dictates how families with children will select a property, there was no significant statistical differences between the age groups of children that provided any specific insights. When selecting where to buy, proximity to schools was the number one priority for 58% of families with children 0 to 4 and 50% of those with children aged 5 to 17. The second priority was proximity to work with 48% of families with very young children ranking this second, compared with 42% each for both families with children aged 5 to 17 and 18+. When selecting where to buy, families with children 18+ were more likely to rank good public transport to and from the city centre or shopping as a priority (44%) than the other family styles, while good public transport to and from work was identified as important for 39% of families with babies and 40% families with children aged 5 to 17. Families with small children 0 to 4 are much more likely to make the concession of buying an affordable property that does not meet all their criteria (54%) compared with those with children 18+ (21%). Families with children are also more likely to buy a property further from their workplace or other amenities (33% for 0 to 4 and 32% for 5 to 17) than those with children 18+ where only 21% would consider this concession. Affordability and payment stress The survey indicates that the cost of raising children makes families the most open to receiving support for the upfront costs of buying a home. Families with very young children 0 to 4 who are currently renting are most likely to require help of some kind to buy their first home with 52% stating government assistance would be helpful and 23% stating financial assistance from a family member for the deposit was required. An additional 20% also said help from family to make mortgage payments was required. This compares with 45% of families with children aged 5 to 17 who were renting who felt government assistance was necessary and 17% who wanted family deposit assistance. Only 10% of families with children in this bracket thought ongoing help with mortgage payments was needed. Finding the deposit is also difficult for those with younger families with 41% of those renting with children aged 0 to 4 stating they could only raise between 0-9% for a deposit and 40% of those with children aged 5 to 17. This compares with 34% of renting families with children 18+ who could raise a deposit between 0-9%. Nevertheless, once a home has been purchased, families with small children 0 to 4 who are renting are willing to make strong commitments to mortgages. While this group displayed the strongest preference of all family types to want to dedicate 30% or less to their mortgage (32%) this bracket is also most likely to be willing to dedicate between 30 to 49% with half the respondents believing this could be necessary. That compares with 39% of families with children 5 to 17 who believe paying 30 to 49% of income is possible. Families with children are the least likely to be suffering from mortgage stress with 8% of those with children 0 to 4 stating they were having difficulty paying their mortgage now, compared with 5% for children 5 to 17 and just 3% for those with children 18+. However those with very young children are most susceptible to interest rate increases with 28% of those with children 0 to 4 stating they would struggle with interest rate increases of between 0-1% and a further 35% stating they would struggle with interest rate increases between 1.5 and 2%.
  • 36. 36 | Perceptions of Housing Affordability Report 2017 © Copyright 2017 | RP Data Pty Ltd trading as CoreLogic Asia Pacific (CoreLogic) and its licensors are the sole and exclusive owners of all rights, title and interest (including intellectual property rights) subsisting in this publication including any data, analytics, statistics and other information. All rights reserved.  This compares with 22% of those with children 5 to 17 who would struggle with 0-1% and 29% who would struggle with increases of 1.5-2% and 17% of those with children over 18 who would struggle with 0-1% and 26% who would struggle with increases of 1.5% to 2%. This means that an increase of between 1.5% and 2% in interest rates would cause 63% of families with children 0 to 4 to struggle to make mortgage payments and 51% of families with children 5 to 17. For those with children 18+, an increase of between 1.5% and 2% in interest rates would cause 43% to suffer hardship. Best strategies for improving affordability Stamp duty was the number one priority that families with children felt should be removed to improve housing affordability. The survey shows 74% of families with children 0 to 4 felt reducing or removing stamp duty would be helpful, while 72% of those with children aged 5 to 17 felt it would assist. However 82% of those with children at home aged 18+ felt it would improve housing affordability with 52% of these believing it would be very helpful. The numbers were similarly weighted when asked whether reducing or removing stamp duty for first home buyers would help. Again, those with older children were most likely to believe this to be valuable with 79% of those with children aged 18+ stating it would be helpful (51% said very helpful), 72% of those with children aged 0 to 4 and 69% of those with children aged 5 to 17 believing the measure would assist. The older the children, the more families were likely to think government concessions were an appropriate response with 70% of those with children aged 0 to 4, 71% of those with children 5 to 17 and 80% of those with children 18+ living at home believing first home buyer grants would assist affordability.
  • 37. Perceptions of Housing Affordability Report 2017 | 37 © Copyright 2017 | RP Data Pty Ltd trading as CoreLogic Asia Pacific (CoreLogic) and its licensors are the sole and exclusive owners of all rights, title and interest (including intellectual property rights) subsisting in this publication including any data, analytics, statistics and other information. All rights reserved.
  • 38. 38 | Perceptions of Housing Affordability Report 2017 © Copyright 2017 | RP Data Pty Ltd trading as CoreLogic Asia Pacific (CoreLogic) and its licensors are the sole and exclusive owners of all rights, title and interest (including intellectual property rights) subsisting in this publication including any data, analytics, statistics and other information. All rights reserved.  a. When will the kids leave home? “When are you going to move out, kid?” is a cry heard across the living rooms of Australia as parents ask their older teens - and increasingly children in their 20s and 30s according to the data – when they can expect an end to the cleaning, cooking, laundry and fighting for the remote with adult children. The majority of Australians (62%) living with their parents say that they cannot afford to move out of the family home with 32% saying living with parents keeps their expenses low, and 20% admitting that it is “too comfortable at home”. While 27% are saving towards a home deposit and 29% are still on education courses and have yet to think about leaving home, over 20% of Australians still living with their parents (21%) expect to move out after they turn 30. Of those who live at home, only 4% owned an investment property. Of those who live with parents, 28% of Millennials say they are saving money towards a deposit, compared with 19% of Gen X and 25% of Baby Boomers. In addition, 35% of Millennials said educational courses and study costs were the reason they lived at home with their parents. Across the generations, most live at home because they claim they cannot afford to move out. This is the case for 62% of Millennials, 60% of Gen X and 75% of Baby Boomers who live with parents. Baby Boomers were also overwhelmingly the most likely to be living at home because they were “too comfortable to move out” with 75% of those living at home stating this reason. Millennials (45%) state they will move out of the family home between the ages of 25-29. This compares with 48% of Baby Boomers still living at home who say they do not intend to move out at all, indicating their decision to live with parents may not be due to affordability issues. Families with children at home who live with their parents are likely to be saving for a deposit with 40% of those with children 0 to 4 stating this, in comparison to 32% of those with children 5 to 17 and just 22% of those with children 18+. However, families with children 5 to 17 and 18+ are likely to be living with parents due to cost restraints created by further study with 45% of those with children 5 to 17 and 44% of those with children 18+ still undertaking educational courses. Surprisingly, a higher wage makes little difference in the perception of being able to afford to move out of the parental home with similar percentages across all wage levels. The survey shows 65% of those earning less than $40K said they could not afford to move out compared with 67% for $40-$90K, 61% for $90-$130K and 63% for those earning $130K plus. Those earning less than $40K were however more likely to be honest about why they lived at home, with 33% claiming they were “too comfortable” to move out, compared with 17- 20% of those on higher wages. Queenslanders (38%) and ACT residents (32%) are more likely to move out of the family home before the age of 25, while across the states moving out of home before the age of 35 seems to have become the When will they move out? (Australians 18 years or older still living at home) 21% 38% 19% 3% 19% atleast30 yearsofage between25-29 yearsofage between 20-29 yearsofage don’tknow between18-19years ofage
  • 39. Perceptions of Housing Affordability Report 2017 | 39 © Copyright 2017 | RP Data Pty Ltd trading as CoreLogic Asia Pacific (CoreLogic) and its licensors are the sole and exclusive owners of all rights, title and interest (including intellectual property rights) subsisting in this publication including any data, analytics, statistics and other information. All rights reserved. new norm. The research shows that 77% of those living at home in SA/NT will move out before 35, with 75% in Queensland, 71% in NSW and 69% in Victoria. Tasmanians are the least decided about when they will move out with 46% declaring they ‘did not know’ in comparison to numbers around 15% in most other states. Queenslanders are also more likely to rent before they buy (61%) compared with 40% for ACT, 41% for Victorians and 38% for NSW residents living with parents. Equally, SA/ NT residents living at home (53%) and NSW (31%) believe they will live at home until they find somewhere to buy. SA and NT residents living at home are the least adventurous of the states with none identifying that they would stay at home to save for overseas travel, compared with 10% for NSW and 11% for WA residents. Singles (41%) are more likely to want to move out of the family home and are willing to rent first, compared with married or defacto couples (34%), while couples are more comfortable living at home until they buy (42%) compared with 28% of singles.
  • 40. 40 | Perceptions of Housing Affordability Report 2017 © Copyright 2017 | RP Data Pty Ltd trading as CoreLogic Asia Pacific (CoreLogic) and its licensors are the sole and exclusive owners of all rights, title and interest (including intellectual property rights) subsisting in this publication including any data, analytics, statistics and other information. All rights reserved.  Housing affordability, wages and employment How incomes and employment status compare: Within the survey, respondents were broken down into four income groups; those in households where income was under $40K, those where household incomes were $40- $90K, those whose incomes were between $90-$130K and those who had household incomes over $130K. Those with incomes under $40K (55%) are most likely to rent while those on incomes over $90K are most likely to own their own home and have mortgages. In the survey, those with incomes less than $40K were least likely to work full time (10%) and most likely to not work at all (62%), while 50% of those earning between $40K-$90K worked full time, and 64% of those earning $90-$130K worked full time. Of those earning $130K+, 67% worked full time. How important is home ownership? Work status is a significant indicator of importance when it comes to attitudes towards home ownership. Of those who work full time and who rent or live with parents, 92% stated being able to buy their own home was important, with 59% stating it was very important. Home ownership increases with household income. In household incomes under $40K, 30% own their own homes, increasing to 65% among household income $90K-$130K up to 71% among households with $130K household income. Just 30% of Australians with household income of less than $40K a year own their own home with 19% owning it outright and 11% paying off a mortgage. This compares with 52% of people with income between $40K-$90K and 65% of those earning between $90K-$130K. Home ownership for those with income over $130K is 71%. A higher household income however, is an indicator of a mortgage with 52% of those earning over $130K paying off a home, while 49% of those earning between $90K-$130K are paying it off. The higher the income, the greater the importance of owning a home to those who are renting or living with family with 94% of those earning $130K+ believing home ownership is important compared with 90% for $90-130K, 89% for $40-$90K and 86% for under $40K. Concern about housing affordability The survey shows that concern about housing affordability is fairly similar across the different income brackets with nearly two- thirds across each category believing housing affordability is worse in some way now compared with last year. Of those earning less than $40K, 58% feel affordability is worse in some way (including 39% significantly or very much worse) than last year while 60% of those earning between $40-$90K (34% significantly or very much worse) and 67% of those earning between $90-$130K agree (with 33% believing it is significantly or very much worse). Of those with incomes $130K or higher, 65% believe it is now worse in some way with 35% believing affordability is now significantly or very much worse. Fairly similar numbers believe that affordability will be worse next year. A total of 08. Who owns property? 30% 49% 65% 71% Household incomesunder $40k-$90k Household incomeunder $90k-$130k Household incomeover $130k Household incomeunder $40k
  • 41. Perceptions of Housing Affordability Report 2017 | 41 © Copyright 2017 | RP Data Pty Ltd trading as CoreLogic Asia Pacific (CoreLogic) and its licensors are the sole and exclusive owners of all rights, title and interest (including intellectual property rights) subsisting in this publication including any data, analytics, statistics and other information. All rights reserved. 54% of those earning less than $40K believe housing affordability will be worse in some way next year, compared with 61% of those earning $40-$90K, 62% of those earning $90- $130K and 59% of those earning $130K+. What are the obstacles to housing affordability? Perhaps unsurprisingly, employment status is a strong dictator of the level of concern Australians have about obstacles to housing affordability. While only a third of those working full time felt that employment certainty and meeting repayments were impediments, those who worked part time or not at all found them to be larger issues. The survey found that 47% of those working part time, and 46% of those not working believed employment certainty was a large or huge impediment to affordability, while meeting repayments was an issue for 41% of those who work part time and 43% of those not working. For those on incomes less than $40K, the biggest impediments to housing affordability were having the deposit and getting loan approval with 56% of respondents nominating each of these issues, followed by certainty of employment (51%) and meeting repayments (49%). For those on incomes between $40K-$90K, the biggest impediments were having the deposit (48%) and paying stamp duty (43%), followed by certainty of employment (42%). At the higher end, the impediments identified by those earning between $90K-$130K were foreign buyers in the market (42%) followed equally by the cost of stamp duty and having the deposit (39%) and finally certainty of employment (34%). For top income earners over $130K, the impediments were perceived equally as foreign buyers and stamp duty (46%) followed by having the deposit (36%) and certainty of employment (34%).
  • 42. 42 | Perceptions of Housing Affordability Report 2017 © Copyright 2017 | RP Data Pty Ltd trading as CoreLogic Asia Pacific (CoreLogic) and its licensors are the sole and exclusive owners of all rights, title and interest (including intellectual property rights) subsisting in this publication including any data, analytics, statistics and other information. All rights reserved.  Interest rates as a housing affordability impediment* 45% 41% 32% 30% Lessthan $40k $40k to$90k $90k to$130k $130k+ Meeting repayments as a housing affordability impediment* 49% 41% 26% 27% Getting loan approval as a housing affordability impediment* 56% 40% 30% 26% Certainty of Employment as a housing affordability impediment* 51% 42% 34% 34% Lessthan $40k $40k to$90k $90k to$130k $130k+ Foreign buyers as a housing affordability impediment* 43% 40% 42% 46% Lessthan $40k $40k to$90k $90k to$130k $130k+ Stamp duty as a housing affordability impediment* 47% 43% 39% 46% Lessthan $40k $40k to$90k $90k to$130k $130k+ Lessthan $40k $40k to$90k $90k to $130k $130k+ Lessthan $40k $40k to$90k $90k to $130k $130k+ Having the deposit as a housing affordability impediment* 56% 48% 39% 36% Lessthan $40k $40k to$90k $90k to$130k $130k+ *Large or huge impediment Obstacles by level of income
  • 43. Perceptions of Housing Affordability Report 2017 | 43 © Copyright 2017 | RP Data Pty Ltd trading as CoreLogic Asia Pacific (CoreLogic) and its licensors are the sole and exclusive owners of all rights, title and interest (including intellectual property rights) subsisting in this publication including any data, analytics, statistics and other information. All rights reserved. Selection factors and concessions to enable home ownership Moving further away from work is one of the least desirable options for those earning under $40K as an option to make housing more affordable with just 19% saying they would consider it, compared with 30% for those earning $40K-$90K and $130K+ and 33% for $90K to $130K. The higher the household income, the greater the importance of being close to the city and employment. The survey found 54% of those earning $130K+ felt that proximity to work was important, compared with just 30% of those earning less than $40K. In addition, 50% of those earning above $130K said proximity to the city was an important factor, compared with 35% of those earning less than $40K. The higher the wage, the less likely the belief government assistance was necessary to help renters buy their first home with just 33% of renters with salaries over $130K believing government assistance was required, compared with 42% of those with salaries under $40K. However, those renting on higher salaries of $130K plus were more likely to expect parental assistance, either through an inheritance or their parents buying them a house (34%) compared with 26% of those earning under $40K. The higher the income, the more likely that those who currently rent will consider purchasing an investment property as a first step with 50% of those earning $130K+ considering this as an option (15% definitely) which scaled down to 32% of those earning less than $40K (11% definitely). Affordability and payment stress The lower the income, the more likely homeowners are to suffer from mortgage stress. The survey shows 35% of those earning less than $40K are currently struggling with their interest payments, in comparison to just 6% for those earning between $40K up to $130K and just 5% for those earning over $130K. Low earners are also therefore most at risk of interest rate rises with more than half (51%) stating they would struggle with interest rate rises between 0-1% compared with 19% for those earning $130K+. Should interest rates rise up to 2%, the survey indicates that 77% of low income earners would have gone into mortgage shock, with 61% of those earning $40K-$90K struggling to make repayments. Higher income brackets fare less badly with 49% of those earning $90K-$130K having difficulty and 44% of those earning $130K+ struggling. Of those who work full time and rent, the largest proportion (34%) are able to raise a deposit of between 0-9% with 27% able to raise a deposit of between 10-19%. Best strategies for improving affordability Removing or reducing stamp duty is the best strategy for addressing housing affordability according to the nearly two thirds of residents at all salary levels with 71% of those earning less than $40K believing this would assist, compared with 75% of those earning $40K-$90K, 71% of those earning $90K-$130K and 74% of those earning $130+. Government grants for first home buyers are also favoured by this category – although support wanes slightly with higher salaries - with 73% of those earning less than $40K favouring this strategy, compared with 76% for those earning $40-$90K, 69% of those earning $90K-$130K and 67% of those earning $130K+. Creating more jobs in areas that have lower priced housing is also seen as worth pursuing for 68% of those earning less than $40K, 67% of those earning $40K-$90K but only 61% of those earning $90K-$130K. The initiative is supported by 64% of those earning $130K+.
  • 44. 44 | Perceptions of Housing Affordability Report 2017 © Copyright 2017 | RP Data Pty Ltd trading as CoreLogic Asia Pacific (CoreLogic) and its licensors are the sole and exclusive owners of all rights, title and interest (including intellectual property rights) subsisting in this publication including any data, analytics, statistics and other information. All rights reserved.  Despite their lower prices compared with houses, the data shows that apartments are still significantly more expensive and harder to afford than 15 years ago. The price to income ratio of apartment ownership is currently 6.6x income for units now compared with 4.8x 15 years ago. The new survey shows however that despite the generally cheaper price point of apartments when compared with houses, apartment dwellers are even more sensitive to the impediments of ownership than those who live in houses, are more likely to perceive impediments to ownership, are gloomier about affordability changing for the better and are more concerned about their next move. This is possibly why fewer renters who live in apartments see home ownership as important as those who live in houses - 91% of those who rented a house stated home ownership is important (57% very important) in comparison to 86% of those renting apartments (50% very important). The research identifies that raising the deposit is one of the biggest impediments to apartment dwellers with 52% stating it a large impediment to ownership, compared with 42% of those who live in houses. Apartment dwellers are also most likely to feel that foreign buyers are an impediment to affordability with 50% feeling this is a factor, compared with 41% of people who live in houses. Other concerns held by apartment dwellers ahead of those who live in houses are worries about investors in the market being an impediment to affordability with 45% of apartment dwellers concerned compared with 34% of those who live in houses, and the belief that negative gearing benefits are an issue with 37% of those who live in apartments rating it as a concern compared with 28% of those who live in houses. Meeting repayments are also concerns for a greater proportion of apartment dwellers with 42% stating interest rates are a large or huge impediment to housing affordability. This compares with 37% for those who live in a house. And while 34% of residents who live in houses believe that meeting repayments is an impediment to housing affordability, this number jumps to 47% of those who dwell in apartments. Equally, getting loan approval is also more of an impediment to those who live in apartments with 46% of apartment dwellings saying finance is an impediment, compared with 36% of those who live in houses. Apartment owners are also more anxious about their next move. While 76% of property owners are concerned to some extent about being able to afford what they want and need for their next home move, this number jumps to 88% of apartment owners. The research shows 41% of those who live in an apartment are very concerned that they might not be able to afford their next family home, compared with just 20% of house owners. This is possibly because those who live in apartments are more concerned about affordability with 43% claiming properties are less affordable now than they were a year ago, compared with 33% of those who live in houses. The research also shows that people who live in apartments have slightly different priorities to those who live in houses when it comes to property selection. While price was identified by 80% of those who lived in houses as the most important factor when deciding to buy, only 73% of apartment dwellers nominated price. Apartment residents were more likely to nominate distance to the city as an important factor (45%) compared with those who lived in houses (34%). People who rent an apartment are also less likely to believe government assistance could help them with just 34% believing the government should play a role, compared with 42% of those who rent houses. a. Is apartment ownership more realistic? The research confirms the overwhelming majority of Australians live in houses (72%) and while they are an increasing proportion in some states, apartment dwellers make up just 15% of the population. Add to that duplexes and townhouses and the number of people living in shared title accommodation is still small at 28%.
  • 45. Perceptions of Housing Affordability Report 2017 | 45 © Copyright 2017 | RP Data Pty Ltd trading as CoreLogic Asia Pacific (CoreLogic) and its licensors are the sole and exclusive owners of all rights, title and interest (including intellectual property rights) subsisting in this publication including any data, analytics, statistics and other information. All rights reserved.
  • 46. 46 | Perceptions of Housing Affordability Report 2017 © Copyright 2017 | RP Data Pty Ltd trading as CoreLogic Asia Pacific (CoreLogic) and its licensors are the sole and exclusive owners of all rights, title and interest (including intellectual property rights) subsisting in this publication including any data, analytics, statistics and other information. All rights reserved.  Owning a property – or more to the point, owning a mortgage - is a stress best shared, insights from the research reveal, with anxiety levels of singles significantly higher than those of couples across key decision points. Couples who own property are slightly less concerned about being able to afford their next home than singles with 74% of married or defacto couples concerned while 80% of singles are concerned. Meeting repayments is regarded as a large or huge impediment for 42% of singles, but just 33% of couples, while getting a loan is also more stressful done solo with 43% of singles stating it was a large or huge impediment compared with 34% of couples. Having a plus one to fall back on is also a reassurance with 39% of couples stating employment certainty was an impediment while 44% of singles sweat it out. Offence at government duties however are amplified for couples with 47% of married/defacto believing stamp duty is an impediment to housing affordability compared with 39% of singles. Singles are more likely to consider purchasing with family or friends (22%) compared with 13% of married or defacto couples and 36% of singles would consider moving into an apartment rather than a house, compared with 33% of couples. b. Home ownership: a team sport
  • 47. Perceptions of Housing Affordability Report 2017 | 47 © Copyright 2017 | RP Data Pty Ltd trading as CoreLogic Asia Pacific (CoreLogic) and its licensors are the sole and exclusive owners of all rights, title and interest (including intellectual property rights) subsisting in this publication including any data, analytics, statistics and other information. All rights reserved.
  • 48. 48 | Perceptions of Housing Affordability Report 2017 © Copyright 2017 | RP Data Pty Ltd trading as CoreLogic Asia Pacific (CoreLogic) and its licensors are the sole and exclusive owners of all rights, title and interest (including intellectual property rights) subsisting in this publication including any data, analytics, statistics and other information. All rights reserved.  Options to fix housing affordability Housing affordability cannot be fixed with a single action. Australian households have more than half their wealth tied up in the residential housing sector and about 70% of their debt is housing related.10 The desire to improve housing affordability needs to be balanced with the knowledge that a downturn in housing values would likely result in less household consumption and impact negatively on economic growth and Australian retirement assets and no solution can be implemented without careful economic and statistical modelling. Below is a summary of policy initiatives that are part of the debate: A COORDINATED APPROACH Residential real estate is Australia’s largest asset class worth an estimated $7.0 trillion – far outstripping superannuation at $2.2 trillion and listed stocks at $1.8 trillion11 . A coordinated and cooperative approach across different government levels and sectors is one of the greatest challenges to housing affordability. Options in this space include making housing policy a prominent and permanent part of the COAG (Council of Australian Governments) agenda and the appointment of a Federal Housing Minister who is tasked with formulating and executing a cross-jurisdictional housing strategy. These initiatives should be matched with a strategy that blends land release, zoning changes, infrastructure development and decentralising employment opportunities into areas where housing costs are substantially lower, and counterpart roles within state governments, as well as broader coordinated town planning strategies for major metropolitan areas. INCREASE SUPPLY Reduce or remove stamp duty Buyers pay stamp duty to state governments to cover the costs of property transfers. In Sydney and Melbourne, based on median sales prices these taxes regularly add close to $35K and more to the cost of buying a house. When property prices are over $1.5m - not an uncommon price for a house in inner city Sydney - stamp duty costs jump to $68K. This makes stamp duty a major up front barrier to buyers, especially when combined with the lump sum of saving for a deposit. It is also a deterrent to the decision to sell properties within inner city areas in particular, which affects housing supply, pushes up prices and detracts from the efficient transfer of housing stock across generations. Removing or reducing stamp duty addresses this barrier, however, it is a lucrative tax to state governments who benefit when either market volume is high, or property prices rise, and significant state budget shortfalls would be experienced without it. Release more land for housing State governments have the power to release additional land for housing which can increase supply of new dwellings. However, these are usually on urban fringes and require significant investment in infrastructure for roads, schools, shops and public transport. This must also be managed and requires coordination and funding from federal government as well as significant contributions from private sector developers who ultimately pass these costs on to consumers. Invest in transport infrastructure An underinvestment in efficient transport infrastructure projects relative to population growth can be one of the primary contributors to high dwelling values in certain areas because housing demand becomes focused within those areas that are in a convenient location relative to work and essential amenities. This is one of the reasons why growth rates are so disparate between the Australian capital cities and regional areas. Encourage more owner-occupier apartment development There are just over 152,600 units under construction across Australia12 – 85% more than the decade average and virtually double the 30 year average. With much of this stock being high rise units, and the majority being one and two bedrooms, this kind of housing 09. 10 RBA household finances – selected ratios (http://www.rba.gov.au/statistics/tables/xls/e02hist.xls?v=2017-04-26-20 to 41-28) 11 CoreLogic 2017 12 Australian Bureau of Statistics Building Activity December 16
  • 49. Perceptions of Housing Affordability Report 2017 | 49 © Copyright 2017 | RP Data Pty Ltd trading as CoreLogic Asia Pacific (CoreLogic) and its licensors are the sole and exclusive owners of all rights, title and interest (including intellectual property rights) subsisting in this publication including any data, analytics, statistics and other information. All rights reserved.
  • 50. 50 | Perceptions of Housing Affordability Report 2017 © Copyright 2017 | RP Data Pty Ltd trading as CoreLogic Asia Pacific (CoreLogic) and its licensors are the sole and exclusive owners of all rights, title and interest (including intellectual property rights) subsisting in this publication including any data, analytics, statistics and other information. All rights reserved.  development is more suited to investors and consequently rental markets rather than families. Zoning and planning laws are controlled by local government which can make it difficult for state and federal governments to affect change in this space with any kind of uniformity. Nevertheless, state governments can play a role through legislative frameworks to encourage development along, for example, growth corridors, while federal government can create tax incentives for developers to create more affordable and social housing. REDUCE DEMAND Change negative gearing policies to reduce investors in the market Investors have historically comprised of 33% to 40% of housing demand however the latest data from the Australian Bureau of Statistics shows investors comprised closer to 50% of new mortgage demand nationally.13 Actions that reduce the numbers of investors in the market need to be carefully managed as they affect the availability and therefore cost of rental accommodation. Additionally as the nation moves through an unprecedented ‘boom’ in apartment construction, investors play a critical role in absorbing new unit supply and ensuring off the plan sales transition smoothly to settlement. Discussion has focused around limiting negative gearing for new property purchases only. The latest Australian Taxation Office data14 show 9.7% of all tax payers incurred a net rental loss over the 2016 financial year and are therefore likely to be using a negative gearing strategy. While negative gearing is widely believed to be responsible for the influx of investors into the market, low interest rates, a 50% capital gains tax concession on properties held for at least 12 months, an uncertain stock market and the ability of self-managed superannuation funds to purchase property 13 Australian Bureau of Statistics Housing finance February 17 14 ATO 2015
  • 51. Perceptions of Housing Affordability Report 2017 | 51 © Copyright 2017 | RP Data Pty Ltd trading as CoreLogic Asia Pacific (CoreLogic) and its licensors are the sole and exclusive owners of all rights, title and interest (including intellectual property rights) subsisting in this publication including any data, analytics, statistics and other information. All rights reserved.